Attached files
| file | filename |
|---|---|
| 8-K - 8-K - DUKE REALTY CORP | d353894d8k.htm |
 RELIABLE. ANSWERS.
2012 UBS Industrial Real Estate Summit
May 16
Exhibit 99.1 |
 RELIABLE. ANSWERS.
2012 Duke Realty Corporation
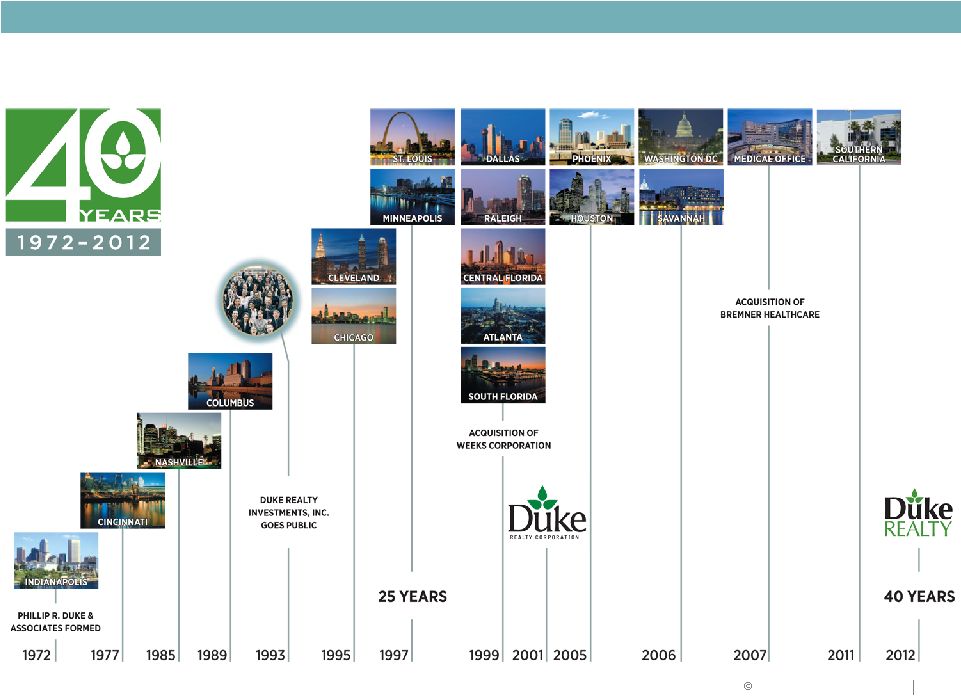
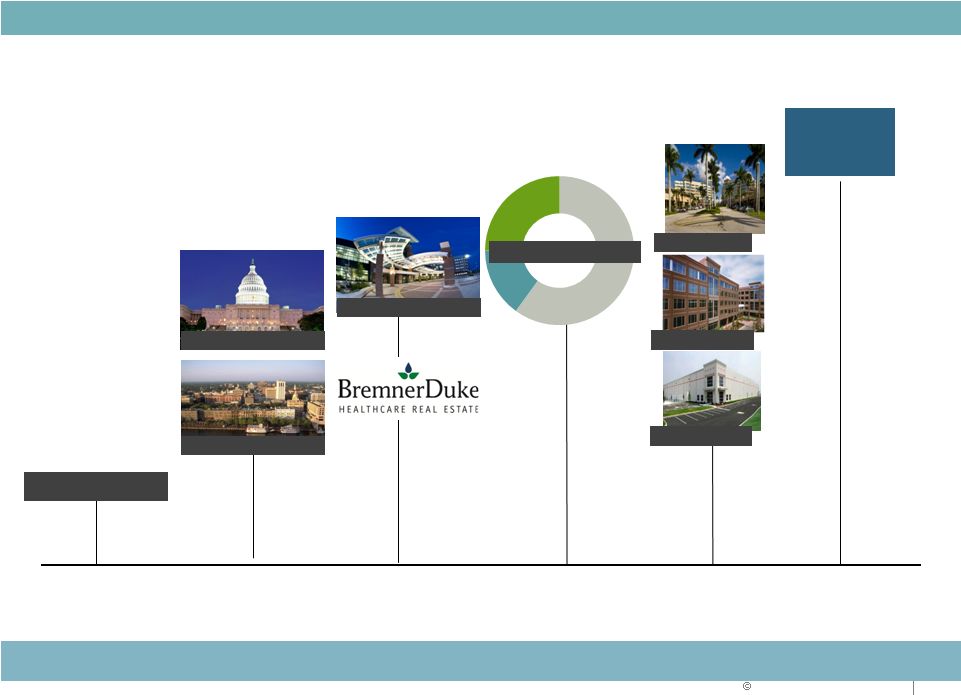
40 Years Timeline
2 |
 RELIABLE. ANSWERS.
2012 Duke Realty Corporation
3
2009
2010 and 2011
FOCUS:
Liquidity
More than $1.5 billion
capital raised
Strategy refined
FOCUS:
Strategy execution
Operating
fundamentals
Balance sheet
strength
FOCUS:
Asset quality
Cash flow growth
Shareholder return
Where we’ve been and where we’re going…
2012 and beyond |
 RELIABLE. ANSWERS.
2012 Duke Realty Corporation
Suburban Office Market Still Challenging
Economic and federal budget uncertainty limiting business investment and expansion
decisions Recovery is very slow, with Q1 overall vacancy declining to 12.7%,
down 50 bps from prior year, with class A only space vacancy declining 90
bps from prior year Absorption for 2011 at 35 million SF, with Q1 about same
pace with 10 million SF of absorption; supply ticking up, but at about
one-third of peak 2007/2008 levels Re-leasing capital expenditures
remain elevated Medical Office Traction Remains
Operators now making expansion decisions after two year pause
Relationships are a key driver of on campus MOB business
Demographics and economics positive growth drivers
Medical office development and acquisition activity continues
4
Market Outlook
Still challenging, but trends improving in all product types
Industrial Market Continues Slow Recovery
Net absorption in U.S. for Q1 positive for the 8th consecutive quarter, class A
vacancy at 10.7% Strong
demand
for
large,
modern
product
remains,
class
A
vacancy
down
240bps
over
prior
year
Rents beginning to improve, occupancy levels getting closer to equilibrium and
limited new supply ISM index has been slowly climbing after a moderate
trough in mid-2011 Manufacturing sector, wholesale trade and
transportation realizing a majority of recent job growth Source: PPR and
Duke Realty |
 RELIABLE. ANSWERS.
2012 Duke Realty Corporation
Industrial Sector Peer Set Drill Down
5
•
RMZ outperformed S&P 500 in 2011, but has lagged slightly below the S&P 500
in 2012
•
Industrial
Sector
Comps
have
rallied
recently
.
.
.
Improving
key
trading
metrics
and
relative valuations
•
Duke Realty has outperformed, although still undervalued by most levered and
NAV metrics to its Industrial Comps …
but improving
Better than comparative Peer set and Industrial Comps since 2010
Better than comparative Peer set, Industrial Comps and major indexes since
Blackstone disposition
•
Most Industrial Comps AFFO Growth from 2010 to 2012 estimates, are flat to
declining
.
.
.
Duke
Realty
steady
to
slightly
positive
although
we
are
repositioning
and de-levering
•
Duke
Realty
dividend
yield
higher
than
Industrial
Comp
set
average
…
4.8%
versus
3.5% average
Industrial Sector Outperforming Sector YTD | Duke Outperforming
Peers |
 RELIABLE. ANSWERS.
2012 Duke Realty Corporation
Focus on:
Increasing cash flow
Maximizing return on
assets
6
Strategy for Success
Focus on:
Improving coverage ratios
Improving ratings
Focus on:
Portfolio repositioning
Strategic acquisitions &
dispositions
Development opportunities
Strategies for delivering shareholder value |
 RELIABLE. ANSWERS.
2012 Duke Realty Corporation
Strategic Focus
2012 Goals and Objectives
Q1 2012 Update
•
Lease-up portfolio, manage cap ex; reach
positive same property income growth
•
Balance execution with capital strategy relative
to level and quality of cash flow and same
property NOI
•
Development starts of $150 to $250 million
focus on medical office and build-to-suit
•
Total portfolio occupancy as of quarter end 92.1%, up 1.4% from
year-end; industrial portfolio at 93.6%; medical office at 90.1%
•
Approximately 8.7 million square feet of leases completed
•
Debt to EBITDA @ 6.6x (7.38x excl. Blackstone); 4.7% Same
Property NOI growth
•
$120.8MM development starts. Two 100% leased bulk industrial
projects (at 6.9% stabilized yield) and one 100% leased medical
office (at 7.4% stabilized yield)
•
Continue strong momentum from 2011 on
repositioning of portfolio
•
Pursue acquisitions of medical and industrial
assets
•
Continue pruning suburban office primarily in
Midwest
•
Closed on over $157MM of acquisitions during the quarter,
weighted 45% in medical office and 55% in industrial
•
$63.7MM in dispositions of non-core assets
•
Opportunistically access capital markets . . .
push out maturity schedule further
•
Continue improving coverage ratios
•
Maintain minimal balance on line of credit
•
Fixed charge ratio of 1.81x
•
Issued $150MM of equity through ATM program
•
Redeemed Series M Preferred shares of $168MM
•
Zero credit facility balance and $15MM of cash at quarter end
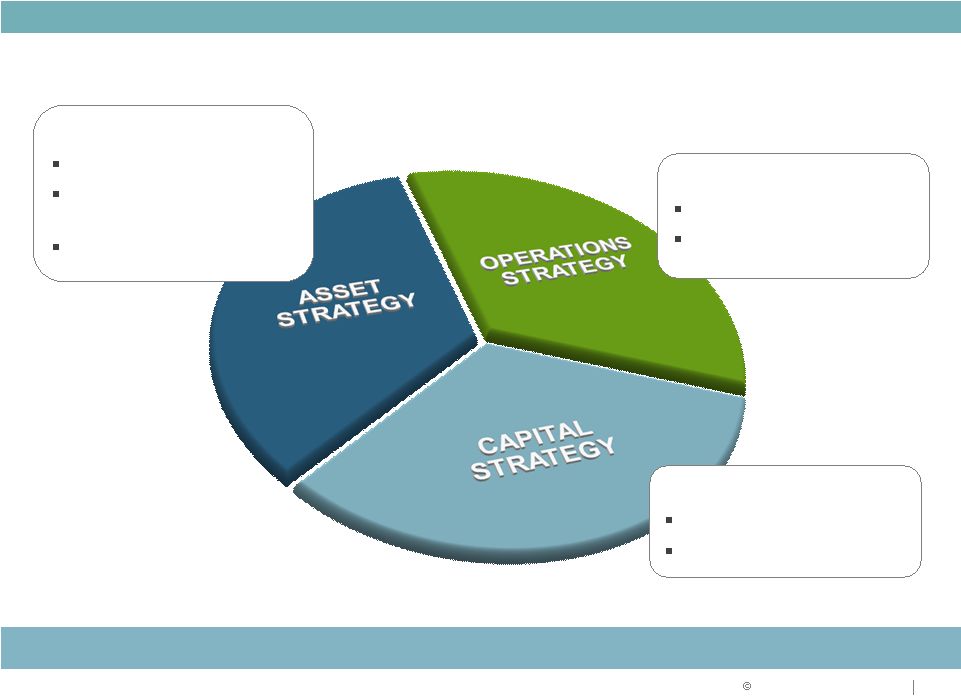
Asset
Strategy
Operations
Strategy
Capital
Strategy
7
Solid
Q1
start
and
executing
across
all
three
aspects
of
our
strategy |
 2012 Duke Realty Corporation
OPERATIONS STRATEGY
8 |
 9
Focus on Fundamentals
LEASING OF
PORTFOLIO
STRATEGIC
NEW DEVELOPMENT
AND LAND DISPOSITION
AFFO PAYOUT
OPERATIONS STRATEGY
Maximize return on assets
2012 Duke Realty Corporation |
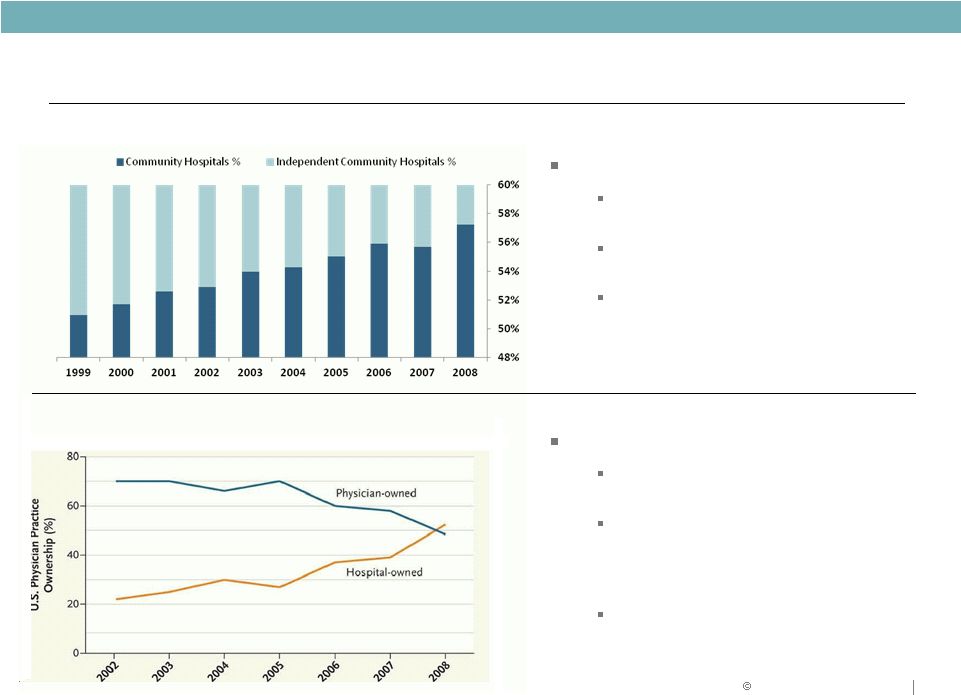
 2012 Duke Realty Corporation
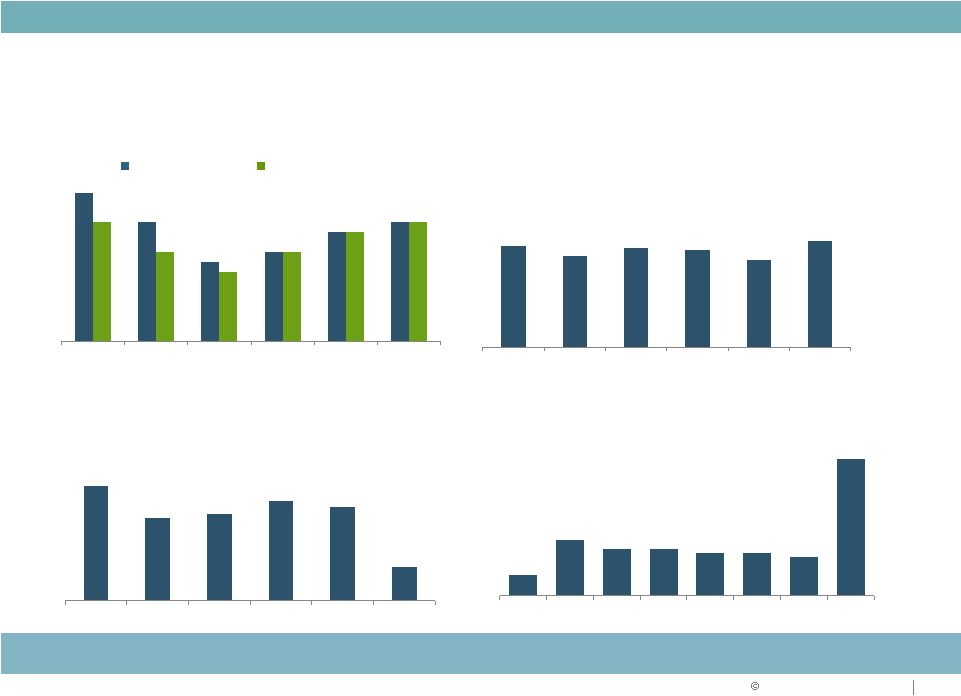
Consistent Operating Performance
Stabilized Occupancy (%)
Strong
historical
stabilized
occupancy
–
fundamentals
improving
Lease Renewals (%)
Strong lease renewal percentages
Stabilized occupancy
In-service occupancy
Leasing Activity
New
Leases
and
Renewals
–
Consistent
Execution
(in
millions
of
square feet)
Lease Maturity Schedule
Lease maturities are well balanced with no one year accounting for
more than 12%
Demonstrated ability to
maintain consistency through economic cycles
95%
92%
92%
89%
88%
91%
91%
89%
89%
87%
10
OPERATIONS STRATEGY
92%
92%
72%
79%
77%
69%
84%
21.4
22.7
25.9
24.5
8.7
2007
2008
2009
2010
2011
2012 YTD
5%
13%
11%
11%
10%
10%
9%
32%
2012
2013
2014
2015
2016
2017
2018
2019+
2007
2008
2009
2010
2011
2012 YTD
80%
2007
2008
2009
2010
2011
2012 YTD
29.9 |
 2012 Duke Realty Corporation
Notes
1.
Based
on
simple
average
of
year-over-year
annual
same-property
cash
NOI
growth,
includes
2007
-
2011
2.
Suburban Office Peers include BDN, CLI, HIW, LRY and PKY; weighted by historical
market cap 3.
Industrial includes DCT, EGP, FR, FPO, PSB, AMB and PLD; weighted by historical
market cap 1.5%
(0.2%)
(0.2%)
3.2%
(0.6%)
0.2%
(1.0%)
0.0%
1.0%
2.0%
3.0%
4.0%
Suburban Office Peers
Industrial Peers
5-Year Avg.
1-Year Avg.
Annual Same-Store
NOI Growth
(1)
%, y-y
Sources SNL and company filings
Duke Realty
Suburban Office Peers
(2)
Industrial Peers (3)
Consistent NOI Growth Outperformance
Relative Performance vs. Peers
OPERATIONS STRATEGY
11 |
 RELIABLE. ANSWERS.
2012 Duke Realty Corporation
12
Positioned for NAV Growth
KEY NAV GROWTH DRIVERS
Source: PPR, Green Street and Duke Realty
Lease up
existing
vacancy
Increase Rents/
Reduced
Capex
Increased
management &
service fees
Accretive future
development
Accretive
future
acquisitions
Portfolio occupancy of 92.1%
Strong leasing pipeline
Demonstrated track record of 69-80% renewal rate
Rent roll downs burning off and positive same property NOI performance
Research forecasts market wide average annual rent growth of 3.2% from
2013-16 Will benefit from uptick in third party and JV partners
development and construction activity
Property
management
and
leasing
fees
-
will
trend
higher
as
occupancy
improves
Current pipeline of 686K SF of medical office, 344K SF of suburban office
2012 estimated development starts of $200 to $300 million
Land for 44 million SF of new development, 70% industrial
Acquisitions focused on asset strategy
Industrial and medical office assets
Higher rental rate growth markets |
 2012 Duke Realty Corporation
13
Land and Development Capabilities
OPERATIONS STRATEGY
$498
million
HELD FOR DEVELOPMENT
Industrial
Office Midwest
26.3
2.8
Indianapolis, Chicago,
Cincinnati, Columbus,
Minneapolis, and
St. Louis major
positions
East
3.8
2.1
New Jersey,
Baltimore,
Washington D.C., and
Raleigh
Southeast
8.5
1.3
Atlanta, Central
Florida, and, South
Florida
Southwest
5.8
0.7
Phoenix, Dallas, and
Houston
Total
44.4 million SF
6.9 million SF
Attractive positions contribute to future development and value
Development –
Amounts in million SF
Office
30%
Industrial
70% |
 2012 Duke Realty Corporation
14
Indianapolis –
Industrial
OPERATIONS STRATEGY
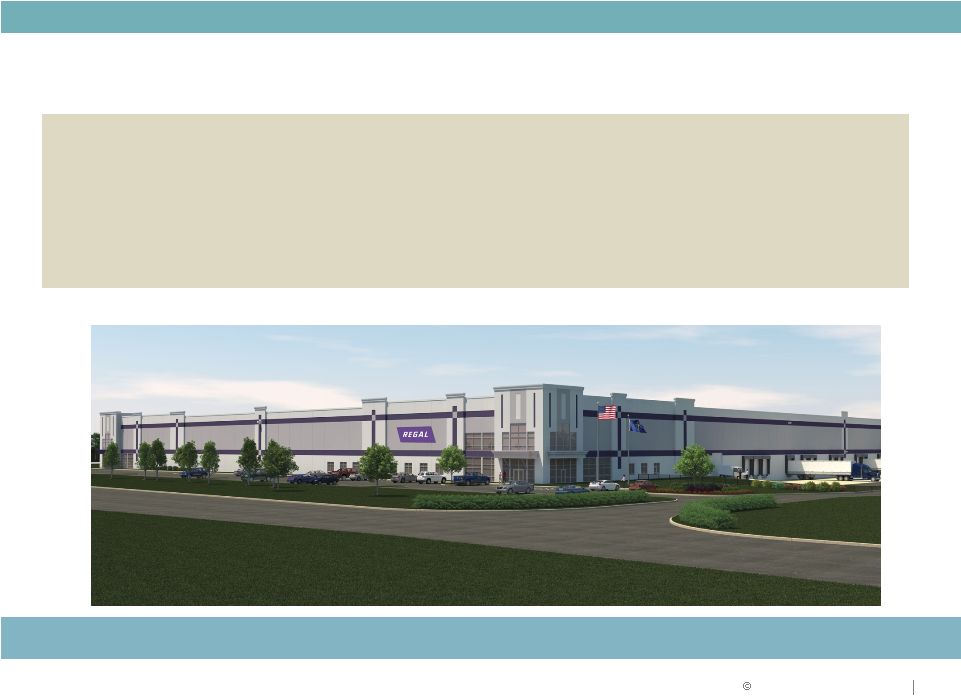
Expand Industrial
•
Regal Beloit build-to-suit bulk distribution facility
•
376,000 square feet, ten year lease term to growing global manufacturing
company •
50/50 joint venture with Browning
•
Monetizes
26
acres
of
land
at
our
960
acre
AllPoints
Midwest
bulk
distribution
park
•
$15 million project |
 2012 Duke Realty Corporation
15
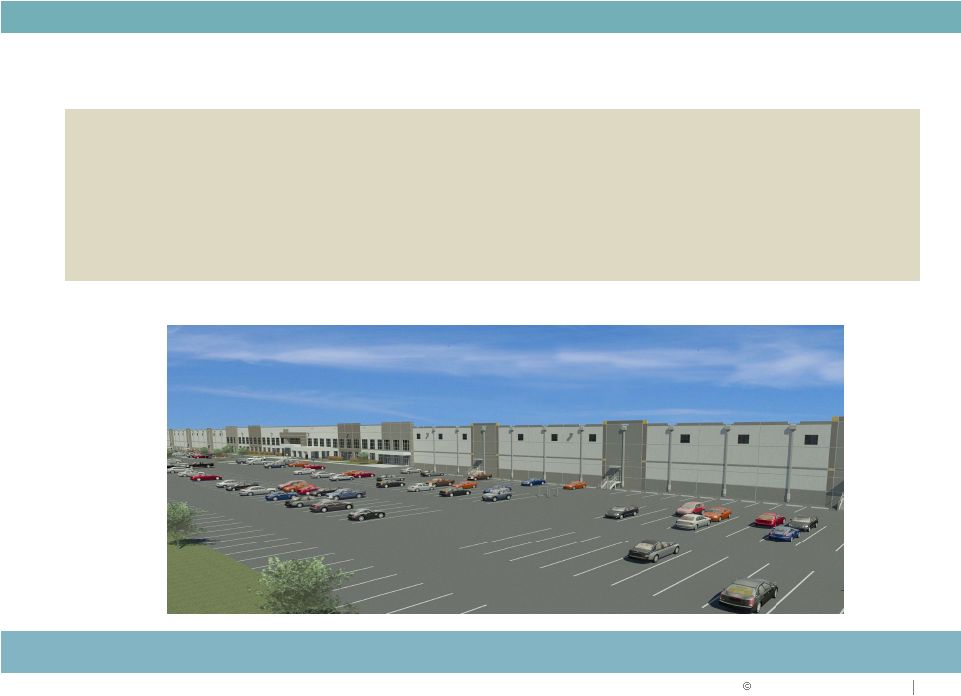
Northeast U.S. –
Bulk Industrial Build-to-Suit
OPERATIONS STRATEGY
Repeat business new development with growing tenant
•
Regional distribution center build-to-suit in Delaware for Amazon
•
1,015,000 square feet
•
Twelve year lease term
•
$82 million project
•
“A”
rated credit |
 2012 Duke Realty Corporation
16
Indianapolis –
Medical Office
OPERATIONS STRATEGY
Grow Medical Office
•
Wishard Faculty Office Building
•
Aa2 rated system sponsored by Marion County
•
275,000 square feet
•
Thirty year lease term
•
50/50 Joint Venture with Hospital System
•
On campus of new hospital to open in 2013
•
$90 million project |
 RELIABLE. ANSWERS.
2012 Duke Realty Corporation
17
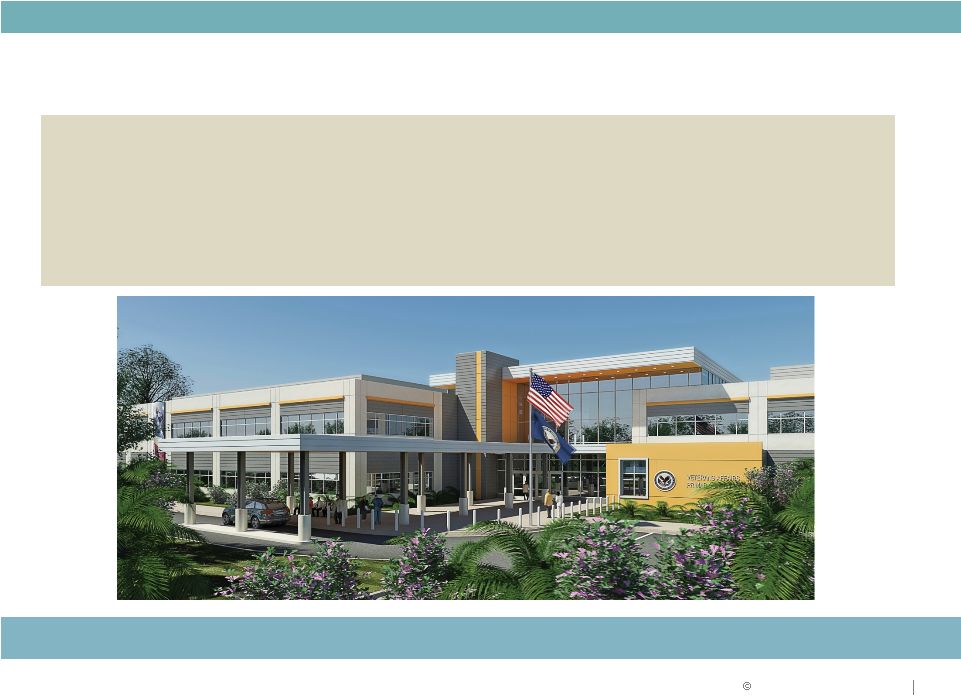
Tampa –
Medical Office
•
VA Primary Care Annex at Tampa
•
Leased to Department of Veterans Affairs
•
120,000 square feet
•
20 year lease term
•
$41 million project
Grow Medical Office |
 2012 Duke Realty Corporation
18
2011 PERFORMANCE
Total portfolio occupancy of 90.7%
Industrial at 91.9% occupancy
Over 24.5 million SF leases
2012 PERFORMANCE YTD:
Total occupancy of 92.1%
Industrial at 93.6% occupancy
Approximately 8.7 million SF leases
Quality,
well-positioned
assets
to
drive
performance
OPERATIONS STRATEGY |
 2012 Duke Realty Corporation
ASSET STRATEGY
19 |
 2012 Duke Realty Corporation
$1 Billion
20
Repositioning Track Record
$1 Billion
2005
2006
2007
2009
2010
2011
Proven ability to execute
ASSET STRATEGY
Flex disposition
Washington DC
Savannah
Healthcare
Asset Strategy
Premier
CBRERT
Dugan
Suburban
Office
Disposition |
 2012 Duke Realty Corporation
21
Asset Strategy
March 31, 2012
BY PRODUCT
2009
2013
BY GEOGRAPHY
ASSET STRATEGY
2009
2013
2012
Southeast
21%
Southeast
24%
Southeast
30%
2012
Office
55%
Retail
4%
Industrial
36%
Medical
Office
5%
Office
32%
Retail
4%
Industrial
53%
Medical
Office
11%
Office
25%
Industrial
60%
Medical
Office
15%
Midwest
53%
East
13%
South
12%
West
1%
Midwest
40%
East
15%
South
10%
West
5%
Midwest
46%
East
14%
South
14%
West
2% |
 2012 Duke Realty Corporation
22
Asset Strategy: Road Map
($ in millions)
Investment
12/31/10
Investment
3/31/12
ACTION PLAN
Investment
2013
PRODUCT TYPE
Amount
%
Amount
%
Acquisitions /
Developments /
Repositioning
Amount
%
Industrial
$3,645
45%
$4,264
53%
$656
$4,920
60%
Office
3,770
46%
2,529
32%
(479)
2,050
25%
Medical Office
515
6%
840
11%
390
1,230
15%
Retail
280
3%
305
4%
(305)
0
0%
$8,210
100%
$7,938
100%
$262
$8,200
100 %
REGION
Midwest
$3,970
48%
$3,710
46%
($430)
$3,280
40%
Southeast
2,270
28%
1,884
24%
526
2,460
30%
East
955
11%
1,089
14%
141
1,230
15%
South
950
12%
1,092
14%
(272)
820
10%
West
65
1%
163
2%
247
410
5%
$8,210
100%
$7,938
100%
$262
$8,200
100%
Portfolio sale accelerates suburban office repositioning
ASSET STRATEGY |
 2012 Duke Realty Corporation
23
ASSET STRATEGY
Asset Strategy: Progress To Date
BUILDING ACQUISITIONS
BUILDING DISPOSITIONS
Q4 2009
15
Q4 2009
144
2010
919
2010
499
2011
747
2011
1,634
Q1 2012
157
64
Total
$1,838
Total
$2,341
NO
DILUTION
TO AFFO
Matching acquisitions with dispositions . . . limiting earnings impact
($ in millions)
PROGRESS TO DATE
TOTAL
VALUE
ASSUMED
DEBT
NET
Dispositions
$2,341
($0)
$2,341
Acquisitions
$1,838
($669)
$1,169
Excess Cash
$1,172 |
 2012 Duke Realty Corporation
24
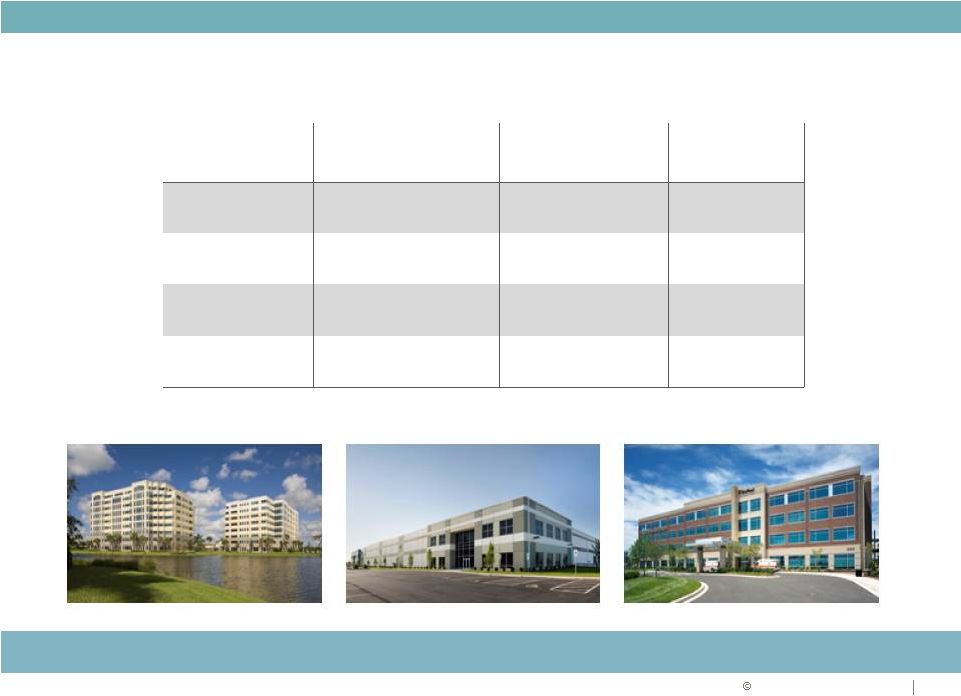
New, High Quality Portfolio with Long-term Leases
Premier portfolio of assets
Portfolio average
Bulk
Industrial
Suburban Office
Medical
Office
Property age
10.4 years
13.1 years
4.2 years
Property size
221,000 SF
117,000 SF
82,000 SF
Lease term
7.1 years
7.3 years
11.7 years
Tenant size
76,000 SF
12,000 SF
10,000 SF
ASSET STRATEGY |
 RELIABLE. ANSWERS.
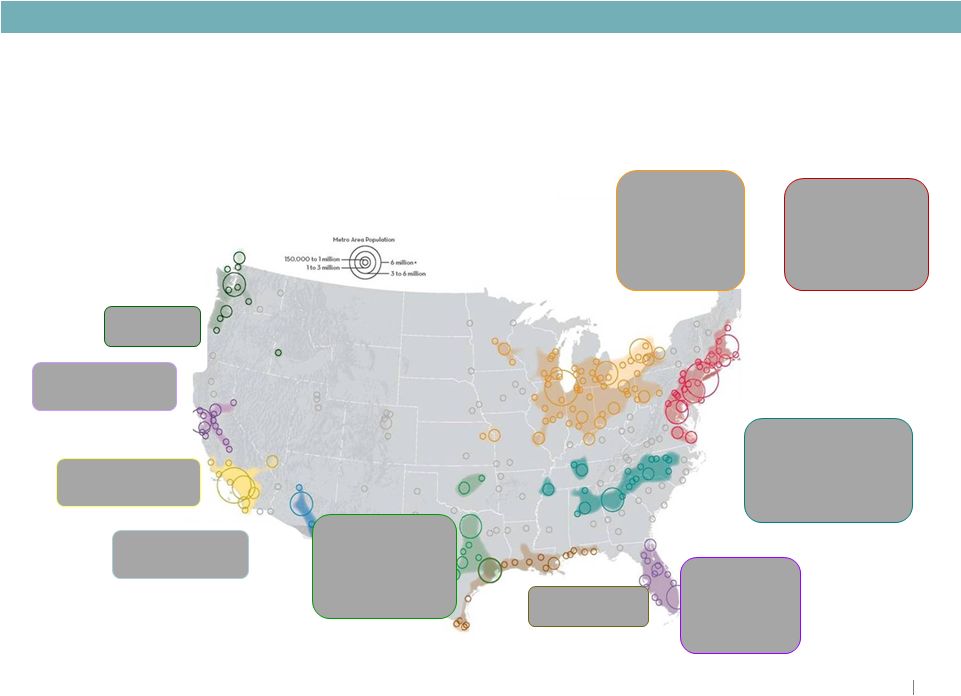
U.S. Rail and Highway Logistics Routes & Corridors
Duke Realty’s 17 Primary Markets Strategically Placed in Key Distribution
Corridors Note:
Duke Realty Primary
Industrial Markets in Blue |
 RELIABLE. ANSWERS.
Market Size
(MM SF)
(Dec. 2011)
Population
(MM People)
(Dec. 2011)
Fore. Pop. Growth
(Fore. 2011-2016)
Pop. w/in 500 miles
(as of 2005)
Fore. Demand Growth
(Fore. 2011-2016)
Fore. Vacancy Rates
(Fore. Dec. 2016)
Atlanta
489.7
5.4
1.8%
25.2%
2.2%
10.4%
Baltimore
149.0
2.7
0.5%
36.7%
0.9%
9.1%
Chicago
794.0
9.6
0.5%
27.8%
1.0%
10.6%
Cincinnati
206.6
2.2
0.6%
39.0%
1.5%
7.4%
Columbus OH
219.1
1.9
0.8%
45.0%
1.3%
10.1%
Dallas - Fort Worth
546.5
6.6
2.1%
14.3%
2.0%
10.0%
Fort Lauderdale
102.8
1.8
1.8%
6.5%
1.6%
5.4%
Houston
396.6
6.2
1.9%
12.2%
1.5%
5.0%
Indianapolis
179.6
1.8
1.3%
35.1%
2.2%
5.5%
Inland Empire
390.4
4.3
1.0%
14.4%
2.8%
9.3%
Los Angeles
682.8
10.0
1.0%
14.3%
0.9%
3.0%
Miami
194.4
2.5
1.2%
6.2%
1.1%
5.6%
Minneapolis
146.9
3.3
1.0%
14.6%
1.1%
6.3%
Nashville
133.0
1.6
1.0%
34.4%
1.4%
8.9%
Norfolk
67.8
1.7
0.7%
35.0%
1.6%
8.1%
Orlando
107.2
2.2
2.6%
12.7%
1.6%
10.6%
Phoenix
205.2
4.3
2.6%
11.4%
2.4%
10.6%
Raleigh
42.4
1.2
3.6%
36.0%
1.8%
7.3%
Saint Louis
203.1
2.9
0.4%
31.1%
0.6%
9.3%
Tampa
128.5
2.8
1.4%
12.0%
1.6%
6.2%
Washington - NoVA - MD
145.7
5.7
1.1%
37.7%
1.4%
8.3%
Austin
52.3
1.8
2.6%
11.2%
1.2%
10.4%
Boston
167.3
4.6
0.2%
23.0%
0.4%
8.6%
Charlotte
152.4
1.8
2.3%
30.7%
1.4%
8.0%
Cleveland
189.6
2.1
-0.3%
43.1%
0.4%
7.9%
Denver
146.6
2.6
1.1%
5.3%
0.9%
7.0%
Detroit
334.6
4.3
0.0%
38.8%
1.0%
9.7%
East Bay
173.1
2.6
1.0%
13.4%
0.9%
5.6%
Hartford
50.6
1.2
0.2%
25.4%
1.3%
9.1%
Honolulu
37.1
1.0
0.5%
0.4%
1.0%
2.7%
Jacksonville
96.7
1.4
1.6%
16.6%
2.2%
9.3%
Kansas City
183.3
2.1
1.0%
21.1%
0.8%
7.0%
Las Vegas
84.4
2.0
2.9%
15.7%
1.9%
11.1%
Long Island
130.3
2.9
0.1%
27.4%
0.4%
3.8%
Memphis
182.7
1.3
0.8%
28.7%
2.0%
10.8%
Milwaukee
93.6
1.6
0.4%
25.0%
0.7%
9.3%
New Orleans
55.5
1.2
0.3%
17.1%
0.5%
8.8%
New York
393.4
11.6
0.2%
29.3%
0.0%
5.6%
Northern New Jersey
150.6
2.2
0.3%
31.3%
0.8%
7.3%
Oklahoma City
58.5
1.3
1.1%
15.4%
1.3%
5.4%
Orange County
161.6
3.1
1.0%
14.3%
0.7%
3.7%
Palm Beach County
41.7
1.4
2.7%
7.3%
1.3%
8.4%
Philadelphia
360.2
6.0
0.4%
33.1%
0.8%
7.8%
Pittsburgh
103.6
2.4
-0.1%
44.5%
0.5%
7.7%
Portland, OR
148.2
2.3
1.8%
5.2%
2.0%
5.9%
Richmond
71.9
1.3
1.0%
38.1%
1.8%
8.3%
Sacramento
131.6
2.2
1.2%
14.2%
0.6%
12.1%
Salt Lake City
82.2
1.2
1.5%
5.3%
1.3%
5.9%
San Antonio
71.9
2.2
2.0%
9.9%
1.8%
8.4%
San Diego
91.9
3.2
1.5%
13.9%
0.7%
7.6%
San Francisco
62.7
1.8
0.8%
13.1%
0.1%
2.8%
San Jose
74.5
1.9
0.8%
13.1%
0.3%
3.7%
Seattle
194.7
3.5
1.1%
3.8%
1.7%
6.7%
Stamford
26.1
0.9
0.3%
26.6%
1.9%
7.0%
Duke Realty’s
industrial portfolio is
diversified across top
ranked markets by
square footage,
population,
population growth,
population within 500
miles, forecast
demand growth and
forecast vacancy
rates
Rankings of “PPR 54”
Top Industrial Markets
= Top
50%
Ranking
per
“PPR
54”
Data
Located in
Strategic
Distribution
Markets
Consistent with
Asset Strategy
= Crossover market with Duke portfolio
Source: PPR, Q4 2011 |
 RELIABLE. ANSWERS.
2012 Duke Realty Corporation
27
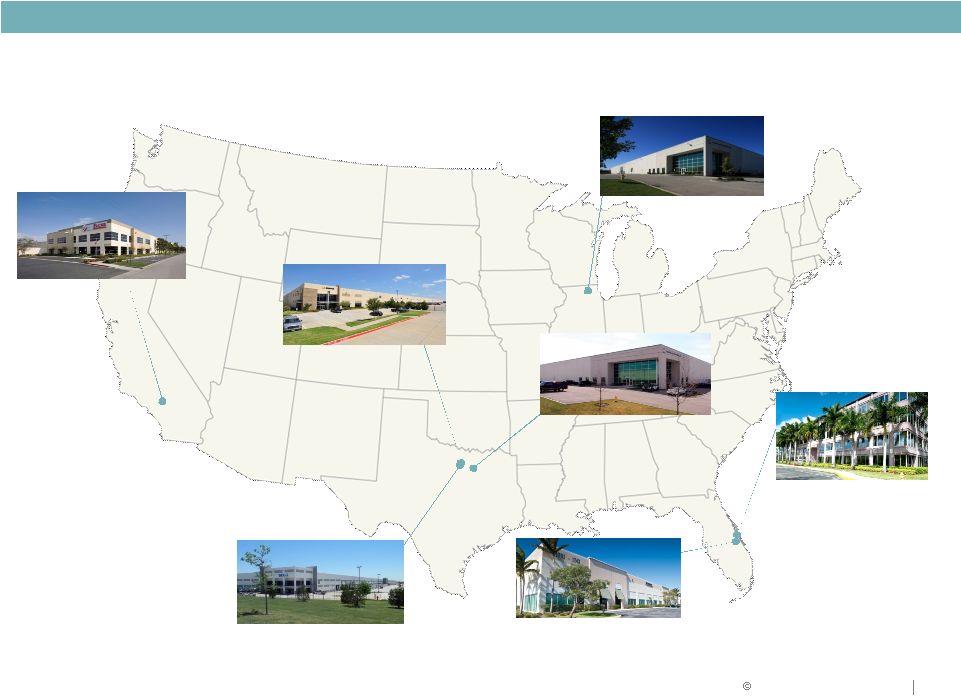
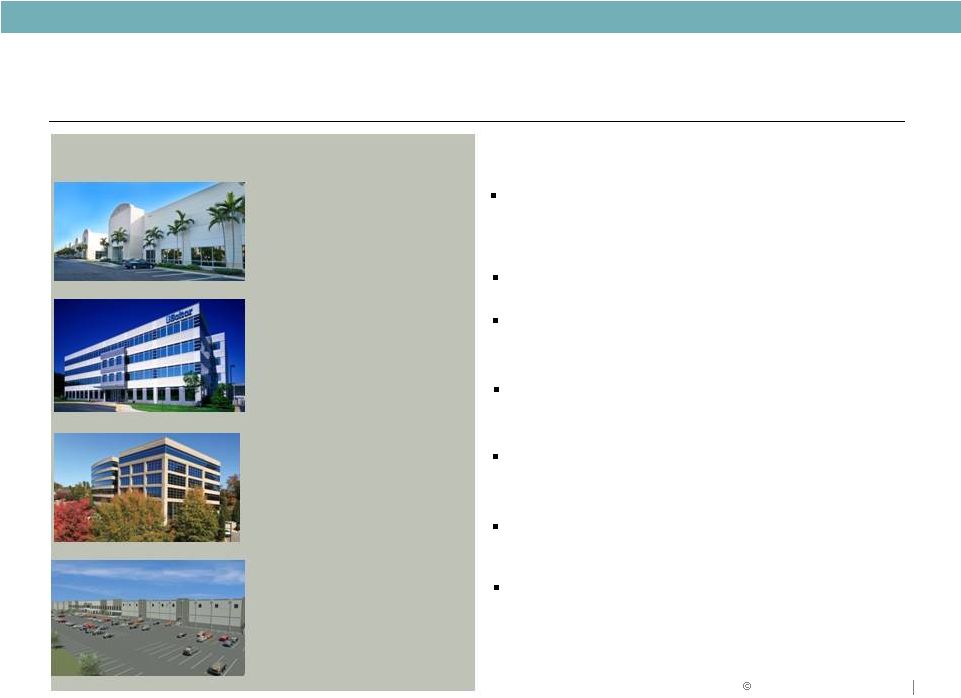
Industrial Market Expansion in 2011
Century Distribution Center
Los Angeles, CA
323,000 SF, 100% leased
Pioneer 161 Solo
Dallas, TX
603,000 SF, 100% leased
Lakeside Ranch Industrial
Dallas, TX
749,000 SF, 100% leased
Premier Portfolio Industrial
Pompano, FL
1,163,000 SF, 90% leased
Premier Portfolio Office
Pompano, FL
389,000 SF, 87%, leased
Seefried Industrial
Chicago, IL
353,000 SF, 100% leased
Seefried Industrial
Dallas, TX
324,000 SF, 100% leased |
 RELIABLE. ANSWERS.
2012 Duke Realty Corporation
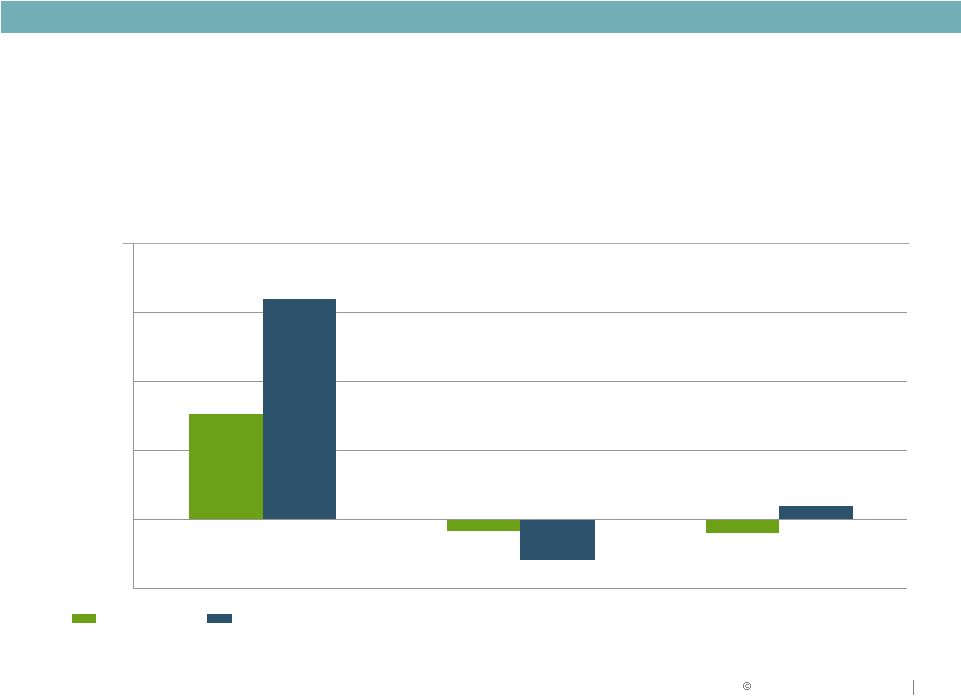
Strategy for Industrial Markets
Focus
industrial
expansion
in
core
markets:
–
South Florida
$597
–
Chicago
318
–
Houston
83
–
Dallas
78
–
Southern
California
68
Develop in markets where we have land and competitive positions
Goal: Increase Shareholder Value
Develop in markets where we have land and competitive positions
$ Invested ($ in millions)
|
 2012 Duke Realty Corporation
29
$1.6 billion of dispositions
$747 million of acquisitions
Over $200 million of development starts
Made significant progress on strategic plan
2012 PERFORMANCE YTD:
$64 million of dispositions
$157 million of acquisitions
$121 million of development starts
Continue making progress on strategic plan
Quality portfolio further improving with asset strategy
ASSET STRATEGY
2011 PERFORMANCE |
 2012 Duke Realty Corporation
CAPITAL STRATEGY AND 2012 GUIDANCE
30 |
 2012 Duke Realty Corporation
CAPITAL STRATEGY
Capital Strategy Focus
31
Reducing leverage
Increasing coverage ratios
Maintaining size and quality of unencumbered asset base
Executing portfolio repositioning in alignment with capital strategy
objectives
Further improve balance sheet strength and ratings
1
1
2
2
3
3
4
4 |
 2012 Duke Realty Corporation
CAPITAL STRATEGY
32
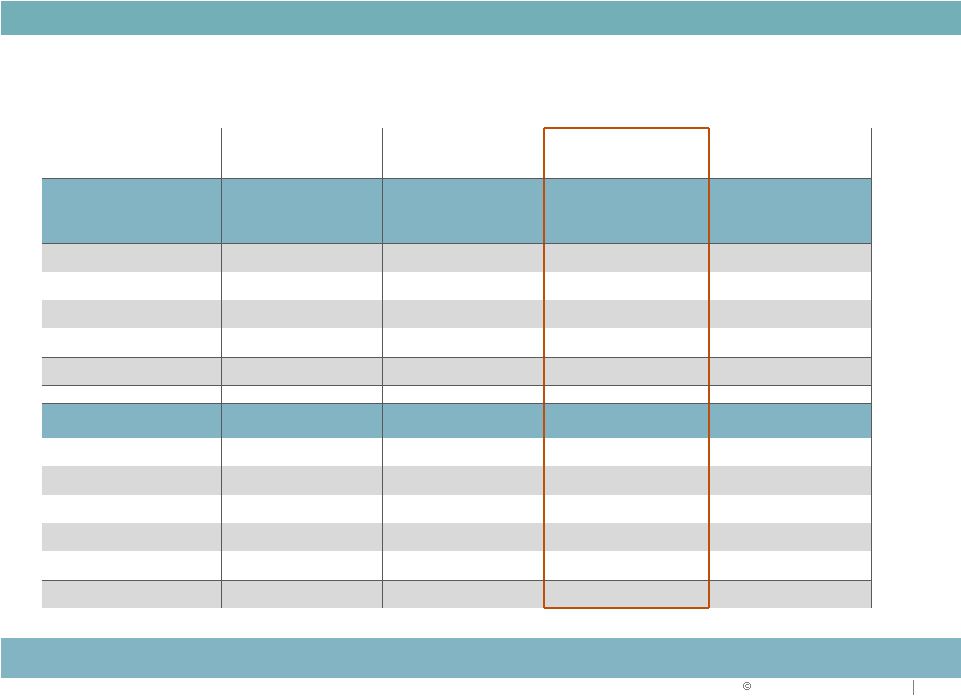
Key Metrics & Goals
2009
Actual
2010
Actual
2011
Actual
2012
1Q
Actual
Goal
Debt to Gross Assets
44.5%
46.3%
46.8%
47.3
45.0%
Debt + Preferred to Gross
Assets
54.9%
55.5%
55.6%
54.3
50.0%
Fixed Charge Coverage
Ratio
1.79 : 1
1.79 : 1
1.82 : 1
1.81:1
2.00 : 1
Debt/EBITDA
6.65
7.31
6.02*
6.56**
< 6.00
Debt + Preferred/EBITDA
8.47
8.88
7.34*
7.64**
< 7.75
Progressing toward strategic plan goals
*Timing of Blackstone transaction. Including adjustments to TTM EBITDA for Blackstone transaction
results in recast 2011 Debt to EBITDA of 7.03x and Debt+Preferred/EBITDA of 8.58x . **
For 1Q 2012, recast Debt to EBITDA of 7.38x and Debt+Preferred/EBITDA of 8.59x
|
 2012 Duke Realty Corporation
CAPITAL STRATEGY
33
Continue to execute on capital strategy objectives
CAPITAL SOURCE
2007
2008
2009
2010
2011
2012
YTD
TOTAL
Common Stock
$230
-
$575
$311
-
$150
$1,216
Preferred Stock
-
$300
-
-
-
-
$300
Unsecured Debt
$300
$325
$500
$250
-
-
$1,375
Secured Debt
-
-
$270
-
-
-
$270
Asset Dispositions
$785
$475
$300
$533
$1,650
$65
$3,808
TOTAL
$1,315
$1,100
$1,645
$1,094
$1,650
$215
$7,019
•
Investment grade rated debt for over 15 years
•
Proven access to multiple capital sources
•
Available line of credit -
$850 million capacity
•
Dividend covered by AFFO
Continue to strengthen balance sheet
($ in millions) |
 RELIABLE. ANSWERS.
Bond Market Indicative Pricing
Credit Markets Responding favorably to Execution of Asset and
Capital Strategies
Source: Wells Fargo, 5/11/2012
Tenor
5 years
10 years
Assumed Ratings
Baa2/BBB-
Baa2/BBB-
Benchmark
5 year UST
10 year UST
Benchmark Yield
0.78%
1.88%
Reoffer Spread
220.0 bps
240.0 bps
Reoffer Yield
2.98% area
4.28% area
Underwriting Fee (%)
0.600%
0.650%
All-In Cost (Yield)
3.11% area
4.36% area |
 RELIABLE. ANSWERS.
2012 Duke Realty Corporation
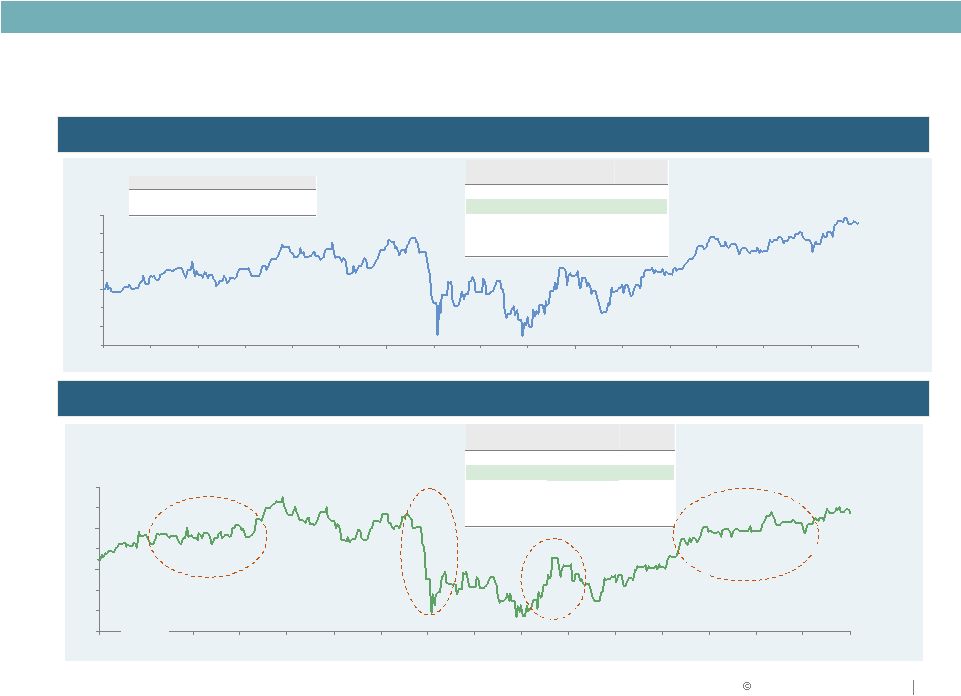
The RMZ outperformed S&P 500 in 2011,
but has lagged slightly below the S&P 500 in 2012
35
Source: J.P. Morgan, Bloomberg, FactSet as of 05/10/12
1
Based upon 342 total trading days
85%
90%
95%
100%
105%
110%
115%
120%
Jan-11
Jan-11
Mar-11
Apr-11
May-11
Jun-11
Jul-11
Aug-11
Sep-11
Oct-11
Nov-11
Dec-11
Jan-12
Feb-12
Mar-12
Apr-12
May-12
Level
# trading days
above
%
above¹
900
4
1%
Current (896)
7
2%
850
60
17%
800
175
51%
750
303
89%
Performance
RMZ
S&P 500
FY 2011
4.7%
0.0%
YTD 2012
12.5%
8.0%
$9
$10
$11
$12
$13
$14
$15
$16
Jan-11
Jan-11
Mar-11
Apr-11
May-11
Jun-11
Jul-11
Aug-11
Sep-11
Oct-11
Nov-11
Dec-11
Jan-12
Feb-12
Mar-12
Apr-12
May-12
Level
# trading days
above
%
above¹
$15.00
9
3%
Current ($14.76)
27
8%
$14.50
45
13%
$13.50
186
54%
$13.00
221
65%
Protests in Middle East turn violent and
Japanese earthquake and tsunami result
in crisis at nuclear plant
Market expectations for a solution to the European debt crisis grow
and DRE announces sale of over $1 billion office portfolio (10/20)
Heightened fears over
European debt crisis and
S&P downgrade of U.S. AAA
credit rating
U.S. economic data consistently beats
expectations and the European Central
Bank takes aggressive action to relieve
funding pressures on European banks
DRE
$14.76
Feb-11
RMZ price performance (2011 –
2012YTD)
DRE price performance (2011 –
2012YTD) |
 RELIABLE. ANSWERS.
2012 Duke Realty Corporation
36
Relative Performance of Duke Realty versus
Industrial Comps only
Notes
1.
Comparables include DCT, EGP, FR, and PLD; PLD and AMB are included historically,
total return for comparable companies figures are calculated on a market cap weighted basis
2.
DRE stock price as of end of trading 5/11/12, @ $14.68
3.
DRE performance since 10/20 announcement of $1.1Bn office divestiture. Based upon
10/20/11 close of $10.68 Strong Recent Performance Reflective of Executing
Aligned Operating, Asset Repositioning and Capital Strategies
% Total Return(1):
Ind Comps
-4.0%
S&P 400
-1.7%
FY 2011
YTD
2012
(2)
Since -
10/20
(3)
RMS
+25.2%
Ind Comps
+34.7%
DRE
+2.1%
Ind Comps
+21.6%
DRE
+23.3%
S&P 500
+8.4%
RMS
+14.1%
S&P 400
+10.2%
DRE
+41.2%
S&P 400
+15.4%
S&P 500
+12.7%
RMS
+8.7%
S&P 500
+2.1% |
 RELIABLE. ANSWERS.
2012 Duke Realty Corporation
37
Notes
1.
As of April 30, 2012
2.
Includes LRY, HIW, CLI, BDN, and OFC
3.
DCT’s beta only available since its IPO. Barra began tracking DCT’s
beta in Dec 2006 4.
Includes PLD, FR, EGP, DCT, and LRY
Duke Realty and Peers Barra Beta Analysis
Beta Trends are Slowly Improving Consistent with Asset and Capital
Strategy….Working on Further Lowering Beta
Barra Beta Analysis
2002-2012
1 Year
5 Year
10 Year
Avg
Avg
Avg
DRE
Office Comps
(2)
Industrial Comps
(3)(4)
1.34
1.45
1.54
Current
(1)
1.09
1.21
1.25
1.35
1.00
1.23
1.25
1.41
0.95 |
 2012 Duke Realty Corporation
38
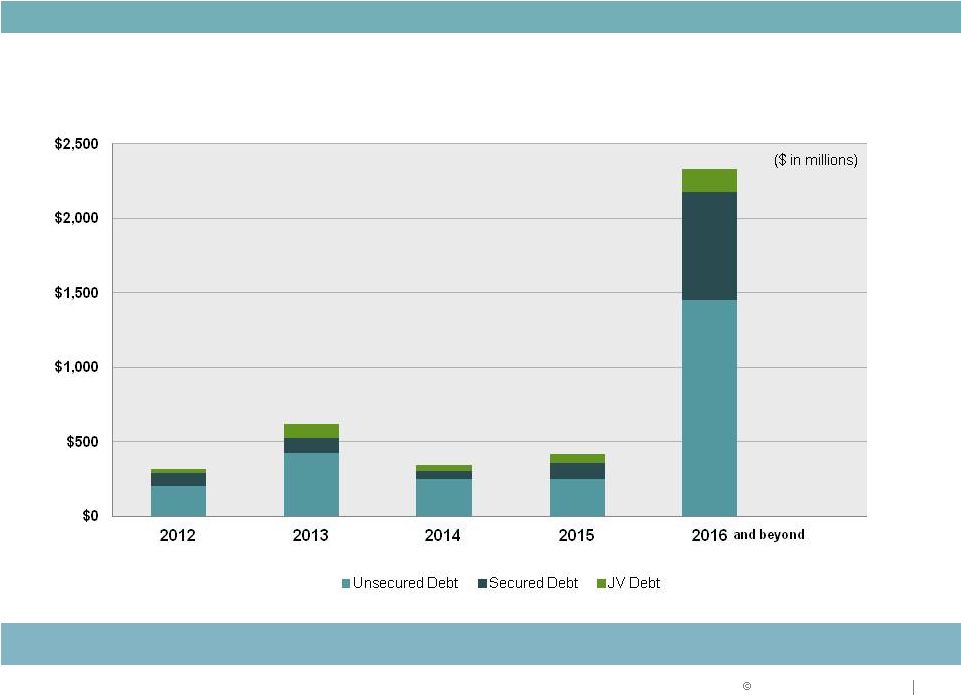
Liquidity Position
CAPITAL STRATEGY
Manageable debt maturities |
 RELIABLE. ANSWERS.
2012 Duke Realty Corporation
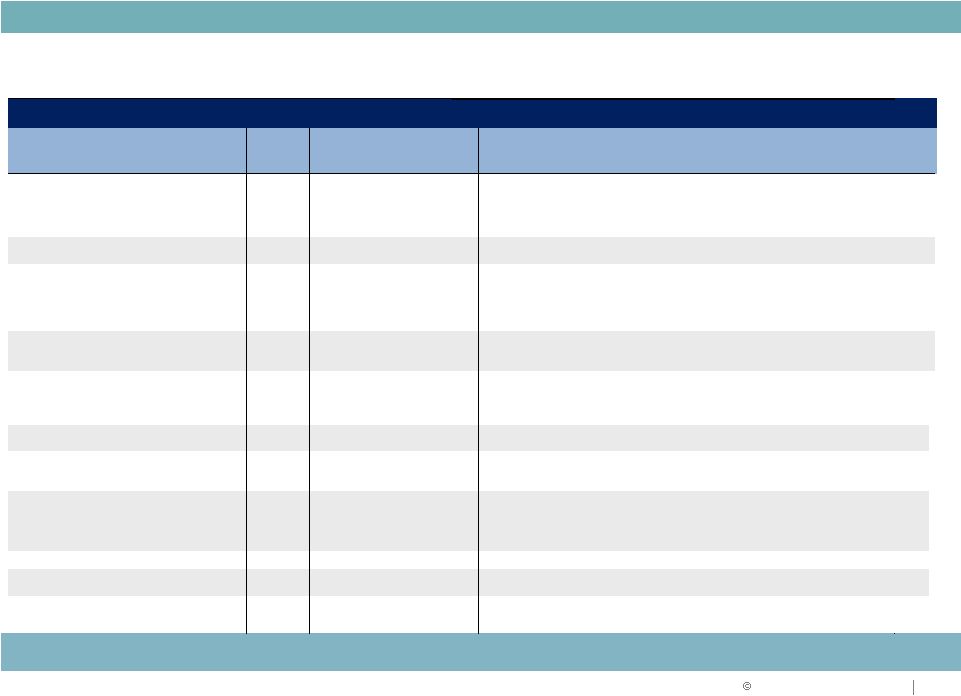
2012 Range of Estimates
($ in millions)
Leasing Actions Combined with Modest Rental Rate Increases Drive
Upside
39
Metrics
2011
Actual
Q1 2012
Actual
Pessimistic
Optimistic
Key 2012 Assumptions
Core FFO per share
$1.15
$0.24
$0.94
$1.06
-
Blackstone/repositioning dilution $.10 -
$.12
-
Lower service operations income
-
Partially offset by improvement in occupancy of core portfolio
AFFO Payout Ratio
87%
85%
96%
80%
-
Annual dividend maintained at $0.68 per share
Avg Occupancy -
In-Service
89.7%
91.3%
89.5%
92.5%
-
Positive
momentum
anticipated
given
Industrial
and
medical
office
performance
-
Lower expirations than 2011 (7% vs. 10%)
-
Upside to guidance driven by lease-up of portfolio
Same Property NOI Growth
3.2%
3.6%
(1.5%)
2.5%
-
Occupancy increase lower than 2011
-
Rental rate pressure remains
Building Acquisitions
$747
$157
$300
$500
-
Remain selective regarding property type and location in alignment with
long-term strategy
-
Focus on industrial and medical office
Building Dispositions
$1,634
$64
$200
$300
-
Continue to prune remaining non-core office portfolio
Land Sale Proceeds
$12
$2
$20
$30
-
Selling 10% to 20% of identified non-strategic parcels
-
Demand still sluggish
$489
$138
$300
$500
-
Comprised of medical office and industrial starts
-
Development of $200 to $300 million
-
Third party of $100 to $200 million
Construction Volume
$727
$107
$400
$600
-
Wind down of BRAC project partially offset by development volume
Service Operations Income
$46
$6
$20
$25
-
Reduced fees from BRAC project
General & Admin expense
$40
$12
$43
$38
-
In line with 2011
2012 Range of Estimates
Construction and
Development Starts |
 2012 Duke Realty Corporation
40
$1.6 billion of capital raised through asset
dispositions
Retired $333 million of unsecured bonds
Redeemed $109 million of preferred equity
Fixed charge ratio of 1.82x and
debt to EBITDA of 6.02x*
Opportunistically tapped ATM raising $147 million
Continue improving coverage ratios
Maintaining minimal balance on line of credit
CAPITAL STRATEGY
Strong
balance
sheet
…
executing
according
to
strategy
* Timing of Blackstone transaction; Including adjustments to EBITDA for
Blackstone transaction results in recast Debt to EBITDA of 7.03x
2011 PERFORMANCE
2012 PERFORMANCE YTD: |
 2012 Duke Realty Corporation
MIDWEST OVERVIEW
Performance Update
41 |
 2012 Duke Realty Corporation
RECENT TRANSACTIONS
42
Midwest
New Lease -
Industrial
World Park Union Center
Cincinnati
191,000 SF
Tenant: Ashland
Term 6 years
Renewal -
Industrial
Park 100 Bldg 131
Indianapolis
419,000 SF
Tenant: Hewlett Packard
Term: 1.25 years
Strong distribution base: Over 30% of U.S.
population within one day’s drive
74 Fortune 500 headquarters
High growth and return opportunities, particularly
in Chicago, Columbus, and Indianapolis
Duke Realty’s roots and a position of strength
Original
location
–
since
1972
Low basis product
Dominant market position
46% of our total investment
Acquisition -
Industrial
1860 W. Jefferson
Chicago
827,000 SF, 100% leased
Tenant: Crate & Barrel
MIDWEST OVERVIEW
Development Industrial
Regal Beloit BTS
Allpoints Midwest Bldg 4
Indianapolis
376,000 SF
100% leased
Committed to Midwest because we perform…
Midwest remains a key component to our strategy
MARKET OVERVIEW & KEY POINTS |
 2012 Duke Realty Corporation
43
Midwest Overview
Location
Product
Type
Industrial
Office
Average Age
11.8 years
16.2 years
Average Building Size
248,000 SF
125,000 SF
Total Square Footage
57 million
12.4 million
Current Occupancy
94.8%
83.8%
Indianapolis
96.4%
92.6%
Chicago
98.0%
88.4%
Cincinnati
93.1%
83.4%
St. Louis
88.1%
76.8%
Columbus
96.5%
84.0%
Minneapolis
84.5%
100%
MIDWEST OVERVIEW |
 2012 Duke Realty Corporation
44
Midwest Focus
DOMINANT POSITION
BULK INDUSTRIAL
REDUCE OFFICE
CONCENTRATION
MIDWEST OVERVIEW
Enhancing dominant industrial position in Midwest |
 2012 Duke Realty Corporation
EAST & SOUTHEAST OVERVIEW
Performance Update
45 |
 2012 Duke Realty Corporation
46
East & Southeast Overview
New Deal –
Industrial
625 Braselton
Atlanta
William Carter Co.
1,061,663 SF
Term:11.5 years
New/Renewal -
Office
Liberty Center II
Washington, D.C.
Scitor Corp
159,000 SF
Term: 10 years
EAST & SOUTHEAST OVERVIEW
Disposition –
Office
Raleigh –
6 Bldgs
427,000 SF
87% leased
New Lease/Dev Start –
Industrial
Delaware
560 Merrimac Ave
Tenant: Amazon
1,015,000 SF
Term: 12 years
RECENT TRANSACTIONS
Strong presence: entered Southeast in 1999 (Weeks
merger) and East in 2006 (acquisition of Winkler portfolio) 15 Fortune 500 headquarters
East and Southeast cities among top growth markets
in country… strong in-migration
Diversified economies; Government, healthcare,
finance and education
Eastern cities maintained highest employment rate
through downturn
Atlanta and Northeast corridor strong in bulk
industrial
38% of our total investment
MARKET OVERVIEW & KEY POINTS
|
 2012 Duke Realty Corporation
47
East & Southeast Overview
Industrial
Office
Average Age
9.5 years
9.9 years
Average Building Size
161,000 SF
110,000 SF
Total Square Footage
29.3 million
9.5 million
Current Occupancy
91.6%
86.6%
Atlanta
90.1%
81.7%
South Florida
84.3%
85.7%
Raleigh
98.9%
89.4%
Washington D.C./Baltimore
94.1%
87.1%
Central Florida
93.6%
84.4%
Savannah
93.2%
NA
EAST & SOUTHEAST OVERVIEW
Location
Product
Type
Office
37%
Industrial
48%
Medical
Office
7%
Retail
8%
Atlanta
18%
D.C./
Baltimore
16%
Central
9%
Raleigh
21%
South
27%
Savannah
9%
Florida
Florida |
 2012 Duke Realty Corporation
48
East & Southeast Focus
BULK INDUSTRIAL/PORTS
LEASE UP AND RENT GROWTH
ACQUISITIONS & DEVELOPMENT
EAST & SOUTHEAST OVERVIEW
Maximize assets and market position |
 2012 Duke Realty Corporation
49
SOUTHWEST OVERVIEW
Performance Update |
 2012 Duke Realty Corporation
RECENT TRANSACTIONS
50
Southwest
New Lease-
Industrial
Kingsley Dist. Center
Service Lighting & Electrical
132, 000 SF
Term: 5.5 years
New Lease-
Industrial
Freeport VI
VMP Nutrition
114,000 SF
Term: 5 years
Duke Realty one of top 3 owner/developers in
Dallas/Ft.Worth
Duke Realty presence since 1999 (Weeks merger)
52 Fortune 500 headquarters
Demographic drivers: modern transportation and
infrastructure, population and job growth
Strong industrial demand expected post-recovery
Port, inland port and logistics key for bulk
distribution markets
16% of our total investment
Expand industrial presence by pursuing select
acquisition opportunities in Houston, Phoenix and
Southern California
Renewal-
Office
Aspen Grove Office Center II
Mars Petcare
122,000 SF
Term: 5 years
MARKET OVERVIEW & KEY POINTS
SOUTHWEST
OVERVIEW |
 2012 Duke Realty Corporation
51
Southwest Overview
Location
Product
Type
SOUTHWEST OVERVIEW
Seattle
2%
Austin
3%
Southern CA
5%
Dallas
43%
Phoenix
6%
Houston
12%
Nashville
25%
San Antonio
4%
Office
11%
Industrial
68%
Medical
Office
21%
Industrial
Office
Average Age
8.3 years
7.3 years
Average
Building
Size
272,000 SF
106,700 SF
Total
Square
Footage
23.4 million
1.6 million
Current Occupancy
93.2%
95.5%
Dallas
92.2%
100%
Nashville
95.6%
93.9%
Houston
92.6%
100%
Phoenix
94.4%
N/A
Southern California
100%
N/A |
 2012 Duke Realty Corporation
52
Southwest Focus
DALLAS LEASE-UP
HOUSTON INDUSTRIAL PORT
DALLAS INLAND PORT
SOUTHERN CALIFORNIA
EXPANSION
SOUTHWEST OVERVIEW
Grow |
 2012 Duke Realty Corporation
53
MEDICAL OFFICE STRATEGY &
Performance Update |
 2012 Duke Realty Corporation
Medical Office Portfolio at March 31, 2012
54
In-Service
Under
Development
Total
Properties
44
6
50
Investment $
$695 M
$145 M
$840 M
Square Feet
3.59 M
685 K
4.28 M
Occupancy
91%
86%
90%
Local
15%
Regional
55%
National
30%
Specialty
Hospital
7%
MOB On-
Campus
86%
MOB
Off-Campus
7%
Portfolio investment by product type
Portfolio investment by
hospital system
MEDICAL OFFICE STRATEGY |
 major cities that produce more than $100 billion in goods and
services. Mega-regions will drive need for healthcare,
transportation infrastructure and jobs through 2050
Duke Realty Markets: Demographic Focus
*
Duke Realty market
Map Source: ATLANTA REGIONAL COMMISSION MEGAREGIONS REPORT
MEDICAL OFFICE STRATEGY
55
CASCADIA
NORTHERN
CALIFORNIA
SOUTHERN
CALIFORNIA
ARIZONA SUN
CORRIDOR
TEXAS TRIANGLE
GULF COAST
FLORIDA
Jacksonville
Miami
Orlando*
Tampa*
PIEDMONT ATLANTIC
Atlanta*
Birmingham
Charlotte
Nashville*
Raleigh*
NORTHEAST
Baltimore*
Boston
Philadelphia
Richmond
Washington, D.C.*
GREAT LAKES
Chicago*
Columbus*
Indianapolis*
Louisville
Minneapolis*
St. Louis*
Austin*
Dallas*
Houston*
San Antonio
Megaregions by 2050:
Populations in contiguous regions with |
 2012 Duke Realty Corporation
56
Healthcare Data Points
The nation’s largest industry
•
Represents more than 17% of GDP, predicted to exceed 23%
by 2020
•
Americans spend more than 5% of pre-tax income on
healthcare. Lower income brackets pay 15% or more ($7,800
per capita health expenditures in 2008/2009)
Reform
•
Increased number of people insured expected to increase by
30 to 50 million –
increased demand for care
•
Number of physicians will increase –
more space demand
•
Hospitals expect margin pressure and need to increase
market share –
Hospitals seeking capital partners for
“non-core assets”
•
May reduce reimbursements –
real estate efficiency a
priority –
larger deals and floor plates
Healthcare systems growing and physician employment changing
MEDICAL OFFICE STRATEGY |
 2012 Duke Realty Corporation
57
Healthcare Systems
Consolidation of hospitals into systems
continues
Hospitals need capital and must grow
market share
Healthcare systems are drivers for more
strategically located outpatient facilities
Employment of Physicians
More physicians are being employed by
hospitals
Hospitals and physicians are forming
multi-specialty practices to prepare for
improved quality and reduced
reimbursement
Hospitals are driving more medical office
space needs for physicians
Fewer Independent Community Hospitals
More Physician’s Aligning with Hospitals
Demand Drivers
#
Hospitals
5,000
MEDICAL OFFICE STRATEGY
Source: Robert Kocher, MD and Nikhil R. Sahni, B.S., “Hospitals’ Race to Employ
Physicians – The Logic behind a Money-Losing Proposition.”The New
England Journal of Medicine.;364:1790-1793.
12 May 2011. Physician Compensation and Production Survey, Medical Group Mgt Assoc,
2003-2009. |
 2012 Duke Realty Corporation
58
Development Focus
ACTION PLAN
National brand awareness
Be “Experts”
–
Speak at national conferences (ASHE, BOMA)
–
Third party references
National system relationships
–
Ascension
–
Tenet
–
HCA
–
Adventist
Regional system relationships
–
Baylor Health
–
Rex Healthcare
–
Carolina Healthcare Systems
–
Advocate
System
Focus
MEDICAL OFFICE STRATEGY
Local
10%
National
30%
Regional
60% |
 59
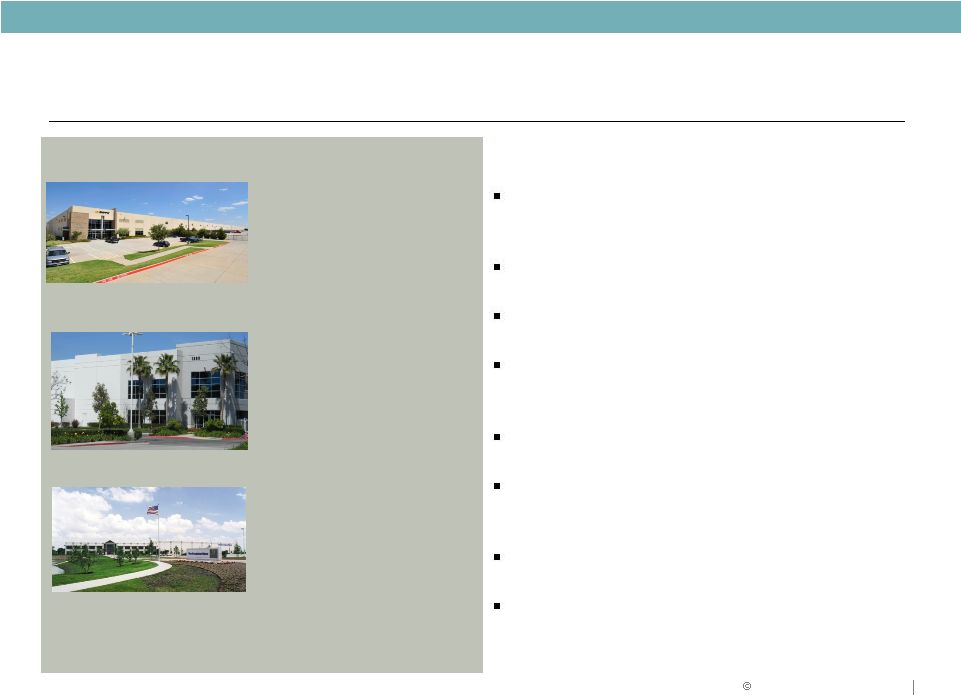
Healthcare Projects Delivered/Acquired in 2011/2012
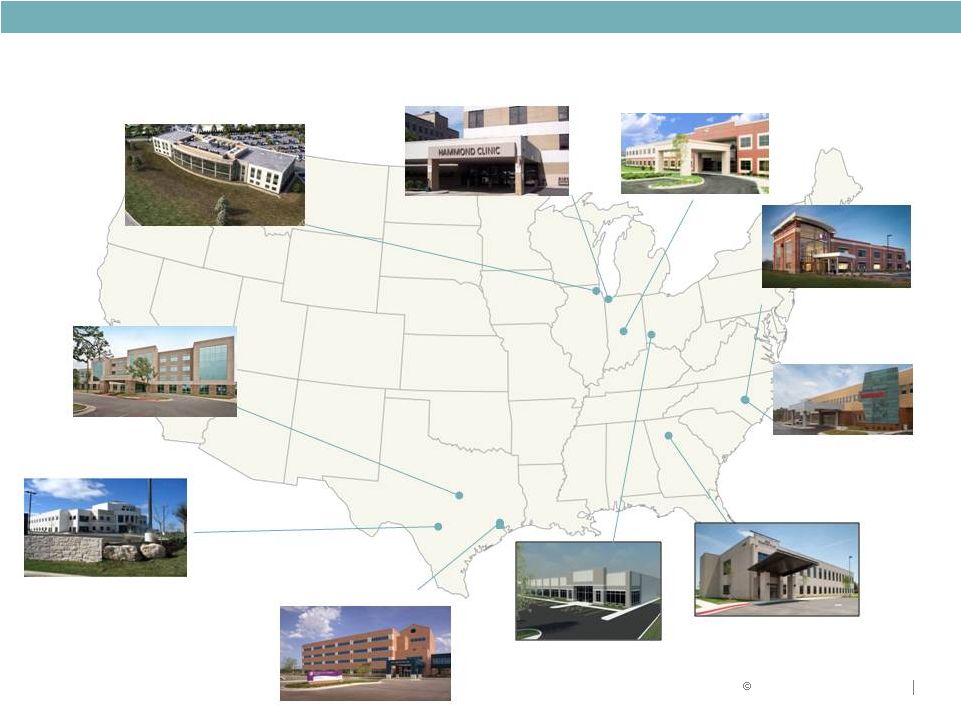
Rex Holly Springs MOB
Raleigh, NC
30,000 SF, 100% leased
Christus St. Catherine
Houston, TX
169,000 SF, 96% leased
WakeMed Brier Creek
Healthplex
Raleigh, NC
48,000 SF, 79% leased
Butler County Medical
Cincinnati, OH
109, 000 SF, 100% leased
Christus Santa Rosa
San Antonio, TX
111,000 SF, 100% leased
Max Simon MOB
Indianapolis, IN
85,000 SF, 100% leased
Franciscan Alliance
Chicago area (Hammond, IN)
195,000 SF, 100% leased
MEDICAL OFFICE STRATEGY
Burr Ridge Medical
Chicago, IL
105,000 SF, 100% leased
2012 Duke Realty Corporation
New Hampton Place
Snellville, GA
40,000 SF, 66% leased |
 60
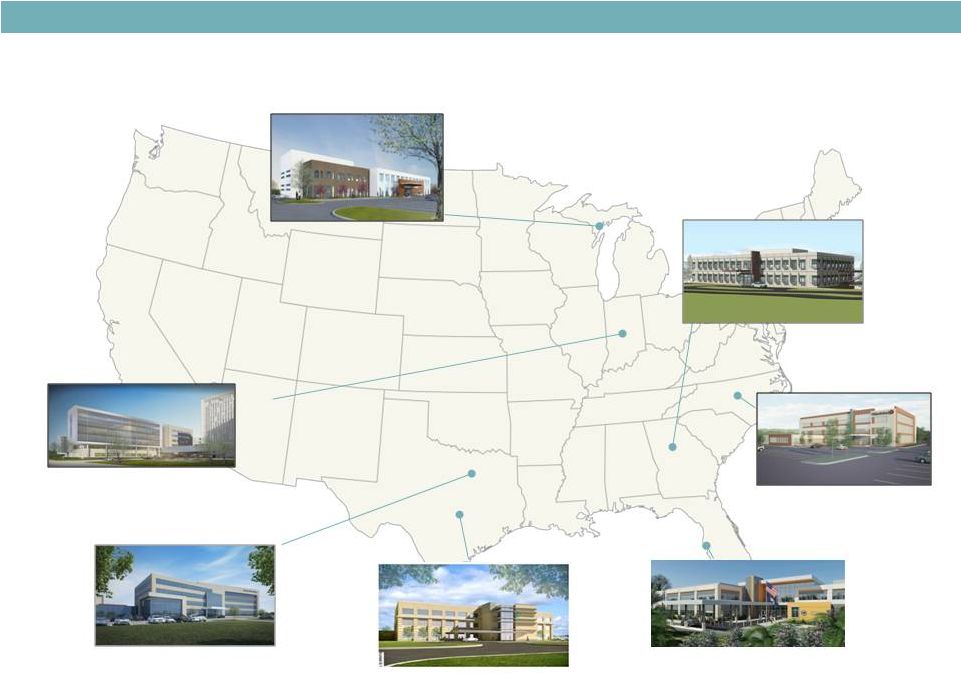
Healthcare Projects Under Development at March 31, 2012
Baylor McKinney MOB I
McKinney, TX
114,000 SF, 69% preleased
WakeMed Raleigh
Medical Park
Raleigh, NC
86,000 SF, 58% preleased
Marquette General Hospital MOB
Escanaba, MI
43,000 SF, 100% preleased
North Fulton MOB
Atlanta, GA
52,000 SF, 52% preleased
Wishard Faculty Office
Building
Indianapolis, IN
275,000 SF, 100% preleased
MEDICAL OFFICE STRATEGY
VA Tampa
Tampa, FL
117,000 SF, 100% preleased
Scott and White
Marble Falls, TX
67,000 SF, 100% preleased |
 2012 Duke Realty Corporation
Our Plan
Existing
healthcare
assets
$840
Million
by
3/31/12
New
developments
$200
Million
in
2012
and
2013
Acquire
$200-$250
Million
in
2012
and
2013
Our Focus
Goal: Grow Medical Office to $1.23 Billion by 2013
61
MEDICAL OFFICE STRATEGY
Growth regions (Southeast, South)
Health system relationships
On-campus assets
Class
A
product
(50,000
–
400,000
+
square
feet)
National industry expert |
 2012 Duke Realty Corporation
62
WHY DUKE REALTY?
Quality portfolio improving with asset strategy
Solid balance sheet improving with capital strategy
Unmatched ability to execute on daily operations
Development capabilities in place with existing land bank
Talent and leadership depth to execute
Delivering on what we say we will do
MEDICAL OFFICE STRATEGY |
 2012 Duke Realty Corporation
Vision Road Map –
Future Duke Realty
Low leverage industrial and office REIT in high growth markets
and product segments
63
MEDICAL OFFICE STRATEGY
What We Will Be
•
Low leveraged
•
Move from 54% to 45% leverage
•
Product focused
•
Become bulk industrial focused
Industrial: Increase from 35% to > 60%
Office: Decrease from 55% to < 25%
Medical: Grow from 5% to 15%+
•
Concentrated in high growth
markets
•
Align investment and resources to high
growth markets; dispose/exit non-
strategic
areas
Differentiated asset strategy within
tighter geographic focus
Action Plan
Non-Strategic property and land sales |
 RELIABLE. ANSWERS.
2012 Duke Realty Corporation
Forward-Looking Statement
This slide presentation contains statements that constitute “forward-looking
statements” within the
meaning of the Securities Act of 1933 and the Securities Exchange Act of 1934 as
amended by the Private Securities Litigation Reform Act of 1995. These
forward-looking statements include, among others, our statements regarding
(1) strategic initiatives with respect to our assets, operations and capital and (2) the
assumptions underlying our expectations. Prospective investors are cautioned
that any such forward- looking statements are not guarantees of future
performance and involve risks and uncertainties, and that actual results may
differ materially from those contemplated by such forward-looking statements. A
number of important factors could cause actual results to differ
materially from those contemplated by
forward-looking statements in this slide presentation. Many of these
factors are beyond our ability to control or predict. Factors that could
cause actual results to differ materially from those contemplated in this
slide presentation include the factors set forth in our filings with the Securities and Exchange
Commission, including our annual report on Form10-K, quarterly reports on Form
10-Q and current reports on Form 8-K. We believe these
forward-looking statements are reasonable, however, undue reliance should
not be placed on any forward-looking statements, which are based on current expectations. We
do
not assume any obligation to update any forward-looking statements as a result of
new information or future developments or otherwise.
Certain of the financial measures appearing in this slide presentation are or may be
considered to be non- GAAP financial measures. Management believes that
these non-GAAP financial measures provide additional appropriate measures
of our operating results. While we believe these non-GAAP financial
measures are useful in evaluating our company, the information should be considered
supplemental in nature and not a substitute for the information prepared in
accordance with GAAP. We have provided for
your reference supplemental financial disclosure for these measures, including the
most directly comparable GAAP measure and an associated reconciliation in our
most recent quarter supplemental report, which is available on our website at
www.dukerealty.com. Our most recent quarter supplemental report also
includes the information necessary to recalculate certain operational ratios and ratios of
financial position. The calculation of these non-GAAP measures may differ
from the methodology used by other REITs, and therefore, may not be
comparable. 64 |