Attached files
| file | filename |
|---|---|
| 8-K - FORM 8-K - Lumos Networks Corp. | d353087d8k.htm |
 Company Presentation
May 2012
Exhibit 99.1 |
| 1
Use of Non-GAAP Financial Measures
Special Note Regarding Forward-Looking Statements
Any
statements
contained
in
this
presentation
that
are
not
statements
of
historical
fact,
including
statements
about
our
beliefs
and
expectations,
are
forward-looking
statements
and
should
be
evaluated
as
such.
The
words
“anticipates,”
“believes,”
“expects,”
“intends,”
“plans,”
“estimates,”
“targets,”
“projects,”
“should,”
“may,”
“will”
and similar words and expressions are intended to identify forward-looking statements.
Such forward-looking statements reflect, among other things, our current
expectations, plans and strategies, and anticipated financial results, all of which are subject to known
and unknown risks, uncertainties and factors that may cause our actual results to differ
materially from those expressed or implied by these forward- looking statements.
Many of these risks are beyond our ability to control or predict. Because of these risks, uncertainties and assumptions, you should not
place undue reliance on these forward-looking statements. Furthermore, forward-looking
statements speak only as of the date they are made. We do not undertake any obligation
to update or review any forward-looking information, whether as a result of new information, future events or otherwise.
Important factors with respect to any such forward-looking statements, including certain
risks and uncertainties that could cause actual results to differ from those contained
in the forward-looking statements, include, but are not limited to: rapid development and intense competition in the
telecommunications industry; our ability to achieve benefits from our separation from NTELOS
Holdings Corp.; our ability to successfully increase revenues and
manage
churn
in
the
recently
acquired
FiberNet
business;
our
ability
to
offset
expected
revenue
declines
in
our
RLEC
business
related
to
the
recent
regulatory developments and carriers grooming their networks; adverse economic conditions;
operating and financial restrictions imposed by our senior credit facility; our cash
and capital requirements; declining prices for our services; the potential to experience a high rate of customer turnover; federal
and state regulatory fees, requirements and developments; our reliance on certain suppliers
and vendors; and other unforeseen difficulties that may occur. These risks and
uncertainties are not intended to represent a complete list of all risks and uncertainties inherent in our business, and should be read
in conjunction with the more detailed cautionary statements and risk factors included in our
SEC filings, including our Annual Report filed on Form 10-K. Included
in
this
presentation
are
certain
non-GAAP
financial
measures
that
are
not
determined
in
accordance
with
US
generally
accepted
accounting
principles.
These
financial
performance
measures
are
not
indicative
of
cash
provided
or
used
by
operating
activities
and
exclude
the
effects
of
certain
operating,
capital
and
financing
costs
and
may
differ
from
comparable
information
provided
by
other
companies,
and
they
should
not
be
considered
in
isolation,
as
an
alternative
to,
or
more
meaningful
than
measures
of
financial
performance
determined
in
accordance
with
US
generally
accepted
accounting
principles.
These
financial
performance
measures
are
commonly
used
in
the
industry
and
are
presented
because
Lumos
Networks
Corp.
believes
they
provide
relevant
and
useful
information
to
investors.
The
Company
utilizes
these
financial
performance
measures
to
assess
its
ability
to
meet
future
capital
expenditure
and
working
capital
requirements,
to
incur
indebtedness
if
necessary,
and
to
fund
continued
growth.
Lumos
Networks
Corp.
uses
these
financial
performance
measures
to
evaluate
the
performance
of
its
business,
for
budget
planning
purposes
and
as
factors
in
its
employee
compensation
programs. |
 2
Enhancing efficiencies for our customers…
Lumos Networks provides next-
generation communication solutions
and personalized service to customers
in the Mid-Atlantic region, over an
advanced fiber network. |
 3
Our product strategy is to be first to offer next-generation products to customers in our
regional markets
Next-generation communication solutions
Metro Ethernet
•
Ethernet connectivity among multiple locations in the same city or region
•
Speeds ranging from 1.5 Mbps to 10 Gbps
IP Services
•
IP-enabled product offerings that combine voice and data services over a
dedicated broadband facility utilizing VoIP protocols
•
Enables advanced features and dynamic bandwidth allocation
Broadband
•
Dedicated
Internet
connections
–
up
to
10
Gbps
•
Broadband
XL
high
speed
Internet
over
fiber
–
10
to
20
Mbps
•
DSL over copper with speeds up to 6 Mbps
Wholesale Carrier Services
•
IP-based Ethernet transport over fiber
•
Fiber connectivity to cell sites for wireless carriers facilitates rapidly growing
demand for data, driven by 4G
•
High-bandwidth transport over copper
Flagship Products |
 4
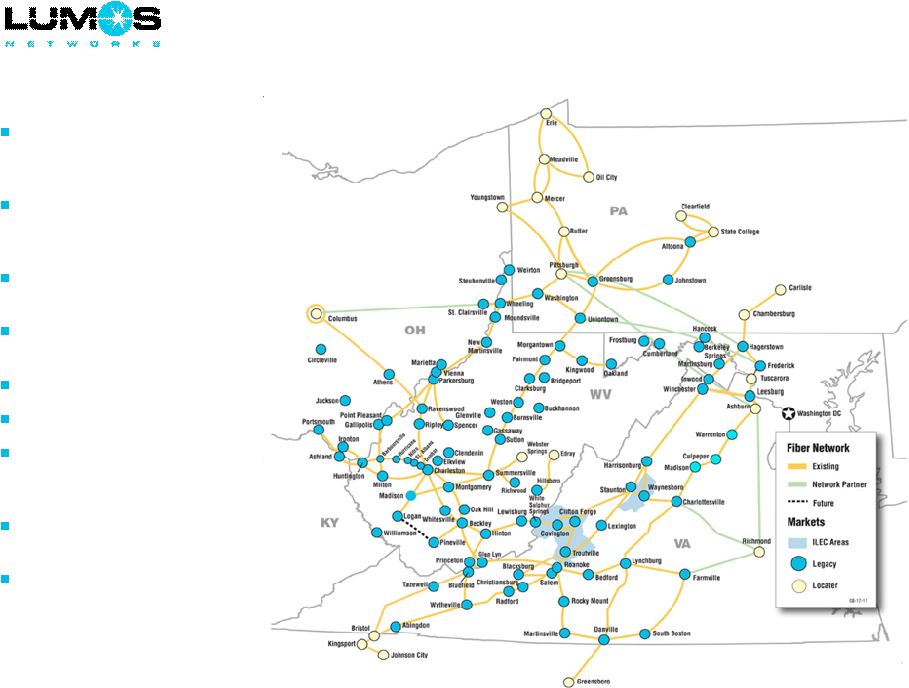
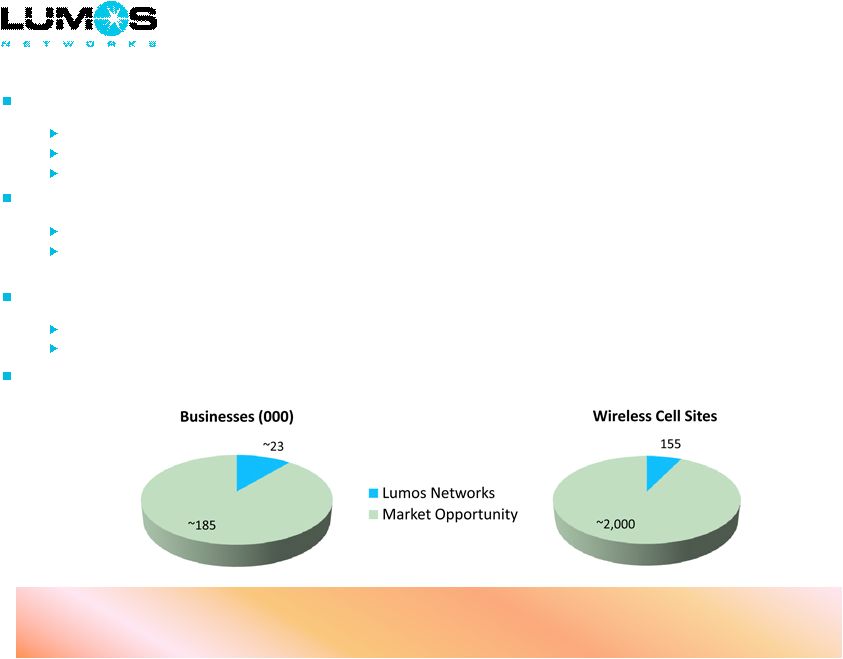
Provides service to more than
100 markets in Mid-Atlantic
region
Network footprint includes
approximately 185,000
businesses
Supports IP based and
Ethernet applications
Over 50,000 current
customer relationships
5,800 fiber route miles
State-of-the-art IP network
Approximately 2,000 cell sites
within three miles of existing
network
RLEC with 98% 6MB+
broadband coverage
Video and fiber passes
approximately one-third of
the RLEC base
Advanced, dense regional fiber network serves attractive markets
4 |
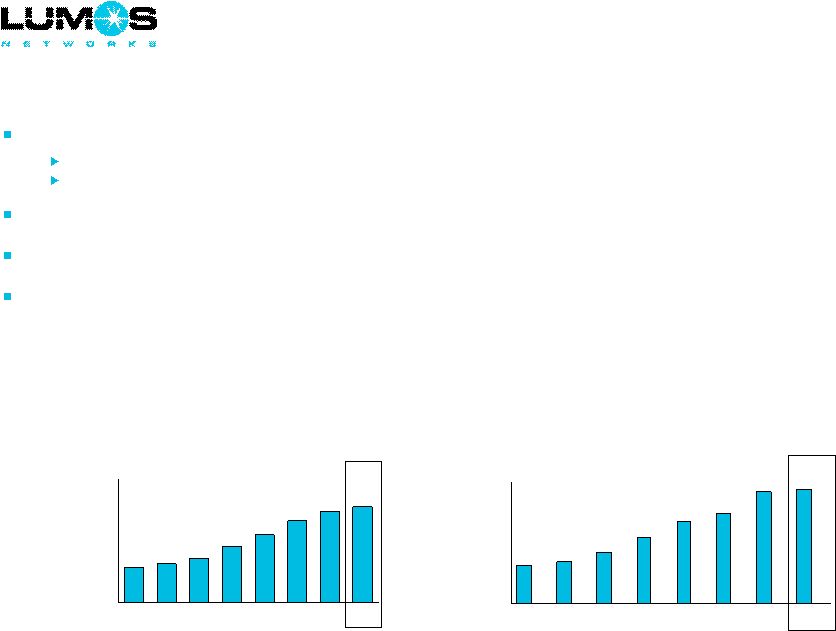 5
57
63
71
91
109
132
148
155
0
50
100
150
200
Q2-10
Q3-10
Q4-10
Q1-11
Q2-11
Q3-11
Q4-11
Q1-12
Fiber-Fed Cell Sites
687
705
752
830
903
949
1051
1066
500
600
700
800
900
1000
1100
Q2-10
Q3-10
Q4-10
Q1-11
Q2-11
Q3-11
Q4-11
Q1-12
On-Net Buildings
Network positioned for the future
Significant network investments (~$300 million) in previous 24 months
Enhancement
through
capital
expenditures;
Expansion
through
acquisitions
Ongoing
investments
to
support
growth
Connections to major data centers support exploding Cloud computing demand
Capacity to support significant market opportunity for on-net retail and wholesale
customer expansion Extensive rural fiber network footprint creates competitive
advantages allowing Lumos Networks to offer next-generation communication
products in regional markets |
 6
Brand positioning highlights our innovative services and commitment to provide support from
well- trained, dedicated and accessible employees
“Our technology comes with people”
Experienced direct sales and sales engineering teams in-market
Exceptional customer service
93% of calls answered in less than one minute
90% first-call resolution
Net Promoter scores in top tier across all industries
Strong long-term customer relationships
89% of key vertical account revenues in 2007 are still billing
80% of monthly recurring revenues of $1,000 or greater in 2007 are still billing
Experienced management team
Each member of operating management has 10 or more years of experience with wireline
business Key contributors to development of Competitive segment and transition to data
strategy Led execution and integration of recent acquisitions
|
 7
Leverage regional scale
Sell
advanced
data
services
to
recently-entered
Pennsylvania
and
West
Virginia
markets
Increase on-net buildings and expand reach in existing markets
Leverage sophisticated sales and sales engineering teams
Up-sell existing enterprise customers to capture growing data demand
Sell advanced services, including cloud computing and hosting
On-network profile facilitates growth of bandwidth and new applications with minimal
incremental investment
Aggressively pursue fiber-to-the-cell opportunities
Strong early-stage wireless carrier demand in footprint
Positioned for regional 4G deployment expected in 2012 and beyond
Expand footprint through organic edge-out and accretive acquisitions
Opportunities offer attractive returns as revenue density enhances capital
efficiency and on-network sales drive margin growth
Strategies for growth |
 8
Up-sell existing enterprise customers
•
2 locations -
Leased facilities and fiber
•
Primarily Voice Service
•
Monthly Recurring Revenue (MRR) = $2K
•
37 locations -
Primarily On-net locations
•
Voice Service + Metro Ethernet Network
•
Increased MRR to $65K
•
Capital investment = $1.0M
•
Payback ~ 18 months
Enterprise Case Study B
Healthcare Customer
Yesterday
Today
Today
Yesterday
•
Data circuits
•
Monthly Recurring Revenue (MRR) = $11K
•
Data circuits, Internet bandwidth, IP voice
and connection to major data center
•
Increased MRR to $29K
•
Capital investment = $100K
•
Payback ~ 7 months
Enterprise Case Study A
Education Customer |
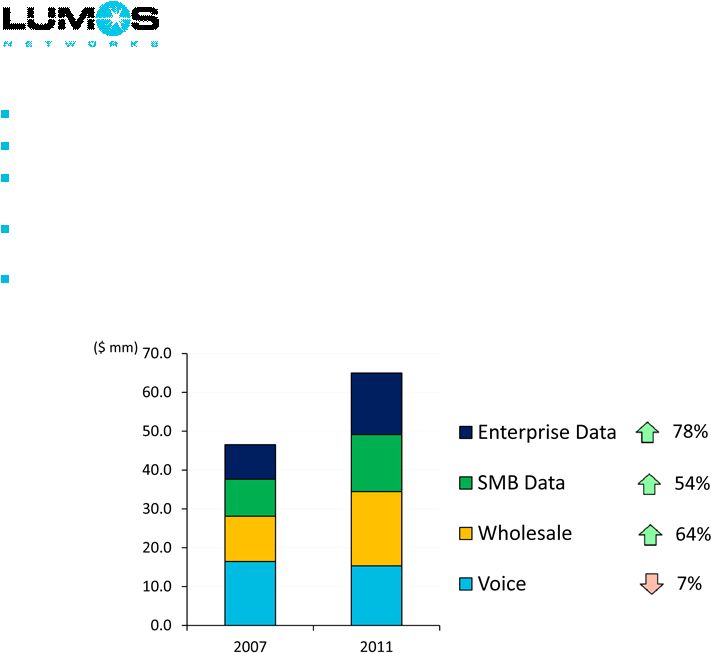
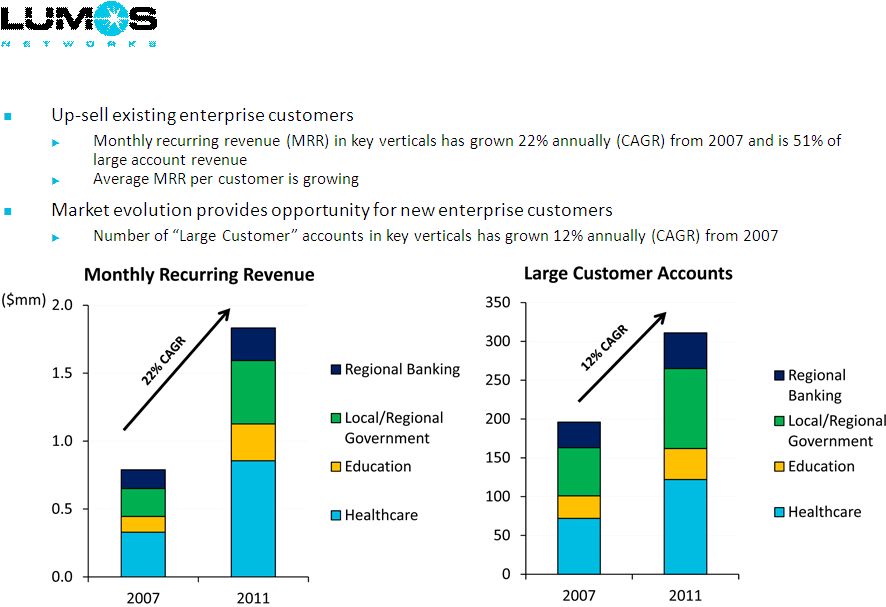 Double-digit enterprise growth trends in key verticals
9
Note:
Organic
growth,
excluding
acquisitions.
“Large
Customers”
are
defined
as
customers
with
$1,000
or
greater
MRR. |
 Fiber to the
cell site: High growth wholesale opportunity Approximately 2,000 sites within three
miles of existing network First customer provides a five-year payback and funds the
site Average of more than two carriers per site
Second and successive customers drive cash flow and margin
Long-term
growth
in
bandwidth
demand
and
additional
carriers
continue
to
enhance
returns
Illustrative Wireless Cell Site Economics
Average
Capital
Investment
$80K/site
One Carrier
Annual EBITDA:
$15K to $18K
Payback:
5 years
Two Carriers
Annual EBITDA:
$30K to $36K
Payback:
2 to 3 years
10
Three to Five
Carriers
Annual EBITDA:
$45K to $90K
Payback:
1 to 2 years
Contracts of 5 to 10 years and multiple carriers per site drive
long-term profitable revenue streams |
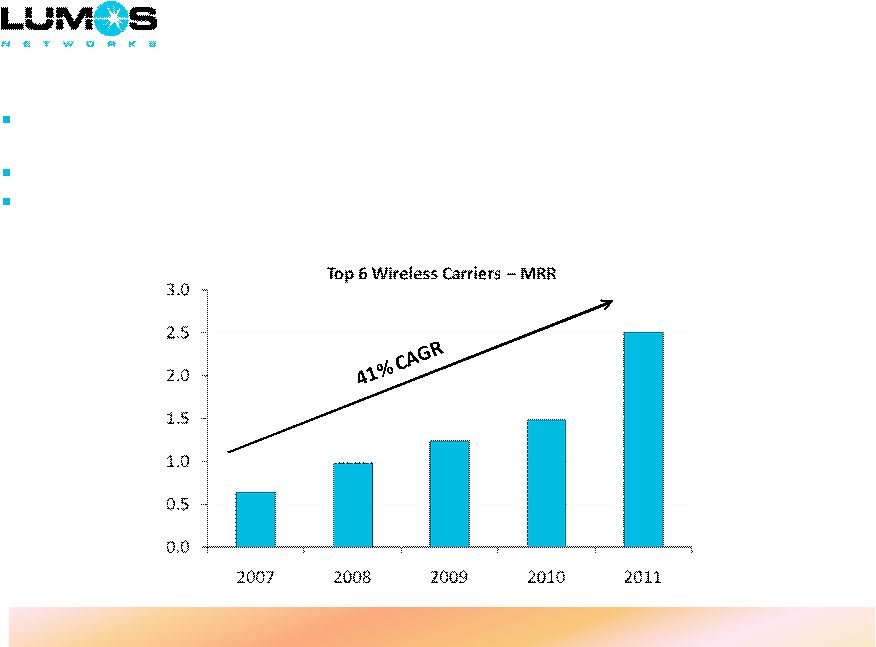 Wholesale
growth: Strong and accelerating with 4G Monthly
Recurring
Revenue
(MRR)
from
Top
6
wireless
carriers
has
grown
41%
annually
(CAGR)
from
2007 to 2011
Early-stage:
Significant
increases
in
demand
will
be
driven
by
future
4G
deployment
4G deployment in Lumos Networks region commenced in the second half of 2011 and is expected
through 2014
11
($mm)
Fiber connections expected to nearly double, reaching approximately 300 by year-end
2012 |
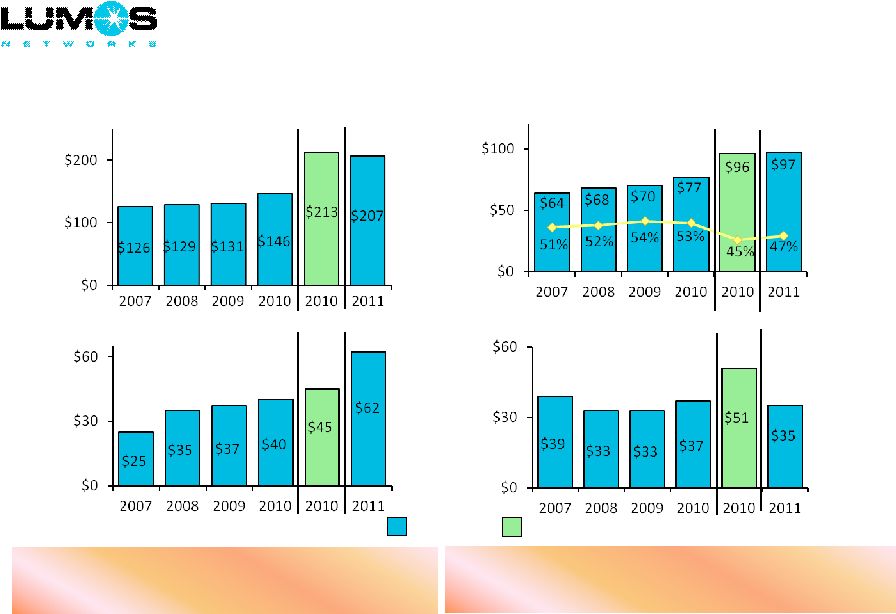 12
Strong margins and recurring free cash flow
($ in millions)
(1)
Pro forma 2010 includes FiberNet results from January 1, 2010.
(2)
Throughout this presentation, Free Cash Flow is defined as consolidated adjusted EBITDA less
CAPEX. (3)
2011 includes one-time capital expenditures related to the integration of FiberNet.
Free Cash Flow
(2)(3)
Total Revenue
Adj. EBITDA/Margin %
Capital Expenditures
(3)
Historical/Actual
Pro forma for FiberNet
Pro
forma
(1)
Pro
forma
(1)
Pro
forma
(1)
Pro
forma
(1)
2011 reflects post-acquisition network capital investments to
support market expansion and service offerings
Recurring cash flow stream to support dividend:
Unique among Competitive providers
Current annualized dividend of $12 million ($0.56 per share)
|
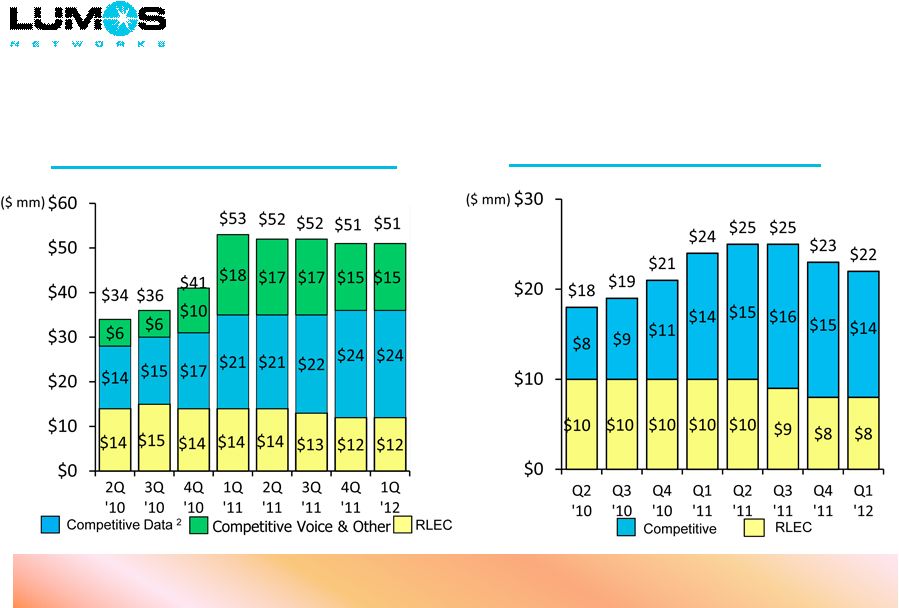 13
Adjusted EBITDA
(1)
Revenue
(1)
Operating strategy and acquisitions successfully shifting business mix
Data focus drives growth in the Competitive segment: 16% year over year data revenue growth ² RLEC access revenues impacted by Regulatory Reform and
continued network grooming by carriers
(1)
Reported results; not pro forma for acquisitions.
(2)
Includes
enterprise,
wholesale
and
SMB/residential
data;
1Q
2012
up
16%
over
1Q
2011. |
 14
Addressable market significantly increased
Recent network investments made to generate increasing returns in 2012 and beyond
IP voice products were launched into 30 new markets in 2011, an increase of 79% for the year;
two additional IP voice markets added YTD 2012
Metro Ethernet fiber ring reach now in 29 new markets; two additional to be added in the
second half of 2012
As markets mature, revenues grow with increased penetration and data demand
Early stages of revenue growth potential from acquisitions
Competitive
Revenues
-
Virginia |
 Capitalization
15
As of
March 31, 2012
($mm)
Cash and cash equivalents
$0.0
Restricted cash
7.2
$7.2
Revolver ($60 million total)
$ 6.1
Term Loan A
110.0
Term Loan B
199.0
315.1
Capital leases
1.9
Total Debt
$317.0
Total Debt / LTM Adjusted EBITDA
3.4x
Net Debt / LTM Adjusted EBITDA
3.4x
Available capital to support growth initiatives |
 Business
Outlook 16
Cash needs funded from operations
Actual
Low
High
Revenue
Competitive
$155
$159
$164
% of total revenue
75%
80%
80%
RLEC
$52
$41
$41
% of total revenue
25%
21%
20%
Total Revenue
$207
$200
$205
Adjusted EBITDA
$97
$85
$90
% of total revenue
47%
43%
44%
Capital Expenditures
$62
$52
$60
% of total revenue
30%
26%
29%
Free Cash Flow
(adjusted EBITDA less Capex)
$35
$33
$30
% of total revenue
17%
17%
15%
Cash Interest
$2
$13
$13
% of total revenue
1%
7%
6%
Cash Taxes
$1
$1
$1
% of total revenue
-
1%
0%
Dividends
$0
$12
$12
% of total revenue
-
6%
6%
Debt Repayment
$1
$2
$2
% of total revenue
-
1%
1%
Other Increase (Decrease)
$1
$3
$3
% of total revenue
-
2%
1%
Net Cash (before working capital)
$32
$8
$5 |
 17
Key Success Factors
Leveraging Network
Infrastructure
•
5,800 route-mile state-of-the-art fiber optic network
•
Unique regional footprint with attractive enterprise and wholesale markets
•
Position in multiple key vertical markets
Focus on Revenue Growth:
Data Opportunity
•
Continue innovative leadership position
•
Expand product offerings
•
Leverage up-sell opportunity of existing accounts
Solid Execution
•
Sales force expansion and productivity
•
Installation streamlining and productivity
•
Automated customer interfaces
Financial Performance
•
Adjusted EBITDA generation
•
Capital expenditure efficiency
•
Cash flow from operations
•
Return to shareholders |
 Appendix
****************** |
 19
Adjusted EBITDA Reconciliation
($ in millions)
2007
2008
2009
2010
2011
Operating Income (Loss)
$36
$39
$41
$41
($36)
Depreciation and Amortization
27
27
29
31
43
Equity Based Compensation
1
1
-
2
2
Asset Impairment Charge
-
-
-
-
86
Business Separation Charges
-
-
-
-
2
Acquisition Related Charges
-
-
-
3
-
Voluntary Retirement and Workforce Reduction Plans
-
1
-
-
-
Adjusted EBITDA
$64
$68
$70
$77
$97
Year Ended
6/30/2010
9/30/2010
12/31/2010
3/31/2011
6/30/2011
9/30/2011
12/31/2011
3/31/2012
Operating Income (Loss)
$10
$11
$9
$12
$13
$13
($75)
$12
Depreciation and Amortization
8
7
9
11
11
11
10
9
Equity Based Compensation
-
-
1
1
1
1
-
1
Asset Impairment Charge
-
-
-
-
-
-
86
-
Business Separation Charges
-
-
-
-
-
-
2
-
Acquisition Related Charges
-
1
2
-
-
-
-
-
Adjusted EBITDA
$18
$19
$21
$24
$25
$25
$23
$22
Three Months Ended |
 20
2012 Financial Guidance
1
(as of May 3, 2012)
($ in millions)
(1)
These estimates are based on management’s current expectations. These
estimates are forward-looking and actual results may differ materially. Please see “Special
Note from the Company Regarding Forward-Looking Statements" in the Lumos
Networks Corp. first quarter 2012 earnings release dated May 3, 2012.
(2)
Based on the mid-points of the above guidance ranges.
(3)
Represents the most recent cash dividend paid, annualized. Dividend payments
are reviewed quarterly by the board of directors and are subject to change.
(4)
Includes cash reimbursements received from Federal stimulus awards, which provide
50% funding to bring broadband services and infrastructure to Alleghany County,
Virginia partially offset by one-time severance benefits which were provided
for in the employment agreement of an executive officer. (5)
Before discretionary payments to the credit facility Revolver loan and changes to
working capital. Business Outlook ¹
Operating Revenues
50
$
to
51
$
200
$
to
205
$
Adjusted EBITDA
21
$
to
22
$
85
$
to
90
$
Capital Expenditures
52
$
to
60
$
Reconciliation of Operating Income to Adjusted EBITDA
Operating Income
9
$
to
10
$
42
$
to
44
$
Depreciation and amortization
9
38
to
40
Equity based compensation charges
3
5
to
6
Adjusted EBITDA
21
$
to
22
$
85
$
to
90
$
Projected Cash Flows for the Year 2012 ¹
Adjusted EBITDA ²
88
$
Less: Capital expenditures ²
(56)
32
Less:
Cash interest, net of interest income
(13)
Cash taxes
(1)
Cash flows, net, before dividends and debt payments
18
Less:
Cash dividends: $0.14 per share per quarter
3
(12)
Scheduled 2012 debt payments
(2)
Plus:
Other, net
4
3
Projected Cash Flows, net
5
7
$
Second Quarter 2012
2012 Annual |