Attached files
| file | filename |
|---|---|
| 8-K - FIRSTMERIT CORP /OH/ | a8kbarclayspresentation_05.htm |

London, England May 15, 2012 Barclays European Financial Services Conference

This presentation contains forward-looking statements relating to present or future trends or factors affecting the banking industry, and specifically the financial condition and results of operations, including without limitation, statements relating to the earnings outlook of the Corporation, as well as its operations, markets and products. Actual results could differ materially from those indicated. Among the important factors that could cause results to differ materially are interest rate changes, continued softening in the economy, which could materially impact credit quality trends and the ability to generate loans, changes in the mix of the Corporation's business, competitive pressures, changes in accounting, tax or regulatory practices or requirements and those risk factors detailed in the Corporation's periodic reports and registration statements filed with the Securities and Exchange Commission. The Corporation undertakes no obligation to release revisions to these forward-looking statements or reflect events or circumstances after the date of this release. Forward-looking Statement Disclosure 2

• Strong Platform Consistent quarterly profits Credit discipline Strong balance sheet Solid capital position • Franchise Positioned for Organic Growth Market leadership in core markets Opportunity to expand the franchise The FirstMerit Opportunity 3 Focused on Shareholder Returns

FirstMerit Overview • Headquarters: Akron, Ohio • Employees (FTE): 2,997 • Founded: 1845 • Assets: $14.7 Billion* 4th largest Ohio bank • Market Capitalization: $1.9 Billion** 41st largest U.S. bank • Ticker: FMER (NASDAQ) *Total Assets as of 3/31/12 ** Market Capitalization as of 4/26/12 Source: SNL Financial 4

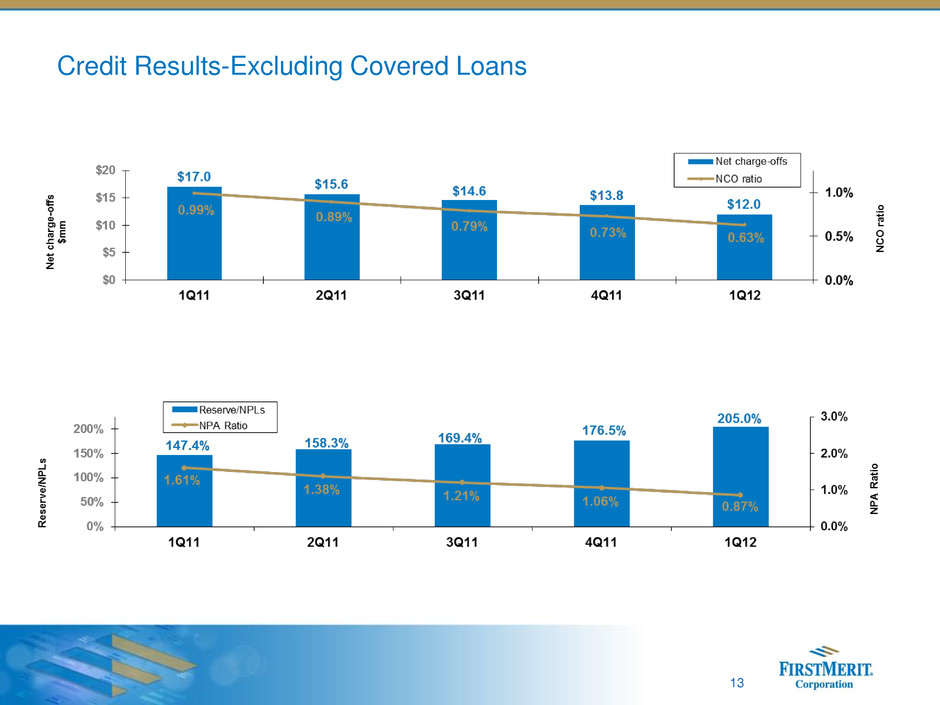
5 • 52nd consecutive quarter of profitability • Net income of $30.3 million/$0.28 per diluted share Return on average assets of 0.84% Return on average equity of 7.72% • Dividend of $0.16 per share • Solid asset quality trends compared with 4Q11, including $1.8 million, or 12.96%, decline in NCOs and $13.1 million, or 16.18% decline in NPAs NCO ratio at 0.63%, compared with 0.73% in 4Q11 NPA ratio at 0.87%, compared with 1.06% in 4Q11 • Average commercial loan growth of $93.6 million, or 1.85%, compared with 4Q11 • Average core deposit growth of $203.6 million, or 2.13%, compared with 4Q11 • Robust tangible common equity ratio of 7.86% at 3/31/12 1Q 2012 Highlights

Chicago Expansion

7 Assets: $415 million Deposits: $1.2 billion Branches: 24 February 2010 Assets: $420 million Deposits: $393 million Branches: 4 February 2010 Assets: $3.0 billion Deposits: $2.3 billion Branches: 26 May 2010 Building a Strategic Franchise in Chicago • Successful integration Seamless conversion of three franchises in 2010 Smooth transition from announcement to conversion Experienced project management team executing integration process • Positions FirstMerit for long term growth 3rd largest MSA in U.S. – provides dense population and positive growth demographics Favorable competitive dynamics in the small business and middle market banking areas

Paul Greig, CEO Bill Richgels, CCO Peter Gillespie, Regional President Chicago market experience Years JPMorgan Chase / Bank One / First Chicago NBD American National Bank FNW Bancorp First Midwest Bank Continental Illinois National Bank First Bank JPMorgan Chase / Bank One / First Chicago NBD American National Bank NBD 29 years 25 years 21 years Experienced Leadership Team with Chicago Roots Charter One Bank JPMorgan Chase / Bank One / First Chicago NBD American National Bank 8

Chicago franchise Chicago MSA franchise demographics * Positions FirstMerit’s Franchise for Organic Growth • Branch network conveniently located across greater Chicago MSA • Market provides organic growth opportunities $394mm in Commercial loans originated in 2011 Population (2010) 9,739,919 Households (2010) 3,500,698 Projected population growth (’10-’15) 1.86% Median household income (2010) $65,796 Projected household income growth (’10-’15) 16.57% Source: SNL Financial 9

Financial Performance

History of Superior Performance Continued in 2011 2011 FirstMerit Peers 3.84% 3.72% 0.85% 1.73% 0.82% 0.66% 7.72% 5.79% 2010 FirstMerit Peers Net Interest Margin 3.97% 3.70% Net Charge-Offs/ Average Loans 1.23% 2.29% ROAA 0.76% 0.25% ROAE 7.82% 2.51% Source: SNL Financial Peer Group Includes: Huntington, Associated, Fulton Financial, TCF Financial, Citizens Banking, Park National, First Commonwealth Financial, Old National, MB Financial and FNB 11 Financial Performance Relative to Peers

12 • Primary focus of entire management team and organization • Aligned incentives • Hired Chief Credit Officer and added other key personnel • Active internal focus on credit quality • Ongoing comprehensive internal and external review of portfolio • Implementing initiatives for ongoing credit improvement Actions to Sustain Improved Performance Source: SNL Financial. Peer Group Includes: Huntington, Associated, Fulton Financial, TCF Financial, Citizens Banking, Park National, First Commonwealth Financial, Old National, MB Financial and FNB. Figures shown are simple averages. 0.40% 0.68% 1.22% 1.23% 0.85% 0.43% 0.98% 2.00% 2.29% 1.73% 0.00% 0.50% 1.00% 1.50% 2.00% 2.50% 2007 2008 2009 2010 2011 Net C harge -offs FMER Peers Credit Quality Initiatives Leads to Superior Credit Quality

13 Credit Results-Excluding Covered Loans

FMER 3/31/12 Peers 3/31/12 Net charge-offs/ Average Loans Allowance for Credit Losses/ Nonperforming Loans NPAs & 90+PD/ Loans and REO 0.63% 205% 0.87% 0.84% 78% 3.52% Balance Sheet Strength Source: SNL Financial-based on available 1Q12 data as of 5/2/12 Peer Group Includes: Huntington, Associated, Fulton Financial, TCF Financial, Citizens Banking, Park National, First Commonwealth Financial, Old National, MB Financial and FNB 14 Quarter-end

3.74% 3.66%3.71% 3.76%3.73%3.74%3.70%3.73% 3.80%3.78% 3.68% 3.58%3.58%3.62%3.61% 3.66%3.60% 3.69% 3.78%3.82% 3.53%3.56% 3.61%3.64% 3.72% 4.02%3.96% 4.14% 4.00% 3.77% 3.75% 3.85% 3.78% 0% 1% 2% 3% 4% 5% NIM FedFunds* Margin Stability *Source: Bloomberg 15 Margin Historical Performance* • Net interest margin stability throughout volatile interest rate cycle

16 Proven Core Deposit Growth Strategies Average Core Deposits* Average Total Deposits ($ in millions) *Core deposits include all deposits less certificates of deposit

17 Investment Portfolio Summary Investment Portfolio Composition* Book Yield and Duration* *Other: FHLB/FRB stock and Trups *as of 3/31/12

Growth Opportunities

FirstMerit Value Proposition • Local delivery of relationship banking Regional structure supports close client relationship Institutionalization of key relationships with regional CEOs • Local decision making Access to decision makers/senior management Credit authority appropriate to regions Enables prompt response on credit decisions • Strong sales and service orientation Motivated and empowered bankers • Consultative, agile and efficient approach to banking Product parity with larger bank competitors • Deep community involvement Local advisory boards 19

20 • Strong management experience (avg. 25 yrs) • Diverse customer base • Strong customer service model • Strong deposit gathering abilities • $6.3 billion loan portfolio* • High ROE small business banking unit • Middle market, business banking, CRE, asset based lending, public funds, card services- merchant, capital markets, treasury management, skilled care, dealer services, SBA Commercial Banking: Superior Service Model Overview • Awarded “Outstanding” rating for performance under the Community Reinvestment Act Service Awards and Ratings • 2011 Greenwich Associates Small Business Banking Excellence Award winner for Financial Stability and Treasury Management – Customer Service. Also recognized for Treasury Management – Overall Satisfaction in the Midwest for Middle Market Banking *as of 3/31/12

21 Commercial Loan Portfolio* Average Commercial Loans Commercial Loan Composition ($ in millions) * Excluding covered loans, commercial loan composition as of 3/31/12

22 • Concentrated branch network 205 branches in Ohio, Western Pa. and Chicago #1 Market Share in Akron #2 Market Share in Canton • Customer Service Culture • Full Suite of Traditional Retail Banking Products Profitable Merchant, Debit and Credit Card Businesses Consumer Banking: Broad Services and Customer Satisfaction • Awarded highest customer satisfaction in Ohio by JD Power & Associates in 2012 6th consecutive year • Providing Strong Results 5.5% increase in total checking account balances over 2010 #1 in Ohio Overview Committed to Superior Service

23 • Strong Complement with Owner-Managed Business • High ROE Business • Assets under management and administration: $6.1bn • Loans: $221mm • Deposits: $705mm • Expansive Product Suite Investment management Estate and succession planning Private banking (credit/deposit services) Trust services Financial and tax planning Insurance services Brokerage services Employee benefits (401-k, Pension) Wealth Management: Comprehensive Array of Services • Cross-Selling Initiatives with Commercial / Consumer Banking Strong customer retention tool Focused on capturing customer liquidity events 29.0% 31.7% 37.0% 41.0% 43.5% 2Q08 4Q08 2Q09 4Q10 4Q11 % of commercial customers using wealth management services * Assets under administration and management , average loans and average deposits as of 3/31/12 Overview* Wealth Penetration

24 (dollars in thousands) March 31, 2012 December 31, 2011 March 31, 2011 Consolidated Total Equity $ 1,584,105 10.80% $ 1,565,953 10.84% $ 1,519,957 10.51% Common Equity 1,584,105 10.80% 1,565,953 10.84% 1,519,957 10.51% Tangible common equity (a) 1,116,304 7.86% 1,097,670 7.86% 1,050,045 7.50% Tier 1 capital (b) 1,136,705 11.55% 1,119,892 11.48% 1,074,020 11.68% Total risk-based capital (c) 1,260,064 12.80% 1,242,177 12.73% 1,189,389 12.94% Leverage (d) 1,136,705 8.16% 1,119,892 7.95% 1,074,020 7.81% (a) Common equity less all intangibles; computed as a ratio to total assets less intangible assets. (b) Shareholders’ equity less goodwill; computed as a ratio to risk adjusted assets, as defined in the 1992 risk based capital guidelines. (c) Tier 1 capital plus qualifying loan less allowance, computed as a ratio to risk adjusted assets as defined in the 1992 risk based capital guidelines. (d) Tier 1 capital computed as a ratio to the latest quarter’s average assets less goodwill. Solid Capital Position

Efficiency Initiative Update • Process began in November of 2011 All employees asked to submit ideas to enhance efficiency of organization • Over 4,000 submissions 13 key employees selected to work with outside consultant to review and select best concepts Best ideas presented to executive management team • Implementation commences during 2Q12 Anticipated cumulative annualized run-rate savings of $15mm in 2012 and $30mm in 2013 25

Efficiency Initiative Ideas • Proactive steps to confront industry challenges Current/future legislative environment Low rate environment Economic environment Declining level of branch traffic • 341 ideas selected 26

Efficiency Initiative Actions 27 Area Number of Ideas Positions Eliminated* Impact (mm) Examples • Eliminate assistant branch manager position • Increase teller staffing flexibility • Eliminate redundant regional leadership positions • Reduce branch geographic overlap • Combine/eliminate the statement printing • Consolidate retail support call centers • Strategic sourcing methodology • Renegotiate vendor services • Reduce temporary help • Insource a portion of the attorney function for managed assets • Replace non-billable ABL field examiners • 15% of the total ideas • 89% of the total positions eliminated • 86% of the total impact • 85% of the total ideas • 11% of the total positions eliminated • 14% of the total impact Span of Control 25 241.0 $15.9 Total 341 338.0 $30.0 Subtotal 50 299.5 $25.7 Other Ideas 291 38.5 $4.3 Duplication 15 75.0 $5.0 Insourcing 3 (15.5) $1.1 Procurement 7 (1.0) $3.6 *negative numbers in red indicate positions added

• Strong Platform Consistent quarterly profits Credit discipline Strong balance sheet Solid capital position • Franchise Positioned for Organic Growth Market leadership in core markets Opportunity to expand the franchise The FirstMerit Opportunity 28 Focused on Shareholder Returns
