Attached files
U.S. SECURITIES AND EXCHANGE COMMISSION
Washington, D.C. 20549
FORM 10-Q
(Mark One)
| x |
QUARTERLY REPORT PURSUANT TO SECTION 13 OR 15(d) OF THE SECURITIES EXCHANGE ACT OF 1934 FOR THE QUARTERLY PERIOD ENDED MARCH 31, 2012
|
| OR | |
| o |
TRANSITION REPORT PURSUANT TO SECTION 13 OR 15(d) OF THE SECURITIES EXCHANGE ACT OF 1934
|
Commission File Number 000-51151
ENERGIZER RESOURCES INC.
(Name of registrant in its charter)
|
Minnesota
|
20-0803515
|
|
|
(State or other jurisdiction of
incorporation or organization)
|
(I.R.S. Employer
Identification No.)
|
520 – 141 Adelaide Street West, Toronto, Ontario M5H 3L5
(Address of principal executive offices)
_______________________
(416) 364-4911
(Issuer’s telephone number)
_______________________
Securities registered under Section 12(b) of the Exchange Act:None
Securities registered under Section 12(g) of the Exchange Act: Common Stock, $0.001 par value per share
(Title of Class)
Indicate by check mark whether the registrant (1) has filed all reports required to be filed by Section 13 or 15 (d) of the Securities Exchange Act of 1934 during the preceding 12 months (or for such shorter period that the registrant was required to file such reports), and (2) has been subject to such filing requirements for the past 90 days.
Yes x No o
Indicate by check mark whether the registrant has submitted electronically and posted on its corporate Web site, if any, every Interactive Data File required to be submitted and posted pursuant to Rule 405 of Regulation S-T (§232.405 of this chapter) during the preceding 12 months (or for such shorter period that the registrant was required to submit and post such files). Yes o No x
Indicate by check mark whether the registrant is a large accelerated filer, an accelerated filer, a non-accelerated filer or a smaller reporting company.
| Large accelerated filer o | Accelerated Filer o |
| Non-accelerated filer o | Smaller reporting company x |
| (Do Not Check if a Smaller Reporting Company) |
Indicate by check mark whether the registrant is a shell company (as defined in Rule 12b-2 of the Exchange Act).Yes o No x
As of May 14, 2012, there were 156,697,178 shares of the Registrant's common stock issued and outstanding.
Transitional Small Business Disclosure Format Yes o No x
1

Energizer Resources Inc.
| PART I - FINANCIAL INFORMATION | ||
|
Item 1.
|
Consolidated Financial Statements (unaudited) including:
|
3
|
|
Consolidated Balance Sheets
|
||
|
Consolidated Statements of Operations and Comprehensive Loss
|
||
|
Consolidated Statements of Cash Flows
|
||
|
Notes to the Consolidated Financial Statements
|
||
|
Item 2.
|
Management Discussion & Analysis of Financial Condition and Results of Operations
|
15
|
|
Item 3
|
Quantitative and Qualitative Disclosures About Market Risk
|
47
|
|
Item 4.
|
Controls and Procedures
|
47
|
| PART II - OTHER INFORMATION | ||
|
Item 1.
|
Legal Proceedings
|
48
|
|
Item 1a
|
Risk Factors
|
48
|
|
Item 2.
|
Unregistered Sales of Equity Securities and Use of Proceeds
|
55
|
|
Item 3.
|
Defaults Upon Senior Securities
|
55
|
|
Item 4.
|
Mine Safety Disclosures
|
55
|
|
Item 5
|
Other information
|
56
|
|
Item 6.
|
Exhibits
|
56
|
|
CERTIFICATIONS
|
|
|
Exhibit 31 – Management certification
|
58-59
|
|
Exhibit 32 – Sarbanes-Oxley Act
|
60-61
|
2
PART 1
FINANCIAL INFORMATION
As used in this annual report, “we”, “us”, “our”, “Energizer Resources”, “Energizer”, “Company” or “our Company” refers to Energizer Resources Inc. and all of its subsidiaries.
ITEM 1.INTERIM CONSOLIDATED FINANCIAL STATEMENTS AND NOTES
General
The accompanying reviewed interim unaudited consolidated financial statements have been prepared in accordance with the instructions to Form 10-Q. Therefore, they do not include all information and footnotes necessary for a complete presentation of financial position, results of operations, cash flows, and stockholders' equity in conformity with generally accepted accounting principles applicable in the United States of America. Except as disclosed herein, there has been no material change in the information disclosed in the notes to the consolidated financial statements included in our Company's annual report on Form 10-K for the year ended June 30, 2011. In the opinion of management, all adjustments considered necessary for a fair presentation of the results of operations and financial position have been included and all such adjustments are of a normal recurring nature. Operating results for the period ended March 31, 2012 are not necessarily indicative of the results that can be expected for the year ending June 30, 2012.
All references to “dollars”, “$” or “US$” are to United States dollars and all references to “CAD$” are to Canadian dollars. United States dollar equivalents of Canadian dollar figures are based on the exchange rate as reported by the Bank of Canada on the applicable date.
3
ENERGIZER RESOURCES INC.
(An Exploration Stage Company)
Unaudited Condensed Consolidated Interim Financial Statements
For the nine month period ended March 31, 2012
(Expressed in US Dollars)
4
Energizer Resources Inc.
(An Exploration Stage Company)
Unaudited Condensed Consolidated Interim Balance Sheets
(Expressed in US Dollars)
|
March 31, 2012
(Unaudited)
|
June 30, 2011
(Audited)
|
|||||||
|
Assets
|
||||||||
|
Current Assets:
|
||||||||
|
Cash and cash equivalents
|
$ | 1,169,726 | $ | 4,536,275 | ||||
|
Dual currency deposits (note 5)
|
— | 8,031,076 | ||||||
|
Amounts receivable and prepaid expenses (note 6)
|
485,580 | 135,392 | ||||||
|
Marketable securities (note 7)
|
3,505,587 | 40,403 | ||||||
|
Tax credits recoverable
|
— | 12,073 | ||||||
|
Loan to related party (note 6)
|
257,523 | — | ||||||
|
Total current assets
|
5,418,416 | 12,755,219 | ||||||
|
Equipment (note 4)
|
— | 6,667 | ||||||
|
Total assets
|
$ | 5,418,416 | $ | 12,761,886 | ||||
|
Liabilities and Stockholders' Equity
|
||||||||
|
Liabilities
|
||||||||
|
Current Liabilities:
|
||||||||
|
Accounts payable and accrued liabilities (note 6)
|
$ | 749,102 | $ | 689,857 | ||||
|
Derivative liability
|
— | 12,619 | ||||||
|
Total liabilities
|
749,102 | 702,476 | ||||||
|
Stockholders' Equity
|
||||||||
|
Common stock, 350,000,000 shares authorized, $0.001 par value,156,697,178 issued and outstanding (June 30, 2011 -146,197,178) (note 9)
|
156,697 | 146,197 | ||||||
|
Additional paid-in capital
|
69,673,556 | 63,998,735 | ||||||
|
Donated capital
|
20,750 | 20,750 | ||||||
|
Accumulated comprehensive loss
|
(39,336 | ) | (32,432 | ) | ||||
|
Accumulated deficit during exploration stage
|
(65,142,353 | ) | (52,073,840 | ) | ||||
|
Total stockholders' equity
|
4,669,314 | 12,059,410 | ||||||
|
Total liabilities and stockholders' equity
|
$ | 5,418,416 | $ | 12,761,886 | ||||
The accompanying notes are an integral part of these condensed consolidated interim unaudited financial statements.
5
Energizer Resources Inc.
(An Exploration Stage Company)
Unaudited Condensed Consolidated Interim Statements of Operations and Comprehensive Loss
(Expressed in US Dollars)
|
March 1, 2004
(date of inception) to
March 31, 2012
|
For the nine months
ended March 31,
|
For the three months
ended March 31,
|
||||||||||||||||||
|
2012
|
2011
|
2012
|
2011
|
|||||||||||||||||
|
Revenues
|
$ | — | $ | — | $ | — | $ | — | $ | — | ||||||||||
|
Expenses
|
||||||||||||||||||||
|
Stock-based compensation (notes 6,9 and 10)
|
22,668,884 | 3,631,321 | 237,710 | 1,513,530 | — | |||||||||||||||
|
Mineral exploration expense (note 8)
|
21,945,630 | 3,277,674 | 1,106,906 | 1,117,823 | 196,961 | |||||||||||||||
|
Impairment loss on mineral properties (note 7)
|
11,358,637 | 3,770,129 | — | — | — | |||||||||||||||
|
General and administrative (note 6)
|
6,100,380 | 1,061,596 | 973,753 | 153,496 | 366,145 | |||||||||||||||
|
Professional and consulting fees
|
5,078,701 | 1,380,506 | 883,046 | 700,549 | 332,607 | |||||||||||||||
|
Depreciation
|
61,919 | 6,667 | 6,667 | 2,223 | 2,223 | |||||||||||||||
|
Donated services and expenses
|
18,750 | — | — | — | — | |||||||||||||||
|
Foreign currency translation (gain)/loss
|
(956,836 | ) | 14,859 | (67,826 | ) | (89,083 | ) | (48,501 | ) | |||||||||||
|
Total expenses
|
66,276,065 | 13,142,752 | 3,140,256 | 3,398,538 | 849,435 | |||||||||||||||
|
Net loss from operations
|
(66,276,065 | ) | (13,142,752 | ) | (3,140,256 | ) | (3,398,538 | ) | (849,435 | ) | ||||||||||
|
Other Income
|
||||||||||||||||||||
|
Investment income / (loss)
|
829,859 | 74,239 | 27,047 | 45,656 | 27,011 | |||||||||||||||
|
Other income
|
303,853 | — | — | — | — | |||||||||||||||
|
Net loss
|
(65,142,353 | ) | (13,068,513 | ) | (3,113,209 | ) | (3,352,882 | ) | (822,424 | ) | ||||||||||
|
Unrealized (loss) gain from investments in marketable securities
|
(45,180 | ) | (6,904 | ) | (2,530 | ) | 10,000 | 8,575 | ||||||||||||
|
Comprehensive loss
|
$ | (65,187,533 | ) | $ | (13,075,417 | ) | $ | (3,115,739 | ) | $ | (3,342,882 | ) | $ | (813,849 | ) | |||||
|
Loss per share - basic and diluted (note 12)
|
$ | (0.09 | ) | $ | (0.03 | ) | $ | (0.02 | ) | $ | (0.01 | ) | ||||||||
|
Weighted average shares outstanding - basic and diluted
|
149,243,214 | 117,577,323 | 154,001,134 | 132,084,283 | ||||||||||||||||
The accompanying notes are an integral part of these condensed consolidated interim unaudited financial statements.
6
Energizer Resources Inc.
(An Exploration Stage Company)
Unaudited Condensed Consolidated Interim Statements of Cash Flows
(Expressed in US Dollars)
|
March 1, 2004
(date of inception) to
|
For the nine months
ended March 31,
|
|||||||||||
|
March
31, 2012
|
2012
|
2011
|
||||||||||
|
Operating Activities
|
||||||||||||
|
Net loss
|
$ | (65,142,353 | ) | $ | (13,068,513 | ) | $ | (3,113,209 | ) | |||
|
Adjustments to reconcile net loss to net cash used in operating activities:
|
||||||||||||
|
Depreciation
|
61,919 | 6,667 | 6,667 | |||||||||
|
Donated services and expenses
|
20,750 | — | — | |||||||||
|
Non-cash proceeds received
|
(74,000 | ) | — | — | ||||||||
|
Dual currency deposits
|
72,095 | 90,551 | — | |||||||||
|
Impairment loss on mineral properties
|
11,358,637 | 3,770,129 | — | |||||||||
|
Stock-based compensation
|
22,668,884 | 3,631,321 | 237,710 | |||||||||
|
Issuance of shares and warrants for services rendered
|
168,100 | — | 168,100 | |||||||||
|
Change in operating assets and liabilities:
|
||||||||||||
|
Amounts receivable and prepaid expenses
|
(135,392 | ) | (350,188 | ) | (55,601 | ) | ||||||
|
Accounts payable and accrued liabilities
|
749,928 | 59,245 | (70,537 | ) | ||||||||
|
Tax credits recoverable
|
(245,186 | ) | 12,073 | — | ||||||||
|
Non-cash portion of marketable securities
|
(55,497 | ) | (55,834 | ) | — | |||||||
|
Government grants received
|
245,186 | — | — | |||||||||
|
Unrealized foreign exchange (loss)/gain in operating assets and liabilities
|
— | — | (13,496 | ) | ||||||||
|
Net cash used in operating activities
|
(30,306,929 | ) | (5,904,549 | ) | (2,840,366 | ) | ||||||
|
Financing Activities
|
||||||||||||
|
Proceeds from issuance of common stock, net
|
38,099,105 | 635,000 | 13,217,120 | |||||||||
|
Exercise of warrants and stock options
|
955,500 | 69,000 | 464,200 | |||||||||
|
Government grants received
|
— | — | 22,903 | |||||||||
|
Net cash provided by financing activities
|
39,054,605 | 704,000 | 13,704,223 | |||||||||
|
Investing Activities
|
||||||||||||
|
Mineral property acquisition costs
|
(3,419,973 | ) | (2,420,129 | ) | — | |||||||
|
Purchase of property and equipment
|
(61,918 | ) | — | — | ||||||||
|
Investment in dual currency deposits
|
(32,938,800 | ) | (24,938,800 | ) | — | |||||||
|
Redemption of dual currency deposits
|
32,867,078 | 32,867,078 | — | |||||||||
|
Loan to related party
|
(256,014 | ) | (256,014 | ) | — | |||||||
|
Purchases of marketable securities
|
(3,418,135 | ) | (3,418,135 | ) | — | |||||||
|
Net cash (used in) provided by investing activities
|
(7,227,762 | ) | 1,834,000 | — | ||||||||
|
Increase (decrease) in cash and cash equivalents
|
1,519,914 | (3,366,549 | ) | 10,863,857 | ||||||||
|
Cash and cash equivalents - beginning of period
|
— | 4,536,275 | 2,505,480 | |||||||||
|
Cash and cash equivalents - end of period
|
$ | 1,169,726 | $ | 1,169,726 | $ | 13,369,337 | ||||||
|
Non-cash investing and financing activities:
|
||||||||||||
|
Issuance of common stock for mineral properties
|
$ | 5,190,500 | $ | 1,350,000 | $ | — | ||||||
|
Issuance of common stock
& warrants for services
|
$ | 5,811,125 | $ | 0 | $ | 168,000 | ||||||
|
Supplemental Disclosures:
|
||||||||||||
|
Interest received
|
$ | 817,442 | $ | 61,822 | $ | — | ||||||
|
Taxes received
|
$ | 12,507 | $ | — | $ | 12,507 | ||||||
The accompanying notes are an integral part of these condensed consolidated interim unaudited financial statements.
7
Energizer Resources Inc.
(An Exploration Stage Company)
Notes to Unaudited Condensed Consolidated Interim Financial Statements
For the nine month period ended March 31, 2012
(Expressed in US Dollars)
|
1.
|
Exploration Stage Company
|
Energizer Resources Inc. (the "Company") was incorporated in the State of Nevada, United States of America on March 1, 2004 and reincorporated in the State of Minnesota on May 14, 2008. The Company is an Exploration Stage Company, as defined by ASC Topic-915, "Development Stage Entities". The Company's principal business is the acquisition and exploration of mineral resources. During fiscal 2008, the Company incorporated Energizer Resources (Mauritius) Ltd. (formerly Uranium Star (Mauritius) Ltd.), a Mauritius subsidiary and Energizer Resources Madagascar Sarl, a Madagascar subsidiary. During fiscal 2009, the Company incorporated THB Venture Ltd., a Mauritius subsidiary to hold the interest in Energizer Resources Minerals Sarl, a Madagascar subsidiary, which holds the Madagascar properties. During fiscal 2012, the Company incorporated Madagascar-ERG Joint Venture (Mauritius) Ltd., a Mauritius subsidiary and is in the process of incorporating ERG Madagascar Sarl, a Madagascar subsidiary. ERG (Madagascar) Sarl will be 100% owned by Madagascar-ERG Joint Venture (Mauritius) Ltd. which is owned 75% by Energizer Resources (Mauritius) Ltd. The Company has not yet fully determined whether its properties contain mineral reserves that are economically recoverable.
These condensed consolidated interim financial statements have been prepared on a going concern basis, which assumes that the Company will continue to realize its assets and discharge its liabilities in the normal course of business. The Company has yet to generate revenue from mining operations or pay dividends and is unlikely to do so in the immediate or foreseeable future. The continuation of the Company as a going concern is dependent upon the continued financial support from its shareholders, the ability of the Company to obtain necessary equity financing to continue operations, and the attainment of profitable operations. As at March 31, 2012, the Company has accumulated losses of $65,142,353. These condensed consolidated interim financial statements do not include any adjustments to the recoverability and classification of recorded asset amounts and classification of liabilities that might be necessary should the Company be unable to continue as a going concern.
2. Significant Accounting Policies
Principals of Consolidation and Basis of Presentation
These condensed consolidated interim financial statements are presented in accordance with accounting principles generally accepted in the United States ("U.S. GAAP"), and are expressed in US dollars. These condensed consolidated interim financial statements include the accounts of Energizer Resources Inc. and its wholly-owned subsidiaries, Energizer Resources (Mauritius) Ltd., THB Ventures Ltd, Energizer Resources Madagascar Sarl, and Energizer Resources Minerals Sarl. In addition, these condensed consolidated interim financial statements include the Company's 75% interest in Madagascar-ERG Joint Venture (Mauritius) Ltd. and its subsidiary ERG (Madagascar) Sarl. All inter-company balances and transactions have been eliminated on consolidation. The Company's fiscal year end is June 30.
Condensed Consolidated Interim Financial Statements
These condensed consolidated interim financial statements have been prepared on the same basis as the annual financial statements and should be read in conjunction with those annual financial statements filed on Form 10-K for the year ended June 30, 2011. In the opinion of management, these condensed consolidated interim financial statements reflect adjustments, necessary to present fairly the Company's financial position, results of operations and cash flows for the periods shown. The results of operations for such periods are not necessarily indicative of the results expected for a full year or for any future period.
Fair Value of Financial Instruments Hierarchy
ASC Topicñ820 establishes a fair value hierarchy that prioritizes the inputs used to measure fair value. The hierarchy gives the highest priority to unadjusted quoted prices in active markets for identical assets or liabilities (Level 1) and the lowest priority to unobservable inputs (Level 3). Cash and cash equivalents and marketable securities that the Company held were in Level 1 and dual currency deposits were in Level 2 within the fair value hierarchy. The three levels are as follows:
8
Energizer Resources Inc.
(An Exploration Stage Company)
Notes to Unaudited Condensed Consolidated Interim Financial Statements
For the nine month period ended March 31, 2012
(Expressed in US Dollars)
2. Significant Accounting Policies - continued
Fair Value of Financial Instruments Hierarchy - continued
Level 1 - Quoted prices are available in active markets for identical assets or liabilities as of the reporting date. Active markets are those in which transactions for the asset or liability occur in sufficient frequency and volume to provide pricing information on an ongoing basis. Level 1 includes marketable securities such as listed equities and U.S. government treasury securities.
Level 2 - Pricing inputs are other than quoted prices in active markets included in Level 1, which are either directly or indirectly observable as of the reporting date. Level 2 includes those financial instruments that are valued using industry-standard models or other valuation methodologies. These models consider various assumptions, including quoted forward prices for commodities, time value, volatility factors, current market and contractual prices for the underlying instruments as well as other relevant economic measures. Substantially all of these assumptions are observable in the marketplace throughout the term of the instrument, can be derived from observable data or are supported by observable levels at which transactions are executed in the marketplace. Instruments in this category include dual currency deposits, over the counter forwards, options and repurchase agreements.
Level 3 - Pricing inputs include significant inputs that are generally less observable from objective sources. These inputs may be used with internally developed methodologies that result in management's best estimate of fair value from the perspective of a market participant. Level 3 instruments include those that may be more structured or otherwise tailored to customers' needs. At each balance sheet date, the Company performs an analysis of all instruments subject to ASC Topic-820 and includes in Level 3 all of those whose fair value is based on significant unobservable inputs.
3. Recent Accounting Pronouncements Affecting The Company
The following are recent FASB accounting pronouncements which may have an impact on the Company's future condensed consolidated interim unaudited financial statements.
|
·
|
"Comprehensive Income (Topic 220): Presentation of Comprehensive Income": ("ASU 2011-05") was issued during June 2011. FASB issued guidance regarding the presentation of Comprehensive Income within financial statements. The guidance was effective for interim and annual periods beginning after December 15, 2011.
|
|
·
|
"Intangibles - Goodwill and Other (Topic 350): Testing Goodwill for Impairment": ("ASU 2011-08") was issued during September 2011. FASB issued guidance on how to determine whether goodwill amounts on the balance sheet have been impaired. The guidance was effective for annual periods beginning after December 15, 2011 and interim periods within those years.
|
|
·
|
"Comprehensive Income (Topic 202): Deferral of the Effective date for Amendments to the Presentation of Reclassification of Items Out of Accumulated Other Comprehensive Income in Accounting Standards Update No 2011-05": ("ASU 2011-12") was issued during December 2011. FASB provides clarification and guidance relating to the effects of reclassifications of amounts out of accumulated other comprehensive income and into net income. The guidance is effective for annual periods beginning after December 15, 2011 and interim periods within those years.
|
|
·
|
"Balance Sheet (Topic 201): Disclosures about Offsetting Assets and Liabilities": ("ASU 2011-11") was issued during December 2011. FASB issued guidance on how to determine whether it is appropriate to offset or net certain assets and liabilities on the balance sheet and the additional disclosure that this entails. The guidance is effective annual periods beginning on or after January 1, 2013.
|
The adoption of the Topic 220, Topic 350 and Topic 202 did not have a material impact on the Company's condensed consolidated interim financial statements. The Company is currently evaluating its impact of Topic 201 on these condensed consolidated interim financial statements.
9
Energizer Resources Inc.
(An Exploration Stage Company)
Notes to Unaudited Condensed Consolidated Interim Financial Statements
For the nine month period ended March 31, 2012
(Expressed in US Dollars)
4. Equipment
All of the Company's fixed assets were fully depreciated as of March 31, 2012 (June 30, 2011: $6,667). For the nine month period ended March 31, 2012, depreciation expense totaled $6,667 (March 31, 2011: $6,667).
5. Dual Currency Deposits
On March 31, 2012, the Company held a total of $nil (June 30, 2011: $8,000,000) with a Canadian bank in short term dual currency deposits ("DCD"), representing $nil (June 30, 2011: $4,000,000).
The Company invests in dual currency deposits ("DCD") under which it contracts to a foreign exchange strike rate at the inception of the contract. If the spot rate is less than the strike rate on the day of maturity, the Company will receive money in the invested currency. Conversely, if the spot rate is greater than the strike rate, the Company will receive money in the underlying currency and recognize a foreign exchange loss.
The Company uses this form of deposit to increase the interest rate, and hence its return, on its deposits and because it makes payments to vendors in both US dollars and Canadian dollars. Because of this, the Company is somewhat indifferent as to whether the deposit is returned in Canadian dollars or US dollars. This investment poses a greater risk when compared to investing excess cash in liquid and low risk money market deposits due to the fact that the movement in the underlying foreign exchange rates is uncertain.
6. Related Party Transactions and Balances
Parties are considered to be related if one party has the ability, directly or indirectly, to control the other party or exercise significant influence over the other party in making operating and financial decisions. Parties are also considered to be related if they are subject to common control or common significant influence. Related parties may be individuals or corporate entities. A transaction is considered to be a related party transaction when there is a transfer of resources or obligations between related parties. Related party transactions that are in the normal course of business and have commercial substance are measured at the exchange amount.
The following are the related party transactions for the nine month period ended March 31, 2012:
|
a)
|
The Company incurred a total of $59,550 (March 31, 2011: $48,810) in office administration and rent expense from a company related by common management.
|
|
b)
|
9,420,000 (March 31, 2011: 1,100,000) stock options were issued to related parties during the period with exercise prices between $0.20 and $0.30. These stock options which were valued at $2,145,231 (March 31, 2011: $237,710) were issued to directors, officers and relatives of directors.
|
|
c)
|
The Company incurred $595,446 (March 31, 2011: $576,315) in administrative, management and consulting fees to directors, officers and relatives of directors.
|
|
d)
|
The Company incurred $134,834 (March 31, 2011: $Nil) in charges from an mining and engineering firm to which one of the Company's directors serves as a senior officer and a director for.
|
The following are the related party balances as of for the nine month period ended March 31, 2012:
|
a)
|
Related party balances of $Nil (June 30, 2011: $168,000) were included in accounts payable and accrued liabilities and $34,319 (June 30, 2011: $Nil) in prepaid expenses.
|
|
b)
|
The Company has recorded a short-term loan to a related party totaling $257,523 (June 30, 2011: $Nil). This loan is interest bearing and is expected to be paid back in full within the next 12 months.
|
10
Energizer Resources Inc.
(An Exploration Stage Company)
Notes to Unaudited Condensed Consolidated Interim Financial Statements
For the nine month period ended March 31, 2012
(Expressed in US Dollars)
7. Marketable Securities
Marketable securities consist of available-for-sale securities over which the Company does not have significant influence or control. These investments included $3,471,587 (June 30, 2011: $Nil) invested in a monthly income bond fund and $34,000 (June 30, 2011: $40,403) invested in TSX-Venture entities.
8. Mineral Properties
Green Giant Property, Madagascar, Africa
On August 22, 2007, the Company entered into a joint venture agreement with Madagascar Minerals and Resources Sarl ("MMR"), a Madagascar incorporated company. The joint venture was established with the Company owning a 75% interest and MMR owning a 25% interest in the Green Giant Property. In order to acquire the 75% interest, the Company paid a total of $765,000, issued 1,250,000 common shares and 500,000 now expired share purchase warrants. Further, on December 10, 2007, the Company issued 1,250,000 common shares valued at $375,000 and 500,000 now expired share purchase warrants. As it has not yet determined whether the property has probable or proven reserves, the Company recognized an impairment loss during fiscal 2008 totaling $1,200,560 which represented the total cash paid and the value of common shares and share purchase warrants issued.
On July 9, 2009, the Company entered into an agreement with MMR to acquire the remaining 25% interest for $100,000. At this point the joint venture with MMR was terminated. MMR retains a 2% net smelter return (“NSR”). The NSR on this 25% portion can be acquired by the Company for $500,000 in cash or common shares for the first 1% and at a price of $1,000,000 in cash or common shares for the second 1% at the Company's option.
Malagasy Joint Venture Ground, Madagascar, Africa
On December 14, 2011, the Company entered into a Definitive Joint Venture Agreement (“JVA”) with Malagasy Minerals Limited (“Malagasy”) (Australian Stock Exchange: MGY) to acquire a 75% interest to explore and develop a defined group of industrial minerals (which includes graphite, vanadium as well as approximate 25 other minerals). Malagasy will retain its 25% interest. The new land position covers an area totaling 2,119 research permits and 827.7 square kilometres. This land portfolio is mainly adjacent to the south and east of the Company's Green Giant Property in the country of Madagascar. Under the terms of the JVA, the Company paid Malagasy a total of $2,261,690 and issued 7,500,000 of the Company's shares valued at $1,350,000. Malagasy has a free carried interest until the Company delivers a Bankable Feasibility Study (“BFS”). Upon the delivery of a BFS, Malagasy will be required to contribute its 25% interest in the development and mining operations. Should either party's interest subsequently fall below 10%, their position will be diluted to a 2% NSR. As it has not yet determined whether the property has probable or proven reserves, the Company recognized an impairment loss during fiscal 2012 totaling $3,770,129 which represented the total cash paid and the value of common shares issued as well as legal and other professional fees paid.
Sagar Property -Romanet Horst, Labrador Trough, Quebec, Canada
The Company holds 219 claims located in northern Quebec, Canada which were acquired from Virginia Mines Inc. ("Virginia") on May 2, 2006. Virginia retains a 2% NSR on the ground.
11
Energizer Resources Inc.
(An Exploration Stage Company)
Notes to Unaudited Condensed Consolidated Interim Financial Statements
For the nine month period ended March 31, 2012
(Expressed in US Dollars)
9. Common Stock
|
a)
|
On July 2, 2010, the Company issued 500,000 common share purchase warrants valued at $78,100 to a company who assisted the with the Company's in listing on the TSX Venture Exchange. The share purchase warrants were valued using the Black-Scholes pricing model with the following assumptions: risk free interest rate - 1.54%; expected volatility - 172%; dividend yield - NIL; and expected life - 4 years.
|
|
b)
|
On October 21, 2010, the Company issued 1,100,000 stock options to a director of the Company valued at $237,710. The stock options, which vested immediately, were valued using the Black-Scholes pricing model with the following assumptions: risk free interest rate - 1.54%; expected volatility - 172%; dividend yield - NIL; and expected life - 4 years.
|
|
c)
|
On December 17, 2010, the Company issued 200,000 shares of common stock valued at $90,000 pursuant to a contract with a party to provide advisory services in China.
|
|
d)
|
During January and February 2011, the Company closed a private placement of 30,936,654 units for gross proceeds of $13,921,495. Each unit consisted of one common share and one half of one common share purchase warrant. Each of the 15,468,327 warrants issued can be used to purchase one common share at an exercise price of $0.75 for two years from the date of issue. In connection with the private placement, the Company paid $704,115, TSX-V fees of $38,411 and 1,564,700 compensation warrants. The compensation warrant entitles the holder to acquire one unit at $0.45 per unit and expire on February 25, 2013.
|
|
e)
|
During the year ended June 30, 2011, the Company issued 4,549,500 shares of common stock for consideration of $886,500. The shares were issued pursuant to the exercise of several share purchase warrants.
|
|
f)
|
On July 1, 2011, the Company issued 5,175,000 stock options to directors, officers and consultants of the Company valued at $1,364,648. The stock options were valued using the Black-Scholes pricing model with the following assumptions: risk free interest rate - 1.95%; expected volatility - 137%; dividend yield - NIL; and expected life - 5 years. These stock options vested on the grant date.
|
|
g)
|
On October 24, 2011, the Company issued 1,850,000 stock options to directors, officers and consultants of the Company valued at $321,530. The stock options were valued using the Black-Scholes pricing model with the following assumptions: risk free interest rate - 1.60%; expected volatility - 133%; dividend yield - NIL; and expected life - 5 years. These stock options vested on the grant date.
|
|
h)
|
On December 16, 2011, the Company issued 2,365,000 stock options to directors, officers and consultants of the Company valued at $431,613. The stock options were valued using the Black-Scholes pricing model with the following assumptions: risk free interest rate - 1.60%; expected volatility - 133%; dividend yield - NIL; and expected life - 5 years. These stock options vested on the grant date.
|
|
i)
|
On December 16, 2011, the Company issued 7,500,000 shares of common stock at $0.18 per share valued at $1,350,000 as consideration for the Joint Venture Agreement with Malagasy Minerals Ltd.
|
|
j)
|
On March 4, 2012, the Company issued 460,000 shares of common stock for consideration of $69,000. The shares were issued pursuant to the exercise of stock options.
|
|
k)
|
On March 7, 2012, the Company issued 6,275,000 stock options to directors, officers and consultants of the Company valued at $1,513,530. The stock options were valued using the Black-Scholes pricing model with the following assumptions: risk free interest rate - 1.00%; expected volatility - 131%; dividend yield - NIL; and expected life - 5 years. These stock options vested on the grant date.
|
|
l)
|
On March 25, 2012, the Company closed a private placement with DRA Minerals Inc whereby it raised a total of $635,000 by issuing 2,540,000 common stock at $0.25 per share.
|
12
Energizer Resources Inc.
(An Exploration Stage Company)
Notes to Unaudited Condensed Consolidated Interim Financial Statements
For the nine month period ended March 31, 2012
(Expressed in US Dollars)
10. Stock Options
On March 9, 2006, the Company filed a Form S-8 registration statement in connection with its newly adopted 2006 Stock Option Plan (the “2006 Plan”) allowing for the direct award of shares or granting of stock options to acquire up to a total of 2,000,000 common shares. On December 18, 2006, February 16, 2007, July 11, 2007, September 29, 2009, May 3, 2011 and March 1, 2012 the 2006 Plan was amended to increase the stock option pool by a total of 25,000,000 additional common shares.
The following table summarizes the continuity of the Company's stock options, all of which vest on the grant date:
|
Number
of Options
|
Weighted-Average
Exercise Price ($)
|
||||||
|
Outstanding and exercisable, June 30, 2010
|
13,620,000
|
0.30
|
|||||
|
Granted
|
1,100,000
|
0.25
|
|||||
|
Cancelled
|
(590,000
|
)
|
0.57
|
||||
|
Outstanding and exercisable, June 30, 2011
|
14,130,000
|
0.29
|
|||||
|
Granted
|
15,665,000
|
0.27
|
|||||
|
Exercised
|
(460,000
|
)
|
0.15
|
||||
|
Expired
|
(2,475,000
|
)
|
0.15
|
||||
|
Cancelled
|
(3,300,000
|
)
|
0.31
|
||||
|
Outstanding and exercisable, March 31, 2012
|
23,560,000
|
0.29
|
|||||
The following is a summary stock options outstanding as of March 31, 2012:
|
Exercise
|
Number of
|
Expiry
|
||||||||
|
Price ($)
|
Stock Options
|
Date
|
||||||||
|
0.15
|
2,395,000
|
July 11, 2012
|
||||||||
|
0.35
|
750,000
|
September 2, 2013
|
||||||||
|
0.40
|
5,350,000
|
May 11, 2014
|
||||||||
|
0.30
|
4,575,000
|
July 1, 2016
|
||||||||
|
0.20
|
1,850,000
|
October 24, 2016
|
||||||||
|
0.21
|
2,365,000
|
December 1, 2016
|
||||||||
|
0.28
|
6,275,000
|
March 7, 2017
|
||||||||
|
0.29
|
23,560,000
|
13
Energizer Resources Inc.
(An Exploration Stage Company)
Notes to Unaudited Condensed Consolidated Interim Financial Statements
For the nine month period ended March 31, 2012
(Expressed in US Dollars)
11. Warrants
The following table summarizes the continuity of the Company's warrants:
|
Number
of Warrants
|
Exercise
Price ($)
|
||||||
|
Outstanding, June 30, 2010
|
31,889,667
|
0.41
|
|||||
|
Granted
|
17,737,028
|
0.70
|
|||||
|
Exercised
|
(4,549,500
|
)
|
0.19
|
||||
|
Expired
|
(511,500
|
)
|
0.20
|
||||
|
Outstanding, June 30, 2011
|
44,565,695
|
0.55
|
|||||
|
Expired
|
(946,000
|
)
|
0.37
|
||||
|
Outstanding, March 31, 2012
|
43,619,695
|
0.56
|
The following is a summary warrants outstanding as of March 31, 2012:
|
Exercise
|
Number of
|
Expiry
|
||||||||
|
Price ($)
|
Warrants
|
Date
|
||||||||
|
0.75
|
15,468,328
|
January 28, 2013 - February 25, 2013
|
||||||||
|
0.45
|
1,564,700
|
February 25, 2013
|
||||||||
|
0.50
|
870,000
|
March 15, 2013
|
||||||||
|
0.30
|
400,000
|
March 15, 2013
|
||||||||
|
0.15
|
3,650,000
|
April 26, 2013
|
||||||||
|
0.50
|
21,666,667
|
May 5, 2013
|
||||||||
|
43,619,695
|
12. Loss Per Share
Basic and diluted loss per share is computed using the weighted average number of common stock outstanding. Diluted loss per share and the weighted average number of shares of common stock exclude all potentially dilutive shares since their effect is anti-dilutive. As at March 31, 2012, there were a total of 67,179,695 (March 31, 2011: 61,318,695) potentially dilutive stock options and warrants outstanding.
14
ITEM 2. MANAGEMENT’S DISCUSSION AND ANALYSIS OF FINANCIAL CONDITION AND RESULTS OF OPERATIONS
Certain statements included in this Form 10-Q, including, without limitation, statements related to anticipated cash flow sources and uses, and words including but not limited to “anticipates”, “believes”, “plans”, “expects”, “future” and similar statements or expressions, identify forward looking statements. Examples of forward-looking statements include, but are not limited to: (a) projections of our revenues, capital expenditures, growth, prospects, dividends, capital structure and other financial matters; (b) statements of our plans and objectives; (c) statements of our future economic performance; (d) statements of assumptions underlying other statements and statements about us and our business relating to the future; and (e) any statements using the words "believes," "budget," "target," "goal," "anticipate," "expect," "plan," "outlook," "objective," "may," "project," "intend," "estimate," or similar expressions. Any forward-looking statements herein are subject to certain risks and uncertainties in the business of Energizer Resources Inc. including but not limited to, planned capital expenditures, potential increases in prospective production costs, future cash flows and borrowings, pursuit of potential acquisition opportunities, the possibility that the industry may be subject to future regulatory or legislative actions (including additional taxes, changes in environmental regulation, changes in Madagascar French civil law and traditional Malagasy law, and disclosure requirements under the Dodd-Frank Wall Street Reform and Consumer Protection Act), our financial position, business strategy and other plans, objectives for future operations, difficulties of hiring or retaining key personnel and any changes in current accounting rules, all of which may be beyond the control of our Company. Our actual results could differ materially from those anticipated in these forward-looking statements as a result of certain factors, including those set forth therein.
Management’s Discussion and Analysis of Results of Financial Condition and Results of Operations (“MD&A”) should be read in conjunction with our financial statements included herein. Further, this quarterly report on Form 10-Q should be read in conjunction with our Financial Statements and Notes to Financial Statements included in ourfiscal 2011 Annual Report on Form 10-K for the year ended June 30, 2011, filed with the Securities and Exchange Commission on September 28, 2011.Our actual results could differ materially from those anticipated by the forward-looking statements due to important factors and risks including, but not limited to, those set forth under “Risk Factors” in Part I, Item 1A of our Annual Report on Form 10-K filed with the Securities and Exchange Commission on September 28, 2011.
Our financial statements have been prepared in accordance with United States generally accepted accounting principles. We urge you to read this report in conjunction with the risk factors described herein.
BACKGROUND
Company Overview
Energizer Resources Inc. was incorporated in the State of Nevada with the name Uranium Star Corp on March 1, 2004 and reincorporated in the State of Minnesota on May 14, 2008. On December 16, 2009, we changed our name from Uranium Star Corp to Energizer Resources Inc.Our fiscal year-end is June 30.
During fiscal 2008, we incorporated Energizer Resources (Mauritius) Ltd, a Mauritius subsidiary and Energizer Resources Madagascar Sarl, a Madagascar subsidiary. During fiscal 2009, we incorporated THB Venture Ltd., a Mauritius subsidiary to hold the interest in Energizer Resources Minerals Sarl, a Madagascar subsidiary, which holds the Madagascar properties. During fiscal 2012, we incorporated Madagascar-ERG Joint Venture (Mauritius) Ltd, a Mauritius subsidiary and ERG Madagascar Sarl, a Madagascar subsidiary. ERG (Madagascar) Sarlis 100% owned by Madagascar-ERG Joint Venture (Mauritius) Ltd., which is owned 75% by Energizer Resources (Mauritius) Ltd.
We have not had any bankruptcy, receivership or similar proceeding since incorporation. Except as described below, there have been no material reclassifications, mergers, consolidations or purchases or sales of any significant amount of assets not in the ordinary course of business since the date of incorporation.
Summary of Our Business
We are an exploration stage company engaged in the search for vanadium, graphite, uranium, gold and other minerals. We have an interest in properties located in the African country of Madagascar and Canada (Province of Québec). None of the properties in which we hold an interest have known mineral reserves of any kind at this time. As such, the work programs planned by us are exploratory in nature.
Our executive offices are currently located at 520–141 Adelaide Street West, Toronto, Ontario, Canada M5H 3L5. Our telephone number is (416) 364-4911. We maintain a website at www.energizerresources.com (which website is expressly not incorporated by reference into this filing).These offices are leased on a month-to-month basis, and our monthly rental payments are approximately CAD$5,000.
15
UNTIL WE CAN VALIDATE OTHERWISE, THE PROPERTIES OUTLINED BELOW HAVE NO KNOWN MINERAL RESERVES OF ANY KIND AND WE ARE PLANNING PROGRAMS THAT ARE EXPLORATORY IN NATURE.
Further details regarding our properties, although not incorporated by reference, including the comprehensive geological report prepared in compliance with Canada’s National Instrument 43-101 on our Green Giant Property (formerly the Three Horses Property in Madagascar) and our Sagar property in Northern Quebec can be found on our company’s website: www.energizerresources.com (which website is expressly not incorporated by reference into this filing) or in our filings on www.sedar.com(which website is expressly not incorporated by reference into this filing). The websites referred to above are expressly not incorporated by reference into this filing.
Properties
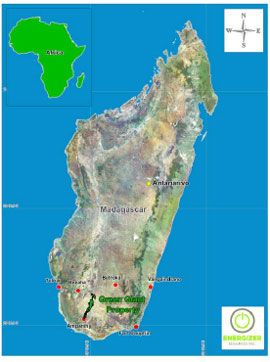
Madagascar Properties
Green Giant Property, Madagascar
On August 22, 2007, we acquired a 75% interest in approximately 225 sq. kilometres of mineral research permits in the District of Toliara, Madagascar. This interest is held by a limited liability company that was formed under the laws of Madagascar which held a 75% interest in the property. The remaining 25% interest was held by Madagascar Minerals and Resources Sarl. On July 9, 2009, we acquired the remaining 25% interest in the property and now hold a 100% interest in the property.
Joint Venture Ground, Madagascar
On December 14, 2011, as reported in our current report on Form 8-K, filed with the Securities and Exchange Commission on December 15, 2011, we entered into a Definitive Joint Venture Agreement (“JVA”) with Malagasy Minerals Limited (“Malagasy”) (Australian Stock Exchange: MGY (“MGY”)) to acquire a 75% interest to explore and develop a defined group of industrial minerals. Our company will manage the exploration operations for the industrial minerals on this ground.
Canadian Properties
Sagar Property – Romanet Horst, Labrador Trough, Québec, Canada
On May 2, 2006, we signed a letter of intent for an option to acquire a 75% interest in 200 claims located in northern Quebec, Canada. The vendor had the right and option to sell the remaining 25% interest in the property. This agreement was subject to a NSR (“net smelter return”). The vendor had previously acquired a 100% interest in the property, subject to a 1% NSR on certain claims, and a 0.5% NSR on other claims.
Further details on exploration programs carried out on the properties can be found below.
Competitive Conditions in our Industry
The mineral exploration and mining industry is competitive in all phases of exploration, development and production. We compete with a number of other entities and individuals in the search for, and acquisition of, attractive mineral properties. As a result of this competition, the majority of which is with companies with greater financial resources than us, we may not in the future be able to acquire attractive properties on terms our management considers acceptable. Furthermore, we compete with other resource companies, many of whom have greater financial resources and/or more advanced properties that are better able to attract equity investments and other capital. Factors beyond our control may affect the marketability of minerals mined or discovered by us.
Employees
As of March 31, 2012, we had nil total employees and nil full-time employees. We engage consultants to serve as officers and to perform professional, geological and administrative functions for us.
16
MADAGASCAR PROPERTIES
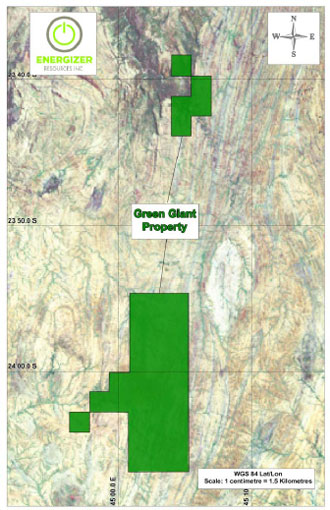
Green Giant Property Description and Location
The Green Giant Property is comprised of 6 mineral permits. The properties are located in the District of Toliara and are referenced as TN 12,306,P(R); TN 12,814, P(R); TN 12,887 P(R); TN 12,888 P(R); TN 13,020 P(R); TN 13,021 P(R) as issued by the Bureau de Cadastre Minier de Madagascar (“BCMM”) pursuant to the Mining Code 1999 (as amended) and its implementing decrees. The total land position is 225 sq.kilometres. This property can be accessed by both air and road.
17
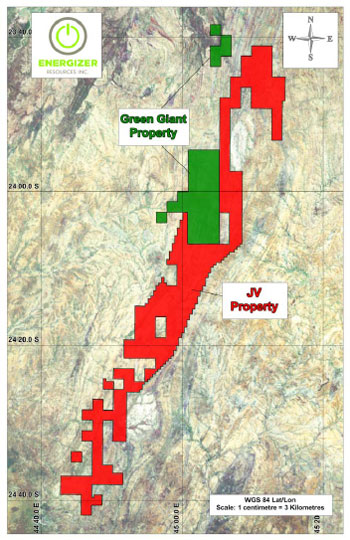
Joint Venture Property Description and Location
The “Joint Venture Property” is comprised of a portion of or all of 39 mineral permits. The properties are located in the District of Toliara and are referenced as TN 3,432,P(R); TN 5,394, P(R); TN 13,064 P(R); TN 13,811 P(R); TN 14,619 P(R); TN 14,620 P(R); TN 14,622 P(R); TN 14,623 P(R);TN 16,747 P(R); TN 16,753 P(R); TN 19,003 P(R); TN 19,851 P(R); TN 19,932 P(R); TN 19,934 P(R); TN 19,935 P(R); TN 21,059 P(R); TN 21,060 P(R); TN 21,061 P(R); TN 21,062 P(R); TN 21,063 P(R); TN 21,064 P(R); TN 24,864 P(R); TN 25,605 P(R); TN 25,606 P(R); TN 28,340 P(R); TN 28,346 P(R); TN 28,347 P(R); TN 28,348 P(R); TN 28,349 P(R); TN 28,352 P(R); TN 28,353 P(R); TN 29,020 P(R); TN 31,734 P(R); TN 31,735 P(R); TN 38,323 P(R); TN 38,324 P(R); TN 38,325 P(R); TN 38,392 P(R); and TN 38,469 P(R) as issued by the Bureau de Cadastre Minier de Madagascar (“BCMM”) pursuant to the Mining Code 1999 (as amended) and its implementing decrees. The total land position is 827.7 sq.kilometres. This property can be accessed by both air and road.
Agreements
Green Giant Property
On August 22, 2007, we entered into a joint venture agreement with Madagascar Minerals and Resources Sarl (“MMR” or “Madagascar Minerals”), a company incorporated under the laws of Madagascar. The joint venture was operated through a Madagascar limited liability company in which our company held 75% undivided interest and MMR held the remaining 25% undivided interest.
The consideration paid to MMR to acquire the 75% stake in the joint venture consisted of: (i) cash consideration totaling $765,000; and (ii) the issuance of 1,250,000 of our common shares and 500,000 now expired common share purchase warrants.
On July 9, 2009, we entered into an agreement to acquire the remaining 25% interest of the Green Giant Property for $100,000. Upon our acquisition of the remaining 25%, the joint venture was terminated. MMR retains a 2% NSR. We can acquire the NSR on this 25% interest portion at a price of $500,000 in cash or common shares for the first 1% and at a price of $1,000,000 in cash or common shares for the second 1% at our option.
18
Joint Venture Ground, Madagascar, Africa
On December 14, 2011, we entered into a Definitive Joint Venture Agreement (“JVA”) with Malagasy to acquire a 75% interest to explore and develop a defined group of industrial minerals (as noted below). Malagasy retains a 25% interest in the exploration and development of the define group of industrial minerals. The new land position covers an area totaling 2,119 research permits and 827.7 square kilometres. This land portfolio is mainly adjacent to the south and east of the Green Giant Property. Under the terms of the JVA, we paid Malagasy $2,261,690 and issued 7,500,000 of our common shares. Malagasy has a free carried interest until we deliver a Bankable Feasibility Study (“BFS”). Upon the delivery of a BFS, Malagasy will be required to contribute its 25% interest in the development and mining operations. Should either party’s interest subsequently fall below a 10% interest, their position will be diluted to a 2% NSR.
The industrial minerals within the agreements are as follows: Vanadium, Lithium, Aggregates, Alunite, Barite, Bentonite, Vermiculite, Carbonatites, Corundum, Dimensional stone (excluding labradorite), Feldspar (excluding labradorite), Fluorspar, Granite, Graphite, Gypsum, Kaolin, Kyanite, Limestone/Dolomite, Marble, Mica, Olivine, Perlite, Phosphate, Potash –Potassium minerals, Pumice Quartz, Staurolite, Zeolites.
During January 2012, we signed a formal agreement with South Africa's DRA Mineral Projects (“DRA”), a world-leading process engineering and mining project development management firm, for the development of our projects in Madagascar. Specific focus will be on the development of vanadium and graphite minerals. This partnership provides us with the ability to both build and manage a mining operation. It also provides DRA the option to purchase up to 5% of our company through private placement at current market conditions.
Madagascar Historical Exploration Programs
The Green Giant Property displays extensive gossans outcroppings at surface. An examination of part of this property revealed several large areas covered with gossanous boulders, which are believed to overlie massive sulphide mineralization. Phases of the exploration projects were managed by Craig Scherba, one of our outside consultant geologists.
We conducted a first phase of exploration from September to November 2007 that included the following activities:
· Stream Sediment sampling of all stream on the property area
· Detailed Geological mapping over selected startigraphic horizons
· Reconnaissance geological mapping over the entire property
· Soil sampling over selected target areas
· Prospecting over selected target areas.
· Limited trenching over selected targets
· Construction of a cinder block base camp
· Construction of a one kilometre long surfaced airstrip
· Repair and surfacing of the access road from base camp to the airstrip
· Airborne geophysical surveying conducted by Fugro Airborne Surveys Ltd
During March 2008 to June 2008, a full field exploration program following up on the airborne geophysical survey and results of the 2007 exploration program was implemented. This exploration consisted of the following:
· Infill stream sediment sampling
· Detailed Geological mapping over selected stratigraphic horizons
· Prospecting over selected target areas
· Grid emplacement over selected target areas
· Ground-based magnetometer and frequency domain EM surveys
· Soil sampling over selected target areas
After reviewing the analytical data from the March 2008 to June 2008 program, additional exploration was conducted from July 2008 to September 2008 in preparation for a drill program. This exploration consisted of the following:
· Infill stream sediment sampling
· Detailed geological mapping over selected stratigraphic horizons
· Prospecting over selected target areas with the aid of a mobile XRF analyzer
19
Based on compiled analytical results obtained from the various exploration programs, a drill program was initiated on the property from September 2008 to November 2008. This exploration program consisted of the following:
· Prospecting over selected target areas with the aid of a mobile XRF analyzer
· Ground-based scintillometer surveying over selected target areas
· Diamond drilling of 31 holes over 4,073 metres
Based on positive early indications of the presence of potentially economic grades and volumes of vanadium on the property, another exploration program was initiated on the Green Giant Property during the spring of 2009. The program (completed between April 2009 and July 2009) consisted of an extensive X-Ray Fluorescence analysis (XRF) soil sampling program coupled with mechanical trenching and scintillometer surveys over known areas of vanadium enrichment and new areas, defined by the soil XRF survey.
The discovery of potentially significant vanadium mineralization from prior programs resulted in the initiation of resource delineation drill program during September2009 to December 2009. This program consisted of the following:
· XRF soil sample analyses (8,490 samples) on lines 200 metres apart and covering 18 kilometre strike length
· Scintillometer surveying (112 line kilometres) on lines 200 metres apart over an 18 kilometre strike length
· Trenching (140 trenches for 17,105 metres)
· Diamond drilling of 54 diamond drill holes over 8,931 metres
The exploration programs to date resulted in the delineation of two vanadium pentoxide (V2O5) deposits (named the Jaky and Manga), characterized by two separate categories: oxide and primary. Within the oxide and primary zone of the Jaky and Manga deposits, the total indicated resources was calculated to be 21.74 Mt at 0.759% V2O5 containing 363.8 Mlb of vanadium pentoxide. The total inferred resources was calculated to be 4.15 Mt at a grade of 0.655% V2O5 containing 59.8 Mlb of vanadium pentoxide.
Based on these results, we conducted an additional exploration program on the property from April 2010 to July 2010. This program consisted of the following activities:
· Diamond drilling of 46 diamond drill holes over 8,952metres
· Prospecting over selected target areas with the aid of a mobile XRF analyzer (20 grab samples)
· Geologic mapping over the Manga and Mainty deposits at 1:5000 scale
· ERT ground geophysical survey (5.64 km)
· MAG ground geophysical survey (169.53 km)
· Gradient Array EM ground geophysical survey (128.82 km)
In 2011, the identification of graphite as a potential credit to our NI 43-101 compliant vanadium resources in the Manga, Jaky and Mainty zones led our geologists to conduct a reconnaissance exploration program (Phase I program) on the properties in September, 2011. The goal of this exploration program was to delineate new graphitic trends, and compare them to those associated with vanadium mineralization. This program consisted of the following activities:
· Diamond drilling of 10 holes over 1,157.5 metres
· Trenching (16 trenches for 1,912 metres)
· Prospecting over selected target areas
An additional reconnaissance exploration program was conducted from November 2011 to December, 2011 (Phase II program). The purpose of this program was to ascertain the industrial mineral potential on the Joint Venture Property, in addition to further drill testing of graphitic trends on the Green Giant Property in advance of Madagascar’s rainy season. This program consisted of the following activities:
· Diamond drilling of 20 holes over 2,842metres
· Prospecting over selected target areas
· EM31 ground geophysical survey over selected target areas (160.5 km)
2008 Diamond Drilling Program
Diamond drilling completed in 2008 on the Green Giant Property tested a series of gossans and EM conductors, however no Volcanic Massive Sulphide (VMS) mineralization of significance was encountered. Drilling did confirm the presence of a series of mineral occurrences highly enriched in vanadium and a number of associated anomalous elements, which were first seen in stream sediment sampling programs. Due to this unexpected result, the focus of exploration shifted to vanadium mineralization part way through the 2008 drill program.
20

Composited Vanadium Mineralization in 2008 Drill Holes
|
Hole
|
Depth in Metres
|
V2O5
|
||
|
From
|
To
|
Interval
|
%
|
|
|
TH-08-01
|
103.6
|
115.8
|
12.2
|
0.39
|
|
TH-08-02
|
42.7
|
109.7
|
36.6
|
0.27
|
|
incl.
|
100.6
|
109.7
|
9.1
|
0.36
|
|
TH-08-07
|
27.4
|
54.9
|
27.4
|
0.23
|
|
TH-08-11
|
33.5
|
39.6
|
6.1
|
0.41
|
|
TH-08-11
|
57.9
|
76.2
|
18.3
|
0.37
|
|
TH-08-12
|
30.6
|
114.3
|
83.7
|
0.37
|
|
incl.
|
45.7
|
61.0
|
15.2
|
0.40
|
|
incl.
|
86.9
|
109.7
|
22.9
|
0.47
|
|
TH-08-13
|
38.5
|
141.7
|
103.2
|
0.32
|
|
incl.
|
76.2
|
141.7
|
65.5
|
0.36
|
|
incl.
|
112.8
|
141.7
|
27.4
|
0.45
|
|
TH-08-14
|
12.2
|
109.7
|
97.5
|
0.35
|
|
incl.
|
76.2
|
91.4
|
15.2
|
0.66
|
|
TH-08-24
|
4.6
|
82.3
|
77.7
|
0.67
|
|
incl.
|
12.2
|
61.0
|
45.7
|
0.91
|
|
TH-08-25
|
18.3
|
48.8
|
30.5
|
0.32
|
|
TH-08-25
|
100.6
|
103.6
|
3.0
|
0.47
|
|
TH-08-26
|
9.1
|
36.6
|
27.4
|
0.41
|
|
incl.
|
18.3
|
27.4
|
9.0
|
0.76
|
|
TH-08-26
|
67.1
|
73.2
|
6.1
|
0.53
|
|
TH-08-27
|
9.1
|
97.5
|
88.4
|
0.30
|
|
incl.
|
18.3
|
29.0
|
10.7
|
0.88
|
|
TH-08-27
|
146.3
|
153.9
|
6.0
|
0.50
|
|
TH-08-31
|
15.2
|
51.8
|
36.6
|
0.38
|
|
incl.
|
36.6
|
48.8
|
12.2
|
0.56
|
**Average of Drill Intercepts - 43.9m @ 0.36% V2O5
21
The serendipitous discovery of potentially economic vanadium mineralization on the property changed the course of the 2008 diamond-drilling program. Through a combination of prospecting, ground based scintillometer surveying, and analysis of airborne radiometrics, five vanadium-bearing trends were identified over the course of the 2008 exploration program.
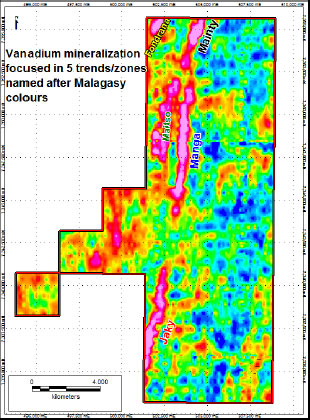
Vanadium-Bearing Trends
After reviewing the analytical results from the spring 2009 exploration program, an additional exploration program was carried out between September and December 2009. This exploration program involved mechanical trenching, diamond drilling with accompanying lithological, structural and geotechnical logging, specific gravity determination, point load tests and metallurgical sampling.
The primary aim of the September to December 2009 drill program was to delineate reserves at the Jaky and Manga targets. A total of 8,931 metres (4,509metres in 30 drill holes at the Jaky target and 4,422metres in 24 drill holes at the Manga target) of diamond drilling was completed. Selected drill holes were oriented with point load test and orientation measurements recorded.
22
Composited Vanadium Mineralization in 2009 Drill Holes
|
DDH ID
|
From (m)
|
To (m)
|
V2O5 (%)
|
Interval (m)
|
|
|
J-01
|
1.50
|
25.50
|
0.65
|
24.00
|
|
|
J-01
|
25.5
|
28.10
|
0.45
|
2.60
|
|
|
J-01
|
28.10
|
37.50
|
0.17
|
9.40
|
|
|
J-01
|
37.50
|
42.00
|
0.40
|
4.50
|
|
|
J-01
|
42.00
|
60.00
|
0.20
|
18.00
|
|
|
J-01
|
60.00
|
90.00
|
0.75
|
30.00
|
|
|
J-01
|
90.00
|
97.50
|
0.36
|
7.50
|
|
|
J-01
|
97.50
|
103.50
|
0.16
|
6.00
|
|
|
J-01
|
111.00
|
126.00
|
0.17
|
15.00
|
|
|
J-01
|
132.00
|
136.50
|
0.32
|
4.50
|
|
|
J-02
|
1.80
|
17.00
|
0.46
|
15.20
|
|
|
J-02
|
17.00
|
24.50
|
1.06
|
7.50
|
|
|
J-02
|
24.50
|
38.00
|
0.37
|
13.50
|
|
|
J-02
|
38.00
|
51.50
|
0.96
|
13.50
|
|
|
J-02
|
51.50
|
68.00
|
0.20
|
16.50
|
|
|
J-02
|
68.00
|
69.50
|
0.64
|
1.50
|
|
|
J-02
|
69.50
|
77.00
|
0.28
|
7.50
|
|
|
J-02
|
86.00
|
89.00
|
0.36
|
3.00
|
|
|
J-03
|
1.50
|
22.50
|
0.57
|
21.00
|
|
|
J-03
|
incl.
|
1.50
|
9.00
|
0.65
|
7.50
|
|
J-03
|
incl.
|
9.00
|
16.50
|
0.44
|
7.50
|
|
J-03
|
incl.
|
16.50
|
22.50
|
0.65
|
6.00
|
|
J-03
|
22.50
|
42.00
|
0.27
|
19.50
|
|
|
J-03
|
42.00
|
78.00
|
1.00
|
36.00
|
|
|
J-03
|
78.00
|
93.00
|
0.15
|
15.00
|
|
|
J-03
|
93.00
|
99.00
|
0.53
|
6.00
|
|
|
J-03
|
99.00
|
102.00
|
0.20
|
3.00
|
|
|
J-04
|
9.00
|
23.90
|
0.22
|
14.90
|
|
|
J-04
|
23.90
|
39.10
|
0.59
|
15.20
|
|
|
J-04
|
incl.
|
27.00
|
30.50
|
0.80
|
3.50
|
|
J-04
|
39.10
|
76.50
|
0.24
|
37.40
|
|
|
J-04
|
76.50
|
85.50
|
0.57
|
9.00
|
|
|
J-04
|
85.50
|
94.50
|
0.14
|
9.00
|
|
|
J-04
|
94.50
|
103.50
|
0.41
|
9.00
|
|
|
J-04
|
103.50
|
109.50
|
0.19
|
6.00
|
|
|
J-04
|
119.50
|
150.00
|
0.15
|
30.50
|
|
|
J-04
|
150.00
|
153.00
|
0.82
|
3.00
|
|
|
J-04
|
153.00
|
168.00
|
0.19
|
15.00
|
|
|
J-04
|
196.50
|
204.00
|
0.29
|
7.50
|
|
|
J-04
|
214.50
|
219.00
|
0.40
|
4.50
|
|
|
J-05
|
1.50
|
9.00
|
0.83
|
7.50
|
|
|
J-05
|
9.00
|
39.00
|
0.30
|
30.00
|
|
|
J-05
|
39.00
|
75.00
|
0.79
|
36.00
|
|
|
J-05
|
incl.
|
39.00
|
45.00
|
0.91
|
6.00
|
23
|
J-05
|
incl.
|
45.00
|
55.50
|
0.70
|
10.50
|
|
J-05
|
incl.
|
55.50
|
73.50
|
0.89
|
18.00
|
|
J-05
|
incl.
|
73.50
|
75.00
|
0.50
|
1.50
|
|
J-05
|
75.00
|
91.50
|
0.14
|
16.50
|
|
|
J-05
|
91.50
|
97.50
|
0.52
|
6.00
|
|
|
J-05
|
97.50
|
115.00
|
0.17
|
17.50
|
|
|
J-06
|
0.00
|
7.50
|
0.44
|
7.50
|
|
|
J-06
|
7.50
|
19.50
|
1.36
|
12.00
|
|
|
J-06
|
19.50
|
33.70
|
0.45
|
14.20
|
|
|
J-06
|
33.70
|
46.70
|
0.94
|
13.00
|
|
|
J-06
|
46.70
|
84.00
|
0.23
|
37.30
|
|
|
J-07
|
14.00
|
170.00
|
0.18
|
156.00
|
|
|
J-07
|
212.00
|
218.00
|
0.31
|
6.00
|
|
|
J-07
|
231.50
|
237.50
|
0.30
|
6.00
|
|
|
J-08
|
2.00
|
8.00
|
0.41
|
6.00
|
|
|
J-08
|
8.00
|
45.00
|
0.25
|
37.00
|
|
|
J-08
|
45.00
|
56.00
|
0.49
|
11.00
|
|
|
J-08
|
56.00
|
68.00
|
0.82
|
12.00
|
|
|
J-08
|
68.00
|
77.00
|
0.52
|
9.00
|
|
|
J-08
|
77.00
|
86.50
|
0.17
|
9.50
|
|
|
J-09
|
1.50
|
6.00
|
0.27
|
4.50
|
|
|
J-09
|
6.00
|
49.50
|
1.00
|
43.50
|
|
|
J-09
|
49.50
|
52.50
|
0.55
|
3.00
|
|
|
J-09
|
52.50
|
66.00
|
0.14
|
13.50
|
|
|
J-09
|
66.00
|
72.00
|
0.48
|
6.00
|
|
|
J-09
|
72.00
|
93.00
|
0.17
|
21.00
|
|
|
J-10
|
2.00
|
5.00
|
0.36
|
3.00
|
|
|
J-10
|
5.00
|
18.50
|
0.81
|
13.50
|
|
|
J-10
|
18.50
|
26.00
|
0.44
|
7.50
|
|
|
J-10
|
26.00
|
47.00
|
0.26
|
21.00
|
|
|
J-10
|
47.00
|
77.00
|
0.79
|
30.00
|
|
|
J-10
|
77.00
|
81.50
|
0.36
|
4.50
|
|
|
J-10
|
81.50
|
89.00
|
0.17
|
7.50
|
|
|
J-10
|
101.00
|
105.50
|
0.16
|
4.50
|
|
|
J-10
|
105.50
|
108.50
|
0.53
|
3.00
|
|
|
J-10
|
108.50
|
120.50
|
0.15
|
12.00
|
|
|
J-10
|
120.50
|
126.50
|
0.41
|
6.00
|
|
|
J-11
|
126.50
|
138.50
|
0.16
|
12.00
|
|
|
J-11
|
138.50
|
141.50
|
0.57
|
3.00
|
|
|
J-11
|
141.50
|
153.50
|
0.17
|
12.00
|
|
|
J-12
|
0.50
|
31.50
|
0.22
|
31.00
|
|
|
J-12
|
31.50
|
45.00
|
0.41
|
13.50
|
|
|
J-12
|
45.00
|
54.00
|
0.73
|
9.00
|
|
|
J-12
|
54.00
|
66.00
|
0.30
|
12.00
|
|
|
J-12
|
66.00
|
94.50
|
0.14
|
28.50
|
|
|
J-12
|
106.50
|
109.50
|
0.51
|
3.00
|
24
|
J-13
|
1.60
|
16.50
|
0.71
|
14.90
|
|
|
J-13
|
16.50
|
37.50
|
0.97
|
21.00
|
|
|
J-13
|
37.50
|
57.00
|
0.20
|
19.50
|
|
|
J-13
|
57.00
|
63.00
|
0.45
|
6.00
|
|
|
J-13
|
63.00
|
85.50
|
0.16
|
22.50
|
|
|
J-14
|
40.50
|
70.70
|
0.17
|
30.20
|
|
|
J-14
|
79.50
|
97.50
|
0.10
|
18.00
|
|
|
J-14
|
120.00
|
153.00
|
0.22
|
33.00
|
|
|
J-14
|
153.00
|
156.00
|
0.62
|
3.00
|
|
|
J-14
|
156.00
|
159.00
|
0.29
|
3.00
|
|
|
J-14
|
159.00
|
169.50
|
0.15
|
10.50
|
|
|
J-15
|
0.20
|
3.00
|
0.35
|
2.80
|
|
|
J-15
|
3.00
|
69.00
|
0.17
|
66.00
|
|
|
J-15
|
87.00
|
115.50
|
0.16
|
28.50
|
|
|
J-15
|
115.50
|
118.50
|
0.60
|
3.00
|
|
|
J-16
|
0.00
|
14.00
|
0.45
|
14.00
|
|
|
J-16
|
14.00
|
30.50
|
0.83
|
16.50
|
|
|
J-16
|
30.50
|
38.00
|
0.48
|
7.50
|
|
|
J-16
|
38.00
|
45.50
|
0.20
|
7.50
|
|
|
J-16
|
51.50
|
56.00
|
0.12
|
4.50
|
|
|
J-16
|
56.00
|
60.50
|
0.49
|
4.50
|
|
|
J-16
|
60.50
|
63.50
|
0.18
|
3.00
|
|
|
J-17
|
2.00
|
6.50
|
0.19
|
4.50
|
|
|
J-17
|
6.50
|
11.00
|
0.42
|
4.50
|
|
|
J-17
|
11.00
|
23.00
|
0.93
|
12.00
|
|
|
J-17
|
23.00
|
39.50
|
0.19
|
16.50
|
|
|
J-17
|
39.50
|
45.50
|
0.48
|
6.00
|
|
|
J-17
|
45.50
|
62.00
|
0.16
|
16.50
|
|
|
J-18
|
1.50
|
6.50
|
0.37
|
5.00
|
|
|
J-18
|
6.50
|
20.00
|
0.21
|
13.50
|
|
|
J-18
|
20.00
|
24.50
|
0.54
|
4.50
|
|
|
J-19
|
36.50
|
62.00
|
0.19
|
25.50
|
|
|
J-19
|
81.90
|
86.00
|
0.34
|
4.10
|
|
|
J-19
|
86.00
|
113.00
|
0.13
|
27.00
|
|
|
J-19
|
113.00
|
117.50
|
0.62
|
4.50
|
|
|
J-20
|
0.50
|
8.00
|
0.30
|
7.50
|
|
|
J-20
|
8.00
|
27.50
|
0.50
|
19.50
|
|
|
J-20
|
27.50
|
42.50
|
0.23
|
15.00
|
|
|
J-20
|
50.00
|
53.00
|
0.13
|
3.00
|
|
|
J-20
|
53.00
|
57.50
|
0.48
|
4.50
|
|
|
J-20
|
57.50
|
78.50
|
0.16
|
21.00
|
|
|
J-21
|
6.5
|
11.00
|
0.32
|
4.50
|
|
|
J-21
|
11.00
|
26.00
|
0.73
|
15.00
|
|
|
J-21
|
26.00
|
39.50
|
0.18
|
13.50
|
|
|
J-21
|
39.50
|
44.00
|
0.5
|
4.50
|
|
|
J-21
|
44.00
|
59.00
|
0.16
|
15.00
|
|
|
J-22
|
117.50
|
153.50
|
0.31
|
36.00
|
|
|
J-22
|
incl.
|
141.50
|
146.00
|
0.54
|
4.50
|
25
|
J-22
|
153.50
|
164.00
|
0.66
|
10.50
|
|
|
J-22
|
164.00
|
170.00
|
0.12
|
6.00
|
|
|
J-22
|
170.00
|
174.50
|
0.42
|
4.50
|
|
|
J-23
|
2
|
42.50
|
0.15
|
40.50
|
|
|
J-23
|
93.5
|
113.00
|
0.16
|
19.50
|
|
|
J-23
|
113.00
|
117.50
|
0.54
|
4.50
|
|
|
J-23
|
117.50
|
121.80
|
0.21
|
4.30
|
|
|
J-24
|
0.7
|
3.5
|
0.22
|
2.80
|
|
|
J-24
|
3.5
|
14
|
0.34
|
10.50
|
|
|
J-24
|
14
|
27.5
|
0.21
|
13.50
|
|
|
J-24
|
38
|
41
|
0.17
|
3.00
|
|
|
J-24
|
41
|
47
|
0.54
|
6.00
|
|
|
J-24
|
47
|
69.5
|
0.16
|
22.50
|
|
|
J-25
|
2
|
12.5
|
0.33
|
10.50
|
|
|
J-25
|
23
|
33.5
|
0.23
|
10.50
|
|
|
J-26
|
27.50
|
41.00
|
0.35
|
13.50
|
|
|
J-26
|
41.00
|
53.00
|
0.74
|
12.00
|
|
|
J-26
|
53.00
|
59.00
|
0.41
|
6.00
|
|
|
J-26
|
59.00
|
90.50
|
0.18
|
31.50
|
|
|
J-26
|
90.50
|
117.50
|
0.40
|
27.00
|
|
|
J-26
|
117.50
|
122.00
|
0.16
|
4.50
|
|
|
J-26
|
134.00
|
162.50
|
0.15
|
28.50
|
|
|
J-26
|
162.50
|
168.50
|
0.51
|
6.00
|
|
|
J-27
|
125.00
|
138.50
|
0.24
|
13.50
|
|
|
J-27
|
138.50
|
162.50
|
0.53
|
24.00
|
|
|
J-27
|
incl.
|
138.50
|
144.50
|
0.63
|
6.00
|
|
J-27
|
incl.
|
144.50
|
150.50
|
0.32
|
6.00
|
|
J-27
|
incl.
|
150.50
|
159.50
|
0.65
|
9.00
|
|
J-27
|
incl.
|
159.50
|
162.50
|
0.42
|
3.00
|
|
J-27
|
162.50
|
170.00
|
0.17
|
7.50
|
|
|
J-27
|
170.00
|
176.25
|
0.32
|
6.25
|
|
|
J-27
|
176.25
|
186.50
|
0.19
|
10.25
|
|
|
J-27
|
incl.
|
183.50
|
186.50
|
0.42
|
3.00
|
|
J-MET-01
|
2.50
|
5.50
|
0.43
|
3.00
|
|
|
J-MET-01
|
5.50
|
59.50
|
1.12
|
54.00
|
|
|
J-MET-01
|
59.50
|
64.00
|
0.51
|
4.50
|
|
|
J-MET-01
|
64.00
|
74.50
|
0.18
|
10.50
|
|
|
J-MET-02
|
2.50
|
10.00
|
1.11
|
7.50
|
|
|
J-MET-02
|
10.00
|
16.00
|
0.51
|
6.00
|
|
|
J-MET-02
|
16.00
|
23.50
|
0.18
|
7.50
|
|
|
J-MET-02
|
23.50
|
41.50
|
0.70
|
18.00
|
|
|
J-MET-02
|
41.50
|
64.00
|
0.22
|
22.50
|
|
|
J-MET-02
|
76.00
|
83.50
|
0.36
|
7.50
|
|
|
J-MET-02
|
83.50
|
121.00
|
0.17
|
37.50
|
|
|
J-MET-02
|
121.00
|
124.00
|
0.93
|
3.00
|
|
|
J-MET-02
|
124.00
|
133.00
|
0.26
|
9.00
|
|
|
J-MET-03
|
1.50
|
27.00
|
0.45
|
25.50
|
|
|
J-MET-03
|
27.00
|
78.00
|
0.80
|
51.00
|
26
|
J-MET-03
|
78.00
|
88.50
|
0.46
|
10.50
|
|
|
J-MET-03
|
88.50
|
96.00
|
0.17
|
7.50
|
|
|
M-11
|
7.00
|
38.00
|
0.22
|
31.00
|
|
|
M-11
|
38.00
|
57.50
|
0.58
|
19.50
|
|
|
M-12
|
3.50
|
20.00
|
0.47
|
16.50
|
|
|
M-12
|
incl.
|
3.50
|
9.50
|
0.64
|
6.00
|
|
M-12
|
incl.
|
9.50
|
20.00
|
0.37
|
10.50
|
|
M-13
|
123.00
|
132.50
|
0.18
|
9.50
|
|
|
M-13
|
132.50
|
144.00
|
0.40
|
11.50
|
|
|
M-13
|
144.00
|
153.00
|
0.17
|
9.00
|
|
|
M-13
|
153.00
|
156.00
|
0.57
|
3.00
|
|
|
M-13
|
156.00
|
166.50
|
0.81
|
10.50
|
|
|
M-13
|
166.50
|
175.50
|
0.36
|
9.00
|
|
|
M-14
|
1.50
|
4.50
|
0.27
|
3.00
|
|
|
M-14
|
4.50
|
21.00
|
0.70
|
16.50
|
|
|
M-14
|
21.00
|
30.00
|
0.33
|
9.00
|
|
|
M-14
|
30.00
|
100.50
|
0.74
|
70.50
|
|
|
M-14
|
incl.
|
30.00
|
39.00
|
0.54
|
9.00
|
|
M-14
|
incl.
|
39.00
|
49.50
|
0.82
|
10.50
|
|
M-14
|
incl.
|
49.50
|
55.50
|
0.59
|
6.00
|
|
M-14
|
incl.
|
55.50
|
66.00
|
0.71
|
10.50
|
|
M-14
|
incl.
|
66.00
|
100.50
|
0.79
|
34.50
|
|
M-14
|
100.50
|
112.50
|
0.30
|
12.00
|
|
|
M-15
|
3.50
|
26.00
|
0.72
|
22.50
|
|
|
M-15
|
incl.
|
3.50
|
12.00
|
0.60
|
8.50
|
|
M-15
|
incl.
|
12.00
|
26.00
|
0.81
|
14.00
|
|
M-15
|
26.00
|
47.00
|
0.38
|
21.00
|
|
|
M-16
|
66.5
|
74.7
|
0.18
|
8.20
|
|
|
M-16
|
74.7
|
81.5
|
0.64
|
6.80
|
|
|
M-16
|
81.5
|
89
|
0.33
|
7.50
|
|
|
M-16
|
89.00
|
180.50
|
0.80
|
91.50
|
|
|
M-16
|
180.50
|
191.00
|
0.29
|
10.50
|
|
|
M-17
|
3.40
|
12.50
|
0.20
|
9.10
|
|
|
M-17
|
12.50
|
29.00
|
0.45
|
16.50
|
|
|
M-17
|
29.00
|
113.00
|
0.97
|
84.00
|
|
|
M-17
|
incl.
|
29.00
|
44.00
|
0.77
|
15.00
|
|
M-17
|
incl.
|
44.00
|
113.00
|
1.01
|
69.00
|
|
M-17
|
incl.
|
102.50
|
111.50
|
1.45
|
9.00
|
|
M-17
|
113.00
|
121.10
|
0.18
|
8.10
|
|
|
M-17
|
121.10
|
126.50
|
0.36
|
5.40
|
|
|
M-18
|
4.10
|
41.00
|
0.71
|
36.90
|
|
|
M-18
|
incl.
|
4.10
|
15.50
|
0.67
|
11.40
|
|
M-18
|
incl.
|
15.50
|
32.00
|
0.81
|
16.50
|
|
M-18
|
incl.
|
32.00
|
41.00
|
0.59
|
9.00
|
|
M-18
|
41.00
|
57.50
|
0.41
|
16.50
|
|
|
M-18
|
incl.
|
44.00
|
57.50
|
0.45
|
13.50
|
|
M-18
|
57.00
|
77.00
|
0.13
|
20.00
|
27
|
M-19
|
60.50
|
69.50
|
0.36
|
9.00
|
|
|
M-19
|
69.50
|
156.50
|
0.94
|
87.00
|
|
|
M-19
|
incl.
|
134.00
|
156.50
|
1.23
|
22.50
|
|
M-19
|
156.50
|
174.50
|
0.33
|
18.00
|
|
|
M-19
|
156.50
|
174.50
|
0.33
|
18.00
|
|
|
M-20
|
5.00
|
90.50
|
0.98
|
85.50
|
|
|
M-20
|
incl.
|
5.00
|
30.50
|
0.65
|
25.50
|
|
M-20
|
incl.
|
30.50
|
42.50
|
0.42
|
12.00
|
|
M-20
|
incl.
|
42.50
|
75.50
|
1.55
|
33.00
|
|
M-20
|
incl.
|
75.50
|
83.00
|
0.33
|
7.50
|
|
M-20
|
incl.
|
83.00
|
90.50
|
0.97
|
7.50
|
|
M-20
|
90.50
|
105.50
|
0.36
|
15.00
|
|
|
M-21
|
3.50
|
18.50
|
0.42
|
15.00
|
|
|
M-21
|
18.50
|
36.50
|
0.26
|
18.00
|
|
|
M-22
|
68.00
|
69.50
|
0.17
|
1.50
|
|
|
M-22
|
69.50
|
153.50
|
0.84
|
84.00
|
|
|
M-22
|
incl.
|
69.50
|
95.00
|
0.85
|
25.50
|
|
M-22
|
incl.
|
83.00
|
92.00
|
1.10
|
9.00
|
|
M-22
|
incl.
|
95.00
|
108.50
|
0.34
|
13.50
|
|
M-22
|
incl.
|
108.50
|
126.50
|
1.41
|
18.00
|
|
M-22
|
incl.
|
126.50
|
134.00
|
0.46
|
7.50
|
|
M-22
|
incl.
|
134.00
|
143.00
|
1.17
|
9.00
|
|
M-22
|
incl.
|
143.00
|
153.50
|
0.52
|
10.50
|
|
M-22
|
153.50
|
164.00
|
0.34
|
10.50
|
|
|
M-22
|
164.00
|
168.50
|
0.14
|
4.50
|
|
|
M-23
|
1.70
|
8.00
|
0.34
|
6.30
|
|
|
M-23
|
8.00
|
30.50
|
0.73
|
22.50
|
|
|
M-23
|
30.50
|
38.00
|
0.30
|
7.50
|
|
|
M-23
|
38.00
|
68.70
|
0.45
|
30.70
|
|
|
M-23
|
68.70
|
77.00
|
0.95
|
8.30
|
|
|
M-23
|
77.00
|
95.00
|
0.40
|
18.00
|
|
|
M-24
|
12.50
|
35.00
|
0.31
|
22.50
|
|
|
M-25
|
108.50
|
111.50
|
0.33
|
3.00
|
|
|
M-25
|
111.50
|
123.50
|
0.80
|
12.00
|
|
|
M-25
|
123.50
|
137.00
|
0.61
|
13.50
|
|
|
M-26
|
48.50
|
77.00
|
0.82
|
28.50
|
|
|
M-26
|
incl.
|
48.50
|
54.30
|
0.54
|
5.80
|
|
M-26
|
incl.
|
54.30
|
74.00
|
0.94
|
19.70
|
|
M-26
|
incl.
|
74.00
|
77.00
|
0.55
|
3.00
|
|
M-26
|
77.00
|
110.00
|
0.33
|
33.00
|
|
|
M-26
|
110.00
|
114.50
|
0.68
|
4.50
|
|
|
M-26
|
114.50
|
132.50
|
0.30
|
18.00
|
|
|
M-27
|
2.00
|
14.00
|
0.70
|
12.00
|
|
|
M-27
|
14.00
|
35.00
|
0.35
|
21.00
|
|
|
M-37
|
132.50
|
233.00
|
0.86
|
100.50
|
|
|
M-37
|
incl.
|
132.50
|
141.50
|
0.60
|
9.00
|
|
M-37
|
incl.
|
141.50
|
159.50
|
0.90
|
18.00
|
28
|
M-37
|
incl.
|
159.50
|
164.00
|
0.58
|
4.50
|
|
M-37
|
incl.
|
164.00
|
219.50
|
0.98
|
55.50
|
|
M-37
|
incl.
|
192.50
|
215.00
|
1.11
|
22.50
|
|
M-37
|
incl.
|
219.50
|
224.00
|
0.46
|
4.50
|
|
M-37
|
incl.
|
224.00
|
227.00
|
1.04
|
3.00
|
|
M-37
|
incl.
|
227.00
|
233.00
|
0.46
|
6.00
|
|
M-38
|
198.50
|
215.00
|
0.19
|
16.50
|
|
|
M-38
|
215.00
|
237.50
|
0.85
|
22.50
|
|
|
M-38
|
237.50
|
245.00
|
0.26
|
7.50
|
|
|
M-39
|
132.50
|
135.50
|
0.15
|
3.00
|
|
|
M-39
|
135.50
|
141.50
|
0.56
|
6.00
|
|
|
M-39
|
141.50
|
147.50
|
0.29
|
6.00
|
|
|
M-39
|
200.00
|
208.80
|
0.17
|
8.80
|
|
|
M-39
|
208.50
|
212.00
|
0.37
|
3.50
|
|
|
M-39
|
212.00
|
215.00
|
0.68
|
3.00
|
|
|
M-39
|
215.00
|
224.00
|
0.40
|
9.00
|
|
|
M-39
|
224.00
|
229.50
|
0.09
|
5.50
|
|
|
M-39
|
229.50
|
249.50
|
0.79
|
20.00
|
|
|
M-39
|
incl.
|
229.50
|
233.00
|
0.62
|
3.50
|
|
M-39
|
incl.
|
233.00
|
249.50
|
0.84
|
16.50
|
|
M-39
|
incl.
|
233.00
|
237.50
|
0.99
|
4.50
|
|
M-39
|
incl.
|
237.50
|
240.50
|
0.42
|
3.00
|
|
M-39
|
incl.
|
240.50
|
249.50
|
0.90
|
9.00
|
|
M-39
|
249.50
|
258.50
|
0.28
|
9.00
|
|
|
M-40
|
215.00
|
218.00
|
0.83
|
3.00
|
|
|
M-40
|
218.00
|
224.00
|
0.35
|
6.00
|
|
|
M-41
|
104.00
|
117.50
|
0.27
|
13.50
|
|
|
M-41
|
117.50
|
212.00
|
0.87
|
94.50
|
|
|
M-41
|
incl.
|
153.50
|
161.00
|
1.06
|
7.50
|
|
M-41
|
incl.
|
188.00
|
210.00
|
1.05
|
22.00
|
|
M-41
|
212.00
|
216.50
|
0.41
|
4.50
|
|
|
M-41
|
216.50
|
219.50
|
0.98
|
3.00
|
|
|
M-41
|
219.50
|
224.00
|
0.41
|
4.50
|
|
|
M-42
|
182.00
|
190.00
|
0.38
|
8.00
|
|
|
M-42
|
195.50
|
206.00
|
0.23
|
10.50
|
|
|
M-42
|
206.00
|
291.50
|
0.71
|
85.50
|
|
|
M-42
|
291.50
|
294.50
|
0.30
|
3.00
|
Analytical results from the 2009 exploration program were provided toAGP Mining Consultants (“AGP”),a consulting engineering firm,in order to calculate a vanadium pentoxide resource. Based on the favourable resource calculation results, we conducted additional drilling between April 2010 and July, 2010. This program involved diamond drilling with accompanying lithological, structural and geotechnical logging, specific gravity determination, point load tests and metallurgical sampling. The primary aim of this drilling was to delineate additional reserves at the Jakyand Manga targets, as well as targeting an additional target, the Mainty. A total of 8,952metres of diamond drilling was completed in 46 holes. Selected drill holes were oriented with point load test and orientation measurements recorded.
29
Drill hole results from the exploration program completed through April 2010 to July 2010 are as follows:
|
INTERVAL
|
INCLUDING
|
|||||||
|
Hole ID
|
V205 Grade
|
From (m)
|
To (m)
|
Interval (m)
|
V205
|
From (m)
|
To (m)
|
Interval (m)
|
|
K-01
|
0.559
|
92
|
95
|
3
|
-
|
-
|
-
|
-
|
|
K-01
|
0.523
|
99.5
|
113
|
13.5
|
-
|
-
|
-
|
-
|
|
K-01
|
0.59
|
140
|
155
|
15
|
0.647
|
143
|
152
|
9
|
|
K-02
|
0.522
|
180.5
|
204.5
|
24
|
0.645
|
185
|
192.5
|
7.5
|
|
K-03
|
0.616
|
93.5
|
135.56
|
42.06
|
-
|
-
|
-
|
-
|
|
K-03
|
0.628
|
138.5
|
150.5
|
12
|
0.74
|
140
|
144.5
|
4.5
|
|
K-04
|
0.514
|
141.5
|
189.5
|
48
|
0.612
|
149
|
159.77
|
10.77
|
|
K-04
|
-
|
-
|
-
|
-
|
0.683
|
164.18
|
167
|
2.82
|
|
K-05
|
0.588
|
45.5
|
104
|
58.5
|
0.61
|
48.5
|
89
|
40.5
|
|
K-06
|
0.577
|
108.5
|
139.75
|
31.25
|
0.611
|
113
|
134
|
21
|
|
K-06
|
0.519
|
189.52
|
194
|
4.48
|
-
|
-
|
-
|
-
|
|
K-07
|
0.58
|
161
|
258.5
|
97.5
|
0.714
|
174.5
|
213.5
|
39
|
|
K-08
|
0.527
|
92.26
|
100.5
|
8.24
|
-
|
-
|
-
|
-
|
|
K-09
|
0.555
|
132.5
|
230
|
97.5
|
0.606
|
144.5
|
195.5
|
51
|
|
K-09
|
-
|
-
|
-
|
-
|
0.643
|
203
|
230
|
27
|
|
K-13
|
0.562
|
125
|
181.47
|
56.47
|
0.606
|
135.5
|
181.47
|
45.97
|
|
M-05
|
0.572
|
50
|
90.5
|
40.5
|
0.705
|
51.5
|
62
|
10.5
|
|
M-05
|
-
|
-
|
-
|
-
|
0.661
|
78.5
|
90.5
|
12
|
|
M-44
|
0.686
|
75.5
|
87.5
|
12
|
0.974
|
80
|
83
|
3
|
|
M-48
|
0.692
|
50
|
62
|
12
|
0.864
|
51.5
|
59
|
7.5
|
|
M-49
|
0.734
|
192.5
|
200
|
7.5
|
1.036
|
194
|
197
|
3
|
|
M-53
|
0.711
|
71
|
86
|
15
|
0.946
|
72.5
|
80
|
7.5
|
|
M-53
|
0.616
|
99.5
|
102.5
|
3
|
-
|
-
|
-
|
-
|
|
M-54
|
0.528
|
134
|
147.5
|
13.5
|
0.749
|
134
|
137
|
3
|
|
M-55
|
0.602
|
102.5
|
108.5
|
6
|
0.88
|
104
|
107
|
3
|
|
M-55
|
0.548
|
116
|
137
|
21
|
-
|
-
|
-
|
-
|
|
M-55
|
0.521
|
147.5
|
155
|
7.5
|
-
|
-
|
-
|
-
|
|
M-56
|
0.726
|
163.5
|
178.5
|
15
|
0.801
|
168
|
177
|
9
|
|
M-56
|
0.711
|
180
|
244.5
|
64.5
|
0.983
|
223.5
|
234
|
10.5
|
|
M-57
|
0.621
|
24.5
|
63.5
|
39
|
0.948
|
44
|
48.5
|
4.5
|
|
M-58
|
0.783
|
161
|
185
|
24
|
0.945
|
171.5
|
180.5
|
9
|
|
M-59
|
0.844
|
81.5
|
102.5
|
21
|
0.981
|
90.5
|
101
|
10.5
|
|
M-60
|
0.751
|
210.5
|
219.5
|
9
|
-
|
-
|
-
|
-
|
|
M-60
|
0.773
|
231.5
|
236
|
4.5
|
-
|
-
|
-
|
-
|
|
M-62
|
0.706
|
51.5
|
84.5
|
33
|
0.991
|
65
|
69.5
|
4.5
|
|
M-62
|
-
|
-
|
-
|
-
|
1.057
|
80
|
83
|
3
|
|
M-65
|
0.736
|
50
|
60.5
|
10.5
|
-
|
-
|
-
|
-
|
|
M-65
|
0.531
|
101
|
108.5
|
7.5
|
-
|
-
|
-
|
-
|
|
M-71
|
0.725
|
188
|
273.5
|
85.5
|
0.923
|
192.5
|
198.5
|
6
|
|
M-71
|
-
|
-
|
-
|
-
|
1.2
|
221
|
234.5
|
13.5
|
30
|
M-71
|
-
|
-
|
-
|
-
|
0.922
|
245.64
|
260
|
14.36
|
|
M-72
|
0.594
|
53
|
66.5
|
13.5
|
0.838
|
54.5
|
59
|
4.5
|
|
M-73
|
0.611
|
51.5
|
63.5
|
12
|
0.714
|
53
|
60.5
|
7.5
|
|
M-74
|
0.667
|
51.5
|
66.5
|
15
|
0.874
|
53
|
60.5
|
7.5
|
|
M-74
|
0.505
|
95
|
101
|
6
|
-
|
-
|
-
|
-
|
|
M-75
|
0.516
|
30.17
|
33.5
|
3.33
|
-
|
-
|
-
|
-
|
|
M-75
|
0.618
|
45.5
|
77
|
31.5
|
0.922
|
54.5
|
66.5
|
12
|
|
M-76
|
0.53
|
54.5
|
69.5
|
15
|
-
|
-
|
-
|
-
|
|
M-82
|
0.533
|
119
|
126.5
|
7.5
|
-
|
-
|
-
|
-
|
|
M-83
|
0.66
|
45.5
|
71
|
25.5
|
1.073
|
56
|
63.5
|
7.5
|
|
M-84
|
0.564
|
149.75
|
162.5
|
12.75
|
-
|
-
|
-
|
-
|
|
M-85
|
0.609
|
96.5
|
108.5
|
12
|
-
|
-
|
-
|
-
|
|
M-85
|
0.657
|
113
|
131
|
18
|
0.859
|
122
|
126.5
|
4.5
|
|
M-86
|
0.65
|
155
|
191
|
36
|
-
|
-
|
-
|
-
|
|
M-87
|
0.749
|
185
|
283.5
|
98.5
|
0.801
|
195.5
|
270.5
|
75
|
|
M-88
|
0.64
|
206
|
249.5
|
43.5
|
0.731
|
221
|
245
|
24
|
|
M-88
|
0.608
|
266
|
276.5
|
10.5
|
-
|
-
|
-
|
-
|
|
M-88
|
0.688
|
284
|
306.5
|
22.5
|
0.823
|
297.5
|
305
|
7.5
|
|
M-89
|
0.846
|
240.4
|
312.5
|
72.1
|
0.912
|
252.5
|
294.5
|
42
|
|
M-89
|
-
|
-
|
-
|
-
|
1.043
|
306.5
|
311
|
4.5
|
|
M-91a
|
0.875
|
243.5
|
303.5
|
60
|
0.939
|
282.5
|
303.5
|
21
|
|
MM-01
|
0.911
|
2.5
|
156.5
|
154
|
1.166
|
71
|
155
|
84
|
|
MM-01
|
-
|
-
|
-
|
-
|
1.343
|
74
|
86
|
12
|
|
MM-01
|
-
|
-
|
-
|
-
|
1.327
|
102.5
|
126.5
|
24
|
All drill core assays have been received and AGP was retained to undertake a resource calculation update for the Manga and Jaky Zones, as well as a new resource estimate for the Mainty Zone.
Metallurgy
Various metallurgical scoping test programs have been completed since 2009, covering physical and chemical pre-concentration processes, acid and alkaline leaching (atmospheric and pressure), alkaline salt roasting and high definition mineralogical characterisation.Mineralogical characterisation of several silicate samples has revealed a unique deportment of vanadium on the Green Giant Property. Vanadium bearing minerals include clays, micas, oxides, and sulphides. The vanadium deportment for three recent silicate composites is summarized below.
|
|
Vanadium Deportment, Mass % - Summary
|
|
Mineral
|
HMC(%)
|
MPC (%)
|
Silicate (%)
|
|
Other
|
0.0
|
0.1
|
0.1
|
|
Rutile
|
1.7
|
1.3
|
2.0
|
|
Pyrrhotite
|
0.4
|
2.0
|
0.5
|
|
Other Micas/Clays
|
0.7
|
4.0
|
3.0
|
|
Sillimanite
|
1.3
|
0.2
|
0.0
|
|
Cordierite
|
3.0
|
5.1
|
4.2
|
|
Phlogophite (low-V)
|
53.5
|
5.0
|
5.8
|
|
Phlogophite (high-V)
|
26.1
|
19.5
|
26.1
|
|
Roscoelite
|
14.5
|
11.1
|
15.0
|
|
V-Phosphate
|
0.7
|
0.0
|
0
|
|
V-Oxides
|
28.6
|
22.6
|
18.6
|
|
V-Fe Sulphide
|
17.4
|
29.2
|
24.6
|
31
Vanadium is spread across a range of mineral types, but is primarily found in Phlogophite (of various V tenors) Oxides and sulphides. Gangue minerals of note include quartz (generally 30-40% of sample mass) K-feldspar (10% of sample mass) and graphite (<10% of sample mass). Similar work completed in 2009 suggests that the oxide zone differs mineralogically in that a greater percentage of vanadium occurs in oxide minerals, with less in clays/micas and none in sulphides.
Leaching with sulphuric acid can achieve high vanadium extractions (up to 77%), but always at the expense of acid consumption and leach liquor quality. Acid consumptions have varied, but have generally been in the 3 to 500 kg/t range. The vigorous co-extraction of elements such as aluminum, magnesium, and iron is considered detrimental to downstream processes, and is also believed to be responsible for the high acid consumption.
Leaching with alkaline lixiviants such as soda ash (Na2CO3) and caustic soda (NaOH) has historically not resulted in high vanadium extractions. Pressure leaching with soda ash (Phase 2) resulted in 30% to 40% vanadium extraction which, although lower than the acid-based leach results, was significantly higher than atmospheric alkaline leach extractions. The more selective alkaline lixiviants provide much cleaner leach liquors, with minimal co-extraction of problematic elements.
Early Phase 3 alkaline pressure leach tests observed an excess of micaceous material in leach residues, and it was postulated that the vanadium-bearing micas (phlogophite) might be more resistant to alkaline leaching. An oxidative pre-roast was introduced to the treatment process, with a resultant 25% increase in vanadium extraction rate. Comparing leach residues, the micaceous material was no longer present after pre-roasting. Further work is recommended to optimize conditions, but the most encouraging extraction results to date have been achieved on pre-roasted samples, using concentrated soda ash as a lixiviant at high temperature.
|
|
Phase 3 Alkaline Leach Results – Summary
|
|
PL
|
V205 Extraction
|
Roasting
|
Grind K80
|
Feed % Solids
|
Na2CO3 Kg/t
|
Na2CO3 g/L
|
0C
|
Hours
|
|
10
|
80.6
|
Pre-roast – 1,000 0C / 3 h
|
105
|
10
|
n/r
|
100
|
240
|
4
|
|
11
|
82.0
|
Pre-roast – 1,100 0C / 3 h
|
105
|
10
|
n/r
|
100
|
240
|
4
|
|
18
|
75.3
|
Pre-roast – 1,000 0C / 3 h
|
105
|
10
|
147
|
50
|
220
|
4
|
|
20
|
64.0
|
Pre-roast – 1,100 0C / 3 h
|
105
|
30
|
71
|
50
|
220
|
4
|
As the project continues to develop, further scoping work is essential to allow optimization of the roast and leach conditions for both silicate and oxide samples from all zones.The metallurgical processes tested would undoubtedly benefit from higher head grades. Therefore, it is important that future metallurgical programs assess the influence of higher feed vanadium concentrations.
Resource Calculations
During November 2010, AGP estimated the mineral resources for the Green Giant Property. The mineral deposits on the property have been divided into three separate zones, which are referred to as the Jaky, Manga, and Mainty deposits. This mineral resource estimate utilized approximately 18,832 m of diamond drill hole data from the 2008, 2009, and 2010 drill program and was supplemented by approximately 5,928 m of trench data from the 2008 and 2009 exploration programs. No additional work was carried out on the Jaky deposit; therefore, the resources are merely restated from the NI43-101 report dated June 18, 2010.
The Jaky, Manga, and Mainty resource estimate is comprised of indicated and inferred resources reported as vanadium pentoxide mineralization at a base case cut-off grade of 0.5% V2O5. The method employed to select the base case cut-off grade was to consider the mineralogical characteristic, envisioned mining methods and comparable vanadium projects worldwide. Further work is required to more accurately determine the optimum economic cut-off grade, and this is recommended as part of the Preliminary Economic Assessment.
The vanadium deposits on the Green Giant Property are split into two separate categories: oxide and primary. The following resource values were determined at a 0.5% V2O5 cut-off. Within the oxide and primary zones of the Jaky, Manga, and Mainty deposits, the total Indicated resource is 49.5 Mt at 0.693% V2O5, containing 756.3 Mlb of vanadium pentoxide. The total Inferred resource is 9.7 Mt at a grade of 0.632% V2O5, containing 134.5 Mlb of vanadium pentoxide. Since no additional work was conducted, mineral resources at the property were classified using logic consistent with the CIM definitions referred to in NI 43-101 guidelines. This independent mineral resource estimate and review conducted by AGP supports the disclosure by our company of the mineral resource statement for the Jaky, Manga, and Mainty deposit dated November 30, 2010.
32
2011 Phase I Exploration
The mineralization delineated in our NI43-101 compliant vanadium resource was found in two types of rocks, silicates and oxides. Petrographic descriptions undertaken on thin sections of selected rocks submitted for metallurgical analysis to Minteklabs of South Africa, identified 17.17% modal graphite from the silicate composite and 15.87% modal graphite from the oxide composite samples.
Three additional composite samples were submitted to Mintek at the conclusion of the 2010 exploration program. The QEMSCAN1 analysis of these head samples quantified a graphite composition of 4.09%, while the head chemical analysis quantified a graphitic carbon content of 3.87%.
The identification of graphite as a potential credit to our NI 43-101 compliant vanadium resources led our geologists to conduct a reconnaissance exploration program (Phase I program) on the Green Giant Property in September, 2011, with the goal of delineating new graphitic trends and comparing them to those associated with vanadium mineralization.
During the course of the Phase I program, surficial graphitic trends were identified on the Green Giant Property. These graphite trends were visually determined to be of both higher carbon content, and larger flake size than those associated with the NI 43-101 compliant vanadium resource mineralization. Based on these field observations, we initiated an exploration program which included 10 diamond drill holes (totaling 1,157.5 metres), 16 trenches (totaling2,842metres), and 132 grab samples collected over two newly identified prospective graphitic units, named the Fondrana and Fotsy zones, bringing the total number of Graphite Zones on the Property to 5.

_____________________________________
1 For the QEMSCAN analysis, graphite impregnated polished epoxy grain mounts were prepared and analyzed using Particle Map Analysis (PMA) which provides a statistically robust population of mineral identification based on X-ray chemistry of minerals and modal abundance. Chemical assay values were determined by Mintek using LECO CS200 and Eltra CS2000 analyzers.
33
2011 Phase II Exploration
Based on the promising results of the Phase I program, we commenced the Phase II exploration program in November, 2011. The objective of the program was to enhance exploration efforts on the Green Giant Property through further drill testing of graphitic trends on thisproperty and to apply geophysical techniques to delineate graphite mineralization. The signing of the JV agreement with Malagasy Minerals for the exploration and development of industrial minerals prompted additional reconnaissance exploration to ascertain the industrial mineral potential of the joint venture property.
Potential Flake Graphite Camp
During the course of the Phase I and II exploration programs, multiple graphitic or graphitic-vanadium trends were identified with the aid of airborne geophysics, and subsequently verified with ground prospecting, and delineated with the use of an EM31-MK2 (EM31) instrument. In total, 12 new graphite trends have been identified over the Joint VentureProperty. This brings the total number of graphite trends identified to date over the Green Giant Property and the Joint Venture Property to 17, with a cumulative strike length in excess of 320 km. These observations have validated our Company’s belief that southern Madagascar has the potential to host a potential flake graphite camp.
The graphite trends identified to date by our company have been named the following: Berenty, Bemelo, Mahasoa, Bepeha, Besavoa, Fondrana, Mainty, Manga, Molo, Bevaro, Jaky, Fotsy, Rano, Seta, Tanantsoa, Vavy andAmpanihy.
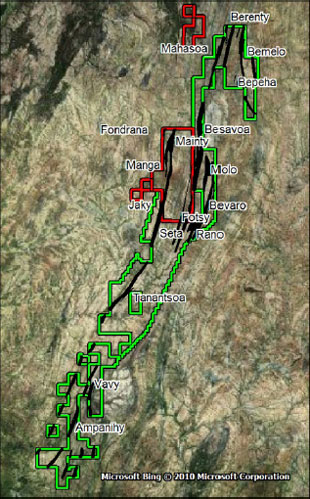
Multiple Graphitic Horizons Identified Within Each Zone With EM31
Field observations indicated that each graphitic zone identified was comprised of multiple ‘stacked’ graphitic horizons. This observation was validated by surveying a number of the zones in detail with an EM31 ground conductivity instrumentation. In total, 160.5 line kilometres of EM31 surveying was completed over 5 target areas, the Fondrana, Fotsy, Molo, Seta, and Besavoa targets.
The EM31 geophysical tool was invaluable in delineating the extents of the graphitic zones, as well as their continuity. The EM31 has the capability to also identify multiple graphitic horizons within each zone. As an example, the Fotsy zone has a delineated strike length of 6 kilometres, but the EM31 identified at least 4 separate graphite horizons within the zone, for an aggregate strike length of 24 kilometres. The table below summarizes the graphite strike length analysis as determined by EM31 testing over 5 zones:
34
|
Zone
|
Zone Length (km)
|
Number of Graphite Horizons
|
Aggregate EM31 Measured Strike Length (km)
|
|
Besavoa
|
3
|
4
|
12
|
|
Fondrana
|
1
|
3
|
3
|
|
Fotsy
|
6
|
4
|
24
|
|
Molo
|
2
|
5
|
10
|
|
Seta
|
1.6
|
2
|
3.2
|
|
Totals
|
13.6
|
18
|
52.2
|
Structurally ‘Thickened’ Graphite Zone Identified
Ouroutside geoscientists have identified a graphitic zone consisting of multi-folded graphitic strata with a surficially exposed strike length of over 2 kilometres. This zone, called Molo, is characterized by resistant ridges of graphitic schist, and abundant graphitic schist float, with fracture-lined vanadium mineralization yielding field XRF values as high as 0.7% V2O5. Geologic mapping has revealed the individual graphitic ridges to be between 20 and 150 metres in width within this zone. EM31 surveys indicate the graphite mineralization is pervasive in the area, and that the mineralization is not always exposed. Wide-spaced drilling of 6 diamond drill holes conducted over a strike length of 1.2 kilometres, intersected graphitic mineralization to a vertical depth of 75 metres with down-hole thicknesses between 60 and 150 metres in width. Graphite mineralization intersected in drill core was open along strike, and at depth.

Vanadium Trend Extended On To JV Property by 30 km
The vanadium trend found on the Green Giant Property has now been increased by an additional 30 kilometres on the Joint Venture Property. This trend was delineated through the analysis of soil samples with a hand-held XRF analyzer at 25 metre station intervals, and 200 metre line spacing. XRF analysis was an invaluable tool in delineating the original Green Giant Property vanadium trend, and enables our Company to make ‘real-time’ exploration decisions based on field results.
In the course of XRF soil analysis on the JV property, a 1.6 kilometre outcrop of graphitic schist, named the Seta zone, was identified adjacent to the vanadium trend. Geologic mapping in the area indicates that this zone is sub-horizontal, and roughly 20 metres in thickness.
35
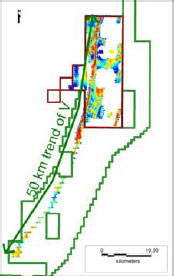
2011 Diamond Drilling
Petrographic work completed on the 2010 drilling samples resulted in the realization that a significant graphitic resource may exist on the Green Giant Property. Therefore, a 2-phase reconnaissance drilling program was implemented to test the viability and potential of graphitic resources defined during prospecting and mapping activities. Phase I of this program then resulted in the completion of 10 holes, for a combined aggregate of 1,157metres. Of these 10 holes, 2 were cut and quartered, and sent to Mintek, South Africa for metallurgical samples. No assurances can be provided as to the results of the analysis. Phase II of the program targeted significant graphitic occurrences on both the Green Giant and JV properties, with the aim of better defining known deposits and better understanding the new locations. This resulted in 19 holes for a combined aggregate of 1701m of drilling. Of these 19 holes, one larger diameter PQ hole was completed and sent to Activation Labs in Ancaster, Ontario, Canada for metallurgical analysis. No assurances can be provided as to the results of the analysis.
|
Target
|
Area
|
HoleID
|
UTMX
|
UTMY
|
Az
|
Dip
|
Depth
|
Elev
|
|
Graphite
|
FONDRANA
|
FOND-01
|
502132
|
7355354
|
110
|
-45
|
170
|
520
|
|
Graphite
|
FONDRANA
|
FOND-02
|
502103
|
7355162
|
110
|
-45
|
137
|
488
|
|
Graphite
|
FONDRANA
|
FOND-03
|
502108
|
7355455
|
110
|
-45
|
165
|
486
|
|
Graphite
|
FONDRANA
|
FOND-04
|
501962
|
7354981
|
115
|
-45
|
156
|
517
|
|
Graphite
|
FONDRANA
|
FOND-05
|
501987
|
7355555
|
90
|
-45
|
131
|
499
|
|
Graphite
|
FONDRANA
|
FOND-06
|
501797
|
7355061
|
95
|
-45
|
137.29
|
467
|
|
Graphite
|
FOTSY
|
FOTSY-01
|
507809
|
7335215
|
110
|
-45
|
173
|
500
|
|
Graphite
|
FOTSY
|
FOTSY-02
|
507808
|
7335015
|
90
|
-45
|
113
|
500
|
|
Graphite
|
FOTSY
|
FOTSY-03
|
507744
|
7334815
|
90
|
-45
|
113
|
500
|
|
Graphite
|
FOTSY
|
FOTSY-04
|
507818
|
7334820
|
90
|
-45
|
65
|
500
|
|
Graphite
|
FOTSY
|
FOTSY-05
|
507657
|
7334615
|
90
|
-45
|
104
|
500
|
|
Graphite
|
FOTSY
|
FOTSY-06
|
507651
|
7334415
|
90
|
-45
|
59
|
500
|
|
Graphite
|
FOTSY
|
FOTSY-07
|
507905
|
7335415
|
90
|
-45
|
71.5
|
500
|
|
Graphite
|
FOTSY
|
FOTSY-09
|
507815
|
7335336
|
90
|
-45
|
164
|
500
|
|
Graphite
|
FOTSY
|
FOTSY-10
|
507749
|
7335136
|
95
|
-45
|
161
|
500
|
|
Graphite
|
FOTSY
|
FOTSY-11
|
507715
|
7335015
|
90
|
-45
|
164
|
500
|
|
Graphite
|
FOTSY
|
FOTSY-12
|
507814
|
7335277
|
107
|
-45
|
149
|
432
|
|
Graphite
|
FOTSY
|
FOTSY-13
|
507945
|
7335578
|
107
|
-45
|
150
|
497
|
|
Graphite
|
FOTSY
|
FOTSY-14
|
507769
|
7335640
|
107
|
-45
|
155
|
413
|
|
Graphite
|
MOLO
|
MOLO-01
|
513173
|
7345735
|
90
|
-45
|
166
|
460
|
|
Graphite
|
MOLO
|
MOLO-02
|
513184
|
7345737
|
265
|
-45
|
47
|
460
|
|
Graphite
|
MOLO
|
MOLO-03
|
513177
|
7345478
|
105
|
-45
|
206
|
540
|
|
Graphite
|
MOLO
|
MOLO-04
|
513188
|
7345191
|
85
|
-45
|
137
|
540
|
|
Graphite
|
MOLO
|
MOLO-05
|
513065
|
7346400
|
90
|
-45
|
131
|
541
|
|
Graphite
|
MOLO
|
MOLO-06
|
512199
|
7345902
|
90
|
-45
|
200
|
541
|
|
Graphite
|
MOLO
|
MOLO-07
|
513186
|
7345615
|
90
|
-45
|
142.5
|
541
|
|
Vanadium
|
SETA
|
SETA-01
|
500125
|
7332500
|
100
|
-45
|
85
|
437
|
|
Graphite
|
SETA
|
SETA-02
|
500242
|
7332238
|
90
|
-45
|
90
|
437
|
|
Graphite
|
SETA
|
SETA-03
|
500242
|
7332238
|
95
|
-70
|
40
|
437
|
36
With this most recent drill program, a total of one hundred and sixty (160) diamond drill holes, comprising an aggregate of 24,814.3 metres have been completed on the Green Giant and JV property.
Assays received to date from the Phase I exploration program, have yielded drill intersections assaying up to 6.24% carbon (C) over 118.6 metres in length. Within the 100% owned Green Giant Property, numerous significant drill hole intersections have been made. Intersections include:
|
·
|
Hole ID: Fotsy 02 - Composite grade: 6.19%/10.77m (23.93 to 34.7m)
|
|
·
|
Hole ID: Fotsy 05 - Composite grade: 6.47%/23.0m (11.0 to 34.0m)
|
|
·
|
Hole ID: Fondrana 01 - Composite grade: 8.85%/25.5m (53.0 to 78.5m)
|
|
·
|
Hole ID: Fondrana 02 - Composite grade: 10.55%/39.52m (10.78 to 50.3m)
|
Fondrana Zone (Green Giant Property)
The Fondrana zone is located in the NW corner of the Green Giant Property. Complete assay results for 3 drill holes and 4 trenches have been received and, based on this information, our geoscientists are comfortable in commenting on the widths, depth, and strike extents of graphite mineralization in the Fondrana zone. The average aggregate graphite intersection from drilling is 73 metres with a weighted average carbon assay of 6.14% C, while the average aggregate trench intersection is 82.5 metres with a weighted average of 6.73% C. The Fondrana zone is found at surface and extends to a vertical depth of at least 120 metres. Geophysically, geologically, and now through drilling and trenching, the zone is confirmed to extend for at least 800 metres in strike length. Mineralization is open along strike, and at depth.Highlights of Phase I drilling the Fondrana Zone include:
|
·
|
FOND-01: 118.6 m @ 6.24% C
|
|
·
|
FOND-02: 12 m @ 4.73% C
|
|
·
|
FOND-02: 41.5 m @ 7.01% C
|
|
·
|
FOND-02: 5.9 m @ 5.88% C
|
|
·
|
FOND-05: 24 m @ 5.63% C
|
|
·
|
FOND-05: 18 m @ 5.18% C
|
During the 2011 program (Phase II) an EM-31 geophysical survey was conducted over an area known to have significantoutcrops with very notable graphitic content. The survey outlined a zone length of over 800metres, with an aggregate EM-31 measured strike length of 3kilometres. This, along with the confirmation of 3 strong graphitic horizons supported drilling and trenching evidence.
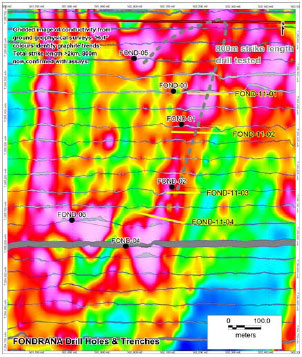
EM-31 Geophysical Survey Map of the Fondrana zone.
Fotsy Zone (Green Giant Property)
The Fotsy zone is located in the SE corner of the Green Giant Property. Assay results for 7 drill holes and 16 trenches are currently available. Based on the information available, widths, depth, and strike extents of graphite mineralization in the Fotsy zone have been defined. The average aggregate graphite intersection from drilling along the ‘Fotsy Main Zone’ is 20.8 metres with a weighted average carbon assay of 5.62% C, while the average aggregate trench intersection is 10.9 metres with a weighted average of 6.33% C. The Fotsy zone is found at surface, extends to a vertical depth of at least 115 metres, and is open along strike and at depth. Geophysically, geologically, and now through drilling and trenching, the zone is confirmed to extend for at least 800 metres in strike length. Mapping and prospecting have indicated that this zone likely extends for over 6 kilometres in length.
37
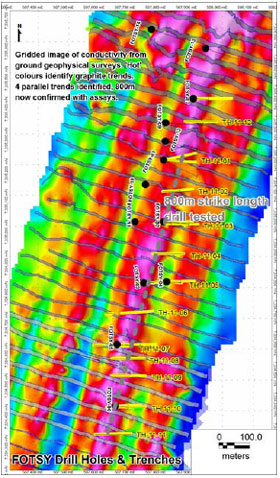
EM-31 Geophysical Survey Map of the Fotsy zone.
Highlights of Phase I drilling the Fotsy Zone include:
|
·
|
FOTSY-5: 8.35m @ 7.01%
|
|
·
|
FOTSY-5: 23.0m @ 6.47%
|
|
·
|
FOTSY-10: 11 m @ 4.39% C
|
|
·
|
FOTSY-10: 15 m @ 5% C
|
|
·
|
FOTSY-10: 5 m @ 5.18% C
|
Molo Zone (JV Property)
The Molo zone is located in the central portion of the JV Property. During 2011 (Phase II) exploration activities, our geoscientists identified this graphitic zone consisting of multi-folded graphitic strata with a surficially exposed strike length of over 2 kilometres. The zone is surficially characterized by resistant ridges of graphitic schist, and abundant graphitic schist float, with fracture-lined vanadium mineralization yielding field XRF values as high as 0.7% V2O5.
During the 2011 program (Phase II) an EM31 geophysical survey was also conducted over the Molo area concurrently with prospecting and subsequent geological mapping of stronger graphitic zones in the zone. The survey aided in outlining a zone length of over 2kilometres, with an Aggregate EM31 Measured Strike Length of 10km. This, along with the confirmation of 5 strong graphitic horizons supported drilling and trenching, providing significant interest in the zone where future efforts will likely be focused.
38

EM-31 Geophysical Survey Map of the Molo zone.
Wide-spaced drilling of 6 diamond drill holes conducted over a strike length of 1.2 kilometres, intersected graphitic mineralization to a vertical depth of 75 metres with down-hole thicknesses between 60 and 150 metres in width. Graphite mineralization intersected in drill core was open along strike, and at depth.
2011 Trenching
The 2011 exploration focus on graphite mineralization resulted in the implementation of a number of new areas to be trenched for graphitic potential. Phase I of the program focussed primarily on the Fondrana and Fotsy locations and resulted in the completion of 20 trenches for 1912 m. All activities completed during 2011 were completed ‘in-house’ by our technical team of geologist, geo-physicists and geo-techs.
Standardized sampling methods included two metre long continuous chip samples collected along the trench floor, consisting of about 3 kg to 4 kg of material per sample. The samples were collected in numbered plastic bags with the sample location noted in the assay tag book. The trench samples were then transported daily to camp and stored in a secure building. When sufficient sample material was collected, the samples were trucked or flown to Energizer’s office storage location in Antananarivo accompanied by an Energizer employee. From there, samples were further shipped to either South Africa (Mintek) or Canada (Activation Labs) for ICP-MS analysis.
|
Area
|
Trench ID
|
Proposed
|
UTMX
|
UTMY
|
UTMX
|
UTMY
|
Az
|
Length
|
|
Length (m)
|
West
|
West
|
East
|
East
|
(m)
|
|||
|
FOTSY
|
FOTSY_TH_11_01
|
100
|
507818
|
7335216
|
507912
|
7335209
|
90
|
94
|
|
FOTSY
|
FOTSY_TH_11_02
|
90
|
507805
|
7335113
|
507904
|
7335121
|
90
|
99
|
|
FOTSY
|
FOTSY_TH_11_03
|
100
|
507777
|
7335009
|
507921
|
7335007
|
270
|
144
|
|
FOTSY
|
FOTSY_TH_11_04
|
100
|
507772
|
7334911
|
507875
|
7334911
|
90
|
103
|
|
FOTSY
|
FOTSY_TH_11_05A
|
50
|
507715
|
7334815
|
507780
|
7334816
|
270
|
65
|
|
FOTSY
|
FOTSY_TH_11_05B
|
30
|
507838
|
7334818
|
507867
|
7334815
|
270
|
29
|
|
FOTSY
|
FOTSY_TH_11_06A
|
20
|
507620
|
7334713
|
507642
|
7334716
|
270
|
22
|
|
FOTSY
|
FOTSY_TH_11_06B
|
100
|
507671
|
7334716
|
507775
|
7334724
|
270
|
104
|
|
FOTSY
|
FOTSY_TH_11_07A
|
30
|
507581
|
7334614
|
507616
|
7334613
|
90
|
35
|
|
FOTSY
|
FOTSY_TH_11_07B
|
60
|
507644
|
7334611
|
507705
|
7334609
|
90
|
61
|
|
FOTSY
|
FOTSY_TH_11_08
|
100
|
507639
|
7334570
|
507747
|
7344571
|
90
|
108
|
|
FOTSY
|
FOTSY_TH_11_09
|
100
|
507638
|
7334516
|
507750
|
7334514
|
90
|
112
|
|
FOTSY
|
FOTSY_TH_11_10
|
100
|
507621
|
7334411
|
507749
|
7334413
|
90
|
128
|
|
FOTSY
|
FOTSY_TH_11_11
|
100
|
507585
|
7334323
|
507702
|
7334327
|
90
|
117
|
|
FOTSY
|
FOTSY_TH_11_12A
|
100
|
507878
|
7335341
|
507983
|
7335339
|
90
|
105
|
|
FOTSY
|
FOTSY_TH_11_12B
|
50
|
508048
|
7335334
|
508098
|
7335318
|
90
|
50
|
|
FONDRANA
|
FOND_TH_11_01
|
100
|
502152
|
7355448
|
502274
|
7355445
|
90
|
118
|
|
FONDRANA
|
FOND_TH_11_02
|
100
|
502103
|
7355331
|
502268
|
7355326
|
90
|
166
|
|
FONDRANA
|
FOND_TH_11_03
|
100
|
502089
|
7355145
|
502187
|
7355144
|
90
|
100
|
|
FONDRANA
|
FOND_TH_11_04
|
150
|
501989
|
7355085
|
502141
|
7355051
|
90
|
152
|
39
Initial graphitic carbon results from the 2011 trenching are, management believes, encouraging in that they indicate that there are multiple graphitic horizons present in each zone, and that the graphitic zones are of significant widths and grades.
|
Trench
|
From (m)
|
To (m)
|
C (%)
|
Interval (m)
|
|
FOND-TH-11-02
|
24
|
29
|
4.194
|
5
|
|
FOND-TH-11-02
|
58
|
94
|
6.09833
|
36
|
|
FOND-TH-11-02
|
104
|
110
|
9.66667
|
6
|
|
FOND-TH-11-02
|
112
|
128
|
6.87625
|
16
|
|
FOND-TH-11-02
|
129
|
136
|
4.60429
|
7
|
|
FOND-TH-11-02
|
138
|
151
|
13.9592
|
13
|
|
FOND-TH-11-02
|
154
|
164
|
5.542
|
10
|
|
FOND-TH-11-03
|
3
|
12
|
4.95333
|
9
|
|
FOND-TH-11-03
|
22
|
51
|
6.44103
|
29
|
|
FOND-TH-11-03
|
64
|
76
|
5.095
|
12
|
|
FOND-TH-11-03
|
83
|
92
|
9.10444
|
9
|
|
FOTSY-TH-11-01
|
76
|
82
|
4.43667
|
6
|
|
FOTSY-TH-11-02
|
19
|
24
|
5.566
|
5
|
|
FOTSY-TH-11-03
|
21
|
26
|
7.512
|
5
|
|
FOTSY-TH-11-03
|
96
|
102
|
10.1433
|
6
|
|
FOTSY-TH-11-03
|
125
|
134
|
8.59111
|
9
|
|
FOTSY-TH-11-04
|
20
|
28
|
4.2425
|
8
|
|
FOTSY-TH-11-04
|
82
|
90
|
6.67
|
8
|
|
FOTSY-TH-11-05A
|
7
|
17
|
9.9315
|
10
|
|
FOTSY-TH-11-05A
|
59
|
65
|
5.33667
|
6
|
|
FOTSY-TH-11-06B
|
21
|
27
|
9.525
|
6
|
|
FOTSY-TH-11-06B
|
35
|
43
|
7.7875
|
8
|
|
FOTSY-TH-11-06B
|
67
|
77
|
8.485
|
10
|
|
FOTSY-TH-11-07B
|
31
|
43
|
11.26
|
12
|
|
FOTSY-TH-11-08
|
28
|
38
|
13.818
|
10
|
|
FOTSY-TH-11-08
|
69
|
77
|
6.38125
|
8
|
|
FOTSY-TH-11-09
|
13
|
21
|
5.335
|
8
|
|
FOTSY-TH-11-09
|
29
|
35
|
6.72667
|
6
|
|
FOTSY-TH-11-10
|
7
|
13
|
6.23667
|
6
|
|
FOTSY-TH-11-11
|
57
|
62.5
|
6.31818
|
5.5
|
|
FOTSY-TH-11-11
|
65
|
73
|
7.005
|
8
|
|
FOTSY-TH-11-12A
|
21.5
|
29
|
10.2967
|
7.5
|
|
FOTSY-TH-11-12A
|
40
|
46
|
5.72667
|
6
|
40
Next Steps
It would be appropriate at this time to comment on time lines related to receipt of assays, and the need for metallurgical analysis to fully outline the type and quality of the graphite on the properties. Our management believes that after receiving assays it is both prudent and necessary to wait for the metallurgical analysis to fully inform the market of the potential of the graphite identified todate, but it should be noted that we are comfortable in identifying the graphite as flake based on visual observation and cursory testing. We will endeavor to expedite the metallurgical process throughout its exploration programs.
Future Programs
The Madagascar properties, we believe, merit an exploration program designed to delineate a Canadian National Instrument 43-101 compliant graphite resource. An8,000 metre, 90-hole drill program will employ two diamond drills to verify mineralized zones previously confirmed through drilling, trenching and/or prospecting.This program is anticipated to commence during late May or June 2012.
Our Canadian National Instrument 43-101 compliant resource estimate confirmed that a significant amount of vanadium has been discovered in the mineralized zones that account for a very small portion (2.55kilometres) of the overall 48-kilometre trend of vanadium mineralization. To date, 160 diamond drill holes and 167 trenches have been completed on the property. With the discovery of graphite during the latter half of 2011, management changed the scope ofthe NI 43-101 compliant preliminary economic assessment (“PEA”/scoping) study, which was scheduled for completion during late 2011/early 2012.Wenow anticipate a NI 43-101 compliant graphite resource will be available for the Green Giant Property by the end of September 2012. This information will be incorporated into a revised PEA study, which is expected to be completed by December 2012.
The economic potential of the property rests upon the ability to extract vanadium and graphite using reasonable, potentially economic parameters. We are carrying out further larger sample tests and more complete mineralogy and metallurgical testing of vanadium and graphite ores to establish the technological and economic parameters of vanadium and graphite processing. The goal of this work is to identify potentially economic processing methods to extract both vanadium and graphite, which are known to exist on the property.
41
SAGAR PROPERTY
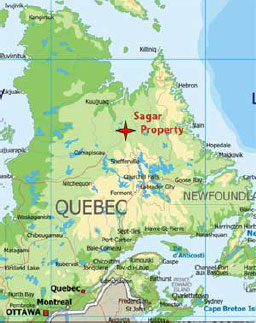
Property Description and Location
The Sagar Property comprises 219 blocks of claims in the Province of Québec, Canada. The approximate centreof exploration activity is circa 56°22’ N latitude and circa 68° 00’ W longitude. Details on the individual claims are available on-line at the Government of Québec’s Ministère des Resources Naturelles et de la Faune GESTIM website at https://gestim.mines.gouv.qc.ca. This property can be accessed by air.
The area comprising these claims is approximately 6,580 hectares. In this part of the Province of Québec, “map staking” predetermines claim outlines. Previously, the map-staking grid, producing some of the small parcels, superimposes upon staked claims. There are no carried environmental liabilities on the property. All surface work requires provincial government permits, including camp construction permits. These have been acquired.
Agreement
On May 2, 2006, we signed a letter of intent with Virginia Mines Inc. ("Virginia") for an option to acquire a 75% interest in 200 claims located in northern Québec , Canada. Virginia had the right and option to sell the remaining 25% interest in the property. This agreement was subject to a 2% NSR. Virginia had previously acquired a 100% interest in the property, subject to a 1% NSR on certain claims, and a 0.5% NSR on other claims. Virginia has the right to buy back half of the 1% NSR for $200,000 and half of the 0.5% NSR for $100,000. In order to exercise its option, we issued 2,000,000 of our common shares, 2,000,000 now expired common share purchase warrants and incurred exploration expenditures greater than $2,000,000on the property before September 1, 2008. Further, on February 28, 2007 Virginia exercised its option to sell its remaining 25% interest on the property to us for 1,000,000 of our common shares valued at $1,219,000 and 1,000,000 now expired common share purchase warrants. As a result of these agreements, we now own a 100% interest in this property. We are currently up to date with all obligations required to maintain the property in good standing.
FERDERBER
Property Description and Location
We acquired a 100% undivided right, title and interest in and to 19 mining claims (0036315, 0036316, 0036317, 0036318, 0036319, 0036320, 0036321, 0036322, 0036323, 0036324, 0036325, 0036326, 0036327, 0030649, 0030650, 0030640, 0030638, 0030612, 0030613) held by Mr. Peter Ferderber, covering an area of approximately 64 hectares located in the Central Labrador Trough Region of Québec, 13 of which are contiguous to our Sagar Property. This property can be accessed by air. In consideration of our receiving a 100% interest in these claims, subject to any NSR royalties, we paid Mr. FerderberCAD$6,000, and issued 150,000 of our common shares and 75,000 now expired common share purchase warrants. Mr. Ferderber retained a 1% NSR on this property and agreed that we shall have a first right of refusal to purchase the 1% NSR should Mr. Ferderber elect to sell the royalty.We are currently up to date with all obligations required to maintain the property in good standing.
42
Sagar and Ferderber Property Geological Highlights
The geological setting of the property is the northwest trending Romanet Horst within the Labrador Trough. The significant mineral potential of this geological setting is well demonstrated, we believe, by the abundance and diversity of uranium-gold showings, which range from veins to breccia’s to shear zones. There is also locally significant sedimentary-hosted copper mineralization. Our management contends that the most significant mineralization found to date is the 500 x 200 metreMistamisk boulder field which contains 150 boulders that range up to 640 g/t gold and 4.11% uranium, with 70 tested boulders averaging 64.9g/t gold and 1.3% uranium. The boulders discovered within the Mistamisk boulder field range in length from 0.30 to 2.0 metres. Previous work has not determined the bedrock source of this boulder field.
Copper mineralization has been defined in several spots, the most significant being the Dehli-Pacific showing, which has reported 4.2% copper over 7.6 metres within a drill hole that intersected a shear zone along a sediment-gabbro contact.
Potential Future Programs
In light of empirical observations collected during the course of 2007 exploration activities, other targets have been identified which could prove to be volumetrically more significant than the source of the Mistamisk Boulder Field. In order of priority, management believes future exploration on the Sagar Property should focus on the discovery of:
|
·
|
Gold and uranium mineralization at redox boundaries along major faults. This work should focus on the intersection between the Romanet fault and the reducing lithologies of the Dunphy and Lace Lake formations.
|
|
·
|
Unconformity associated polymetallic uranium-style mineralization at the Archean basement contact. The ‘Kilo’ soil anomaly should be targeted for this exploration due to the anomalous soil, RC, and DDH geochemistry, as well as the numerous coincident geophysical anomalies.
|
|
·
|
Iron-Oxide Copper Gold (IOCG) mineralization. This work should focus on the east-west structure bisecting the Romanet Horst. In particular, the area to the southwest of the Lac Plisse showing should be drill tested as it has coincident gravity and magnetic highs, and has an anomalous IOCG-related geochemical signature for RC, soil, and water geochemical data. Additionally, the DDH geochemistry and alteration mineralogy observed from holes in the ‘Alpha’ soil target area should be re-examined in the context of IOCG mineralization.
|
|
·
|
Source mineralization for the Mistamisk Boulder Field. The anomalous Alpha, Delta, and Kilo soil targets, as well as A, B, and E RC targets identified during the course of the 2007 exploration program should be examined to ascertain the source mineralization for the Mistamisk Boulder Field.
|
Other Expenses
Management anticipates spending approximately $350,000 - $450,000 in ongoing general office and administration expenses and professional fees per quarter for the next twelve months. The overall general and administration expenses will vary in direct proportion with the level of activity relating to future acquisitions and exploration programs.
Cautionary Note
Due to the nature of our business, we anticipate incurring operating losses for the foreseeable future. We base this expectation, in part, on the fact that very few mineral properties in the exploration stage ultimately develop into producing profitable mines. Our future financial results are also uncertain due to a number of factors, some of which are outside our control. These factors include, but are not limited to:
|
·
|
our ability to raise additional funding as required;
|
|
·
|
the market price for vanadium, graphite, gold, uranium and for any other minerals which we may find;
|
|
·
|
ongoing joint ventures;
|
|
·
|
the results of our proposed exploration programs on our mineral properties
|
|
·
|
environmental regulations that may adversely impact cost and operations; and
|
|
·
|
our ability to find joint venture partners, as needed, for the development of our property interests.
|
If we are successful in completing an equity financing, as necessary, existing shareholders will experience dilution of their interest in our company. In the event we are not successful in raising additional financing, we anticipate that we will not be able to proceed with our business plan. In such a case, we may decide to discontinue our current business plan and seek other business opportunities in the resource sector.
During this period, we will need to maintain our periodic filings with the appropriate regulatory authorities and, as such, will incur legal and accounting costs. In the event no other such opportunities are available and we cannot raise additional capital to sustain operations, we may be forced to discontinue our business altogether. We do not have any specific alternative business opportunities in mind and have not planned for any such contingency.
43
Due to our lack of operating history and present inability to generate revenues, our auditors have stated their opinion that there currently exists substantial doubt about our ability to continue as a going concern.
RESULTS OF OPERATIONS
We have had no operating revenues from inception on March 1, 2004 through to the quarter ended March 31, 2012. Our activities have been financed from the proceeds of securities subscriptions. From inception, on March 1, 2004, to March 31, 2012, we raised net aggregate proceeds of $38,099,105 from private offerings of our securities and $955,500 through the exercise of common share purchase warrants and stock options. For the nine month period ending March 31, 2012 a total of $704,000 (March 31, 2011: $13,681,320) was raised through private offerings and the exercise of stock options. $635,000 of this amount was raised through the DRA private placement. During the prior period, a total of $13,217,120 was raised through a private placement and $464,200 was raised through the exercise of common share purchase warrants and stock options.
For the period from inception, March 1, 2004, to March 31, 2012, we incurred a loss before income taxes of $65,142,353. Expenses included $33,304,267 in mineral property and exploration costs and impairment losses on mineral properties. These costs include acquisition costs relating to the Madagascar properties, Sagarproperties and other abandoned properties. We also incurred $5,078,701in professional fees since inception and general and administrative expenses of $6,100,380; stock based compensation valued at $22,668,884, net foreign exchange translation gainstotaling $956,836, donated services and expenses of $18,750, and total other income (including interest) of $1,133,712.
The following are explanations for the fluctuations during the nine month period ended March 31, 2012:
|
·
|
Amounts spent on mineral properties totaled $7,047,803 (March 31, 2011: $1,106,906). Included within this total were acquisition costs relating to the transaction with Malagasy totaling $3,770,129 (was recorded within the statement of operations under impairment losses),drilling costs associated with the November-December 2011 drill program and metallurgical analysis and various geological testing incurred during the period. Following our accounting policies of expensing acquisition costs and exploration expenses on mineral properties as incurred, this amount increased the net loss for the period.
|
|
·
|
Professional feestotaled $1,380,506 up $497,460 from the March 31, 2011 total of $883,046. The increase is due to the utilization of more professionals internally as well as increased legal and accounting service fees paid to external parties both in Canada. Mauritius and Madagascar.
|
|
·
|
General and administration relates to fees associated with running the Toronto and Madagascar offices. These costs increased $87,843 between periods (March 31, 2012: $1,061,596, March 31, 2011: $973,753). The increase is mainly due to increased travel expenses for trips to Madagascar, Mauritius, Europe and to Australia to finalize the Malagasy joint venture agreement.
|
|
·
|
Investment income increased by $47,192 from $27,047 for March 31, 2011 to $74,239 for March 31, 2012. Due to the companies higher cash position in the early part of fiscal 2012, more funds were available to be invested in various money market funds, bond funds and dual currency deposits.
|
Liquidity, Capital Resources and Foreign Currencies
As at March 31, 2012, we had cash on hand of $1,169,726 plus an investment in a monthly income bond fund valued at $3,471,587 and investments in public companies listed on the TSX-Venture exchange totaling $34,000. Our working capital was $4,669,314.
We hold a significant portion of cash reserves in Canadian dollars. Due to foreign exchange rate fluctuations, the value of these Canadian dollar reserves can result in translation gains or losses in US dollar terms. If there was to be a significant decline in the Canadian dollar against the US dollar, the US dollar value of that Canadian dollar cash position presented on our balance sheet would also significantly decline. If the US dollar significantly declines relative to the Canadian dollar, our quoted US dollar cash position would also significantly decline. Such foreign exchange declines could cause us to experience losses.
In addition to paying certain expenses in Canadian dollars, we are also required, from time to time, to pay expenses in South African Rand, Australian Dollars and Madagascar Ariary. Therefore, we are subject to risks relating to movements in those currencies.
There are no assurances that we will be able to achieve further sales of common shares or any other form of additional financing. If we are unable to achieve the financing necessary to continue the plan of operations, then we will not be able to continue our exploration and our venture will fail.
44
Capital Financing
|
·
|
From inception to June 30, 2004, we raised $59,750 through the issuance of 9,585,000 common shares.
|
|
·
|
For the year ended June 30, 2005, we did not raise any capital from new financings.
|
|
·
|
For the year ended June 30, 2006, we raised $795,250 through the issuance of 2,750,000 common shares and 2,265,000 common share purchase warrants.
|
|
·
|
For the year ended June 30, 2007, we raised $17,300,000 through the issuance of 34,600,000 common shares and 29,000,250 common share purchase warrants.
|
|
·
|
For the year ended June 30, 2008, we did not raise any capital from new financings.
|
|
·
|
For the year ended June 30, 2009, we raised $680,000 through the issuance of 6,800,000 common shares and 3,400,000common share purchase warrants.
|
|
·
|
For the year ended June 30, 2010, we raised $6,500,000 through the issuance of 21,666,667 common shares and 21,666,667 common share purchase warrants.
|
|
·
|
For the year ended June 30, 2011, we raised net proceeds of $13,178,708 through the issuance of 30,936,654 common shares and 15,468,328 common share purchase warrants and $886,501 (by issuing 4,549,500 common shares) through the exercise of common share purchase warrants.
|
|
·
|
For the period from July 1, 2011 throughMarch 31, 2012, we raised proceeds of $635,000 through the issuance of common shares and $69,000 (by issuing 460,000 common shares) through the exercise of stock options.
|
We will likely require additional funding which will be in the form of equity financing from the sale of our common shares. However, we cannot provide investors with any assurance that we will be able to raise sufficient funding from the sale of common shares for additional phases of exploration. Our management currently believes that debt financing is not an alternative for funding additional phases of exploration. Currently, we do not have any arrangements in place for any future equity financing.
Issuances of Securities
We have funded our business to date from sales of our securities.
On December 17, 2010,we issued 200,000 shares of our common shares valued at $90,000 pursuant to a contract with a party to provide advisory services in China.
During January and February 2011, we closed a private placement of 30,936,654 units for gross proceeds of $13,921,495. Each unit consisted of one common share and one half of one common share purchase warrant (a “Unit”). Each of the 15,468,327 warrants issued entitles the holder the right to purchase one common share at an exercise price of $0.75 for a period of two years from the date of issue. In connection with the private placement, we paid finders’ fees consisting of a cash fee of 6% to certain eligible finders totaling $704,115, TSX-V fees totaling $38,411 and compensation warrants equal to 6% of the eligible units sold totaling 1,564,700. Each full compensation warrant entitles the holder to acquire one Unit at $0.45 per unit and expire on February 25, 2013.
During the year ended June 30, 2011, we issued a total of 4,549,500 of our common shares for consideration of $886,501. These common shares were issued pursuant to the exercise of several common share purchase warrants.
On December 16, 2011, the Company issued 7,500,000 shares of common stock at $0.18 per share valued at $1,350,000 as consideration for the Joint Venture Agreement with Malagasy Minerals Ltd.
On March 4, 2012, $69,000 was raised through the exercise of 460,000 stock options at $0.15 per common share.
On March 25, 2012, the Company closed a private placement with DRA whereby it raised a total of $635,000 by issuing 2,540,000 common stock at $0.25 per common share. This results in DRA having a current equity position in our company of approximately 1.5%. Under the terms of a Memorandum of Understanding signed during early 2012, DRA has the right to acquire up to a 5% equity position our company through private placement. Future private placements will be done at market conditions.
45
The offer and sale of all shares of our common shares and warrants listed above were affected in reliance on the exemptions for sales of securities not involving a public offering, as set forth in Regulation S promulgated under the Securities Act. The Investor acknowledged the following: Subscriber is not a United States Person, nor is the Subscriber acquiring the shares of our common stock and warrants directly or indirectly for the account or benefit of a United States Person. None of the funds used by the Subscriber to purchase the shares of our common stock and warrants have been obtained from United States Persons. For purposes of this Agreement, “United States Person” within the meaning of U.S. tax laws, means a citizen or resident of the United States, any former U.S. citizen subject to Section 877 of the Internal Revenue Code, any corporation, or partnership organized or existing under the laws of the United States of America or any state, jurisdiction, territory or possession thereof and any estate or trust the income of which is subject to U.S. federal income tax irrespective of its source, and within the meaning of U.S. securities laws, as defined in Rule 902(o) of Regulation S, means: (i) any natural person resident in the United States; (ii) any partnership or corporation organized or incorporated under the laws of the United States; (iii) any estate of which any executor or administrator is a U.S. person; (iv) any trust of which any trustee is a U.S. person; (v) any agency or branch of a foreign entity located in the United States; (vi) any non-discretionary account or similar account (other than an estate or trust) held by a dealer or other fiduciary for the benefit or account of a U.S. person; (vii) any discretionary account or similar account (other than an estate or trust) held by a dealer or other fiduciary organized, incorporated, or (if an individual) resident in the United States; and (viii) any partnership or corporation if organized under the laws of any foreign jurisdiction, and formed by a U.S. person principally for the purpose of investing in securities not registered under the Securities Act, unless it is organized or incorporated, and owned, by accredited investors (as defined in Rule 501(a)) who are not natural persons, estates or trusts.Further, we anticipate that additional funding will be in the form of equity financing from the sale of our common stock. However, we cannot provide investors with any assurance that we will be able to raise sufficient funding for additional phases of exploration. We currently believe that debt financing will not be an alternative for funding additional phases of exploration. We do not have any arrangements in place for any future equity financing.
There are no assurances that we will be able to achieve further sales of our common stock or any other form of additional financing. If we are unable to achieve the financing necessary to continue our plan of operations, then we will not be able to continue our exploration and our venture will fail.
Off-balance sheet arrangements
We have no off-balance sheet arrangements including arrangements that would affect the liquidity, capital resources, market risk support and credit risk support or other benefits.
ITEM 3. - QUANTITATIVE AND QUALITATIVE DISCLOSURES ABOUT MARKET RISK
We do not hold any derivative instruments and do not engage in any hedging activities. Most of our activity is the development and mining of our mining claim.
ITEM 4. - CONTROLS AND PROCEDURES
Our management team, under the supervision and with the participation of our principal executive officer and our principal financial officer, evaluated the effectiveness of the design and operation of our disclosure controls and procedures as such term is defined under Rule 13a-15(e) promulgated under the Securities Exchange Act of 1934, as amended (Exchange Act), as of the last day of the fiscal period covered by this report, March31, 2012. The term disclosure controls and procedures means our controls and other procedures that are designed to ensure that information required to be disclosed by us in the reports that we file or submit under the Exchange Act is recorded, processed, summarized and reported, within the time periods specified in the SEC’s rules and forms. Disclosure controls and procedures include, without limitation, controls and procedures designed to ensure that information required to be disclosed by us in the reports that we file or submit under the Exchange Act is accumulated and communicated to management, including our principal executive and principal financial officer, or persons performing similar functions, as appropriate to allow timely decisions regarding required disclosure. Based on this evaluation, our principal executive officer and our principal financial officer concluded that, given the size of our Company and its finance department, that our disclosure controls and procedures were effective as of March 31, 2012.
Changes in Internal Control over Financial Reporting
During the fiscal quarter ended March 31, 2012, no changes were made to our internal control over financial reporting that have materially affected, or are reasonably likely to materially affect, our internal control over financial reporting.
46
PART II – OTHER INFORMATION
ITEM 1. - LEGAL PROCEEDINGS
We are currently not involved in any litigation that we believe could have a material adverse effect on our financial condition or results of operations. There is no action, suit, proceeding, inquiry or investigation before or by any court, public board, government agency, self-regulatory organization or body pending or, to the knowledge of the executive officers of our Company or any of our subsidiaries, threatened against or affecting our Company, our common stock, any of our subsidiaries or of our companies or our subsidiaries' officers or directors in their capacities as such, in which an adverse decision could have a material adverse effect.
ITEM 1A. - RISK FACTORS
Our business is subject to a variety of risks and uncertainties, including, but not limited to, the risks and uncertainties described below. If any of the risks described below, or elsewhere in this report on Form 10-Q, or our Company’s other filings with the Securities and Exchange Commission (the "SEC"), were to occur, our financial condition and results of operations could suffer and the trading price of our common stock could decline. Additionally, if other risks not presently known to us, or that we do not currently believe to be significant, occur or become significant, our financial condition and results of operations could suffer and the trading price of our common stock could decline.
You should carefully consider the following risk factors together with the other information contained in this Interim Report on Form 10-Q, and in prior reports pursuant to the Securities Exchange Act of 1934, as amended and the Securities Act of 1933, as amended. If any of the risk factors actually occur, our business, financial condition or results of operations could be materially adversely affected. Additionally, if other risks not presently known to us, or that we do not currently believe to be significant, occur or become significant, our financial condition and results of operations could suffer and the trading price of our common stock could decline. There has been no material changes to the risk factors previously discussed in Item 1A of our Company's Form 10-K for the year ended June 30, 2011, including but not limited, to the following:
The report of our independent registered public accounting firm contains explanatory language that substantial doubt exists about our ability to continue as a going concern.
The independent auditor’s report on our financial statements contains explanatory language that substantial doubt exists about our ability to continue as a going concern. Due to our lack of operating history and present inability to generate revenues, we have sustained operating losses since our inception. Since our inception, up to March 31, 2012, we had accumulated net losses of $65,142,353. If we are unable to obtain sufficient financing in the near term as required or achieve profitability, then we would, in all likelihood, experience severe liquidity problems and may have to curtail our operations. If we curtail our operations, we may be placed into bankruptcy or undergo liquidation, the result of which will adversely affect the value of our common shares.
Our common shares have been subject to penny stock regulation in the United States of America.
Our common shares have been subject to the provisions of Section 15(g) and Rule 15g-9 of the (US) Securities Exchange Act of 1934, as amended (the “Exchange Act”), commonly referred to as the “penny stock” rule. Section 15(g) sets forth certain requirements for transactions in penny stocks and Rule 15g-9(d)(1) incorporates the definition of penny stock as that used in Rule 3a51-1 of the Exchange Act. The Commission generally defines penny stock to be any equity security that has a market price less than US$5.00 per share, subject to certain exceptions. Rule 3a51-1 provides that any equity security is considered to be penny stock unless that security is: registered and traded on a national securities exchange meeting specified criteria set by the Commission; issued by a registered investment company; excluded from the definition on the basis of price (at least US$5.00 per share) or the registrant’s net tangible assets; or exempted from the definition by the Commission. If our common shares are deemed to be “penny stock”, trading in common shares will be subject to additional sales practice requirements on broker/dealers who sell penny stock to persons other than established customers and accredited investors.
Financial Industry Regulatory Authority, Inc. (“FINRA”) sales practice requirements may limit a shareholder’s ability to buy and sell our common shares.
In addition to the “penny stock” rules described above, FINRA has adopted rules that require that in recommending an investment to a customer, a broker-dealer must have reasonable grounds for believing that the investment is suitable for that customer. Prior to recommending speculative low priced securities to their non-institutional customers, broker-dealers must make reasonable efforts to obtain information about the customer’s financial status, tax status, investment objectives and other information. Under interpretations of these rules, FINRA believes that there is a high probability that speculative low priced securities will not be suitable for at least some customers. FINRA requirements make it more difficult for broker-dealers to recommend that their customers buy our common shares, which may limit your ability to buy and sell our stock and have an adverse effect on the market for our shares.
47
We may not have access to sufficient capital to pursue our business and therefore would be unable to achieve our planned future growth.
We intend to pursue a growth strategy that includes development of our Company’s business plan. Currently we have limited capital, which is insufficient to pursue our plans for development and growth. Our ability to implement our exploration plans will depend primarily on our ability to obtain additional private or public equity or debt financing. Such financing may not be available at all, or we may be unable to locate and secure additional capital on terms and conditions that are acceptable to us. Financing exploration plans through equity financing may have a dilutive effect on our common shares. Our failure to obtain additional capital will have a material adverse effect on our business.
Our primary exploration efforts are in the African country of Madagascar, where there is uncertainty with regard to its leader’s commitment to democratic elections.
The timing of democratic elections in Madagascar remains uncertain. To date, our Company has not been placed under any constraints or experienced any disruptions in our exploration efforts due to the political situation in Madagascar. Depending on future actions taken by the transitional government in Madagascar, our Company and its business operations could be impacted.
A roadmap was signed by the various political factions on September 17, 2011, a government of national unity was formed in November and the transition parliament was re-structured to include opposition members. The African Union has endorsed this roadmap. This roadmap provides a path for democratic elections in Madagascar. However, at the date of this report, these elections have not taken place and are unlikely to take place until the latter stages of 2012, at the earliest.
As the roadmap has not been fully implemented, the EU has extended its suspension of development assistance to Madagascar (with the continuing exception for humanitarian aid). With UN assistance, the transition government introduced a law with respect to the independent elections commission which was adopted by the transition parliament in January 2012. Presently, other elections-related laws are being studied by the parliament. We are actively monitoring the political climate in Madagascar and continue to hold meetings with representatives of the government and the Ministry of Mines.
The granting, transformation or amendment of exploration and research mining permits within the country continues to be suspended. Our Company has continued to pay taxes and administrative fees in Madagascar with respect to all the mining permits we hold. These payments have been acknowledged and accepted by the Madagascar government.
Any adverse developments to the political situation in Madagascar could have a material effect on our Company’s business, results of operations and financial condition.
As a public company we are subject to complex legal and accounting requirements that will require us to incur significant expenses and will expose us to risk of non-compliance.
As a public company, we are subject to numerous legal and accounting requirements that do not apply to private companies. The cost of compliance with many of these requirements is material, not only in absolute terms but, more importantly, in relation to the overall scope of the operations of a small company. Our relative inexperience with these requirements may increase the cost of compliance and may also increase the risk that we will fail to comply. Failure to comply with these requirements can have numerous adverse consequences including, but not limited to, our inability to file required periodic reports on a timely basis, loss of market confidence, delisting of our securities and/or governmental or private actions against us. We cannot assure you that we will be able to comply with all of these requirements or that the cost of such compliance will not prove to be a substantial competitive disadvantage vis-à-vis our privately held and larger public competitors.
Because we are quoted on the OTCQB instead of a national securities exchange in the United States, our U.S. investors may have more difficulty selling their stock or experience negative volatility on the market price of our stock in the United States.
In the United States, our common shares are currently quoted on the OTCQB. The OTCQB can be highly illiquid, in part because it does not have a national quotation system by which potential investors can follow the market price of shares except through information received and generated by a limited number of broker-dealers that make markets in particular stocks. There is a greater chance of volatility for securities that trade on the OTCQB as compared to a national securities exchange in the United States, such as the New York Stock Exchange, the NASDAQ Stock Market or the NYSE Amex. This volatility may be caused by a variety of factors, including the lack of readily available price quotations, the absence of consistent administrative supervision of bid and ask quotations, lower trading volume, and market conditions. U.S. investors in our common shares may experience high fluctuations in the market price and volume of the trading market for our securities. These fluctuations, when they occur, have a negative effect on the market price for our common shares. Accordingly, our U.S. shareholders may not be able to realize a fair price from their shares when they determine to sell them or may have to hold them for a substantial period of time until the market for our common shares improves.
48
In addition to being quoted on the OTCQB, on June 16, 2011, our common shares commenced trading on the Toronto Stock Exchange (“TSX”). The TSX is Canada’s national stock exchange. Prior to this, from May 5, 2010 to June 15, 2011, our common shares traded on the TSX – Venture Exchange. Our common shares are also listed on the Frankfurt Exchange under the symbol YE5.
We do not intend to pay dividends.
We do not anticipate paying cash dividends on our common shares in the foreseeable future. We may not have sufficient funds to legally pay dividends. Even if funds are legally available to pay dividends, we may nevertheless decide in our sole discretion not to pay dividends. The declaration, payment and amount of any future dividends will be made at the discretion of our board of directors, and will depend upon, among other things, the results of our operations, cash flows and financial condition, operating and capital requirements, and other factors our board of directors may consider relevant. There is no assurance that we will pay any dividends in the future, and, if dividends are paid, there is no assurance with respect to the amount of any such dividend.
Failure to achieve and maintain effective internal controls in accordance with Section 404 of the Sarbanes-Oxley Act of 2002 (the “Sarbanes-Oxley Act”) could have a material adverse effect on our business & operating results.
If we fail to comply with the requirements of Section 404 of the Sarbanes-Oxley Act regarding internal control over financial reporting or to remedy any material weaknesses in our internal controls that we may identify, such failure could result in material misstatements in our financial statements, cause investors to lose confidence in our reported financial information and have a negative effect on the trading price of our common shares.
Pursuant to Section 404 of the Sarbanes-Oxley Act and current SEC regulations, we are required to prepare assessments regarding internal controls over financial reporting. In connection with our on-going assessment of the effectiveness of our internal control over financial reporting, we may discover “material weaknesses” in our internal controls as defined in standards established by the Public Company Accounting Oversight Board, or the PCAOB. A material weakness is a significant deficiency, or combination of significant deficiencies, that results in more than a remote likelihood that a material misstatement of the annual or interim financial statements will not be prevented or detected. The PCAOB defines “significant deficiency” as a deficiency that results in more than a remote likelihood that a misstatement of the financial statements that is more than inconsequential will not be prevented or detected.
In the event that a material weakness is identified, we will employ qualified personnel and adopt and implement policies and procedures to address any material weaknesses that we identify. However, the process of designing and implementing effective internal controls is a continuous effort that requires us to anticipate and react to changes in our business and the economic and regulatory environments and to expend significant resources to maintain a system of internal controls that is adequate to satisfy our reporting obligations as a public company. We cannot assure you that the measures we will take will remediate any material weaknesses that we may identify or that we will implement and maintain adequate controls over our financial process and reporting in the future.
Any failure to complete our assessment of our internal control over financial reporting, to remediate any material weaknesses that we may identify or to implement new controls, or difficulties encountered in their implementation, could harm our operating results, cause us to fail to meet our reporting obligations or result in material misstatements in our financial statements. Any such failure could also adversely affect the results of the periodic management evaluations of our internal controls. Inadequate internal controls could also cause investors to lose confidence in our reported financial information, which could have a negative effect on the trading price of our common shares.
The price at which you purchase our common shares may not be indicative of the price that will prevail in the trading market. You may be unable to sell your common shares at or above your purchase price, which may result in substantial losses to you. The market price for our common shares is particularly volatile given our status as a relatively unknown company with a small and thinly traded public float, limited operating history and lack of profits which could lead to wide fluctuations in our share price.
49
The market for our common shares is characterized by significant price volatility when compared to seasoned issuers, and we expect that our share price will continue to be more volatile than a seasoned issuer for the indefinite future. The volatility in our share price is attributable to a number of factors. First our common shares are sporadically and thinly traded. As a consequence of this lack of liquidity, the trading of relatively small quantities of shares by our shareholders may disproportionately influence the price of those shares in either direction. The price for our shares could, for example, decline precipitously in the event that a large number of our common shares are sold on the market without commensurate demand, as compared to a seasoned issuer which could better absorb those sales without adverse impact on its share price. Secondly, we are a speculative or “risky” investment due to our limited operating history, lack of profits to date and uncertainty of future market acceptance for our potential products. As a consequence of this enhanced risk, more risk-adverse investors may, under the fear of losing all or most of their investment in the event of negative news or lack of progress, be more inclined to sell their shares on the market more quickly and at greater discounts than would be the case with the stock of a seasoned issuer. Many of these factors are beyond our control and may decrease the market price of our common shares, regardless of our operating performance. We cannot make any predictions or projections as to what the prevailing market price for our common shares will be at any time, including as to whether our common shares will sustain their current market prices, or as to what effect that the sale of shares or the availability of common shares for sale at any time will have on the prevailing market price.
Shareholders should be aware that, according to SEC Release No. 34-29093, the market for penny stocks has suffered in recent years from patterns of fraud and abuse. Such patterns include control of the market for the security by one or a few broker-dealers that are often related to the promoter or issuer; manipulation of prices through prearranged matching of purchases and sales and false and misleading press releases; boiler room practices involving high-pressure sales tactics and unrealistic price projections by inexperienced sales persons; excessive and undisclosed bid-ask differential and markups by selling broker-dealers; and the wholesale dumping of the same securities by promoters and broker-dealers after prices have been manipulated to a desired level, along with the resulting inevitable collapse of those prices and with consequent investor losses. Our management is aware of the abuses that have occurred historically in the penny stock market. Although we do not expect to be in a position to dictate the behavior of the market or of broker-dealers who participate in the market, management will strive within the confines of practical limitations to prevent the described patterns from being established with respect to our securities. The occurrence of these patterns or practices could increase the volatility of our share price.
Volatility in our common share price may subject us to securities litigation, thereby diverting our resources that may have a material effect on our profitability and results of operations.
As discussed in the preceding risk factors, the market for our common shares is characterized by significant price volatility when compared to seasoned issuers, and we expect that our share price will continue to be more volatile than a seasoned issuer for the indefinite future. In the past, plaintiffs have often initiated securities class action litigation against a company following periods of volatility in the market price of its securities. We may in the future be the target of similar litigation. Securities litigation could result in substantial costs and liabilities and could divert management’s attention and resources.
Should we lose the services of our key executives, our financial condition and proposed expansion may be negatively impacted.
We depend on the continued contributions of our executive officers to work effectively as a team, to execute our business strategy and to manage our business. The loss of key personnel, or their failure to work effectively, could have a material adverse effect on our business, financial condition, and results of operations. Specifically, we rely on J.A. Kirk McKinnon, our Chief Executive Officer, and Richard E. Schler, our Vice-President and Chief Financial Officer. We do not maintain key man life insurance on these individuals. Should we lose any or all of their services and we are unable to replace their services with equally competent and experienced personnel, our operational goals and strategies may be adversely affected, which will negatively affect our potential revenues.
Minnesota law and our articles of incorporation protect our directors from certain types of lawsuits, which could make it difficult for us to recover damages from them in the event of a lawsuit.
Minnesota law provides that our directors will not be liable to our Company or to our stockholders for monetary damages for all but certain types of conduct as directors. Our articles of incorporation require us to indemnify our directors and officers against all damages incurred in connection with our business to the fullest extent provided or allowed by law. The exculpation provisions may have the effect of preventing stockholders from recovering damages against our directors caused by their negligence, poor judgment or other circumstances. The indemnification provisions may require our Company to use its assets to defend our directors and officers against claims, including claims arising out of their negligence, poor judgment, or other circumstances.
50
We have not identified any mineral reserves or resources and due to the speculative nature of mineral property exploration, there is substantial risk that no commercially exploitable minerals will be found and our business will fail.
Exploration for minerals is a speculative venture involving substantial risk. We cannot provide investors with any assurance that our claims and properties contain commercially exploitable reserves. The exploration work that we intend to conduct on our claims or properties may not result in the discovery of commercial quantities of vanadium, graphite, gold uranium, or other minerals. Problems such as unusual and unexpected rock formations and other conditions are involved in mineral exploration and often result in unsuccessful exploration efforts. In such a case, we would be unable to complete our business plan.
We are a mineral exploration company with a limited operating history and expect to incur operating losses for the foreseeable future.
We are a mineral exploration company. We have not earned any revenues and we have not been profitable. Prior to completing exploration on our claims, we may incur increased operating expenses without realizing any revenues from those claims. There are numerous difficulties normally encountered by mineral exploration companies, and these companies experience a high rate of failure. The likelihood of success must be considered in light of the problems, expenses, difficulties, complications and delays encountered in connection with the exploration of the mineral properties that we plan to undertake. These potential problems include, but are not limited to, unanticipated problems relating to exploration and additional costs and expenses that may exceed current estimates. We have no history upon which to base any assumption as to the likelihood that our business will prove successful, and we can provide no assurance to investors that we will generate any operating revenues or ever achieve profitable operations.
Because of the speculative nature of mineral property exploration, there is substantial risk that no commercially exploitable minerals will be found and our business will fail.
Exploration for minerals is a speculative venture involving substantial risk. We cannot provide investors with any assurance that our claims and properties contain commercially exploitable reserves. The exploration work that we intend to conduct on our claims or properties may not result in the discovery of commercial quantities of vanadium, graphite, gold, uranium or other minerals. Problems such as unusual and unexpected rock formations and other conditions are involved in mineral exploration and often result in unsuccessful exploration efforts. In such a case, we would be unable to complete our business plan.
Because of the inherent dangers involved in mineral exploration, there is a risk that we may incur liability or damages as we conduct our business.
The search for valuable minerals involves numerous hazards. As a result, we may become subject to liability for such hazards, including pollution, cave-ins and other hazards against which we cannot, or may elect not, to insure against. We currently have no such insurance, but our management intends to periodically review the availability of commercially reasonable insurance coverage. If a hazard were to occur, the costs of rectifying the hazard may exceed our asset value and cause us to liquidate all our assets.
If we confirm commercial concentrations of vanadium, graphite, gold, uranium or other minerals on our claims and interests, we can provide no assurance that we will be able to successfully bring those claims or interests into commercial production.
If our exploration programs are successful in confirming deposits of commercial tonnage and grade, we will require significant additional funds in order to place the claims and interests into commercial production. This may occur for a number of reasons, including because of regulatory or permitting difficulties, because we are unable to obtain any adequate funds or because we cannot obtain such funds on terms that we consider economically feasible.
Because access to most of our properties is often restricted by inclement weather or proper infrastructure, our exploration programs are likely to experience delays.
Access to most of the properties underlying our claims and interests is restricted due to their remote locations and because of weather conditions. Most of these properties are only accessible by air. As a result, any attempts to visit, test, or explore the property are generally limited to those periods when weather permits such activities. These limitations can result in significant delays in exploration efforts, as well as mining and production efforts in the event that commercial amounts of minerals are found. This could cause our business to fail.
As we undertake exploration of our claims and interests, we will be subject to the compliance of government regulation that may increase the anticipated time and cost of our exploration program.
There are several governmental regulations that materially restrict the exploration of minerals. We will be subject to the mining laws and regulations in force in the jurisdictions where our claims are located, and these laws and regulations may change over time. In order to comply with these regulations, we may be required to obtain work permits, post bonds and perform remediation work for any physical disturbance to land. While our planned budget for exploration programs includes a contingency for regulatory compliance, there is a risk that new regulations could increase our costs of doing business and prevent us from carrying out our exploration program, or that the budgeted amounts are inadequate.
51
Our operations are subject to strict environmental regulations, which result in added costs of operations and operational delays.
Our operations are subject to environmental regulations, which could result in additional costs and operational delays. All phases of our operations are subject to environmental regulation. Environmental legislation is evolving in some countries and jurisdictions in a manner that may require stricter standards, and enforcement, increased fines and penalties for non-compliance, more stringent environmental assessments of proposed projects, and a heightened degree of responsibility for companies and their officers, directors, and employees. There is no assurance that any future changes in environmental regulation will not negatively affect our projects.
We have no insurance for environmental problems.
Insurance against environmental risks, including potential liability for pollution or other hazards as a result of the disposal of waste products occurring from exploration and production, has not been available generally in the mining industry. We have no insurance coverage for most environmental risks. In the event of a problem, the payment of environmental liabilities and costs would reduce the funds available to us for future operations. If we are unable to fund fully the cost of remedying an environmental problem, we might be required to enter into an interim compliance measure pending completion of the required remedy.
Due to external market factors in the mining business, we may not be able to market any minerals that may be found.
The mining industry, in general, is intensely competitive. Even if commercial quantities of minerals are discovered, we can provide no assurance to investors that a ready market will exist for the sale of these minerals. Numerous factors beyond our control may affect the marketability of any substances discovered. These factors include market fluctuations, the proximity and capacity of markets and processing equipment, and government regulations, including regulations relating to prices, taxes, royalties, land tenure, land use, mineral importing and exporting and environmental protection. The exact effect of these factors cannot be accurately predicted, but any combination of these factors may result in our not receiving an adequate return on invested capital.
Our performance may be subject to fluctuations in market prices of vanadium, graphite, gold, uranium, and other minerals.
The profitability of a mineral exploration project could be significantly affected by changes in the market price of the relevant minerals. Recently, the price of vanadium has increased due to the markets in China as well as the expanded uses including large-scale power storage application. With respect to the market prices of graphite, its price has increased over the past several months. The price of gold, while recently reaching record highs has decreased over the past few months. Demand for gold can also be influenced by economic conditions, attractiveness as an investment vehicle and the relative strength of the U.S. dollar and local investment currencies. The market price of uranium has increased due in large measure to projections as to the number of new nuclear energy plants that will be constructed in China, the United States and other jurisdictions. A number of other factors affect the market prices for other minerals. The aggregate effect of the factors affecting the prices of various minerals is impossible to predict with accuracy. Fluctuations in mineral prices may adversely affect the value of any mineral discoveries made on the properties with which we are involved, which may in turn affect the market price and liquidity of our common shares and our ability to pursue and implement our business plan. In addition, the price of vanadium has in the past fluctuated significantly on a month-to-month and year-to-year basis.
Because from time to time we hold a significant portion of our cash reserves in Canadian dollars, we may experience losses due to foreign exchange translations.
From time to time we hold a significant portion of our cash reserves in Canadian dollars. Due to foreign exchange rate fluctuations, the value of these Canadian dollar reserves can result in translation gains or losses in U.S. dollar terms. If there was a significant decline in the Canadian dollar versus the U.S. dollar, our converted Canadian dollar cash balances presented in U.S. dollars on our balance sheet would significantly decline. If the US dollar significantly declines relative to the Canadian dollar our quoted US dollar cash position would significantly decline as it would be more expensive in US dollar terms to pay Canadian dollar expenses. We have not entered into derivative instruments to offset the impact of foreign exchange fluctuations. Such foreign exchange declines could cause us to experience losses.
52
Our Company’s business is impacted by any instability and fluctuations in global financial systems.
The recent credit crisis and related instability in the global financial system, although somewhat abated, has had, and may continue to have, an impact on our Company’s business and our Company’s financial condition. Our Company may face significant challenges if conditions in the financial markets do not continue to improve. Our Company’s ability to access the capital markets may be severely restricted at a time when our Company wishes or needs to access such markets, which could have a materially adverse impact on our Company’s flexibility to react to changing economic and business conditions or carry on our operations.
Until we can validate otherwise, the properties described below have no known mineral reserves of any kind and we are planning programs that are exploratory in nature.
Further details regarding our Company’s properties, although not incorporated by reference, including the comprehensive geological report prepared in compliance with Canada’s National Instrument 43-101 on the Sagar Property in Northern Québec and on the Green Giant Property in Madagascar, have been filed within our Company’s filings on Sedar at http://www.sedar.com(which website is expressly not incorporated by reference into this filing).
Climate change and related regulatory responses may impact our business.
Climate change as a result of emissions of greenhouse gases is a significant topic of discussion and may generate government regulatory responses in the near future. It is impracticable to predict with any certainty the impact of climate change on our business or the regulatory responses to it, although we recognize that they could be significant. However, it is too soon for us to predict with any certainty the ultimate impact, either directionally or quantitatively, of climate change and related regulatory responses.
To the extent that climate change increases the risk of natural disasters or other disruptive events in the areas in which we operate, we could be harmed. While we maintain rudimentary business recovery plans that are intended to allow us to recover from natural disasters or other events that can be disruptive to our business, our plans may not fully protect us from all such disasters or events.
Compliance with changing regulation of corporate governance and public disclosure will result in additional expenses and pose challenges for our management.
Changing laws, regulations and standards relating to corporate governance and public disclosure, including the Dodd-Frank Wall Street Reform and Consumer Protection Act and the rules and regulations promulgated thereunder, the Sarbanes-Oxley Act and SEC regulations, have created uncertainty for public companies and significantly increased the costs and risks associated with accessing the U.S. public markets. Our management team will need to devote significant time and financial resources to comply with both existing and evolving standards for public companies, which will lead to increased general and administrative expenses and a diversion of management time and attention from revenue generating activities to compliance activities.
We are an “emerging growth company” and we cannot be certain if the reduced disclosure requirements applicable to emerging growth companies will make our common stock less attractive to investors.
We are an “emerging growth company,” as defined in the Jumpstart our Business Startups Act of 2012 or JOBS Act, and we may take advantage of certain exemptions from various reporting requirements that are applicable to other public companies that are not “emerging growth companies” including not being required to comply with the auditor attestation requirements of section 404 of the Sarbanes-Oxley Act, reduced disclosure obligations regarding executive compensation in our periodic reports and proxy statements and exemptions from the requirements of holding a non-binding advisory vote on executive compensation and shareholder approval of any golden parachute payments not previously approved. We cannot predict if investors will find our common stock less attractive because we may rely on these exemptions. If some investors find our common stock less attractive as a result, there may be a less active trading market for our common stock and our stock price may be more volatile. In addition, Section 107 of the JOBS Act also provides that an “emerging growth company” can take advantage of the extended transition period provided in Section 7(a)(2)(B) of the Securities Act for complying with new or revised accounting standards. An “emerging growth company” can therefore delay the adoption of certain accounting standards until those standards would otherwise apply to private companies.
53
We will incur increased costs and demands upon management as a result of complying with the laws and regulations that affect public companies, which could materially adversely affect our results of operations, financial condition, business and prospects.
As a public company and particularly after we cease to be an “emerging growth company,” we will incur significant legal, accounting and other expenses that we have not incurred to date, including increased costs associated with public company reporting and corporate governance requirements. These requirements include compliance with Section 404 and other provisions of the Sarbanes-Oxley Act of 2002, or the Sarbanes-Oxley Act, as well as rules implemented by the SEC.The increased costs associated with operating as a public company will decrease our net income or increase our net loss, and may require us to reduce costs in other areas of our business. Additionally, if these requirements divert our management’s attention from other business concerns, they could have a material adverse effect on our results of operations, financial condition, business and prospects. However, for as long as we remain an “emerging growth company” as defined in the JOBS Act, we may take advantage of certain exemptions from various reporting requirements that are applicable to other public companies that are not “emerging growth companies” including not being required to comply with the auditor attestation requirements of Section 404 of the Sarbanes-Oxley Act, reduced disclosure obligations regarding executive compensation in our periodic reports and proxy statements and exemptions from the requirements of holding a nonbinding advisory vote on executive compensation and shareholder approval of any golden parachute payments not previously approved. We may take advantage of these reporting exemptions until we are no longer an “emerging growth company.” If the market value of our common stock that is held by non-affiliates exceeds $700 million as of any June 30, we would cease to be an “emerging growth company” as of the following June 30, or if we issue more than $1 billion in non-convertible debt in a three-year period, we would cease to be an “emerging growth company” immediately.
SHOULD ONE OR MORE OF THE FOREGOING RISKS OR UNCERTAINTIES MATERIALIZE, OR SHOULD THE UNDERLYING ASSUMPTIONS OF OUR BUSINESS PROVE INCORRECT, ACTUAL RESULTS MAY DIFFER SIGNIFICANTLY FROM THOSE ANTICIPATED, BELIEVED, ESTIMATED, EXPECTED, INTENDED OR PLANNED.
ITEM 2. UNREGISTERED SALES OF EQUITY SECURITIES AND USE OF PROCEEDS
For the period from July 1, 2010 through March 31, 2012, our Company issued the following unregistered securities:
On July 2, 2010, our Company issued 500,000 common share purchase warrants to a party who assisted our Company in listing its common stock on the TSX Venture Exchange. These warrants were valued at $78,100. The share purchase warrants were valued using the Black-Scholes pricing model with the following assumptions: risk free interest rate – 1.54%; expected volatility – 172%; dividend yield – NIL; and expected life – 4 years.
On December 17, 2010,our Company issued 200,000 of our common shares valued at $90,000 pursuant to a contract with a party to provide advisory services in China.
During January and February 2011, our Company closed a private placement of 30,936,654 units for gross proceeds of $13,921,495. Each unit consisted of one common share and one half of one common share purchase warrant (a “Unit”). Each of the 15,468,327 warrants issued entitles the holder the right to purchase one common share at an exercise price of $0.75 for a period of two years from the date of issue. In connection with the private placement, our Company paid finders’ fees consisting of a cash fee of 6% to certain eligible finders totaling $704,115, TSX-V fees totaling $38,411 and compensation warrants equal to 6% of the eligible units sold totaling 1,564,700. Each full compensation warrant entitles the holder to acquire one Unit of our Company at $0.45 per unit and expire on February 25, 2013.
During the year ended June 30, 2011, our Company issued a total of 4,549,500 of our common shares for consideration of $881,950. These common shares were issued pursuant to the exercise of several common share purchase warrants.
On December 16, 2011 our Company issued 7,500,000 of our common shares valued at $1,350,000 as consideration for the Joint Venture Agreement with Malagasy Minerals Ltd.
On March 4, 2012, $69,000 was raised through the exercise of 460,000 stock options at $0.15 per share.
On March 25, 2012, the Company closed a private placement with DRA whereby the Company raised a total of $635,000 by issuing 2,540,000 of our common shares at $0.25 per share.
ITEM 3. DEFAULTS UPON SENIOR SECURITIES
There were no defaults upon senior securities during the period ended March 31, 2012.
ITEM 4. MINE SAFETY DISCLOSURES
Not applicable.
54
ITEM 5. OTHER INFORMATION
There is no information with respect to which information is not otherwise called for by this form.
We file annual, quarterly and current reports, proxy statements and other information with the Commission. Our Commission filings are available to the public over the Internet at the Commission’s website at http://www.sec.gov. The public may also read and copy any document we file with the Commission at its Public Reference Room at 100 F Street, N.E., Washington, D.C. 20549, on official business days during the hours of 10:00 am to 3:00 pm. The public may obtain information on the operation of the Public Reference Room by calling the Commission at 1-800-SEC-0330. We maintain a website at http://www.energizerresources.com, (which website is expressly not incorporated by reference into this filing). Information contained on our website is not part of this report on Form 10-Q.
ITEM 6. – EXHIBITS
Exhibit Number &Description
|
3.1
|
Articles of Incorporation of Uranium Star Corp. (now known as Energizer Resources Inc.) (Incorporated by reference to Exhibit 3.1 to the registrant’s current report on Form 8-K as filed with the SEC on May 20, 2008)
|
|
3.2
|
Articles of Amendment to Articles of Incorporation of Uranium Star Corp. changing its name to Energizer Resources Inc. (Incorporated by reference to Exhibit 3.1 to the registrant’s current report on Form 8-K filed with the SEC on July 16, 2010)
|
|
3.3
|
Amended and Restated By-Laws of Energizer Resources Inc. (Incorporated by reference to Exhibit 3.2 to the registrant’s current report on Form 8-K as filed with the SEC on July 16, 2010)
|
|
4.1
|
Amended and Restated 2006 Stock Option Plan of Energizer Resources, Inc. (as of February 2009) (Incorporated by reference to Exhibit 4.1 to the registrant's Form S-8 registration statement as filed with the SEC on February 19, 2010)
|
|
4.2
|
Form of broker Subscription Agreement for Units (Canadian and Offshore Subscribers) (Incorporated by reference to Exhibit 4.1 to the registrant’s current report on Form 8-K as filed with the SEC on March 19, 2010)
|
|
4.3
|
Form of standard Subscription Agreement for Units (Canadian and Offshore Subscribers) (Incorporated by reference to Exhibit 4.2 to the registrant’s current report on Form 8-K as filed with the SEC on March 19, 2010)
|
|
4.4
|
Form of Warrant to Purchase common shares (Incorporated by reference to Exhibit 4.3 to the registrant’s current report on Form 8-K as filed with the SEC on March 19, 2010)
|
|
4.5
|
Form of Class A broker warrant to Purchase common shares (Incorporated by reference to Exhibit 4.4 to the registrant’s current report on Form 8-K as filed with the SEC on March 19, 2010)
|
|
4.6
|
Form of Class B broker warrant to Purchase common shares (Incorporated by reference to Exhibit 4.5 to the registrant’s current report on Form 8-K as filed with the SEC on March 19, 2010)
|
|
4.7
|
Agency Agreement, dated March 15, 2010, between Energizer Resources, Clarus Securities Inc. and Byron Securities Limited (Incorporated by reference to Exhibit 4.6 to the registrant’s current report on Form 8-K filed with the SEC on March 19, 2010)
|
|
10.1
|
Property Agreement effective May 14, 2004 between Thornton J. Donaldson and Thornton J. Donaldson, Trustee for Yukon Resources Corp. (Incorporated by reference to Exhibit 10.1 to the registrant's Form SB-2 registration statement as filed with the SEC on September 14, 2004)
|
|
10.2
|
Letter of Intent dated March 10, 2006 with Apofas Ltd. (Incorporated by reference to Exhibit 99.1 to the registrant's current report on Form 8-K as filed with the SEC on March 13, 2006)
|
|
10.3
|
Letter agreement effective May 12, 2006 between Yukon Resources Corp. and Virginia Mines Inc. (Incorporated by reference to Exhibit 99.1 to the registrant's current report on Form 8-K filed as with the SEC on May 9, 2006)
|
|
10.4
|
Joint Venture Agreement dated August 22, 2007 between Uranium Star Corp. & Madagascar Minerals and Resources Sarl(Incorporated by reference to Exhibit 10.1 to the registrant's current report on Form 8-K as filed with SEC on September 11, 2007)
|
|
21
|
Subsidiaries of the Registrant (Incorporated by reference to Exhibit 21.1 to the registrant’s annual report on Form 10-K as filed on September 21, 2009)
|
|
99.1
|
Canadian National Instrument 43-101 Technical Report Update for Green Giant Property, Fotadrevo, Province of Toliara, Madagascar (Incorporated by reference to Exhibit 99.1 to the registrant's report on Form 8-K filed with SEC on July 9, 2010)
|
55
SIGNATURES
Pursuant to the requirements of Section 13 or 15(d) of the Securities Exchange Act of 1934 the registrant has duly caused this report to be signed on its behalf by the undersigned, thereunto duly authorized.
ENERGIZER RESOURCES INC.
Dated: May14, 2012
| By: | /s/ J A Kirk McKinnon | ||
| Name: J A Kirk McKinnon | |||
| Title: President, Chief Executive Officer and Director |
Dated: May 14, 2012
| By: | /s/ Richard E. Schler | ||
| Name: Richard E. Schler | |||
| Title: Vice-President, Chief Financial Officer and Director |
56