Attached files
| file | filename |
|---|---|
| 8-K - 8-K - VALIDUS HOLDINGS LTD | a12-12010_18k.htm |
Exhibit 99.1
|
|
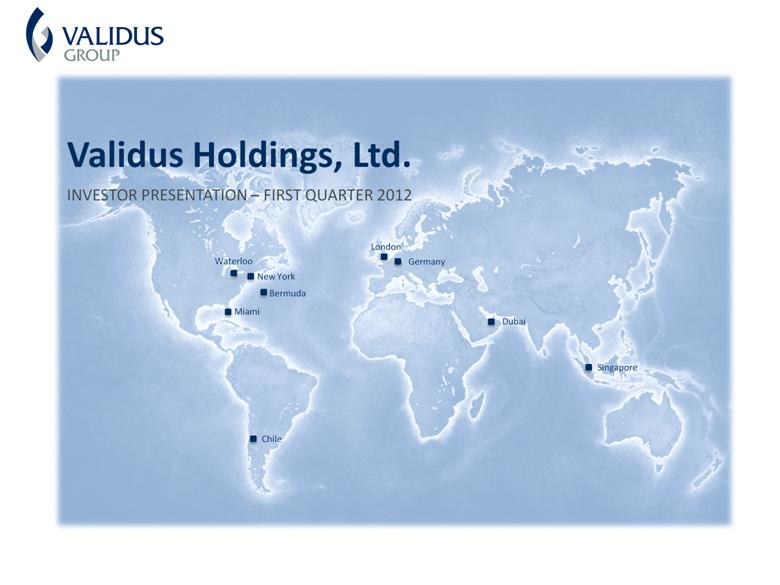
Validus Holdings, Ltd. INVESTOR PRESENTATION – FIRST QUARTER 2012 |
|
|
This presentation may include forward-looking statements, both with respect to us and our industry, that reflect our current views with respect to future events and financial performance. Statements that include the words “expect,” “intend,” “plan,” “believe,” “project,” “anticipate,” “will,” “may” and similar statements of a future or forward-looking nature identify forward-looking statements. All forward-looking statements address matters that involve risks and uncertainties. Accordingly, there are or will be important factors that could cause actual results to differ materially from those indicated in such statements and, therefore, you should not place undue reliance on any such statements. We believe that these factors include, but are not limited to, the following: 1) unpredictability and severity of catastrophic events; 2) rating agency actions; 3) adequacy of Validus’ risk management and loss limitation methods; 4) cyclicality of demand and pricing in the insurance and reinsurance markets; 5) statutory or regulatory developments including tax policy, reinsurance and other regulatory matters; 6) Validus’ ability to implement its business strategy during “soft” as well as “hard” markets; 7) adequacy of Validus’ loss reserves; 8) continued availability of capital and financing; 9) retention of key personnel; 10) competition; 11) potential loss of business from one or more major insurance or reinsurance brokers; 12) Validus’ ability to implement, successfully and on a timely basis, complex infrastructure, distribution capabilities, systems, procedures and internal controls, and to develop accurate actuarial data to support the business and regulatory and reporting requirements; 13) general economic and market conditions (including inflation, volatility in the credit and capital markets, interest rates and foreign currency exchange rates); 14) the integration of businesses Validus may acquire or new business ventures Validus may start; 15) the effect on Validus’ investment portfolios of changing financial market conditions including inflation, interest rates, liquidity and other factors; 16) acts of terrorism or outbreak of war; 17) availability of reinsurance and retrocessional coverage; 18) the ability of the Company to commence and complete the self tender offer, the price at which the Company purchases shares in the self tender offer or otherwise, and the number of shares it is able to purchase pursuant to the self tender offer or otherwise; and 19) the ability of the Company to achieve the benefits contemplated by the self tender offer, as well as management’s response to any of the aforementioned factors. The foregoing review of important factors should not be construed as exhaustive and should be read in conjunction with the other cautionary statements that are included herein and elsewhere, including the Risk Factors included in our most recent reports on Form 10-K and Form 10-Q and other documents on file with the Securities and Exchange Commission. Any forward-looking statements made in this presentation are qualified by these cautionary statements, and there can be no assurance that the actual results or developments anticipated by us will be realized or, even if substantially realized, that they will have the expected consequences to, or effects on, us or our business or operations. We undertake no obligation to update publicly or revise any forward-looking statement, whether as a result of new information, future developments or otherwise. Cautionary Note Regarding Forward-looking Statements 2 |
|
|
The discussion of the self tender offer contained in this presentation is for informational purposes only and is neither an offer to purchase nor a solicitation of an offer to sell any of the Company’s common shares. The offer to purchase and the solicitation of the Company’s common shares will be made only pursuant to the Offer to Purchase, the related letter of transmittal and other related materials that will be mailed shortly to all shareholders, at no expense to shareholders. Shareholders should read those materials and the documents incorporated therein by reference carefully because they will contain important information, including the various terms of, and conditions to, the self tender offer. The Company has filed a Tender Offer Statement on Schedule TO with the Securities and Exchange Commission. The Tender Offer Statement (including the Offer to Purchase, the related letter of transmittal and other related materials) is available to shareholders at no charge at the Securities and Exchange Commission’s website at www.sec.gov, or the Investor Relations section of the Company’s website located at www.validusholdings.com, or from the information agent, Innisfree M&A Incorporated ((877) 456-3488). Shareholders are urged to read those materials carefully prior to making any decisions with respect to the self tender offer. The contents of any website referenced in this presentation is not incorporated by reference into this presentation. Presentation for Informational Purposes Only 3 |
|
|
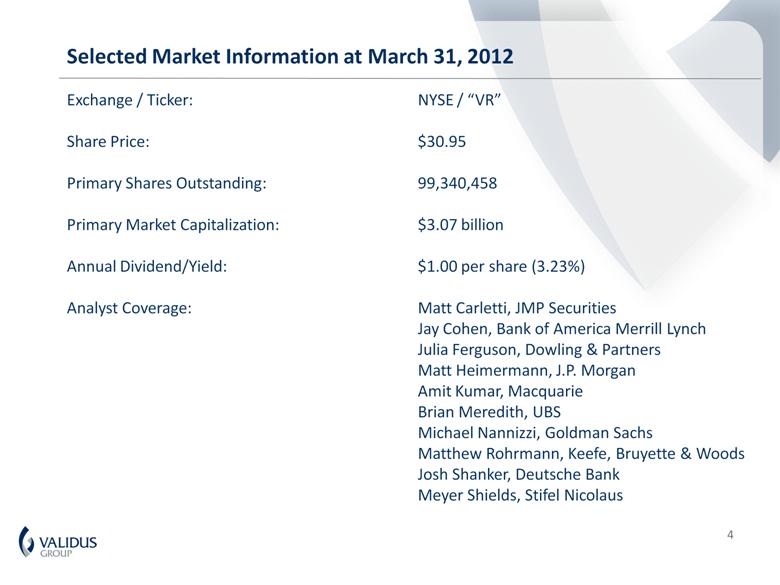
Selected Market Information at March 31, 2012 Exchange / Ticker: Share Price: Primary Shares Outstanding: Primary Market Capitalization: Annual Dividend/Yield: Analyst Coverage: NYSE / “VR” $30.95 99,340,458 $3.07 billion $1.00 per share (3.23%) Matt Carletti, JMP Securities Jay Cohen, Bank of America Merrill Lynch Julia Ferguson, Dowling & Partners Matt Heimermann, J.P. Morgan Amit Kumar, Macquarie Brian Meredith, UBS Michael Nannizzi, Goldman Sachs Matthew Rohrmann, Keefe, Bruyette & Woods Josh Shanker, Deutsche Bank Meyer Shields, Stifel Nicolaus 4 |
|
|
Within five years of commencing operations, Validus has established leading global positions in Bermuda and at Lloyd’s Leading position in Bermuda reinsurance1 Top tier position at Lloyd’s, where Talbot is the 11th largest of 89 syndicates Size and scale to remain a strong, independent competitor Business plan since formation has been to focus on short-tail lines, which have been the best-priced classes of risk Underwriting acumen has been validated by ability to attract and manage third-party capital from sophisticated inventors Maintained a focus on underwriting profits in conjunction with a strong balance sheet Minimal exposure to interest rate risk History of favorable reserve development Profitable every year since inception Delivered superior financial results since 2007 IPO, outperforming short-tail Bermuda peers Active capital management, returning $1.35 billion to investors through repurchases and dividends from IPO through Q1 20122 Attained a premium valuation 1 See Slide 11 for detail, based on 2010 data. 3. Excluding cash paid in IPC transaction. Validus, From Formation to Today: A Case Study in Value Creation 5 |
|
|
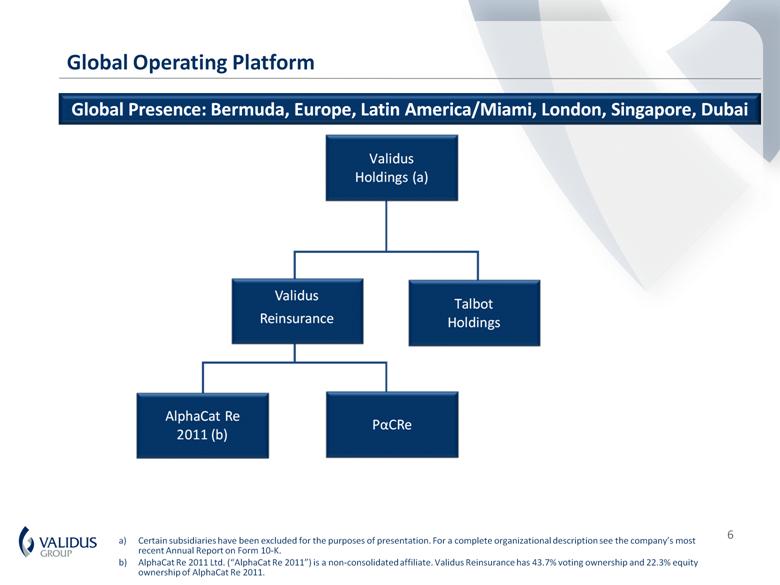
a) Certain subsidiaries have been excluded for the purposes of presentation. For a complete organizational description see the company’s most recent Annual Report on Form 10-K. b) AlphaCat Re 2011 Ltd. (“AlphaCat Re 2011”) is a non-consolidated affiliate. Validus Reinsurance has 43.7% voting ownership and 22.3% equity ownership of AlphaCat Re 2011. Global Presence: Bermuda, Europe, Latin America/Miami, London, Singapore, Dubai Global Operating Platform Validus Reinsurance Talbot Holdings Validus Holdings (a) PCRe AlphaCat Re 2011 (b) 6 |
|
|
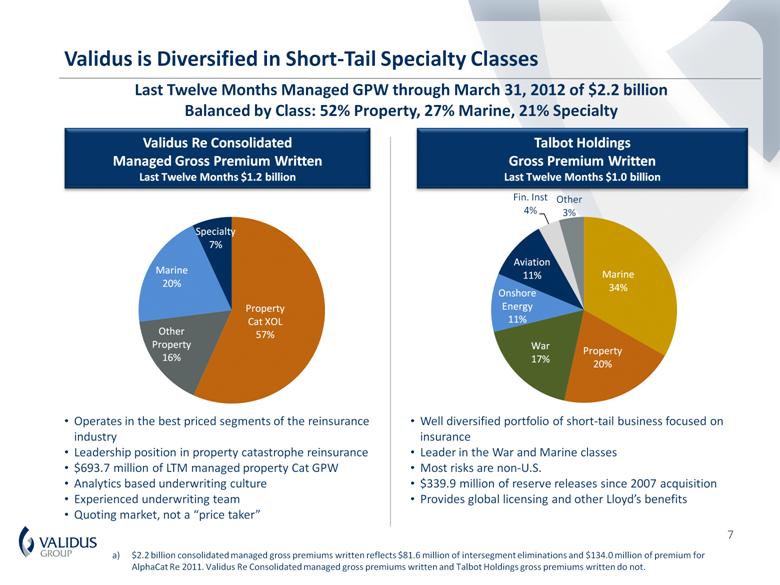
Last Twelve Months Managed GPW through March 31, 2012 of $2.2 billion Balanced by Class: 52% Property, 27% Marine, 21% Specialty Validus is Diversified in Short-Tail Specialty Classes Operates in the best priced segments of the reinsurance industry Leadership position in property catastrophe reinsurance $693.7 million of LTM managed property Cat GPW Analytics based underwriting culture Experienced underwriting team Quoting market, not a “price taker” Validus Re Consolidated Managed Gross Premium Written Last Twelve Months $1.2 billion Talbot Holdings Gross Premium Written Last Twelve Months $1.0 billion Well diversified portfolio of short-tail business focused on insurance Leader in the War and Marine classes Most risks are non-U.S. $339.9 million of reserve releases since 2007 acquisition Provides global licensing and other Lloyd’s benefits a) $2.2 billion consolidated managed gross premiums written reflects $81.6 million of intersegment eliminations and $134.0 million of premium for AlphaCat Re 2011. Validus Re Consolidated managed gross premiums written and Talbot Holdings gross premiums written do not. 7 |
|
|
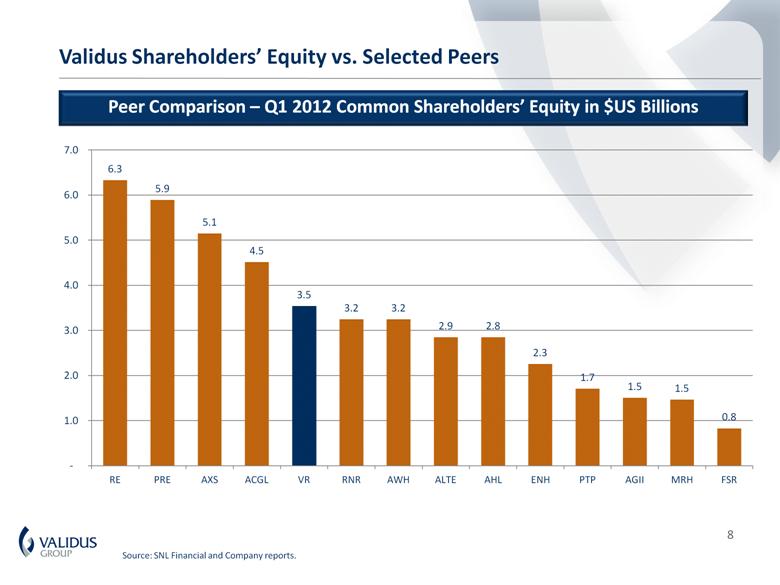
Validus Shareholders’ Equity vs. Selected Peers Peer Comparison – Q1 2012 Common Shareholders’ Equity in $US Billions 8 Source: SNL Financial and Company reports. 8 |
|
|
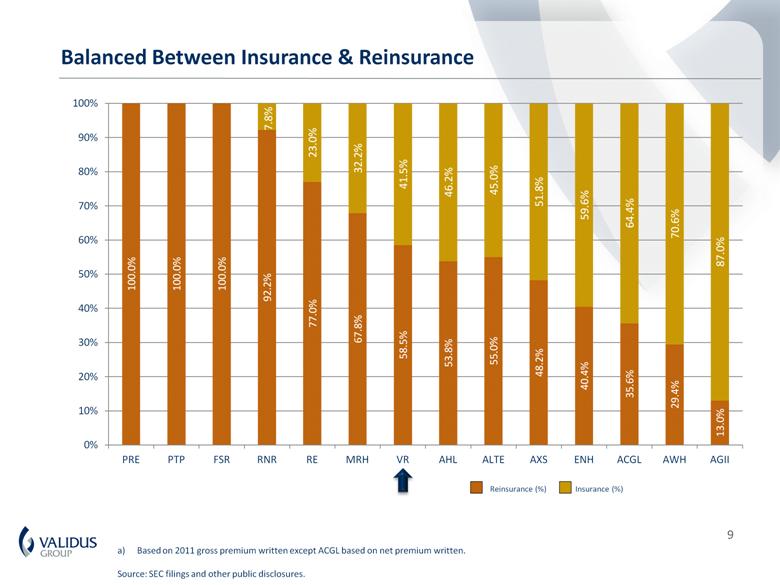
9 a) Based on 2011 gross premium written except ACGL based on net premium written. Source: SEC filings and other public disclosures. Balanced Between Insurance & Reinsurance Reinsurance (%) Insurance (%) |
|
|
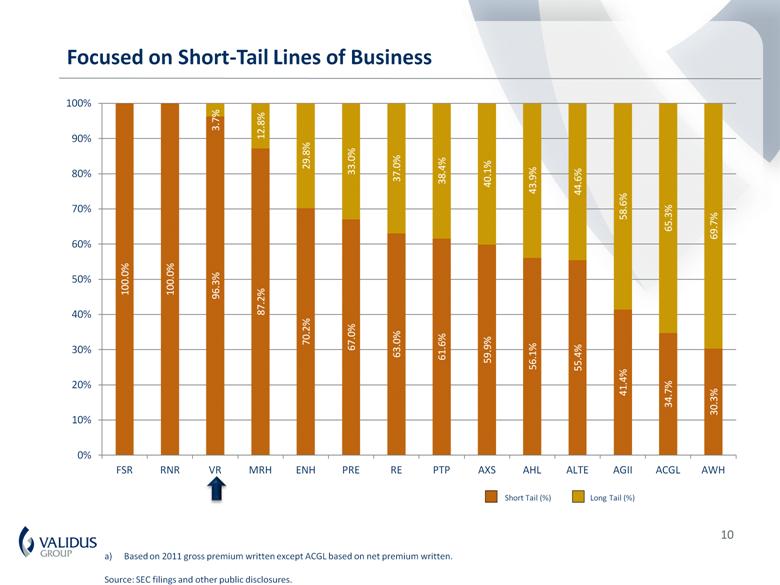
10 a) Based on 2011 gross premium written except ACGL based on net premium written. Source: SEC filings and other public disclosures. Focused on Short-Tail Lines of Business Short Tail (%) Long Tail (%) |
|
|
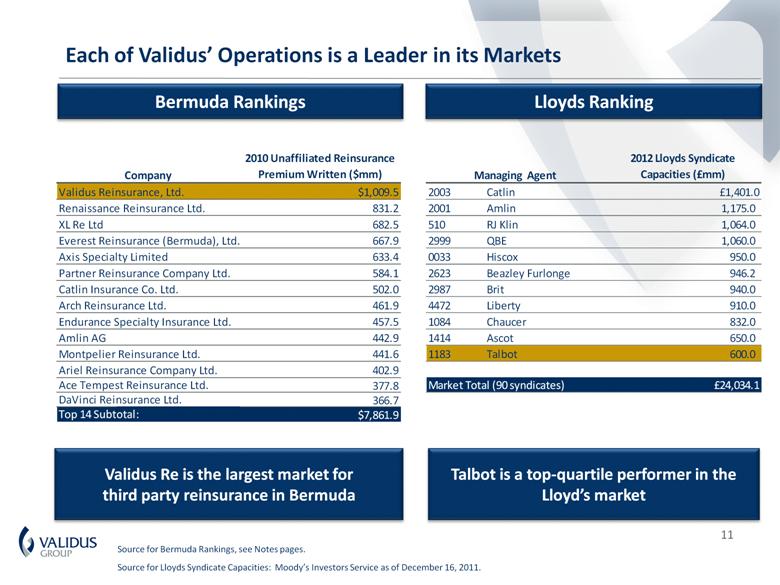
Bermuda Rankings Lloyds Ranking Validus Re is the largest market for third party reinsurance in Bermuda Talbot is a top-quartile performer in the Lloyd’s market Source for Bermuda Rankings, see Notes pages. Source for Lloyds Syndicate Capacities: Moody’s Investors Service as of December 16, 2011. Each of Validus’ Operations is a Leader in its Markets 2012 Lloyds Syndicate Capacities (£mm) 2003 Catlin £1,401.0 2001 Amlin 1,175.0 510 RJ Klin 1,064.0 2999 QBE 1,060.0 0033 Hiscox 950.0 2623 Beazley Furlonge 946.2 2987 Brit 940.0 4472 Liberty 910.0 1084 Chaucer 832.0 1414 Ascot 650.0 1183 Talbot 600.0 Market Total (90 syndicates) £24,034.1 Managing Agent Company 2010 Unaffiliated Reinsurance Premium Written ($mm) Validus Reinsurance, Ltd. $1,009.50 Renaissance Reinsurance Ltd. 831.2 XL Re Ltd 682.5 Everest Reinsurance (Bermuda), Ltd. 667.9 Axis Specialty Limited 633.4 Partner Reinsurance Company Ltd. 584.1 Catlin Insurance Co. Ltd. 502 Arch Reinsurance Ltd. 461.9 Endurance Specialty Insurance Ltd. 457.5 Amlin AG 442.9 Montpelier Reinsurance Ltd. 441.6 Ariel Reinsurance Company Ltd. 402.9 Ace Tempest Reinsurance Ltd. 377.8 DaVinci Reinsurance Ltd. 366.7 Top 14 Subtotal: $7,861.90 |
|
|
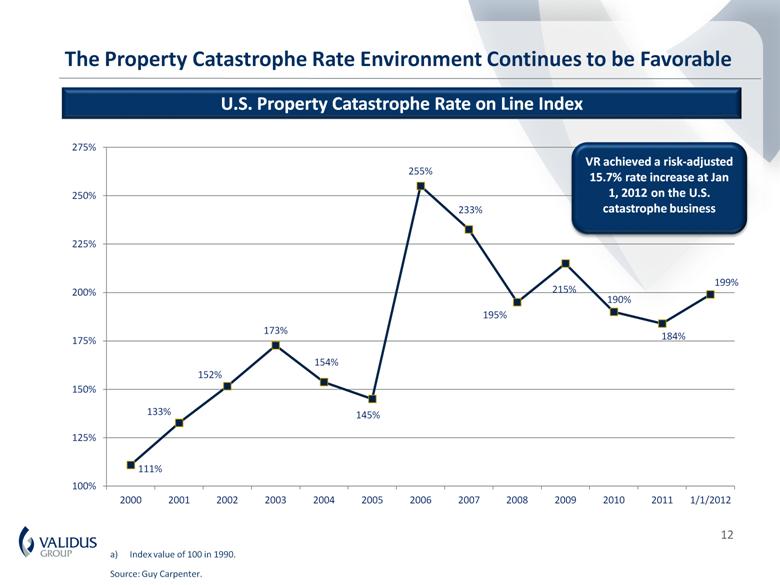
VR achieved a risk-adjusted 15.7% rate increase at Jan 1, 2012 on the U.S. catastrophe business 12 U.S. Property Catastrophe Rate on Line Index The Property Catastrophe Rate Environment Continues to be Favorable a) Index value of 100 in 1990. Source: Guy Carpenter. |
|
|
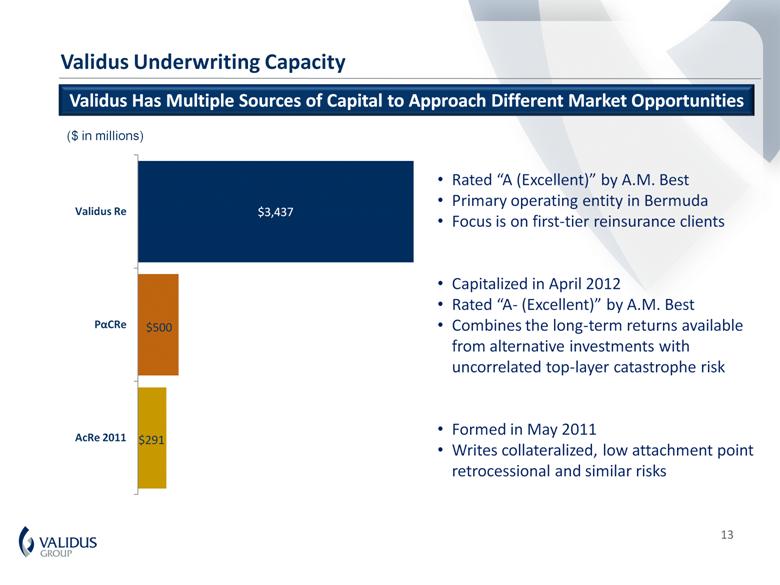
Validus Underwriting Capacity Rated “A (Excellent)” by A.M. Best Primary operating entity in Bermuda Focus is on first-tier reinsurance clients Capitalized in April 2012 Rated “A- (Excellent)” by A.M. Best Combines the long-term returns available from alternative investments with uncorrelated top-layer catastrophe risk Formed in May 2011 Writes collateralized, low attachment point retrocessional and similar risks 13 Validus Has Multiple Sources of Capital to Approach Different Market Opportunities ($ in millions) |
|
|
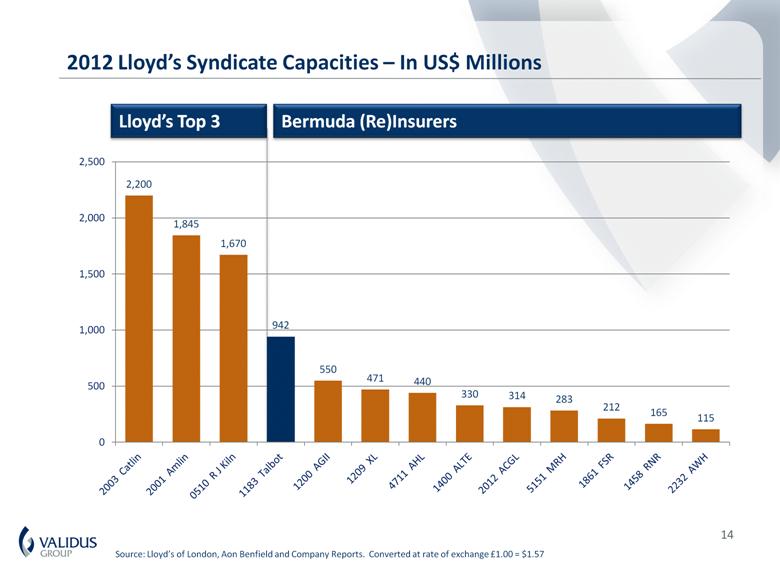
14 Source: Lloyd’s of London, Aon Benfield and Company Reports. Converted at rate of exchange £1.00 = $1.57 2012 Lloyd’s Syndicate Capacities – In US$ Millions Bermuda (Re)Insurers Lloyd’s Top 3 |
|
|
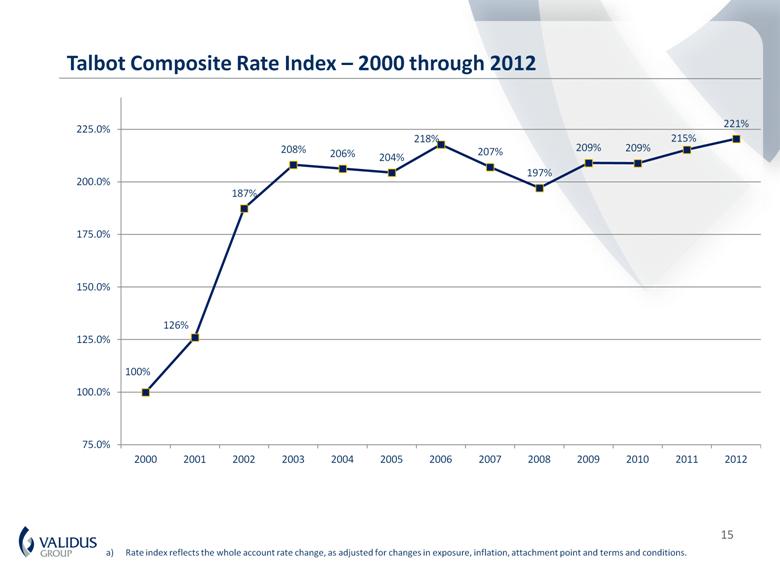
15 a) Rate index reflects the whole account rate change, as adjusted for changes in exposure, inflation, attachment point and terms and conditions. Talbot Composite Rate Index – 2000 through 2012 |
|
|
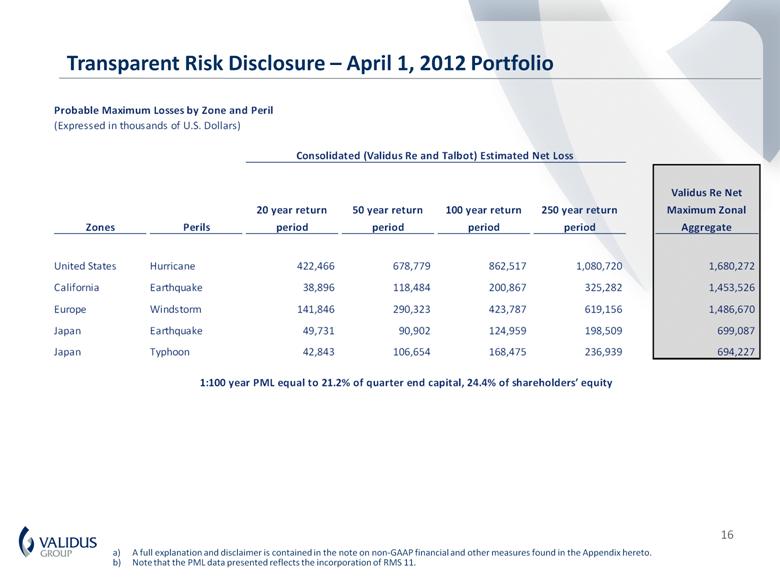
a) A full explanation and disclaimer is contained in the note on non-GAAP financial and other measures found in the Appendix hereto. b) Note that the PML data presented reflects the incorporation of RMS 11. Transparent Risk Disclosure – April 1, 2012 Portfolio Probable Maximum Losses by Zone and Peril Zones Perils 20 year return period 50 year return period 100 year return period 250 year return period Validus Re Net Maximum Zonal Aggregate United States Hurricane 422,466 678,779 862,517 1,080,720 1,680,272 California Earthquake 38,896 118,484 200,867 325,282 1,453,526 Europe Windstorm 141,846 290,323 423,787 619,156 1,486,670 Japan Earthquake 49,731 90,902 124,959 198,509 699,087 Japan Typhoon 42,843 106,654 168,475 236,939 694,227 (Expressed in thousands of U.S. Dollars) Consolidated (Validus Re and Talbot) Estimated Net Loss 1:100 year PML equal to 21.2% of quarter end capital, 24.4% of shareholders’ equity |
|
|
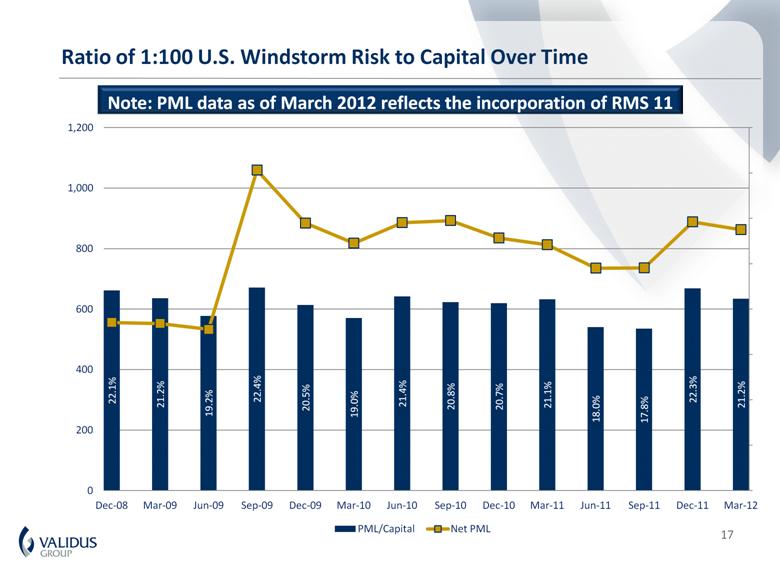
Note: PML data as of March 2012 reflects the incorporation of RMS 11 Ratio of 1:100 U.S. Windstorm Risk to Capital Over Time 17 |
|
|
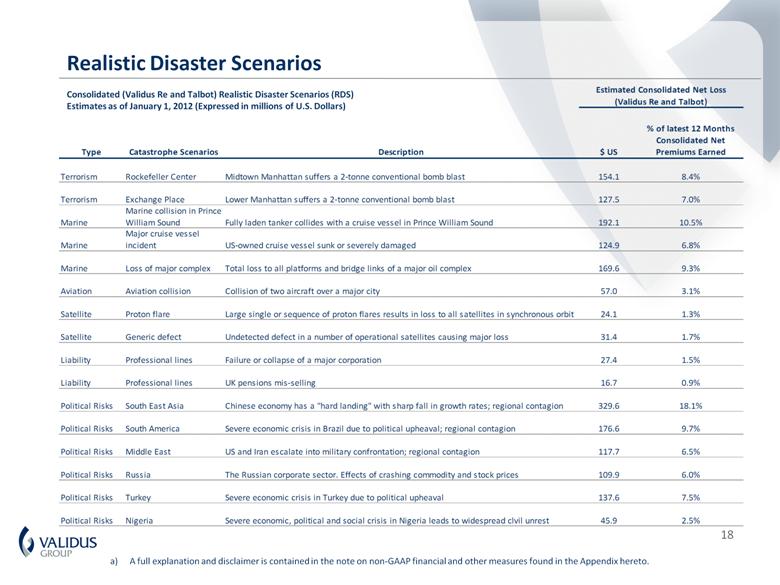
a) A full explanation and disclaimer is contained in the note on non-GAAP financial and other measures found in the Appendix hereto. Realistic Disaster Scenarios Consolidated (Validus Re and Talbot) Realistic Disaster Scenarios (RDS) Estimates as of January 1, 2012 (Expressed in millions of U.S. Dollars) Type Catastrophe Scenarios Description $ US % of latest 12 Months Consolidated Net Premiums Earned Terrorism Rockefeller Center Midtown Manhattan suffers a 2-tonne conventional bomb blast 154.1 8.4% Terrorism Exchange Place Lower Manhattan suffers a 2-tonne conventional bomb blast 127.5 7.0% Marine Marine collision in Prince William Sound Fully laden tanker collides with a cruise vessel in Prince William Sound 192.1 10.5% Marine Major cruise vessel incident US-owned cruise vessel sunk or severely damaged 124.9 6.8% Marine Loss of major complex Total loss to all platforms and bridge links of a major oil complex 169.6 9.3% Aviation Aviation collision Collision of two aircraft over a major city 57.0 3.1% Satellite Proton flare Large single or sequence of proton flares results in loss to all satellites in synchronous orbit 24.1 1.3% Satellite Generic defect Undetected defect in a number of operational satellites causing major loss 31.4 1.7% Liability Professional lines Failure or collapse of a major corporation 27.4 1.5% Liability Professional lines UK pensions mis-selling 16.7 0.9% Political Risks South East Asia Chinese economy has a "hard landing" with sharp fall in growth rates; regional contagion 329.6 18.1% Political Risks South America Severe economic crisis in Brazil due to political upheaval; regional contagion 176.6 9.7% Political Risks Middle East US and Iran escalate into military confrontation; regional contagion 117.7 6.5% Political Risks Russia The Russian corporate sector. Effects of crashing commodity and stock prices 109.9 6.0% Political Risks Turkey Severe economic crisis in Turkey due to political upheaval 137.6 7.5% Political Risks Nigeria Severe economic, political and social crisis in Nigeria leads to widespread clvil unrest 45.9 2.5% Estimated Consolidated Net Loss (Validus Re and Talbot) 18 |
|
|
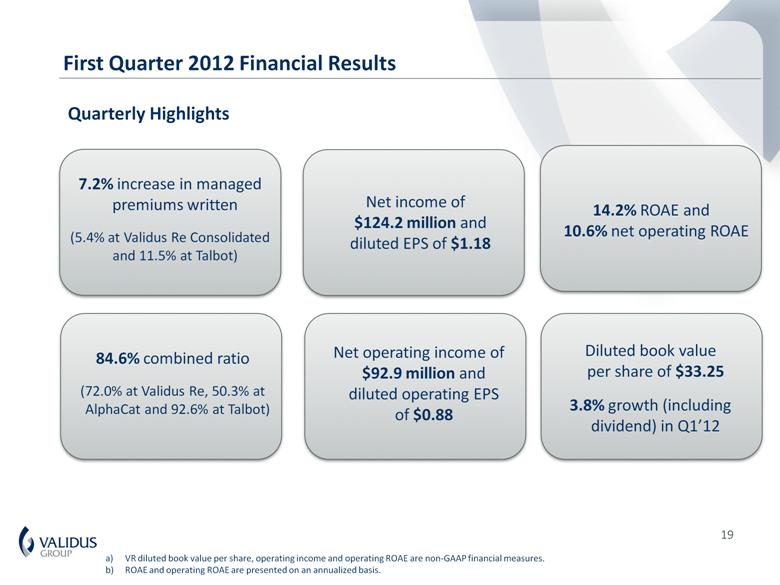
Quarterly Highlights 19 14.2% ROAE and 10.6% net operating ROAE a) VR diluted book value per share, operating income and operating ROAE are non-GAAP financial measures. b) ROAE and operating ROAE are presented on an annualized basis. 84.6% combined ratio (72.0% at Validus Re, 50.3% at AlphaCat and 92.6% at Talbot) Net income of $124.2 million and diluted EPS of $1.18 Net operating income of $92.9 million and diluted operating EPS of $0.88 Diluted book value per share of $33.25 3.8% growth (including dividend) in Q1’12 First Quarter 2012 Financial Results |
|
|
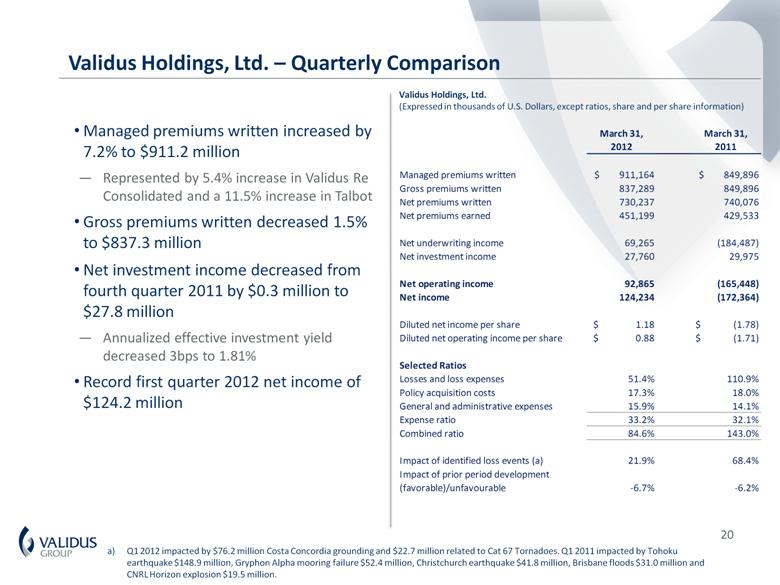
20 Validus Holdings, Ltd. – Quarterly Comparison Managed premiums written increased by 7.2% to $911.2 million Represented by 5.4% increase in Validus Re Consolidated and a 11.5% increase in Talbot Gross premiums written decreased 1.5% to $837.3 million Net investment income decreased from fourth quarter 2011 by $0.3 million to $27.8 million Annualized effective investment yield decreased 3bps to 1.81% Record first quarter 2012 net income of $124.2 million a) Q1 2012 impacted by $76.2 million Costa Concordia grounding and $22.7 million related to Cat 67 Tornadoes. Q1 2011 impacted by Tohoku earthquake $148.9 million, Gryphon Alpha mooring failure $52.4 million, Christchurch earthquake $41.8 million, Brisbane floods $31.0 million and CNRL Horizon explosion $19.5 million. Validus Holdings, Ltd. (Expressed in thousands of U.S. Dollars, except ratios, share and per share information) March 31, March 31, 2012 2011 Managed premiums written $ 911,164 $ 849,896 Gross premiums written 837,289 849,896 Net premiums written 730,237 740,076 Net premiums earned 451,199 429,533 Net underwriting income 69,265 (184,487) Net investment income 27,760 29,975 Net operating income 92,865 (165,448) Net income 124,234 (172,364) Diluted net income per share $ 1.18 $ (1.78) Diluted net operating income per share $ 0.88 $ (1.71) Selected Ratios Losses and loss expenses 51.4% 110.9% Policy acquisition costs 17.3% 18.0% General and administrative expenses 15.9% 14.1% Expense ratio 33.2% 32.1% Combined ratio 84.6% 143.0% Impact of identified loss events (a) 21.9% 68.4% Impact of prior period development (favorable)/unfavourable -6.7% -6.2% |
|
|
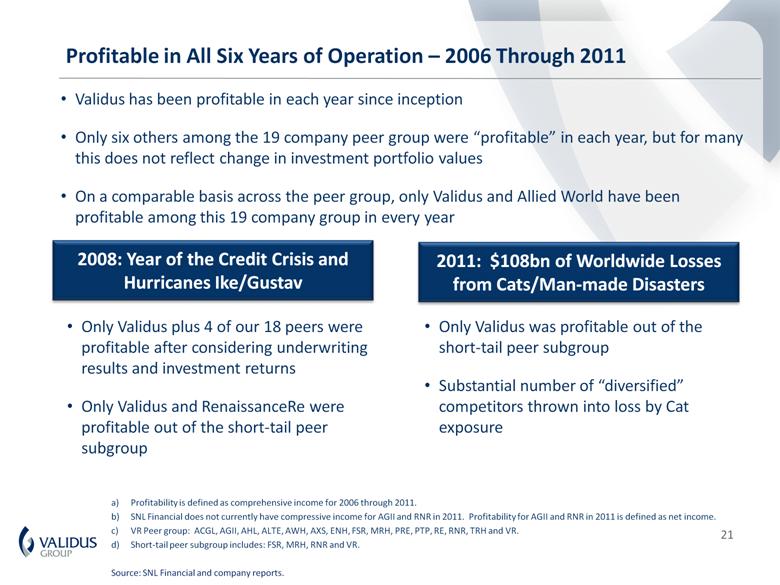
Validus has been profitable in each year since inception Only six others among the 19 company peer group were “profitable” in each year, but for many this does not reflect change in investment portfolio values On a comparable basis across the peer group, only Validus and Allied World have been profitable among this 19 company group in every year a) Profitability is defined as comprehensive income for 2006 through 2011. b) SNL Financial does not currently have compressive income for AGII and RNR in 2011. Profitability for AGII and RNR in 2011 is defined as net income. c) VR Peer group: ACGL, AGII, AHL, ALTE, AWH, AXS, ENH, FSR, MRH, PRE, PTP, RE, RNR, TRH and VR. d) Short-tail peer subgroup includes: FSR, MRH, RNR and VR. Source: SNL Financial and company reports. Only Validus plus 4 of our 18 peers were profitable after considering underwriting results and investment returns Only Validus and RenaissanceRe were profitable out of the short-tail peer subgroup Only Validus was profitable out of the short-tail peer subgroup Substantial number of “diversified” competitors thrown into loss by Cat exposure 2008: Year of the Credit Crisis and Hurricanes Ike/Gustav 2011: $108bn of Worldwide Losses from Cats/Man-made Disasters Profitable in All Six Years of Operation – 2006 Through 2011 21 |
|
|
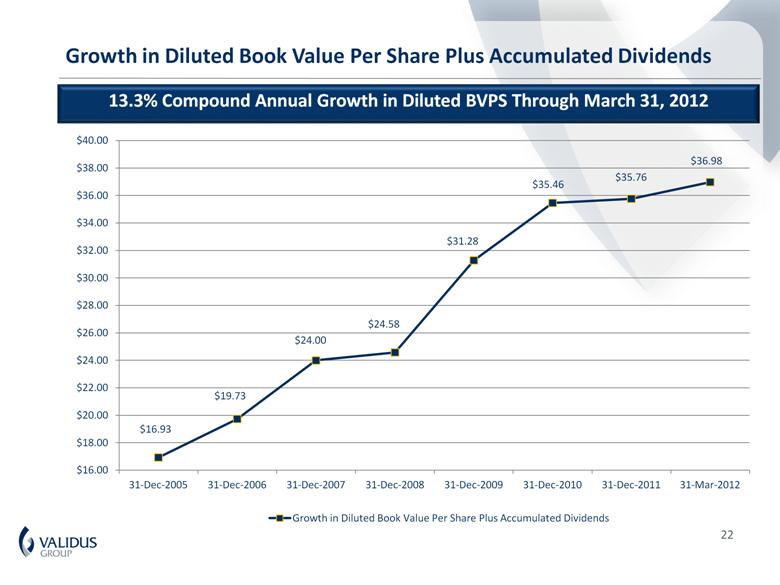
13.3% Compound Annual Growth in Diluted BVPS Through March 31, 2012 22 Growth in Diluted Book Value Per Share Plus Accumulated Dividends |
|
|
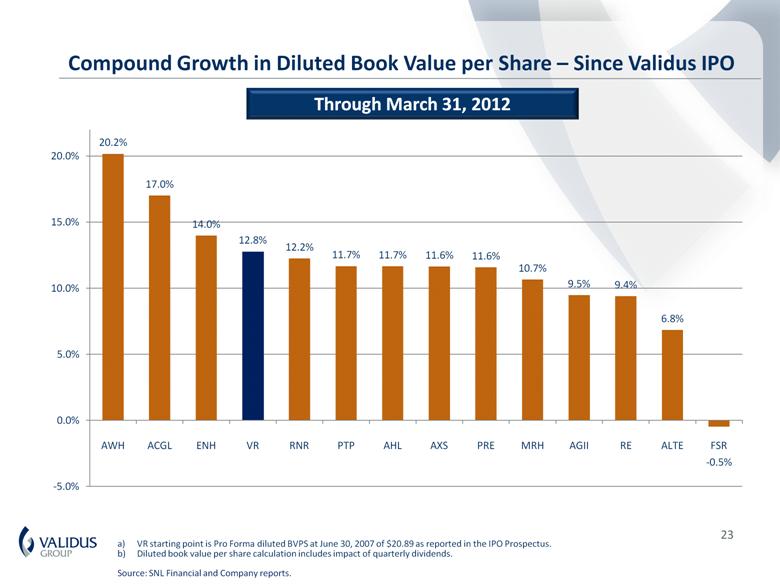
23 a) VR starting point is Pro Forma diluted BVPS at June 30, 2007 of $20.89 as reported in the IPO Prospectus. b) Diluted book value per share calculation includes impact of quarterly dividends. Source: SNL Financial and Company reports. Through March 31, 2012 Compound Growth in Diluted Book Value per Share – Since Validus IPO |
|
|
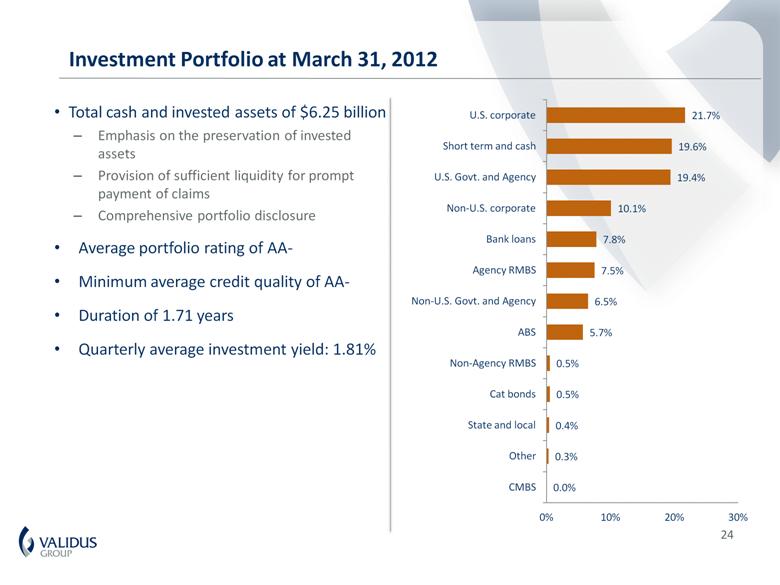
24 Investment Portfolio at March 31, 2012 Total cash and invested assets of $6.25 billion Emphasis on the preservation of invested assets Provision of sufficient liquidity for prompt payment of claims Comprehensive portfolio disclosure Average portfolio rating of AA- Minimum average credit quality of AA- Duration of 1.71 years Quarterly average investment yield: 1.81% |
|
|
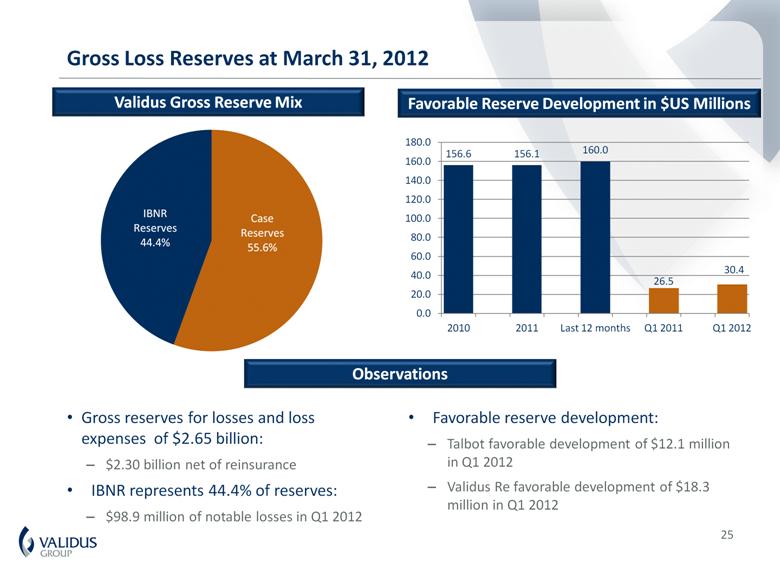
Gross Loss Reserves at March 31, 2012 Gross reserves for losses and loss expenses of $2.65 billion: $2.30 billion net of reinsurance IBNR represents 44.4% of reserves: $98.9 million of notable losses in Q1 2012 Favorable reserve development: Talbot favorable development of $12.1 million in Q1 2012 Validus Re favorable development of $18.3 million in Q1 2012 Favorable Reserve Development in $US Millions Validus Gross Reserve Mix Observations 25 |
|
|
Active Capital Management Share Repurchase Authorization 2012 Dutch Auction Self Tender VR to repurchase $200.0 million of VR common shares at a price of not less than $30.50 and not more than $33.50, in increments of $0.25 per share The tender offer is part of the Company's existing authorization to return up to $400.0 million to shareholders through share repurchases At the end of Q2 2012, Validus will have returned approximately $1.57 billion to shareholders inclusive of the $200.0 million Self Tender and regular quarterly dividend $400.0 million share repurchase authorization since December 2010 $370.7 million remaining as of May 1, 2012 Since initial authorization in November 2009 35.4 million shares repurchased Represents 27.0% of shares outstanding as of September 30, 2009 Average price of $27.07 per share 26 |
|
|
International reinsurance and insurance business Size and scale to compete effectively Two distinct yet complementary operating companies Focused on short-tail classes of reinsurance and insurance Leadership position in property catastrophe reinsurance Able to grow underwriting capacity across multiple strategies with third party capital Profitable in every year since inception Short duration, highly liquid, conservative balance sheet Transparent risk disclosure 27 Conclusion – Well Positioned for 2012 and Beyond |
|
|
APPENDIX Investor Presentation |
|
|
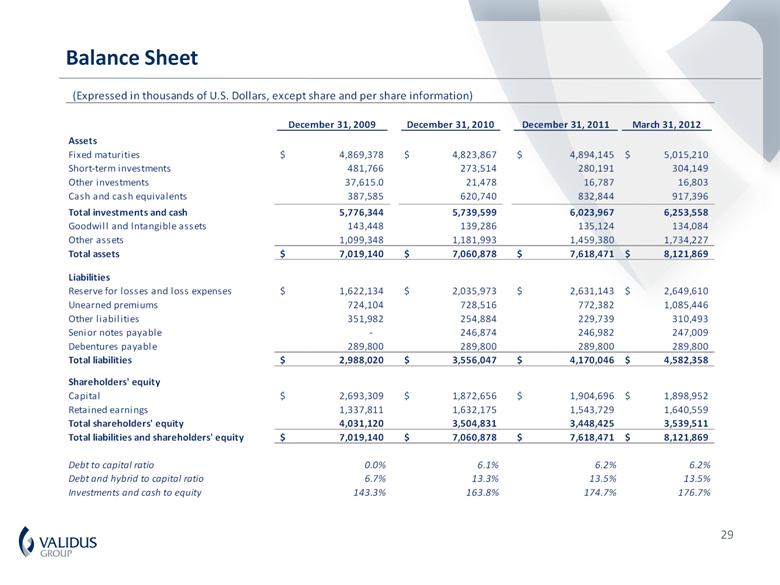
Balance Sheet (Expressed in thousands of U.S. Dollars, except share and per share information) December 31, 2009 December 31, 2010 December 31, 2011 March 31, 2012 Assets Fixed maturities 4,869,378 $ 4,823,867 $ 4,894,145 $ 5,015,210 $ Short-term investments 481,766 273,514 280,191 304,149 Other investments 37,615.0 21,478 16,787 16,803 Cash and cash equivalents 387,585 620,740 832,844 917,396 Total investments and cash 5,776,344 5,739,599 6,023,967 6,253,558 Goodwill and Intangible assets 143,448 139,286 135,124 134,084 Other assets 1,099,348 1,181,993 1,459,380 1,734,227 Total assets 7,019,140 $ 7,060,878 $ 7,618,471 $ 8,121,869 $ Liabilities Reserve for losses and loss expenses 1,622,134 $ 2,035,973 $ 2,631,143 $ 2,649,610 $ Unearned premiums 724,104 728,516 772,382 1,085,446 Other liabilities 351,982 254,884 229,739 310,493 Senior notes payable - 246,874 246,982 247,009 Debentures payable 289,800 289,800 289,800 289,800 Total liabilities 2,988,020 $ 3,556,047 $ 4,170,046 $ 4,582,358 $ Shareholders' equity Capital 2,693,309 $ 1,872,656 $ 1,904,696 $ 1,898,952 $ Retained earnings 1,337,811 1,632,175 1,543,729 1,640,559 Total shareholders' equity 4,031,120 3,504,831 3,448,425 3,539,511 Total liabilities and shareholders' equity 7,019,140 $ 7,060,878 $ 7,618,471 $ 8,121,869 $ Debt to capital ratio 0.0% 6.1% 6.2% 6.2% Debt and hybrid to capital ratio 6.7% 13.3% 13.5% 13.5% Investments and cash to equity 143.3% 163.8% 174.7% 176.7% 29 |
|
|
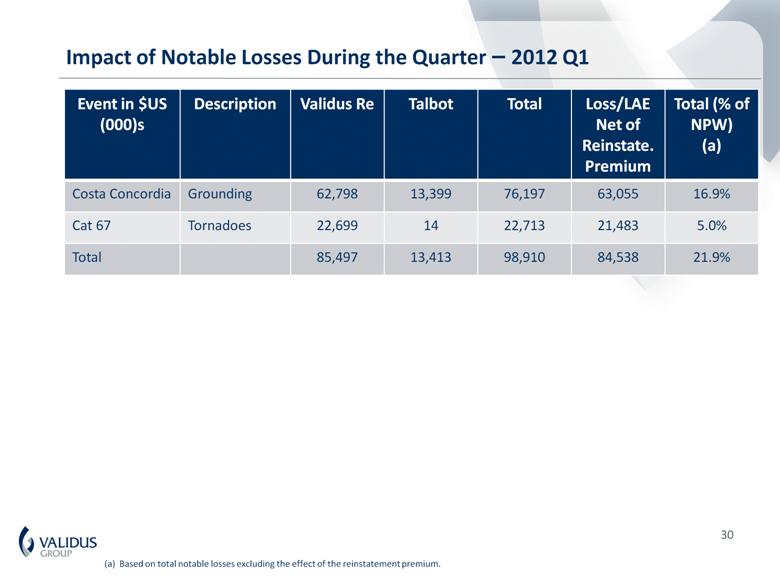
30 (a) Based on total notable losses excluding the effect of the reinstatement premium. Impact of Notable Losses During the Quarter – 2012 Q1 Event in $US (000)s Description Validus Re Talbot Total Loss/LAE Net of Reinstate. Premium Total (% of NPW) (a) Costa Concordia Grounding 62,798 13,399 76,197 63,055 16.9% Cat 67 Tornadoes 22,699 14 22,713 21,483 5.0% Total 85,497 13,413 98,910 84,538 21.9% |
|
|
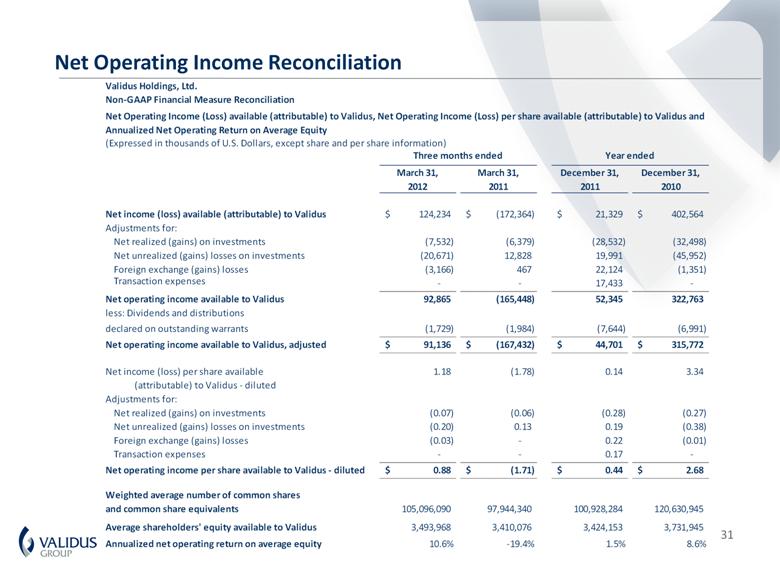
Net Operating Income Reconciliation Validus Holdings, Ltd. Non-GAAP Financial Measure Reconciliation (Expressed in thousands of U.S. Dollars, except share and per share information) March 31, 2012 March 31, 2011 December 31, 2011 December 31, 2010 Net income (loss) available (attributable) to Validus 124,234 $ (172,364) $ 21,329 $ 402,564 $ Adjustments for: Net realized (gains) on investments (7,532) (6,379) (28,532) (32,498) Net unrealized (gains) losses on investments (20,671) 12,828 19,991 (45,952) Foreign exchange (gains) losses (3,166) 467 22,124 (1,351) Transaction expenses - - 17,433 - Net operating income available to Validus 92,865 (165,448) 52,345 322,763 less: Dividends and distributions declared on outstanding warrants (1,729) (1,984) (7,644) (6,991) Net operating income available to Validus, adjusted 91,136 $ (167,432) $ 44,701 $ 315,772 $ Net income (loss) per share available 1.18 (1.78) 0.14 3.34 (attributable) to Validus - diluted Adjustments for: Net realized (gains) on investments (0.07) (0.06) (0.28) (0.27) Net unrealized (gains) losses on investments (0.20) 0.13 0.19 (0.38) Foreign exchange (gains) losses (0.03) - 0.22 (0.01) Transaction expenses - - 0.17 - Net operating income per share available to Validus - diluted 0.88 $ (1.71) $ 0.44 $ 2.68 $ Weighted average number of common shares and common share equivalents 105,096,090 97,944,340 100,928,284 120,630,945 Average shareholders' equity available to Validus 3,493,968 3,410,076 3,424,153 3,731,945 Annualized net operating return on average equity 10.6% -19.4% 1.5% 8.6% Net Operating Income (Loss) available (attributable) to Validus, Net Operating Income (Loss) per share available (attributable) to Validus and Annualized Net Operating Return on Average Equity Three months ended Year ended 31 |
|
|
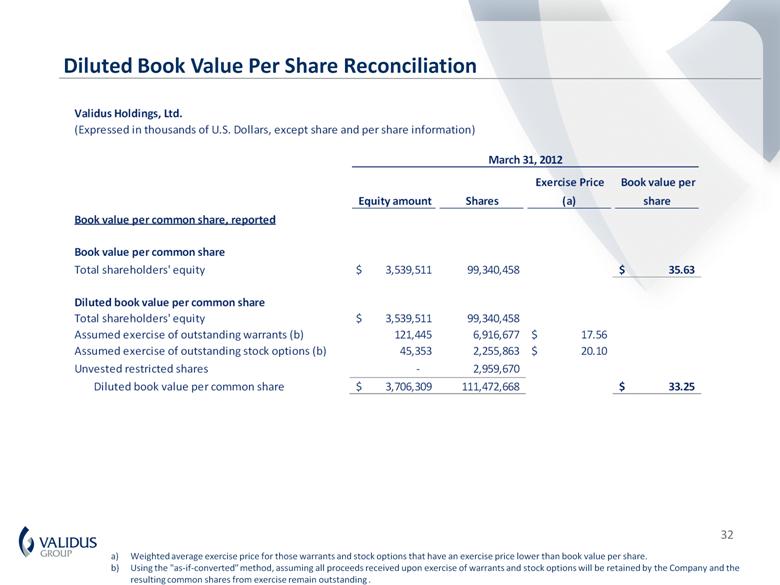
a) Weighted average exercise price for those warrants and stock options that have an exercise price lower than book value per share. b) Using the "as-if-converted" method, assuming all proceeds received upon exercise of warrants and stock options will be retained by the Company and the resulting common shares from exercise remain outstanding . Diluted Book Value Per Share Reconciliation Validus Holdings, Ltd. (Expressed in thousands of U.S. Dollars, except share and per share information) Equity amount Shares Exercise Price (a) Book value per share Book value per common share, reported Book value per common share Total shareholders' equity 3,539,511 $ 99,340,458 35.63 $ Diluted book value per common share Total shareholders' equity 3,539,511 $ 99,340,458 Assumed exercise of outstanding warrants (b) 121,445 6,916,677 17.56 $ Assumed exercise of outstanding stock options (b) 45,353 2,255,863 20.10 $ Unvested restricted shares - 2,959,670 Diluted book value per common share 3,706,309 $ 111,472,668 33.25 $ March 31, 2012 32 |
|
|
In presenting the Company’s results herein, management has included and discussed certain schedules containing underwriting income (loss) available (attributable) to Validus, net operating income (loss) available (attributable) to Validus, annualized return on average equity and diluted book value per common share that are not calculated under standards or rules that comprise U.S. GAAP. Such measures are referred to as non-GAAP. Non-GAAP measures may be defined or calculated differently by other companies. We believe that these measures are important to investors and other interested parties. These measures should not be viewed as a substitute for those determined in accordance with U.S. GAAP. The underwriting results of an insurance or reinsurance company are often measured by reference to its underwriting income because underwriting income indicates the performance of the company’s core underwriting function. Underwriting income is reconciled to net income by the addition or subtraction of net investment income (loss), finance expenses, transaction expenses, net realized gains (losses) on investments, net unrealized gains (losses) on investments and foreign exchange gains (losses). Net operating income (loss) available (attributable) to Validus is calculated based on net income (loss) available (attributable) to Validus excluding net realized gains (losses), net unrealized gains (losses) on investments, gains (losses) arising from translation of non-US$ denominated balances and non-recurring items. Net income is the most directly comparable GAAP measure. Net operating income focuses on the underlying fundamentals of our operations without the influence of realized gains (losses) from the sale of investments, net unrealized gains on investments, translation of non-US$ currencies and non-recurring items. Realized gains (losses) from the sale of investments are driven by the timing of the disposition of investments, not by our operating performance. Gains (losses) arising from translation of non-US$ denominated balances are unrelated to our underlying business. Diluted book value per share is calculated based on total shareholders’ equity plus the assumed proceeds from the exercise of outstanding stock options and warrants, divided by the sum of unvested restricted shares, stock options, warrants and share equivalents outstanding (assuming their exercise). Reconciliations to the most comparable GAAP measure for both net operating income and diluted book value per share can be found in the company’s latest earnings press release. Net loss estimates and zonal aggregates are before income tax, net of reinstatement premiums, and net of reinsurance and retrocessional recoveries. The estimates set forth herein are based on an Occurrence basis on assumptions that are inherently subject to significant uncertainties and contingencies. These uncertainties and contingencies can affect actual losses and could cause actual losses to differ materially from those expressed above. In particular, modeled loss estimates do not necessarily accurately predict actual losses, and may significantly mis-estimate actual losses. Such estimates, therefore, should not be considered as a representation of actual losses. The Company has developed the estimates of losses expected from certain catastrophes for its portfolio of property, marine, workers’ compensation, and personal accident contracts using commercially available catastrophe models such as RMS, AIR and EQECAT, which are applied and adjusted by the Company. These estimates include assumptions regarding the location, size and magnitude of an event, the frequency of events, the construction type and damageability of property in a zone, policy terms and conditions and the cost of rebuilding property in a zone, among other assumptions. These assumptions will evolve following any actual event. Accordingly, if the estimates and assumptions that are entered into the risk model are incorrect, or if the risk model proves to be an inaccurate forecasting tool, the losses the Company might incur from an actual catastrophe could be materially higher than its expectation of losses generated from modeled catastrophe scenarios. In addition, many risks such as second-event covers, aggregate excess of loss, or attritional loss components cannot be fully evaluated using the vendor models. Further, there can be no assurance that such third party models are free of defects in the modeling logic or in the software code. Commencing in January 2012, the Company incorporated RMS version 11 as part of its vendor models. 33 Notes on Non-GAAP and Other Financial and Exposure Measures |
|
|
Investors should not rely on the information set forth in this presentation when considering investment in the Company. The information contained in this presentation has not been audited nor has it been subject to independent verification. The estimates set forth herein speak only as of the date of this presentation and the Company undertakes no obligation to update or revise such information to reflect the occurrence of future events, including, but not limited to, the composition of the Company's business. The events presented reflect a specific set of proscribed calculations and do not necessarily reflect all events that may impact the Company. The Company has presented the Company Realistic Disaster Scenarios for non-natural catastrophe events. Twice yearly, Lloyds' syndicates, including the Company's Talbot Syndicate 1183, are required to provide details of their potential exposures to specific disaster scenarios. Lloyds' makes its updated Realistic Disaster Scenarios (RDS) guidance available to the market annually. The RDS scenario specification document for 2011 can be accessed at the RDS part of the Lloyd's public website : http://www.lloyds.com/The-Market/Tools-and-Resources/Research/Exposure-Management/Realistic-Disaster-Scenarios. The Consolidated Pro Forma Net Premiums Earned used in the calculation represent the latest 12 months of net premium from April 1, 2011 and are on a pro forma basis, including IPC earned premiums. Modeling catastrophe threat scenarios is a complex exercise involving numerous variables and is inherently subject to significant uncertainties and contingencies. These uncertainties and contingencies can affect actual losses and could cause actual losses incurred by the Company to differ materially from those expressed above. Should an event occur, the modeled outcomes may prove inadequate, possibly materially so. This may occur for a number of reasons including, legal requirements, model deficiency, non-modeled risks or data inaccuracies. A modeled outcome of net loss from a single event also relies in significant part on the reinsurance and retrocession arrangements in place, or expected to be in place at the time of the analysis, and may change during the year. Modeled outcomes assume that the reinsurance and retrocession in place responds as expected with minimal reinsurance failure or dispute. Reinsurance is purchased to match the original exposure as far as possible, but it is possible for there to be a mismatch or gap in cover which could result in higher than modeled losses to the Company. In addition, many parts of the reinsurance program are purchased with limited reinstatements and, therefore, the number of claims or events which may be recovered from second or subsequent events is limited. It should also be noted that renewal dates of the reinsurance program do not necessarily coincide with those of the inwards business written. Where original business is not protected by risks attaching reinsurance or retrocession programs, the programs could expire resulting in an increase in the possible net loss retained by the Company. Investors should not rely on the information set forth in this presentation when considering investment in the Company. The information contained in this presentation has not been audited nor has it been subject to independent verification. The estimates set forth above speak only as of the date of this presentation and the Company undertakes no obligation to update or revise such information to reflect the occurrence of future events. The events presented reflect a specific set of proscribed calculations and do not necessarily reflect all events that may impact the Company. Page 11 Bermuda Rankings calculated using the following source data: Bermuda Monetary Authority 2010 Class 4 Company filings and SNL Financial, except as follows where such data was not disclosed. ACGL: Q4 2011 Financial Supplement . XL & AXS : Standard & Poor’s 2011 Global Reinsurance Highlights. 34 Notes on Non-GAAP and Other Financial and Exposure Measures - Continued |
|
|
Street Address: 29 Richmond Road Pembroke, Bermuda Mailing Address: Suite 1790 48 Par-la-Ville Road Hamilton, Bermuda HM 11 Telephone: +1-441-278-9000 Email: investor.relations@validusholdings.com For more information on our company, products and management team please visit our website at: www.validusholdings.com |