Attached files
| file | filename |
|---|---|
| 8-K - 8-K - GENERAC HOLDINGS INC. | a2209560z8-k.htm |
| EX-99.2 - EX-99.2 - GENERAC HOLDINGS INC. | a2209560zex-99_2.htm |
QuickLinks -- Click here to rapidly navigate through this document
This section summarizes key information contained elsewhere in this offering memorandum and is qualified in its entirety by the more detailed information and consolidated financial statements included elsewhere in this offering memorandum. You should carefully review the entire offering memorandum, including the risk factors, the consolidated financial statements and the notes thereto, and the other documents to which this offering memorandum refers before making an investment decision. Unless otherwise indicated or the context requires otherwise, references in this offering memorandum to "Generac," "we," "us," "our company" or similar terms refer to Generac Power Systems, Inc. and its subsidiaries, and references to "Generac Holdings" refer to Generac Holdings Inc., our ultimate parent company.
Our company
We are a leading designer and manufacturer of a wide range of generators and other engine powered products (such as light towers, pumps and power washers) for the residential, light commercial, industrial and construction markets. We are the only significant market participant focused predominantly on these products, and we have one of the leading market positions in the power equipment markets in the United States and Canada, having grown our revenues by an 11.9% compound annual growth rate since 2000. We design, manufacture, source and modify engines, alternators, transfer switches and other components necessary for our products. Our products are fueled by natural gas, liquid propane, gasoline, diesel and Bi-FuelTM (combined diesel and natural gas) and are available through a broad network of independent dealers, retailers, wholesalers, and equipment rental companies.
Our generators have an output of between 0.8kW and 9,000kW. We classify our products into three classes based on the range of power generated and the end customer: residential power products; commercial and industrial power products; and other power products.
The following chart shows the percentage of net sales we generated for the twelve months ended March 31, 2012, after giving pro forma effect to our acquisition of Magnum Products in October 2011, by class of products:
Pro forma net sales for the twelve
months ended March 31, 2012
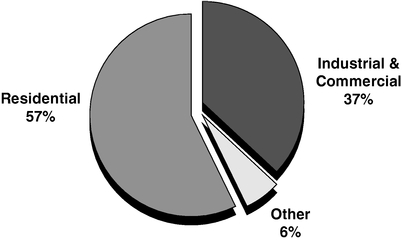
Total pro forma net sales: $1,038 million
1
While standby power systems have long been present in hospitals, data centers and industrial facilities, their use for residential and small business applications is a more recent development. Our leadership position, first mover advantage and focus on natural gas generators have enabled us to successfully penetrate these newer markets. We believe that our leading market position in the U.S. and Canadian standby markets is largely attributable to our strategy of providing high-quality, innovative and affordable products through our extensive and multi-layered distribution network.
Our portfolio of products includes:
- •
- Residential power products:
- •
- Our air-cooled and liquid-cooled automatic residential standby generators range in output from 6kW to 60kW.
They operate on either natural gas or liquid propane and are permanently installed with an automatic transfer switch, which we also manufacture.
- •
- Our portable generators fueled by gasoline range in size from 800W to 17,500W. These products serve as an emergency home
backup and are used for construction and recreation purposes.
- •
- Our power washers include models for residential and commercial use.
- •
- Industrial and commercial power products:
- •
- Our light-commercial standby generators include a full range of affordable generators from 22kW to 150kW and related
transfer switches, providing three-phase power sufficient for most small and mid-sized businesses, including grocery stores, convenience stores, restaurants, gas stations, pharmacies,
retail banks and small health care facilities.
- •
- Our industrial standard and configured standby generators and related transfer switches are used for industrial
applications (emergency backup for large healthcare, telecom, datacom, commercial office, municipal and manufacturing customers). Our single-engine industrial generators range in output from 10kW to
600kW with Modular Power System (MPS) technology extending product range up to 9mW.
- •
- Through our acquisition of Magnum Products completed in October 2011, we are also a leading provider of light towers and
mobile generators. Our mobile generators provide temporary power for construction and special events. We produce light towers that provide temporary lighting for construction projects. We also produce
mobile pumps. The end markets served by these products include construction, oil and gas, mining, military, disaster sites and wastewater bypasses.
- •
- Our other power products include aftermarket service parts sold to dealers and proprietary engines sold to third-party original equipment manufacturers, or OEMs.
We have what we believe is an industry leading, multi-layered distribution network, and our products are available in thousands of outlets across the United States and Canada. We distribute our products through independent residential and industrial dealers, electrical wholesalers, national accounts, private label arrangements, retailers, catalogs, e-commerce
2
merchants, equipment rental companies, equipment dealers and construction companies. We currently sell our products primarily in North America. We believe we have approximately 70% of the market share in the residential market and significant market share in the light commercial generator market, each based primarily on internally generated data. We believe both of these end-markets are currently under-penetrated.
We own and operate four manufacturing plants and one distribution facility in Eagle, Waukesha, Berlin and Whitewater, Wisconsin, totaling approximately 1,200,000 square feet. We also maintain inventory warehouses in the United States that facilitate the rapid response requirements of our customers. As of December 31, 2011, we had 2,223 employees. Of those, 1,364 employees were directly involved in manufacturing at our manufacturing facilities.
For the year ended December 31, 2011, we generated net sales of $792.0 million, net income of $324.6 million and Adjusted EBITDA (as defined in footnote (6) in "—Summary historical consolidated financial and other data") of $188.5 million. For the twelve months ended March 31, 2012, on a historical as-reported basis, we generated net sales of $962.6 million, net income of $349.9 million and Adjusted EBITDA of $236.8 million. For the twelve months ended March 31, 2012, after giving pro forma effect to the acquisition of Magnum Products for the full 12 months, we generated net sales of $1,038.4 million and Adjusted EBITDA of $245.9 million. For an explanation of Adjusted EBITDA, a reconciliation of Adjusted EBITDA to net income (loss) and a description of how management uses Adjusted EBITDA and for an explanation of how we calculate pro forma net sales and pro forma Adjusted EBITDA, see "—Summary historical consolidated financial and other data."
Our end-market drivers
Generators are an alternative reliable power source for recurring power outages caused by the aging U.S. power grid
Disruptions to the aging power grid in the United States, where approximately 30-50% of the transmission and distribution network is over 40 years old, are increasing due to demand growth, equipment failures, prevalent under-investment and a variety of environmental causes. Given the large estimated cost to upgrade the U.S. power grid, we believe it is unlikely that the core causes of power disturbances will be addressed in the near future. Standby generators, whether permanently installed outside a home, business or manufacturing facility or portable, provide back-up power to a traditional utility power source. We estimate that the generator market in the United States and Canada was at least $2.64 billion in 2010, with a global generator market (including prime generators used as a primary power source) estimated to be over $9 billion in 2010, based on data from Frost & Sullivan and other sources.
The cost of outages and the relative affordability of generators have improved their potential return on investment
Compared to the potential cost of power outages, the purchase and installation of back-up power generators is relatively inexpensive, often yielding a short-term positive return on investment for commercial and industrial consumers. According to a 2006 report published by Lawrence Berkeley National Laboratory, based on 2002 data, the total estimated cost of power outages in 2006 would have been $57 billion and $20 billion for commercial and industrial consumers, respectively. The increased availability of natural gas generators that are a lower
3
cost solution than traditional diesel generators has improved the return on investment in back-up power for these consumers.
Low penetration in residential and light-commercial markets and opportunities for increased penetration in industrial market
There is a substantial opportunity for penetration in the residential installed standby market, since we estimate penetration to be approximately 2.5% of U.S. single-family, detached, owner-occupied households with a home value of over $100,000, as defined by the U.S. Census Bureau. We believe that each one percent of U.S. household penetration potentially represents up to an approximate $2 billion market opportunity at current product pricing. The light-commercial market also represents a significant penetration opportunity, with over two million potential customer locations in the United States. Even in more mature industrial markets, we believe there are additional opportunities for penetration, especially given the benefits provided by natural gas engines over more common diesel engine-based generators.
Demographic trends lead to an increased focus on the safety and security provided by standby generators
We believe that demographic changes may lead to an increase in demand as the U.S. population ages and becomes increasingly conscious of safety issues, focused on convenience and dependent on electronic devices. According to our warranty registration data, currently over 70% of home standby generators are purchased by consumers over 50 years of age, while the population over 64 years of age is expected to grow by 36% from 2010 to 2020, according to the U.S. Census Bureau.
Regulatory changes should lead to growth in the commercial and industrial standby markets
Federal, state and local legislation, as well as building, health and safety codes, require the use of standby generators within certain segments of the industrial and light-commercial markets, and any new mandates could have a significant impact on the generator market. Additionally, increased federal and municipal regulation of diesel engine emissions and fuel storage should encourage market growth for natural gas-powered standby generators.
Potential benefits from infrastructure spending programs and recovery in the non-residential construction market
While most of the $840 billion in funding from the American Recovery and Reinvestment Act of 2009 (the "Recovery Act") has been paid out or committed, billions in discretionary Recovery Act funds have not yet been deployed. Federal agencies have been directed to accelerate the use of the remaining funds by September 2013 so they are not reclaimed to the General Fund of the Treasury. In addition, after the recent downturn in non-residential construction in the United States, spending has started to resume and the Architecture Billings Index, a leading economic indicator of construction activity, has remained positive since November 2011.
Our competitive strengths
Significant market share with opportunities for further penetration
We have a significant market share in the U.S. and Canadian standby generator markets, with opportunities for future penetration. In the installed residential standby generator market, we believe we are the market leader with a market share that we estimate, based primarily on
4
internally generated data, to be approximately 70%. We believe we also hold strong positions in the light-commercial and industrial markets with over 10% of the overall market share and a higher share in certain end markets.
Multi-layered distribution model
The majority of standby power systems are installed by an experienced contractor. As a result, having a network of experienced dealers who can sell, manage the installation of, and service the generator is important. We believe that our multi-layered distribution model gives us an advantage over competitors who generally rely on a single distribution channel. We use over 4,500 direct dealers for residential, light-commercial and industrial end-users, as well as wholesale, private label, retail, e-commerce and catalog distribution channels, enabling us to reach a broad range of customers. Our dealer network, which is located principally in the United States and Canada, is the industry's largest network of independent generator contractors.
Broad product line
Our product offerings include a comprehensive selection of standby generators with ranges of power output (from 0.8kW to 9,000kW) and fuel types (gasoline, natural gas, liquid propane, Bi-FuelTM and diesel) capable of catering to many end markets and users. We believe that dealers and distributors prefer dealing with a single source for a broad range of their generator needs.
Engineering excellence
As of December 31, 2011, we employed over 150 engineers focused on new product development, existing product improvement and cost reduction. Our commitment to research and development has resulted in a portfolio of approximately 90 patents and patent applications. Our patents expire between 2016 and 2028 and protect certain features and technologies we have developed for use in our products including fuel systems, air flow, electronics and controls, noise reduction and air-cooled engines.
Competitive cost structure
We believe that our product engineering, manufacturing and sourcing capabilities, along with our production volume, have enabled us to have a competitive cost structure. We base this belief on management's experience and publicly available information concerning our competitors, which, in general, do not focus exclusively on the generator business. We have implemented lean manufacturing initiatives and designed our production facilities to quickly adapt to customer demand and to the development of new product offerings. As part of our sourcing strategy, we have developed strong relationships with a network of reliable, low-cost suppliers in the United States and abroad. In 2011, we sourced more than half of our components from outside the United States. Our primary raw material inputs are steel, copper and aluminum, all of which are purchased from third parties and, in many cases, as part of machined or manufactured components. We periodically enter into commodity risk management contracts for copper with maturities of one year or less with the intention of partially offsetting the effect of price fluctuations on actual inventory purchases of certain of our raw material inputs.
5
Financial flexibility and strong free cash flow generation
Our flexible cost structure has contributed to our financial strength leading to Adjusted EBITDA margins (defined as Adjusted EBITDA as a percentage of our net sales) greater than 20% over the past seven years and strong cash flow generation. Furthermore, our business model generally requires low capital expenditures, averaging less than 2% of our net sales over the last three years. In addition, due to a tax election we made at the time of our acquisition by affiliates of CCMP Capital Advisors, LLC ("CCMP") and our acquisition of Magnum Products, we expect to have $126 million in annual amortization deductions of intangibles for tax purposes through 2020, which can be used to reduce any cash tax obligations, although our ability to fully utilize these tax benefits may be affected by the impact of the increase of our indebtedness and related interest expense that we will incur in connection with the transactions described under "—Recapitalization transactions."
Stable, experienced management team with a substantial ownership stake
Our senior management team has significant generator industry experience and a strong track record with a combined total of over 100 years of industry and related experience. Several top executives have been with us and our predecessors for more than 15 years. Our senior management team also owns over four percent of our outstanding common stock. We believe that the strength of our management team demonstrates our expertise within the industry.
Our strategy
Grow residential standby market
We intend to further expand our footprint in North America by continuing to develop our network of dealers, wholesalers and retailers. We increased our total number of active dealers by approximately 350 in 2011, and we trained over 13,000 technicians on our products over the last three years. We believe that through our extensive distribution network, potential customers are becoming increasingly aware of the benefits of standby power solutions. Through our targeted marketing initiatives, we seek to increase customer awareness of our products and to further develop Generac as the leading brand in the standby power market.
Grow commercial and industrial market share
We are focused on improving market share in the commercial and industrial market, where we currently believe we have approximately 10% of the market. We plan to continue to provide innovative and affordable products to our customers, drawing upon our engineering expertise and experience. In the industrial market, we market our proprietary MPS technology, which provides increased affordability, redundancy and scalability within the 600kW to 9,000kW output ranges when compared to single-engine generators. We have also developed an affordable line of natural gas generators for the light-commercial market, with proprietary fuel systems, emissions technology and control systems. Additionally, we are building a network of relationships with certain engineers to drive large industrial projects.
Diversify end-markets with new products and services
We introduced an expanded line of portable generators in 2008 and have subsequently added significant distribution capacity, providing us increased opportunities to sell both portable and installed standby generators. We expect to evaluate opportunities to expand organically or through opportunistic acquisitions into other complementary engine-driven products where we
6
can leverage our manufacturing, sourcing and engineering capabilities and our distribution network. In addition, in October 2011, we acquired the assets of the Magnum Products business, which is the number one light tower manufacturer in the United States and has a growing share of the mobile generator market.
Enter new geographies
With only approximately 5% of our 2011 total net sales from markets outside of the United States, international sales represent a significant growth opportunity for us. For the entire industry, generator sales are expected to grow 3.7% annually in Europe through 2016, 10.5% annually in India through 2016 and 22.1% in China by 2016, in each case according to Frost & Sullivan. We have a developing distribution network in Mexico and Central and South America and are actively pursuing partnerships with established international distribution partners in other regions.
Outlook for the remainder of 2012
Primarily as a result of an increased full-year outlook for residential product sales, we believe that our full-year 2012 total net sales will increase as compared to 2011. Specifically, for the second quarter of 2012, we expect net sales to increase appreciably in comparison to the second quarter of 2011, although not at the level that our net sales increased in the first quarter of 2012 compared to the first quarter of 2011. We expect lead times for residential products to return to more normalized levels during the second quarter.
In the second half of 2011, multiple major outage events drove strong demand for home standby generators, and the increased awareness of these products contributed to substantial revenue growth for us in the second half of 2011 and the first quarter of 2012. However, major outage activity typically increases product awareness and may drive customers to accelerate their purchase of a standby or portable generator for a period that we believe may last for six or more months for standby generators.
Due to the significant demand and awareness created by the outage events in the second half of 2011, we expect revenue contribution during 2012 to be heavily weighted toward the first half of the year, assuming no material improvement in the macroeconomic environment and no comparable major outage events during 2012. With these assumptions, we expect year-over-year revenue to decrease in the second half of 2012. Because of this, our historical seasonality patterns may not apply in 2012. See "Item 2. Management's Discussion and Analysis of Financial Condition and Results of Operations—Other factors—Seasonality" in our Form 10-Q.
In spite of the effects described above, we expect both residential and commercial and industrial product sales (including the effect of our acquisition of Magnum Products in October 2011) during the second half of 2012 to grow in comparison to the previous baseline level experienced in the second half of 2010, which is the most recent comparable period with no major outage events.
We expect our gross margins to remain approximately flat during 2012 as compared to the prior year. In addition, we expect consolidated operating expenses as a percentage of net sales, excluding amortization of intangibles, to remain slightly higher as compared to 2011, as we
7
continue to invest in our infrastructure to support strategic growth initiatives and an overall higher level of baseline sales.
Recapitalization transaction
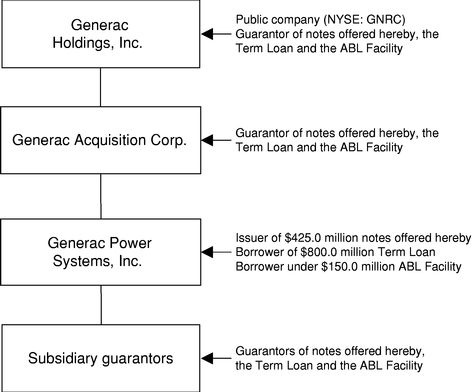
We have announced that we are seeking to raise $1.2 billion in debt financing in order to fund a special cash dividend to our stockholders of up to $10.00 per share, or approximately $679.5 million in the aggregate.
The debt financing is expected to consist of the notes being offered pursuant to this offering memorandum and an amended and restated senior secured term loan (the "Term Loan"). In addition, we are seeking to establish a new ABL revolving credit facility (the "ABL Facility" and, together with the Term Loan, the "new senior secured credit facilities"). See "Description of other indebtedness." We intend to use the net proceeds of this offering, together with borrowings under the Term Loan, (i) to pay the special cash dividend, (ii) to repay in full our existing senior secured credit facilities and (iii) to pay related fees and expenses. We refer to the special cash dividend, the repayment in full of our existing senior secured credit facilities, the offering of the notes, the borrowing of the Term Loan, the use of proceeds of the notes and the Term Loan, the establishment of our new ABL Facility and the payment of all fees and expenses related to the foregoing as the "Transactions."
We intend to declare the dividend upon the closing of the offering and closing of the Term Loan and make the distribution shortly thereafter.
The following table highlights the estimated sources and uses of funds for the Transactions (dollars amounts in millions):
| Sources of funds: |
|
Uses of funds: |
|
||||||
|---|---|---|---|---|---|---|---|---|---|
ABL revolving credit facility |
$ | — | Repayment of existing senior secured | ||||||
Term loan B(1) |
800 | credit facilities(1) | $ | 575 | |||||
Notes offered hereby |
425 | Special cash dividend | 679 | ||||||
Cash from balance sheet(2) |
65 | Estimated fees and expenses | 35 | ||||||
Total sources |
$ | 1,290 | Total uses | $ | 1,290 | ||||
(1) Includes rollover of loans of certain lenders under our existing senior secured credit facilities into the Term Loan.
(2) Cash from balance sheet is as of March 31, 2012. The amount of cash from the balance sheet that is available to fund the Transaction may change due to ordinary course changes in working capital between March 31, 2012 and the date on which we pay the special cash dividend.
Our history
Generac Power Systems, Inc. was founded in 1959 to market a line of affordable portable generators that offered superior performance and features. We expanded beyond portable generators in 1980 into the industrial market with the introduction of first stationary generators that provided up to 200kW. We entered the residential market in 1989 with a residential standby generator, and expanded product development and global distribution system in the 1990s, forming a series of alliances that tripled higher output generator net sales. In 1998, we sold the Generac® portable products business to the Beacon Group, a private equity firm, which eventually sold this business to Briggs & Stratton. Growth accelerated in 2000 as we expanded our automatic residential standby generator product offering,
8
implemented multi-layered distribution philosophy, accelerating penetration in the commercial market. Following the expiration of a non-compete agreement in 2007, we successfully re-entered the portable generator market in 2008.
We were acquired by affiliates of CCMP in 2006. We successfully completed our initial public offering on the New York Stock Exchange (NYSE: GNRC) in February 2010. Following the exercise of their option to purchase additional shares by the underwriters, we received approximately $248 million in net proceeds from our initial public offering, which we used to pay down outstanding debt. Currently, affiliates of CCMP own 59% of our outstanding common stock. Generac Holdings currently files annual, quarterly and current reports, proxy statements and other information with the SEC.
Our sponsor
CCMP is a private equity firm specializing in buyouts and growth equity investments in companies ranging from $500 million to more than $3 billion in size. With offices in New York, Houston and London, CCMP focuses on four primary industries: Consumer, Industrial, Energy and Healthcare. Investments under management in its current fund, CCMP Capital Investors II, L.P. include, in addition to the investment in our company, ARAMARK Holdings Corporation, Chaparral Energy Inc., Edwards Group Limited, Francesca's Holdings Corporation, Infogroup Inc., Medpace Inc., LHP Hospital Group, Milacron LLC and Newark Energy LLC.
Corporate structure
The following chart illustrates our corporate structure:
9
Summary historical consolidated financial and other data
The table below provides summary historical consolidated financial and other data for Generac Holdings, our ultimate parent company and a guarantor of the notes, for the periods and as of the dates indicated. The summary historical consolidated financial data for each of the fiscal years ended December 31, 2009, 2010 and 2011 and as of December 31, 2010 and 2011 were derived from the audited consolidated financial statements incorporated by reference and included elsewhere in this offering memorandum. The summary historical consolidated financial data as of December 31, 2009 was derived from the audited consolidated financial statements which are not included in this offering memorandum. The summary consolidated financial data for the three months ended March 31, 2011 and 2012 and as of March 31, 2012 were derived from the unaudited consolidated financial statements included elsewhere in this offering memorandum. The summary consolidated financial data as of March 31, 2011 was derived from the unaudited consolidated financial statements which are not included in this offering memorandum. In the opinion of management, the unaudited consolidated financial statements have been prepared on the same basis as the audited consolidated financial statements and include all adjustments, consisting of normal recurring adjustments, necessary for a fair presentation of our operating results and financial position for those periods and as of such dates. The results for any interim period are not necessarily indicative of the results that may be expected for a full year.
The financial and other data for the twelve months ended March 31, 2012 was derived by (i) combining our financial and other data for the year ended December 31, 2011 with (ii) our financial and other data for the three months ended March 31, 2012 and (iii) subtracting our financial and other data for the three months ended March 31, 2011. This presentation is not in accordance with GAAP. We believe that this presentation provides useful information to investors regarding our recent financial performance and we view this presentation of the four most recently completed quarters as a key measurement period for investors to assess our historical results. In addition, our management uses trailing four quarter financial information to evaluate the financial performance of the company for ongoing planning purposes, including a continuous assessment of our financial performance in comparison to budgets and internal projections. This presentation has limitations as an analytical tool, and you should not consider it in isolation or as a substitute for analysis of our results as reported under GAAP.
The pro forma financial data and ratios for the twelve months ended March 31, 2012 have been prepared to give pro forma effect to our October 2011 acquisition of Magnum Products as if the acquisition occurred on April 1, 2011. The pro forma financial data and ratios are presented for informational purposes only and are not necessarily indicative of the financial position or results of operations that would have been achieved had our acquisition of Magnum Products been completed at April 1, 2011. In addition, the pro forma financial data and ratios do not purport to project our future financial position or results of operations. The financial data for Magnum Products for the period prior to our acquisition of Magnum Products used in the calculation of this pro forma data has been prepared by, and is the responsibility of, our management and has not been reviewed or audited or subject to any other procedures by our independent registered public accounting firm. Accordingly, our independent registered public accounting firm does not express an opinion or any other form of assurance with respect to this financial data. See "Risk factors—Risks relating to the notes and this offering—We have not fully evaluated the internal control over financial reporting of
10
Magnum Products, and the financial information we present in this offering memorandum for periods prior to our acquisition of Magnum Products has not been audited or reviewed by any independent auditor."
The results indicated below and elsewhere in this offering memorandum are not necessarily indicative of our future performance. You should read this information together with "Selected historical consolidated financial data" and "Capitalization" in this offering memorandum, as well as "Management's discussion and analysis of financial condition and results of operations" sections in the Form 10-K, the Form 10-Q and our consolidated financial statements and related notes included elsewhere in this offering memorandum.
| |
|
|
|
Three months ended March 31, |
Twelve months ended March 31, 2012 |
||||||||||||||
|---|---|---|---|---|---|---|---|---|---|---|---|---|---|---|---|---|---|---|---|
| |
Year ended December 31, | ||||||||||||||||||
| (Dollar amounts in thousands) |
2009 |
2010 |
2011 |
2011 |
2012 |
||||||||||||||
Selected statement of operations data: |
|||||||||||||||||||
Net sales |
$ | 588,248 | $ | 592,880 | $ | 791,976 | $ | 123,981 | $ | 294,561 | $ | 962,556 | |||||||
Costs of goods sold |
352,398 | 355,523 | 497,322 | 76,804 | 183,556 | 604,074 | |||||||||||||
Gross profit |
235,850 | 237,357 | 294,654 | 47,177 | 111,005 | 358,482 | |||||||||||||
Operating expenses: |
|||||||||||||||||||
Selling and service |
59,823 | 57,954 | 77,776 | 14,305 | 25,126 | 88,597 | |||||||||||||
Research and development |
10,842 | 14,700 | 16,476 | 3,885 | 5,055 | 17,646 | |||||||||||||
General and administrative |
14,713 | 22,599 | 30,012 | 6,117 | 9,106 | 33,001 | |||||||||||||
Amortization of intangibles(1) |
51,960 | 51,808 | 48,020 | 11,727 | 12,225 | 48,518 | |||||||||||||
Trade name write-down(2) |
— | — | 9,389 | — | — | 9,389 | |||||||||||||
Total operating expenses |
137,338 | 147,061 | 181,673 | 36,034 | 51,512 | 197,151 | |||||||||||||
Income from operations |
98,512 | 90,296 | 112,981 | 11,143 | 59,493 | 161,331 | |||||||||||||
Other income (expense): |
|||||||||||||||||||
Interest expense |
(70,862 | ) | (27,397 | ) | (23,718 | ) | (6,001 | ) | (5,674 | ) | (23,391 | ) | |||||||
Gain on extinguishment of debt(3) |
14,745 | — | — | — | — | — | |||||||||||||
Write-off of deferred financing costs related to debt extinguishment and loss on extinguishment of debt |
— | (4,809 | ) | (377 | ) | — | (4,309 | ) | (4,686 | ) | |||||||||
Investment income |
2,205 | 235 | 110 | 36 | 19 | 93 | |||||||||||||
Costs related to acquisition |
— | — | (875 | ) | — | — | (875 | ) | |||||||||||
Other, net |
(1,206 | ) | (1,105 | ) | (1,155 | ) | (241 | ) | (425 | ) | (1,339 | ) | |||||||
Total other expense, net |
(55,118 | ) | (33,076 | ) | (26,015 | ) | (6,206 | ) | (10,389 | ) | (30,198 | ) | |||||||
Income before provision (benefit) for income taxes |
43,394 | 57,220 | 86,966 | 4,937 | 49,104 | 131,133 | |||||||||||||
Provision (benefit) for income taxes(4) |
339 | 307 | (237,677 | ) | 93 | 19,044 | (218,726 | ) | |||||||||||
Net income |
$ | 43,055 | $ | 56,913 | $ | 324,643 | $ | 4,844 | $ | 30,060 | $ | 349,859 | |||||||
Statement of cash flows data: |
|||||||||||||||||||
Depreciation |
$ | 7,715 | $ | 7,632 | $ | 8,103 | $ | 1,936 | $ | 1,993 | $ | 8,160 | |||||||
Amortization |
51,960 | 51,808 | 48,020 | 11,727 | 12,225 | 48,518 | |||||||||||||
Expenditures for property and equipment |
(4,525 | ) | (9,631 | ) | (12,060 | ) | (1,569 | ) | (2,138 | ) | (12,629 | ) | |||||||
Net cash provided by operating activities |
74,607 | 114,481 | 169,712 | 12,671 | 38,584 | 195,625 | |||||||||||||
Net cash used in investing activities |
(4,351 | ) | (11,204 | ) | (95,953 | ) | (1,566 | ) | (4,417 | ) | (98,804 | ) | |||||||
Net cash provided by (used in) financing activities |
$ | 9,822 | $ | (186,001 | ) | $ | (59,216 | ) | $ | 309 | $ | (35,563 | ) | (95,088 | ) | ||||
11
| |
As of December 31, | As of March 31, 2012 |
|||||||||||
|---|---|---|---|---|---|---|---|---|---|---|---|---|---|
| (Dollar amounts in thousands) |
2009 |
2010 |
2011 |
||||||||||
Balance sheet data: |
|||||||||||||
Current assets |
$ | 345,017 | $ | 272,519 | $ | 383,265 | $ | 425,924 | |||||
Property, plant and equipment, net |
73,374 | 75,287 | 84,384 | 84,422 | |||||||||
Goodwill |
525,875 | 527,148 | 547,473 | 547,782 | |||||||||
Other intangibles and other assets |
392,977 | 334,929 | 537,671 | 513,589 | |||||||||
Total assets |
$ | 1,337,243 | $ | 1,209,883 | $ | 1,552,793 | $ | 1,571,717 | |||||
Total current liabilities |
$ | 131,971 | $ | 86,685 | $ | 165,390 | $ | 167,241 | |||||
Long-term debt, less current portion |
1,052,463 | 657,229 | 575,000 | 559,588 | |||||||||
Other long-term liabilities |
17,418 | 24,902 | 43,514 | 44,115 | |||||||||
Redeemable stock (5) |
878,205 | — | — | — | |||||||||
Total liabilities, redeemable stock and stockholders' equity (5) |
$ | 1,337,243 | $ | 1,209,883 | $ | 1,552,793 | $ | 1,571,717 | |||||
Total indebtedness |
$ | 1,091,539 | $ | 657,229 | $ | 597,874 | $ | 573,651 | |||||
| |
|
|
|
Three months ended March 31, |
Twelve months ended March 31, 2012 |
||||||||||||||
|---|---|---|---|---|---|---|---|---|---|---|---|---|---|---|---|---|---|---|---|
| |
Year ended December 31, | ||||||||||||||||||
| (Dollar amounts in thousands) |
|||||||||||||||||||
| 2009 |
2010 |
2011 |
2011 |
2012 |
|||||||||||||||
Other financial data: |
|||||||||||||||||||
Adjusted EBITDA(6) |
$ | 159,087 | $ | 156,249 | $ | 188,476 | $ | 27,484 | $ | 75,802 | $ | 236,794 | |||||||
Adjusted net income(7) |
$ | 83,643 | $ | 115,954 | $ | 147,176 | $ | 17,142 | $ | 66,089 | $ | 196,123 | |||||||
Pro forma net sales(8) |
$ | 1,038,440 | |||||||||||||||||
Pro forma Adjusted EBITDA(9) |
$ | 245,872 | |||||||||||||||||
Ratio of pro forma total indebtedness to pro forma Adjusted EBITDA(9)(10) |
5.0x | ||||||||||||||||||
Ratio of pro forma Adjusted EBITDA(9) to pro forma cash interest expense(10) |
2.8x | ||||||||||||||||||
(1) Our amortization of intangibles expenses include the straight-line amortization of customer lists, patents and other finite-lived intangibles assets.
(2) During the fourth quarter of 2011, we decided to strategically transition certain products sold under a different trade name to our more widely known Generac brand. As a result of this decision, we recorded a $9.4 million non-cash charge, which primarily related to the write-down of the impacted trade name to net realizable value. In addition, we performed our annual goodwill and tradename impairment test as of October 31, 2011. Except as noted, no impairment was present.
(3) During 2009, affiliates of CCMP acquired $9.9 million principal amount of first lien term loans and $20.0 million principal amount of second lien term loans for approximately $14.8 million. CCMP's affiliates exchanged this debt for 1,475.4596 shares of Series A Preferred Stock. The fair value of the shares exchanged was $14.8 million. We recorded this transaction as additional Series A Preferred Stock of $14.8 million based on the fair value of the debt contributed by CCMP's affiliates, which approximated the fair value of shares exchanged. The debt was held in treasury at face value. Consequently, we recorded a gain on extinguishment of debt of $14.7 million, which includes a write-off of deferred financing fees and other closing costs, in the consolidated statement of operations for the year ended December 31, 2009.
(4) The 2011 net tax benefit of $237.7 million includes a tax benefit of $271.4 million recorded due to the reversal of valuation allowances recorded on our net deferred tax assets. See Note 9 to our audited consolidated financial statements included in our Form 10-K for additional information.
(5) As of December 31, 2009, includes our Series A Preferred Stock and Class B Common Stock. See Note 7 to our audited consolidated financial statements included in our Form 10-K for additional information.
(6) Adjusted EBITDA represents net income before interest expense, taxes, depreciation and amortization, as further adjusted for the other items reflected in the reconciliation table set forth below. This presentation is substantially consistent with the presentation used in the indenture governing the notes offered hereby and in our new senior secured credit facilities
12
("Covenant EBITDA"), except that we do not give effect to certain additional adjustments that are permitted under the indenture governing the notes offered hereby and in those facilities which, if included, would increase the amount reflected in this table. For a description of the additional adjustments permitted for Covenant EBITDA under the indenture governing the notes offered hereby, see "Description of notes." The definitions of Adjusted EBITDA in our new senior secured credit facilities will be substantially the same as the definition in our existing February 2012 credit agreement.
We view Adjusted EBITDA as a key measure of our performance. We present Adjusted EBITDA not only due to its importance for purposes of the notes and our new senior secured credit facilities but also because it assists us in comparing our performance across reporting periods on a consistent basis because it excludes items that we do not believe are indicative of our core operating performance. Our management uses Adjusted EBITDA:
- •
- for planning purposes, including the preparation of our annual operating budget and
developing and refining our internal projections for future periods;
- •
- to allocate resources to enhance the financial performance of our business;
- •
- as a benchmark for the determination of the bonus component of compensation for our
senior executives under our management incentive plan;
- •
- to evaluate the effectiveness of our business strategies and as a supplemental tool
in evaluating our performance against our budget for each period; and
- •
- in communications with our board of directors and investors concerning our financial performance.
We believe Adjusted EBITDA is used by securities analysts, investors and other interested parties in the evaluation of our company. Management believes that the disclosure of Adjusted EBITDA offers an additional financial metric that, when coupled with U.S. GAAP results and the reconciliation to U.S. GAAP results, provides a more complete understanding of our results of operations and the factors and trends affecting our business. We believe Adjusted EBITDA is useful to investors for the following reasons:
- •
- Adjusted EBITDA and similar non-GAAP measures are widely used by
investors to measure a company's operating performance without regard to items that can vary substantially from company to company depending upon financing and accounting methods, book values of
assets, tax jurisdictions, capital structures and the methods by which assets were acquired;
- •
- Investors can use Adjusted EBITDA as a supplemental measure to evaluate the overall
operating performance of our company, including our ability to service our debt and other cash needs; and
- •
- by comparing our Adjusted EBITDA in different historical periods, our investors can
evaluate our operating performance excluding the impact of items described below.
The adjustments included in the reconciliation table listed below are provided for under the indenture governing the notes offered hereby and our new senior secured credit facilities (except where noted in footnote (j) below) and also are presented to illustrate the operating performance of our business in a manner consistent with the presentation used by our management and board of directors. These adjustments eliminate the impact of a number of items that:
- •
- we do not consider indicative of our ongoing operating performance, such as
non-cash impairment and other charges, transaction costs relating to our acquisition by CCMP and repurchases of our debt by affiliates of CCMP, non-cash gains relating to the
retirement of debt, severance costs and other restructuring-related business optimization expenses;
- •
- we believe to be akin to, or associated with, interest expense, such as
administrative agent fees, revolving credit facility commitment fees and letter of credit fees;
- •
- are non-cash in nature, such as share-based compensation; or
- •
- were eliminated following the consummation of our initial public offering, such as sponsor fees.
We explain in more detail in footnotes (a) through (j) below why we believe these adjustments are useful in calculating Adjusted EBITDA as a measure of our operating performance.
Adjusted EBITDA does not represent, and should not be a substitute for, net income or cash flows from operations as determined in accordance with U.S. GAAP. Adjusted EBITDA has limitations as an analytical tool, and you should not consider it in isolation, or as a substitute for analysis of our results as reported under U.S. GAAP. Some of the limitations are:
- •
- Adjusted EBITDA does not reflect our cash expenditures, or future requirements for
capital expenditures or contractual commitments;
- •
- Adjusted EBITDA does not reflect changes in, or cash requirements for, our working capital needs;
13
- •
- Adjusted EBITDA does not reflect the significant interest expense, or the cash
requirements necessary to service interest or principal payments, on our debt;
- •
- although depreciation and amortization are non-cash charges, the assets
being depreciated and amortized will often have to be replaced in the future, and Adjusted EBITDA does not reflect any cash requirements for such replacements;
- •
- several of the adjustments that we use in calculating Adjusted EBITDA, such as
non-cash impairment charges, while not involving cash expense, do have a negative impact on the value our assets as reflected in our consolidated balance sheet prepared in accordance with
U.S. GAAP;
- •
- the adjustments for business optimization expenses, which we believe are appropriate
for the reasons set out in note (f) below, represent costs associated with severance and other items which are reflected in operating expenses and income (loss) from continuing operations in
our consolidated statements of operations prepared in accordance with U.S. GAAP; and
- •
- other companies may calculate Adjusted EBITDA differently than we do, limiting its usefulness as a comparative measure.
Furthermore, as noted above, one of our uses of Adjusted EBITDA is as a benchmark for determining elements of compensation for our senior executives. At the same time, some or all of these senior executives have responsibility for monitoring our financial results generally, including the items that are included as adjustments in calculating Adjusted EBITDA (subject ultimately to review by our board of directors in the context of the board's review of our quarterly financial statements). While many of the adjustments (for example, transaction costs and credit facility fees and sponsor fees), involve mathematical application of items reflected in our financial statements, others (such as business optimization adjustments) involve a degree of judgment and discretion. While we believe that all of these adjustments are appropriate, and while the quarterly calculations are subject to review by our board of directors in the context of the board's review of our quarterly financial statements and certification by our chief financial officer in a compliance certificate provided to the lenders under our new senior secured credit facilities, this discretion may be viewed as an additional limitation on the use of Adjusted EBITDA as an analytical tool.
Because of these limitations, Adjusted EBITDA should not be considered as a measure of discretionary cash available to us to invest in the growth of our business. We compensate for these limitations by relying primarily on our U.S. GAAP results and using Adjusted EBITDA only supplementally.
Our new ABL Facility will require us to maintain a minimum fixed charge coverage ratio (Covenant EBITDA to fixed charges) if excess availability thereunder is less than certain threshold amounts. Failure to comply with this covenant would result in an event of default under our new ABL Facility unless waived by our ABL Facility lenders. An event of default under our new ABL Facility could result in the acceleration of the notes offered hereby and our indebtedness under the new senior secured credit facilities, and we may be unable to repay the amounts due.
The following table presents a reconciliation of net income (loss) to Adjusted EBITDA:
| |
|
|
|
Three months ended March 31, |
Twelve months ended March 31, 2012 |
||||||||||||||
|---|---|---|---|---|---|---|---|---|---|---|---|---|---|---|---|---|---|---|---|
| |
Year ended December 31, | ||||||||||||||||||
| (Dollar amounts in thousands) |
2009 |
2010 |
2011 |
2011 |
2012 |
||||||||||||||
Net income |
$ | 43,055 | $ | 56,913 | $ | 324,643 | $ | 4,844 | $ | 30,060 | $ | 349,859 | |||||||
Interest expense |
70,862 | 27,397 | 23,718 | 6,001 | 5,674 | 23,391 | |||||||||||||
Depreciation and amortization |
59,675 | 59,440 | 56,123 | 13,663 | 14,218 | 56,678 | |||||||||||||
Provision (benefit) for income taxes |
339 | 307 | (237,677 | ) | 93 | 19,044 | (218,726 | ) | |||||||||||
Non-cash impairment and other charges (income)(a) |
(1,592 | ) | (361 | ) | 10,400 | 446 | (204 | ) | 9,750 | ||||||||||
Non-cash share-based compensation expense(b) |
— | 6,363 | 8,646 | 2,000 | 2,439 | 9,085 | |||||||||||||
Write-off of deferred financing costs related to debt extinguishment and loss on extinguishment of debt(c) |
— | 4,809 | 377 | — | 4,309 | 4,686 | |||||||||||||
Transaction costs and credit facility fees(d) |
1,188 | 1,019 | 1,719 | 173 | 135 | 1,681 | |||||||||||||
Non-cash gains(e) |
(14,745 | ) | — | — | — | — | — | ||||||||||||
Business optimization expenses(f) |
— | 108 | 277 | 221 | — | 56 | |||||||||||||
Sponsor fees(g) |
500 | 56 | — | — | — | — | |||||||||||||
Letter of credit fees(h) |
135 | (26 | ) | (33 | ) | 2 | 1 | (34 | ) | ||||||||||
Other state franchise taxes(i) |
72 | 317 | 342 | 64 | 132 | 410 | |||||||||||||
Holding company interest income(j) |
(402 | ) | (93 | ) | (59 | ) | (23 | ) | (6 | ) | (42 | ) | |||||||
Adjusted EBITDA |
$ | 159,087 | $ | 156,249 | $ | 188,476 | $ | 27,484 | $ | 75,802 | $ | 236,794 | |||||||
- •
- for the years ended December 31, 2010 and 2009, primarily unrealized mark-to-market adjustments on copper and Euro forward contracts and loss on disposal of assets; and
(a) Represents the following non-cash charges:
14
- •
- for the years ended December 31, 2011, primarily the $9.4 million trade name write-down described in "Management's Discussion and Analysis of Financial Condition and Results of Operations—Critical accounting policies—Goodwill and other intangible assets" in the Form 10-K. Also includes unrealized mark-to-market adjustment on copper forward contracts and loss on disposal of assets.
- •
- The adjustments for unrealized mark-to-market gains and losses on copper forward and Euro contracts
represent non-cash items to reflect changes in the fair value of forward contracts that have not been settled or terminated. We believe that it is useful to adjust net income for these
items because the charges do not represent a cash outlay in the period in which the charge is incurred, although Adjusted EBITDA must always be used together with our U.S. GAAP statements of
operations and cash flows to capture the full effect of these contracts on our operating performance; and
- •
- The trade name write-down recorded in the year ended December 31, 2011 is a one-time item that we believe does not reflect our ongoing operations. These charges are explained in greater detail in "Management's Discussion and Analysis of Financial Condition and Results of Operations—Critical Accounting Policies—Goodwill and Other Intangible Assets" in the Form 10-K.
- •
- administrative agent fees and revolving credit facility commitment fees under our existing senior secured credit
facilities, which we believe to be akin to, or associated with, interest expense and whose inclusion in Adjusted EBITDA is therefore similar to the inclusion of interest expense in that calculation;
- •
- before 2011, transaction costs relating to repurchases of debt under our first and second lien credit facilities by
affiliates of CCMP, which CCMP's affiliates contributed to our company in exchange for the issuances of securities, which repurchases we do not expect to recur; and
- •
- for the year ended December 31, 2011, transaction costs relating to the acquisition of the Magnum Products business.
We believe that adjusting net income for these non-cash charges is useful for the following reasons:
(b) Represents share-based compensation expense to account for stock options, restricted stock and other stock awards over their vesting period.
(c) Represents the write-off of a portion of deferred financing costs related to the accelerated repayment of debt and the loss on extinguishment of debt for the debt refinanced in February 2012.
(d) Represents the following transaction costs and fees relating to our existing senior secured credit facilities:
(e) Represents the non-cash gains on the extinguishment of debt repurchased by affiliates of CCMP, as described in note (d) above, which we do not expect to recur.
(f) Primarily represents severance costs incurred from restructuring-related activities. Although we have incurred severance costs in several of our recent fiscal years, it is difficult to predict the amounts of similar costs in the future, and we believe that adjusting for these costs aids in measuring the performance of our ongoing operations. We believe that these costs will tend to be immaterial to our results of operations in future periods.
(g) Represents management, consulting, monitoring, transaction and advisory fees and related expenses paid or accrued to affiliates of CCMP and certain other investors (related parties) under an advisory services and monitoring agreement. This agreement automatically terminated upon consummation of our initial public offering, and, accordingly, we believe that these expenses do not reflect the expenses of our ongoing operations.
(h) Represents fees on letters of credit outstanding under our existing senior secured credit facilities, which we believe to be akin to, or associated with, interest expense and whose inclusion in Adjusted EBITDA is therefore similar to the inclusion of interest expense.
(i) Represents franchise and business activity taxes paid at the state level. We believe the inclusion of these taxes in calculating Adjusted EBITDA is similar to the inclusion of income taxes, as set forth in the table above.
(j) Represents interest earned on cash held at Generac Holdings. We exclude these amounts because we do not include them in the calculation of "Covenant EBITDA" under and as defined in our new senior secured credit facilities.
(7) Adjusted net income is defined as net income before provision (benefit) for income taxes adjusted for the following items: cash income tax expense, amortization of intangible assets, amortization and write-offs of deferred loan costs related to our debt, intangible asset impairment charges, transaction costs and purchase accounting adjustments, and non-cash gains reflected in the reconciliation table set forth below.
We believe adjusted net income is used by securities analysts, investors and other interested parties in the evaluation of our company operations. Management believes the disclosure of adjusted net income offers an additional financial metric that, when used in conjunction with U.S. GAAP results and the reconciliation to U.S. GAAP results, provides a more complete understanding of our results of operations and the factors and trends affecting our business.
The adjustments included in the reconciliation table listed below are presented to illustrate the operating performance of our business in a manner consistent with the presentation used by investors and securities analysts. Similar to the Adjusted EBITDA reconciliation, these adjustments eliminate the impact of a number of items we do not consider indicative of our ongoing
15
operating performance, such as amortization costs, and non-cash gains and write-offs relating to the retirement of debt. We also make adjustments to present cash taxes paid.
Similar to Adjusted EBITDA, adjusted net income does not represent, and should not be a substitute for, net income or cash flows from operations as determined in accordance with U.S. GAAP. Adjusted net income has limitations as an analytical tool, and you should not consider it in isolation, or as a substitute for analysis of our results as reported under U.S. GAAP. Some of the limitations are:
- •
- adjusted net income does not reflect changes in, or cash requirements for, our
working capital needs;
- •
- although amortization is a non-cash charge, the assets being amortized
may have to be replaced in the future, and adjusted net income does not reflect any cash requirements for such replacements;
- •
- Other companies may calculate adjusted net income differently than we do, limiting its usefulness as a comparative measure.
The following table presents a reconciliation of net income (loss) to adjusted net income:
| |
|
|
|
Three months ended March 31, |
Twelve months ended March 31, 2012 |
||||||||||||||
|---|---|---|---|---|---|---|---|---|---|---|---|---|---|---|---|---|---|---|---|
| |
Year ended December 31, | ||||||||||||||||||
| (Dollar amounts in thousands) |
2009 |
2010 |
2011 |
2011 |
2012 |
||||||||||||||
Net income |
$ | 43,055 | $ | 56,913 | $ | 324,643 | $ | 4,844 | $ | 30,060 | $ | 349,859 | |||||||
Provision (benefit) for income taxes |
339 | 307 | (237,677 | ) | 93 | 19,044 | (218,726 | ) | |||||||||||
Income before provision (benefit) for income taxes |
43,394 | 57,220 | 86,966 | 4,937 | 49,104 | 131,133 | |||||||||||||
Amortization of intangible assets |
51,960 | 51,808 | 48,020 | 11,727 | 12,225 | 48,518 | |||||||||||||
Amortization of deferred financing costs |
3,417 | 2,439 | 1,986 | 502 | 506 | 1,990 | |||||||||||||
Write-off of deferred financing costs related to debt extinguishment and loss on extinguishment of debt |
— | 4,809 | 377 | — | 4,309 | 4,686 | |||||||||||||
Trade name write-down |
— | — | 9,389 | — | — | 9,389 | |||||||||||||
Transaction costs and purchase accounting adjustments |
— | — | 875 | — | — | 875 | |||||||||||||
Gain on extinguishment of debt |
(14,745 | ) | — | — | — | — | — | ||||||||||||
Adjusted net income before income taxes |
84,026 | 116,276 | 147,613 | 17,166 | 66,144 | 196,591 | |||||||||||||
Cash income tax expense |
(383 | ) | (322 | ) | (437 | ) | (24 | ) | (55 | ) | (468 | ) | |||||||
Adjusted net income |
$ | 83,643 | $ | 115,954 | $ | 147,176 | $ | 17,142 | $ | 66,089 | $ | 196,123 | |||||||
(8) Pro forma net sales is calculated as net sales for the twelve months ended March 31, 2012, adjusted for Magnum Product's net sales of $75.9 million for the period from April 1, 2011 through the acquisition date of October 3, 2011.
(9) Pro forma Adjusted EBITDA is calculated as our Adjusted EBITDA for the twelve months ended March 31, 2012 of $236.8 million, as described and reconciled to net income above in footnote (6), adjusted for Magnum Products' Adjusted EBITDA of $9.1 million for the period from April 1, 2011 through the acquisition date of October 3, 2011. Pro forma Adjusted EBITDA does not include additional estimated annual synergies of up to $1.5 million that we expect to begin realizing during the balance of 2012 in connection with our acquisition of Magnum Products.
Magnum Products' Adjusted EBITDA represents Magnum Products' income from operations before amortization, as further adjusted for the other items reflected in the reconciliation table set forth below, for the period indicated. Our presentation of Magnum Products' income from operations excludes (i) interest expense because the acquisition was structured as an asset sale and we did not assume any debt and (ii) rent expense associated with a lease of property that was terminated because we acquired title to the property, but includes an estimate of depreciation on new property.
| (Dollar amounts in thousands) |
Period between April 1, 2011 and October 3, 2011 |
|||
|---|---|---|---|---|
Magnum Products income from operations |
$ | 8,798 | ||
Magnum Products depreciation |
303 | |||
Magnum Products other income (expense) |
(23 | ) | ||
Magnum Products Adjusted EBITDA |
$ | 9,078 | ||
(10) Gives pro forma effect to the Transactions. As of March 31, 2012, on a pro forma basis, total indebtedness would have been $1,225.0 million. See "Capitalization." For the twelve months ended March 31, 2012, on a pro forma basis giving effect to the issuance of the notes offered hereby and borrowings under our new Term Loan (each at assumed rates) and repayment of our existing credit facilities and payment of the special cash dividend (assuming that our interest rate swaps remain outstanding), interest expense would have been approximately $88.1 million. For every 0.125% change in the blended assumed interest rate, pro forma interest expense would increase or decrease, as applicable, by $1.5 million.
16
Summary
Summary historical consolidated financial and other data