Attached files
| file | filename |
|---|---|
| 8-K - FORM 8-K - ANIXTER INTERNATIONAL INC | d351760d8k.htm |
 First Quarter 2012
Investor Presentation
Exhibit 99.1 |
 Investor Presentation First Quarter 2012
2
Safe Harbor Statement
The
statements
in
this
presentation
that
use
such
words
as
“believe,”
“expect,”
“intend,”
“anticipate,”
“contemplate,”
“estimate,”
“plan,”
“project,”
“should,”
“may,”
”will,”
or similar expressions are forward-looking statements. They are subject
to a number of factors that could cause the company’s actual results to
differ materially from what is indicated here. These factors include general
economic conditions, the level of customer demand particularly for capital projects
in the markets we serve, changes in supplier sales strategies or
financial viability, risks associated with the sale of nonconforming products and services, political, economic or
currency risks related to foreign operations, inventory obsolescence, copper price
fluctuations, customer viability, risks associated with accounts receivable,
the impact of regulation and regulatory, investigative and legal proceedings and legal compliance risks
and risks associated with integration of acquired companies. These
uncertainties may cause our actual results to be materially different than
those expressed in any forward looking statements. We do not undertake to update any forward looking statements.
Please see the company’s Securities and Exchange Commission filings for more
information. Non-GAAP Statement
This report includes certain financial measures computed using non-Generally
Accepted Accounting Principles (“non-GAAP”) components as
defined by the Securities and Exchange Commission (“SEC”). Specifically, net sales, comparisons to the prior
corresponding period, both worldwide and in relevant geographic segments, are
discussed in this report both on a Generally Accepted Accounting Principle
(“GAAP”) basis and excluding acquisitions and foreign exchange and copper price effects (non-
GAAP). The Company believes that by reporting organic growth which excludes
the impact of acquisitions, foreign exchange and copper prices, both
management and investors are provided with meaningful supplemental information to understand and analyze
the Company’s underlying sales trends and other aspects of its financial
performance. The Company also presents certain profitability
and
cash
flow
information
in
this
report
excluding
special
items
which
have
been
identified
in
the
Company’s
earnings
releases as the Company believes that by reporting such information, both
management and investors are provided with meaningful supplemental
information to understand and analyze the Company’s underlying trends and other aspects of its financial
performance.
Non-GAAP financial measures provide insight into selected financial information
and should be evaluated in the context in which they are presented.
These non-GAAP financial measures have limitations as analytical tools, and should not be considered in
isolation from, or as a substitute for, financial information presented in
compliance with GAAP, and non-financial measures as reported by the
Company may not be comparable to similarly titled amounts reported by other companies. The non-GAAP financial
measures should be considered in conjunction with the consolidated financial
statements, including the related notes, and Management’s Discussion
and Analysis of Financial Condition and Results of Operations included the Company’s Annual Reports
on Form 10-K and Quarterly Reports on Form 10-Q as filed with the
SEC. Management does not use these non-GAAP financial measures for
any purpose other than the reasons stated above. |
 Investor Presentation First Quarter 2012
3
Company Overview
World-class global distributor with three distinct end markets:
–
Enterprise Cabling & Security Solutions: data, voice, video and security
network communication products
–
Electrical Wire & Cable: electrical and electronic wire & cable
–
OEM
Supply:
fasteners
and
“C”
Class
components
Anixter adds value to the distribution process by providing customers access
to innovative inventory management programs, over 450,000 products and
more than $1 billion in inventory
Global industrial distributor whose success is built on specialization
–
Products, systems, process and solutions expertise
–
Customized supply chain services
–
Global implementation with local service
Anixter Pulls Together its Robust Capabilities in a Coordinated
Manner that Allows for Specialization and Scalability |
 Investor Presentation First Quarter 2012
4
Customer Value Proposition
Global Operational Consistency
–
Same Systems, Process and Services Provided Globally but with Local
Personnel, Language and Currency
Global Infrastructure
–
Ship orders from inventory stock for delivery within 24-48 hours to all major
global markets
Supply
Chain
Optimization
to
Reduce
Customers’
Overall
Cost
–
Pre-Installation / Production Product Preparation
–
Feed the Job / Factory Just-in-time
–
Industry Leading Customized Electronic Tools Sets
Technical Expertise
–
Infrastructure / Product Design Support
–
Product Recommendation for Applications
–
Quality Testing and Inspection in Anixter Lab and Quality Centers
|
 Investor Presentation First Quarter 2012
5
End Market Common Characteristics
Small percentage of customer total spend
Large volume of discrete part numbers
Large number of manufacturers across customer bill of material
Customer process cost may exceed values of materials
Products have a “technology”
component that may not be fully
understood by the customer
Total Customer Spending
Large Number of Application
Critical SKUs, but Only 5-10% of Customer Spending.
Significant Opportunity for Anixter to Add Value Based on Product
Knowledge, Application Knowledge and Supply Chain Services
|
 Investor Presentation First Quarter 2012
6
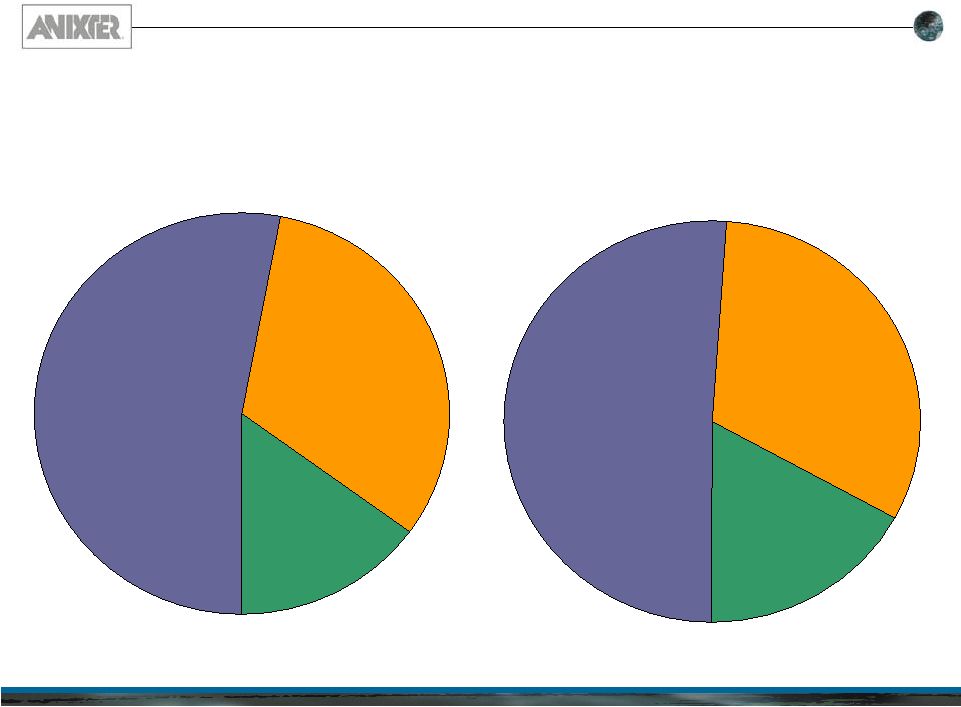
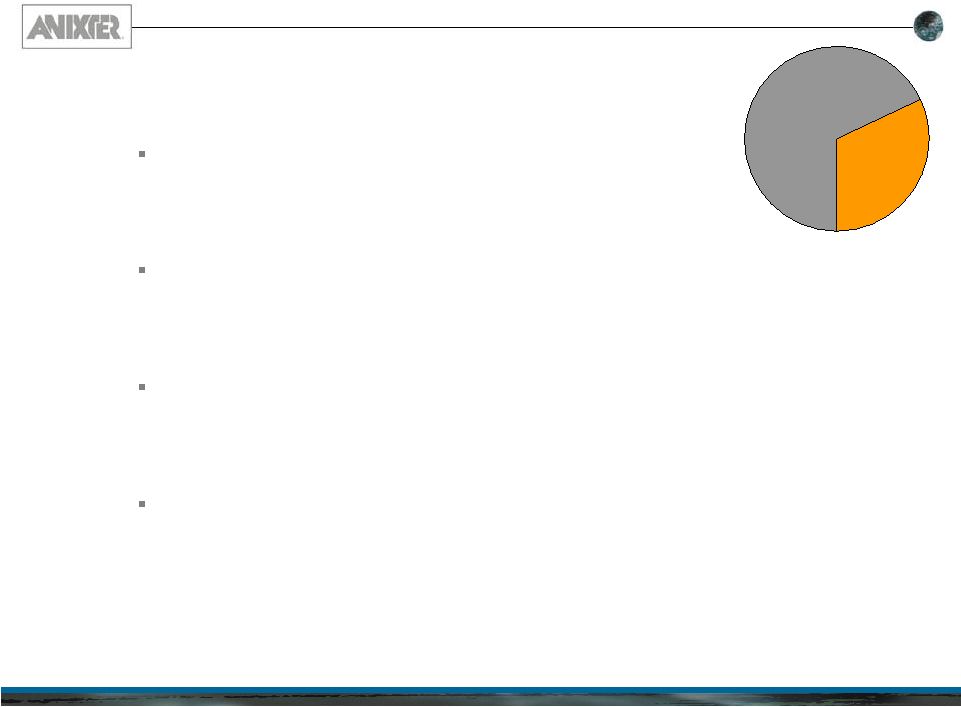
End-Market Focus
Focused Leadership in Diverse Markets
OEM Supply
17%
Electrical and Electronic
Wire & Cable
32%
Enterprise Cabling &
Security Solutions
51%
2012 Sales Mix -
Q1 YTD
OEM Supply
15%
Electrical and Electronic
Wire & Cable
32%
Enterprise Cabling &
Security Solutions
53%
2011 Sales Mix |
 Investor Presentation First Quarter 2012
7
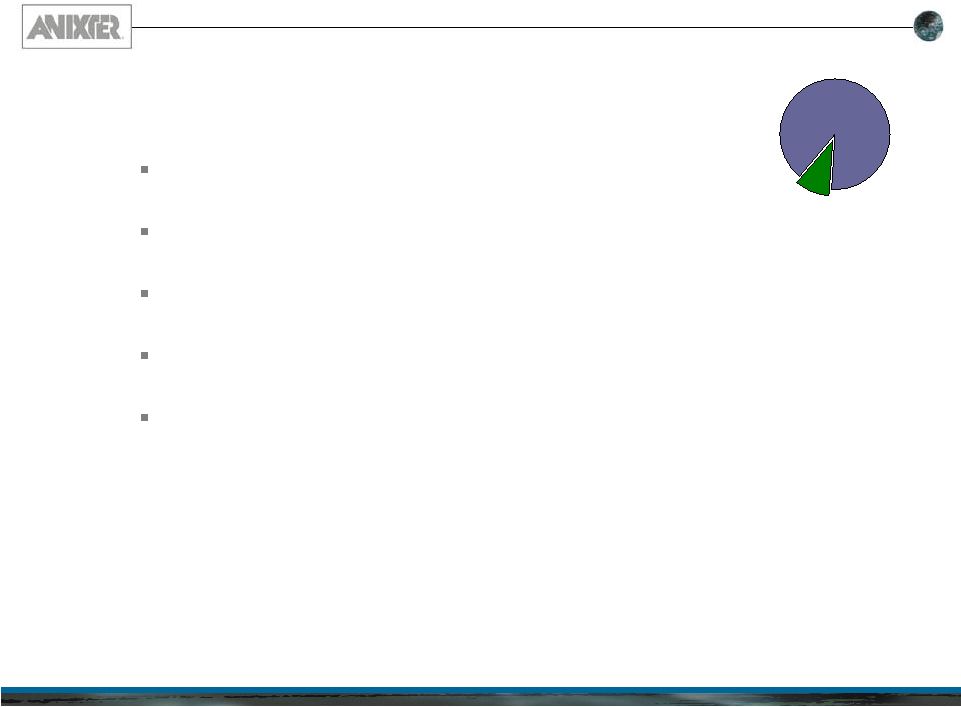
Enterprise Cabling and Security Solutions Overview
Products
Copper and fiber data cables, connectors, racks,
cabinets, patch panels, video surveillance and
access control devices, support and supply items
Technology
Industry leadership in development of product
standards; only distributor operated, UL
certified, testing lab; network design support
services
Supply Chain
Sourcing, logistics, inventory management,
product enhancement and packaging,
deployment in over 50 countries
Drivers
Expansion
of
bandwidth
–
applications
and
users, new facilities, support for existing
networks, enhanced security
51% |
 Investor Presentation First Quarter 2012
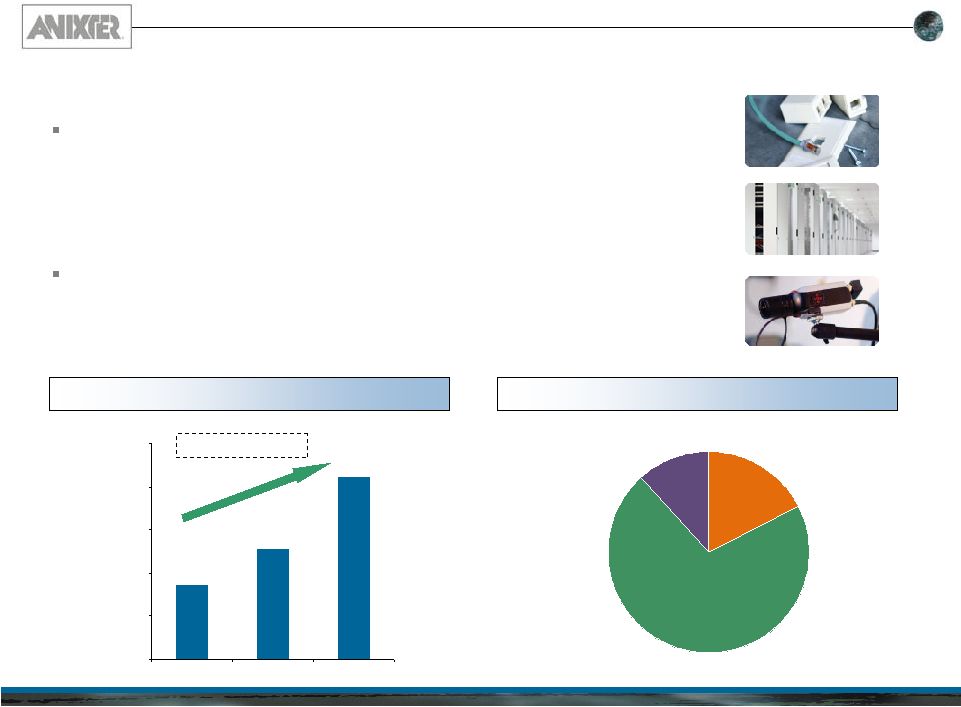
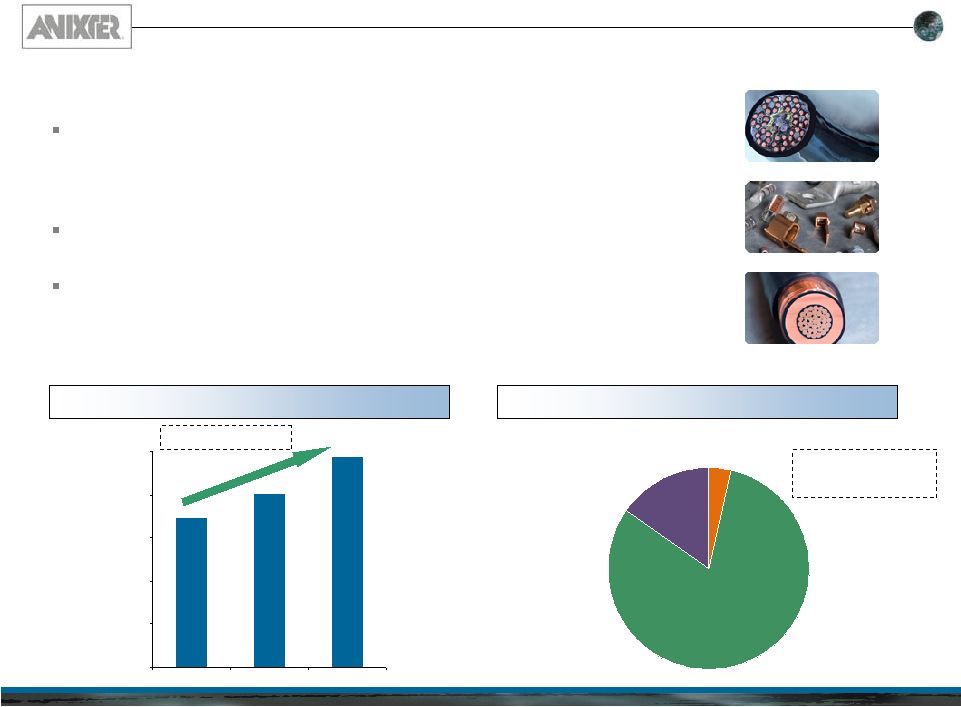
8
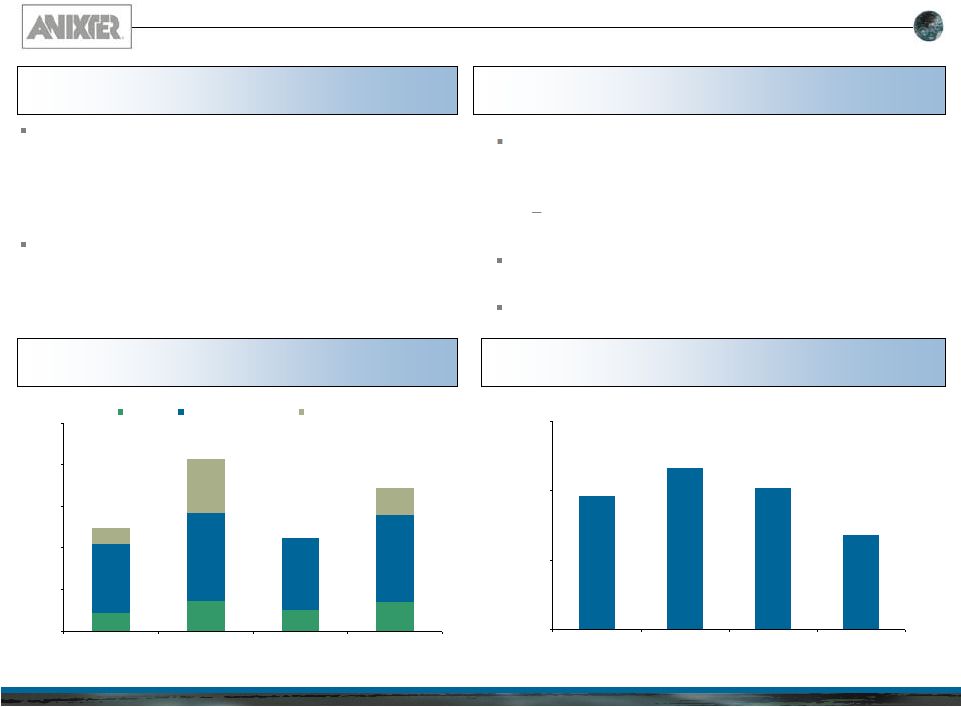
ECS experienced 11.4% growth in 2011 with varying levels of
activity across its geographic footprint (5.8% organic growth)
–
Growth was driven by strong activity in the Emerging Markets and
moderate growth in North America
–
Experienced a slight decline in Europe (1.4% y-o-y) due to the
challenging macroeconomic environment
Growth in the Security segment continues across all geographies
–
15% organic growth y-o-y (excludes benefit from the Clark acquisition)
–
Momentum driven by continued investment in security and the shift to
more sophisticated Internet Protocol-based systems
Emerging
Markets
North America
Europe
12%
17%
71%
ECS Revenue Growth
2011 ECS Revenue by Geography
$2,744
$2,913
$3,246
$2,400
$2,600
$2,800
$3,000
$3,200
$3,400
2009
2010
2011
($ in millions)
Capitalizing on End Market Growth Opportunities
Enterprise Cabling and Security Solutions (“ECS”)
8.8% CAGR since 2009 |
 Investor Presentation First Quarter 2012
9
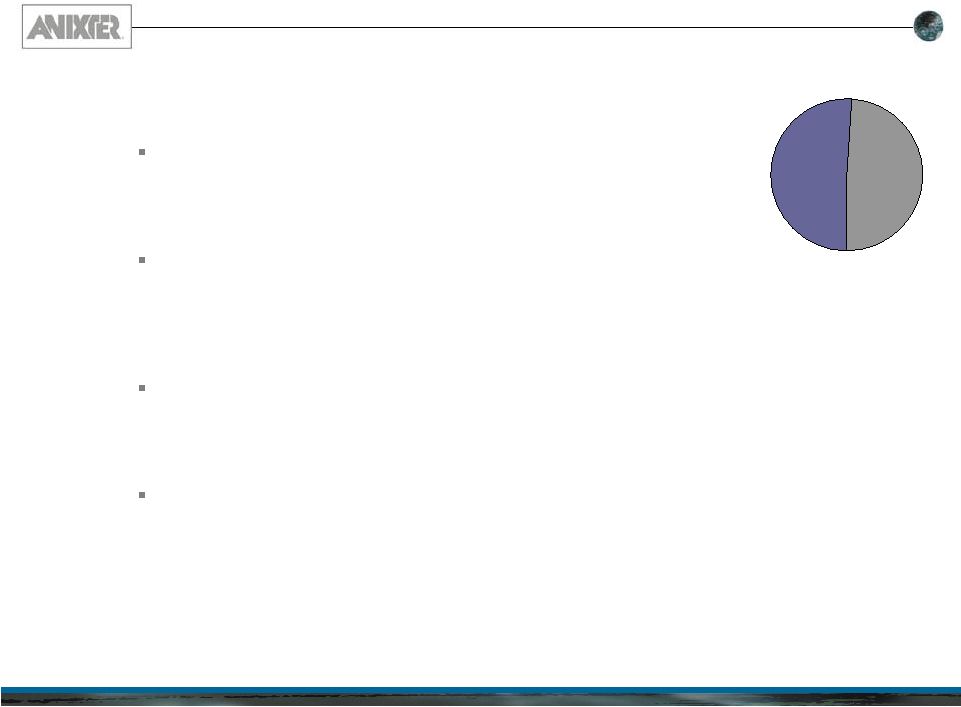
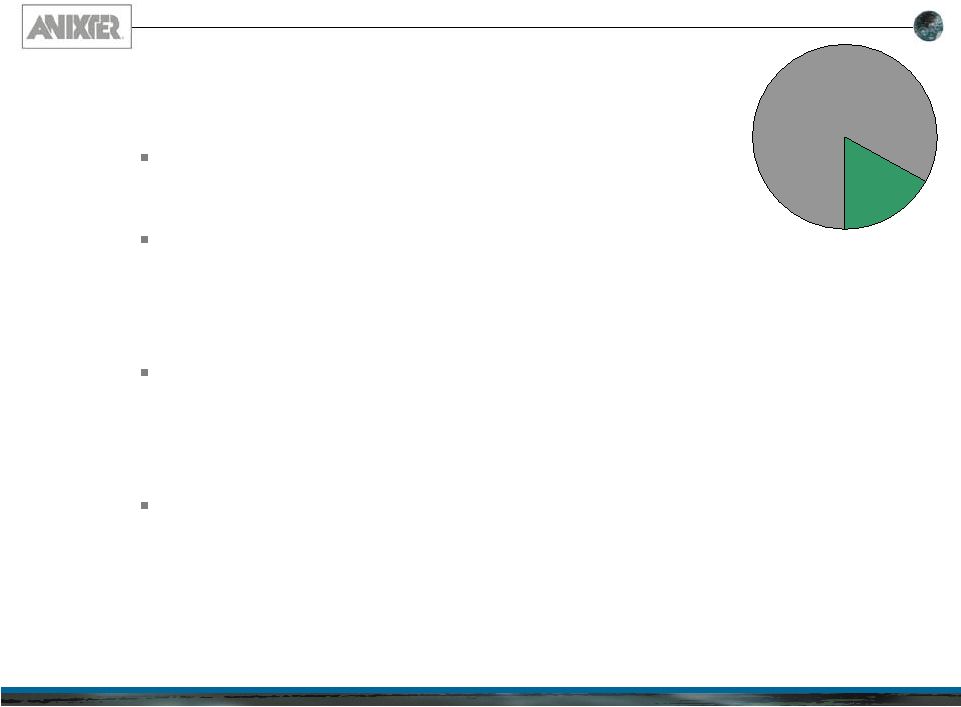
Wire & Cable Overview
Products
Industrial power, control and instrumentation
cables, connectors, support and supplies,
industrial automation
Technology
Product specification (conductor count and
jacketing) based on application knowledge and
installed environmental condition
Supply Chain
Sourcing, logistics, inventory management,
cutting, dying, striping, bundling, project
management in 12 countries
Drivers
New industrial construction, major equipment
and facility overhauls, day-to-day
maintenance, OEM production, and industrial
automation
32% |
 Investor Presentation First Quarter 2012
10
Capitalizing on End Market Growth Opportunities
Electrical and Electronic Wire & Cable (“W&C”)
W&C realized 21.7% growth in 2011 driven by growth across all
geographic regions
–
Growth in N.A. and Europe was complemented by significant
acceleration in the Emerging Markets (~82% organic growth)
Anixter captured market share gains across all geographies
resulting in organic growth of 13.1%
Demand has been driven by project activity in the Power
Generation, Industrial, Oil and Gas and Mining sectors
–
Global investment in Industrial Plants, Natural Resource Development
and Power Generation should drive continued sales momentum
W&C Revenue Growth
2011 W&C Revenue by Geography
Emerging
Markets
North America
Europe
15%
4%
81%
$1,386
$1,603
$1,950
$0
$400
$800
$1,200
$1,600
$2,000
2009
2010
2011
($ in millions)
18.6% CAGR since 2009
Emerging Markets Revenue
increased from 2% in 2010 |
 Investor Presentation First Quarter 2012
11
OEM Supply Overview
Products
Fasteners and “C”
class components
Technology
Product design support, quality and inspection
programs including full metallurgical testing
capabilities in North America, Europe and Asia
Supply Chain
Sourcing, just-in-time systems, quality and
inspection, inventory management, bin
replenishment in 21 countries
Drivers
Improved supply chain efficiency, global
expansion and outsourcing
17% |
 Investor Presentation First Quarter 2012
12
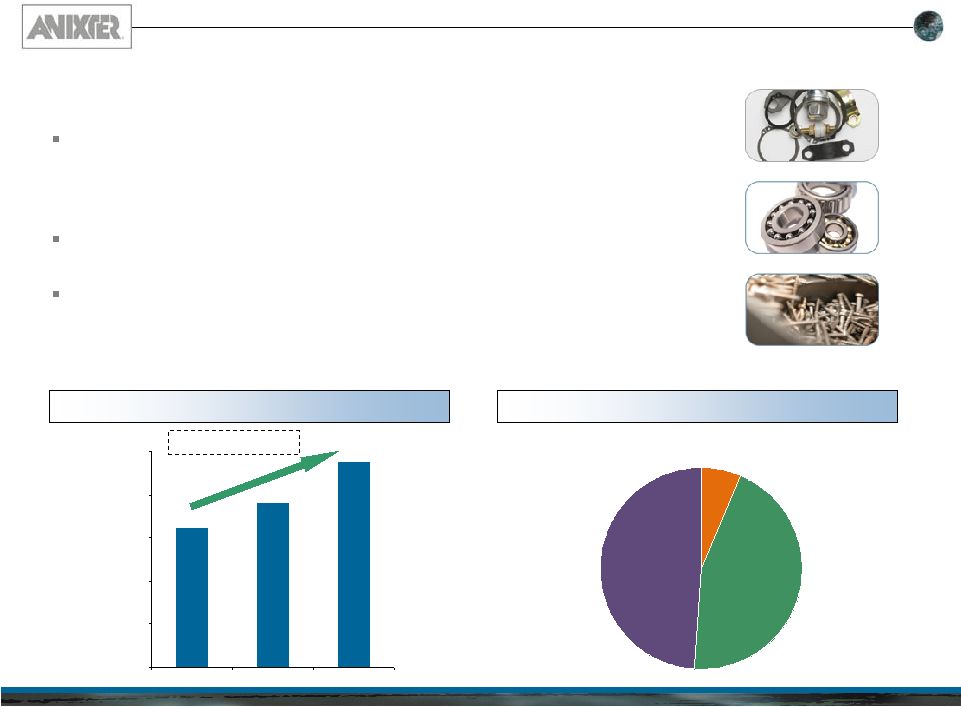
Capitalizing on End Market Growth Opportunities
OEM Supply
OEM Supply achieved 25.3% growth in 2011 driven by organic
growth of ~20%+ in each geographic region
–
43.2% organic growth in the Emerging Markets driven by multinational
customers’
increasing preference for a single global partner
Recovery in manufacturing is lifting production rates for Anixter’s
customers, yielding strong sales in the OEM Supply end market
Recent sales initiatives are continuing to drive new business wins
for part packages at both existing and new customers
–
Leading to a strong pipeline of opportunities in the Americas, Europe
and the rest of the world
OEM Revenue Growth
2011 OEM Revenue by Geography
Emerging
Markets
North America
Europe
49%
6%
45%
$650
$759
$952
$0
$200
$400
$600
$800
$1,000
2009
2010
2011
21.0% CAGR since 2009
($ in millions) |
 Investor Presentation First Quarter 2012
13
Strategic Geographic Expansion
2011 End Market Sales by Geography
3% increase in Emerging
Market sales mix (as a percent
of total sales) since 2007
Strong Growth Across All Geographies
In addition to continued introduction of new products and technologies, selectively
expanding its geographic presence is a focus for Anixter
–
Electrical Wire & Cable and OEM Supply offer strong opportunities to drive growth
by expanding into countries where Anixter’s offering is primarily limited
to cabling and security –
Expanding
geographic
penetration
beyond
principal
cities
creates
additional
opportunities
Anixter often tailors its offerings to local specifications, or to include locally
manufactured products, which helps increase product acceptance as it expands
its geographic footprint –
Opened Anixter Morocco SARL to capitalize on growth opportunities in the region
–
Established
a
new
JV
–
Anixter
Saudi
Arabia
Limited
to
expand
Middle
East
presence
–
Opened new sales branches in China, Brazil and Peru, and added new dedicated W&C
specialists Continuing investment in the emerging markets to expand presence across geographies
and end markets. Recent achievements include: FYE2011
FYE2010
% Growth
Net Sales
Net Sales
Y-o-Y
North America
$4,302.5
$3,701.2
16.2%
Drivers:
Europe
$1,150.0
$1,008.4
14.0%
Drivers:
Emerging Markets
$694.4
$564.9
22.9%
Drivers:
-
Strong market share growth in Fasteners with both existing and
new OEM Customers
-
W&C project growth across various industries
-
Strong project growth in W&C, principally in resource extraction
and energy
-
Organic growth rates in Security products in mid-teens
-
Strong market share growth in Fasteners with both existing and
new OEM Customers
-
83% growth in W&C as a result of 2010 investment in W&C sales
specialists
-
46% growth in Fasteners as a result of market share wins in China
and Mexico |
 Investor Presentation First Quarter 2012
14
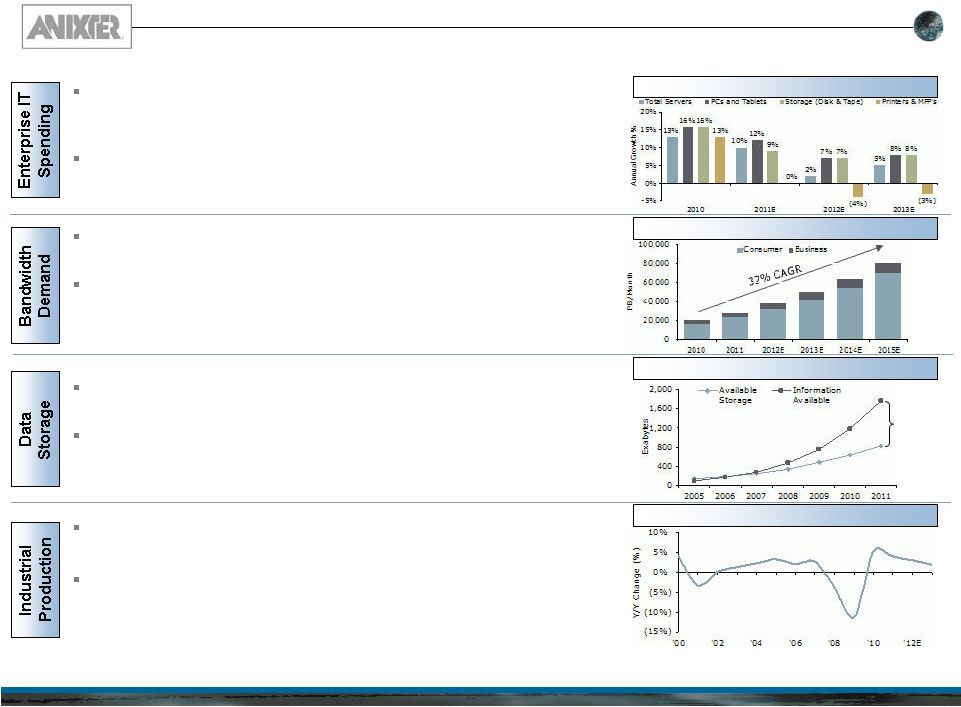
Positive Industry Fundamentals
Source:
Equity
research,
International
Data
Corporation
(IDC),
Federal
Reserve
Board,
U.S.
Federal
Reserve
-
Industrial
Production
&
Capacity
Utilization
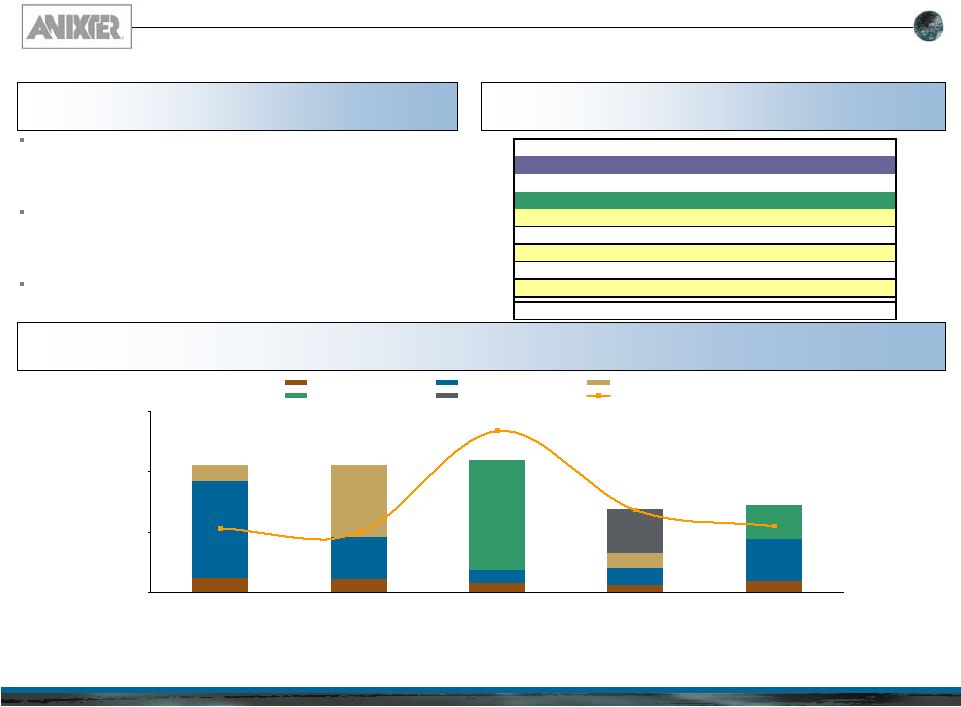
Data storage capacity has not kept pace with IP traffic growth
resulting in an increasing supply shortage
Companies now spend 15% of an IT budget on data storage, and
are adding, on average, nearly 50% more storage capacity
annually
Industrial Production has rebounded since the 2008-2009
contraction
Industrial Production growth in February increased 4.0% year over
year, suggesting modest but steady U.S. industrial production
gains over the past year
In 2012, U.S. broadband traffic is projected to increase by
approximately 50% on fixed networks and 100% on mobile networks
Consumers
are
demanding
“always-on”
mobile
access
to
apps,
video,
and
bandwidth-intense
content
–
growing
use
of
media
rich
content continues to strain bandwidth capacity
Corporate profits and modernization of telecom / data center
infrastructure fueled growth in Enterprise IT Spending in 2010
and 2011
Analysts are predicting 6% annualized growth over the next five
years driven by burgeoning demand in Asia and emerging markets
Global IP Traffic
Projected Enterprise IT Spending
Digital Storage Shortage
Unsustainable
dynamic will
lead to server
growth
Industrial Production
This information has been obtained from third party sources. While we believe
these sources are reliable, we have not independently verified this information and we make no representation as to its accuracy. |
 Investor Presentation First Quarter 2012
15
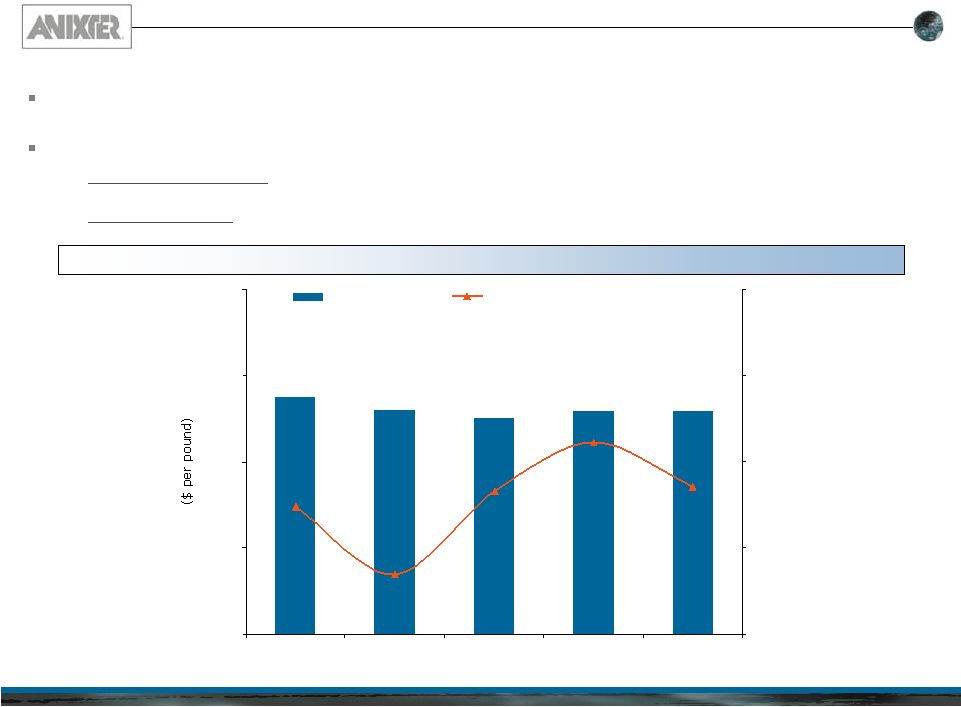
Stable Margins Despite Input Cost Volatility
Anixter has realized stable to modestly improved gross margins coming out of the
downturn despite volatility in copper prices
The Company has effectively managed margins through a mixture of:
23.7%
23.0%
22.5%
22.9%
22.9%
$3.0
$1.4
$3.3
$4.4
$3.4
$0.0
$2.0
$4.0
$6.0
$8.0
2007
2008
2009
2010
2011
10.0%
15.0%
20.0%
25.0%
30.0%
Gross Profit Margin
Copper Price ($ per pound)
Gross Profit Margins and Input Commodity Costs
This information has been obtained from third party sources. While we believe
these sources are reliable, we have not independently verified this information and we make no representation as to its accuracy.
Copper price source: www.metalprices.com
–
Market Diversification: favorable change in mix across geographies and end markets
resulting from Anixter’s focused expansion strategy
–
Pricing Discipline: continual progress in recovering cost increases through price increases
to customers |
 Investor Presentation First Quarter 2012
16
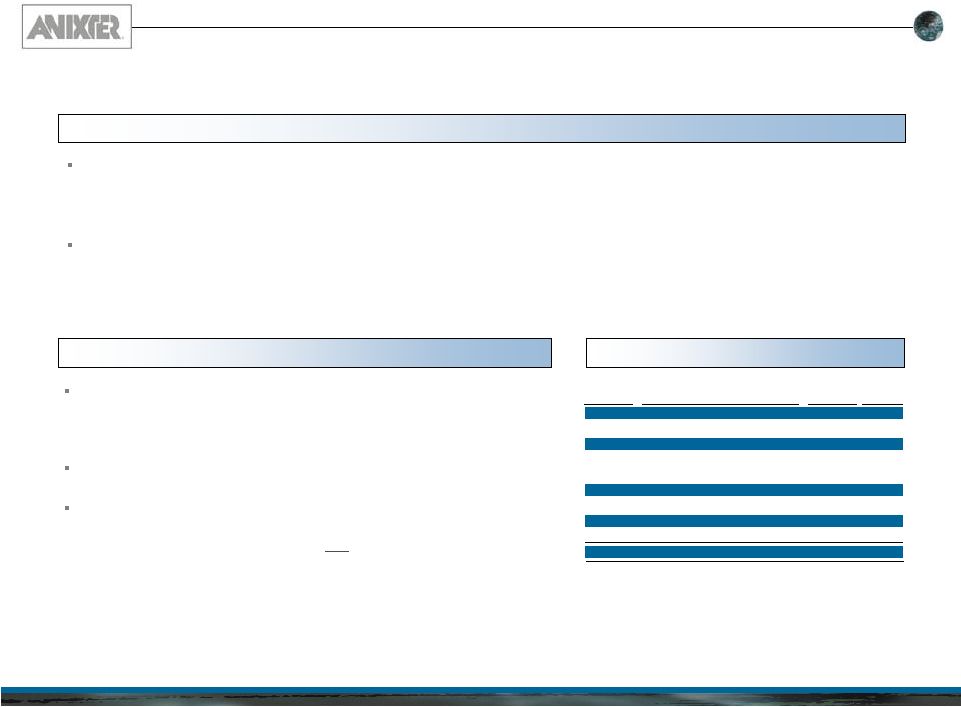
Long Term Growth Strategy
Anixter has driven consistent organic growth through a focus on:
–
Constant refresh and expansion of product offerings
–
Increased geographic penetration in countries with existing operations
–
Expansion of the Company’s geographic footprint, particularly in high growth
economies The Company has also leveraged its expertise in supply chain service
offerings to capture growth opportunities created by trends in outsourcing
and globalization Anixter utilizes a consistent approach in pursuing
acquisition activity –
Acquisitions are targeted that either complement capabilities in
their
existing
end
markets,
or
help
further
geographic
expansion
in
targeted regions
The
Company
has
traditionally
pursued
“tuck-in”
acquisitions
which
it
can fund with liquidity on hand
While Anixter continually evaluates opportunities, management is
selective in pursuing transactions
–
Must
have
attractive
valuations
and
make
strategic
sense
Acquisition Strategy
Organic Growth Strategy
Acquisition History
Price Paid
End
Date
Company Acquired
($ in MM)
Market
Dec-10
Clark Security Products
$36.4
ECS
Oct-08
World Class Wire & Cable Inc.
$61.4
W&C
Sep-08
Sofrasar SA
$20.7
OEM
Sep-08
Camille
Gergen
GmbH
&
Co,
KG;
Camille
Gergen
Verwaltungs
GmbH
$19.4
OEM
Aug-08
QSN Industries, Inc.
$76.1
OEM
Aug-08
Quality Screw de Mexico SA
$4.5
OEM
May-07
Eurofast SAS
$26.9
OEM
Apr-07
Total Supply Solutions Limited
$8.3
OEM
5 Year Total
$253.6 |
 Investor Presentation First Quarter 2012
17
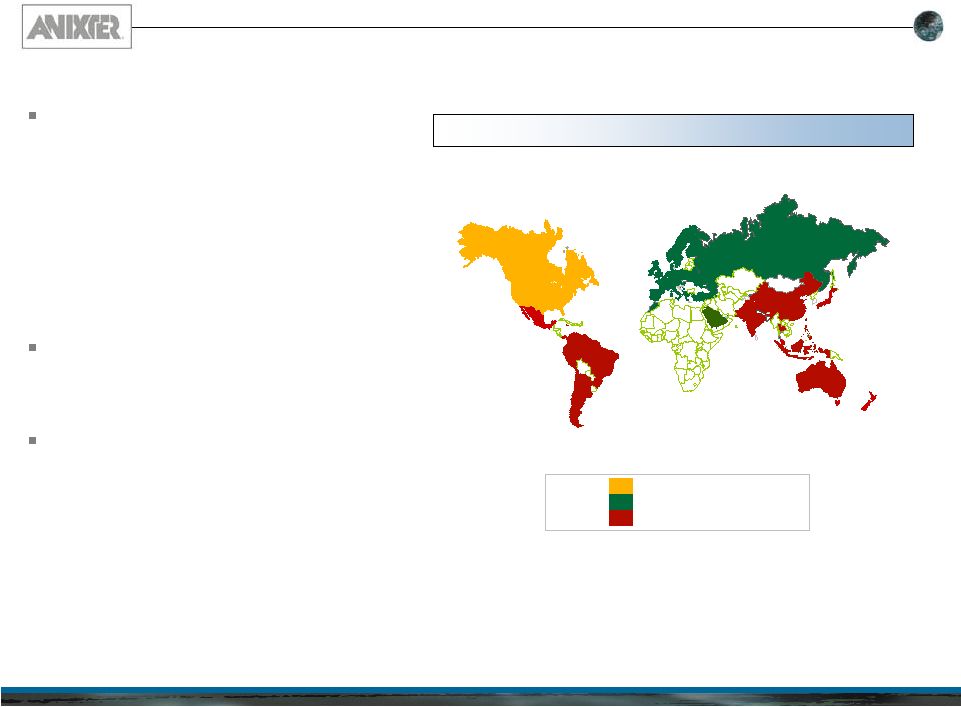
Global Distribution Infrastructure
Creates High Barrier to Entry
L
C
NORTH AMERICA
EUROPE
EMERGING MARKETS
One of a Kind Global Distribution Network
Significant Geographic Presence
Distribution capabilities built
on a best-in-class distribution
network with distinct
capabilities to serve customers
–
Approximately 225 strategically
located distribution facilities
worldwide with 7 million square
feet of warehouse space
Large technical sales force
–
Operates in 50 countries, over 35
currencies and over 30 languages
Significant scale in a highly
fragmented industry allows
Anixter to offer customers a
unique value proposition:
–
Global operational consistency
–
Supply chain optimization
–
Technical expertise |
 Investor Presentation First Quarter 2012
18
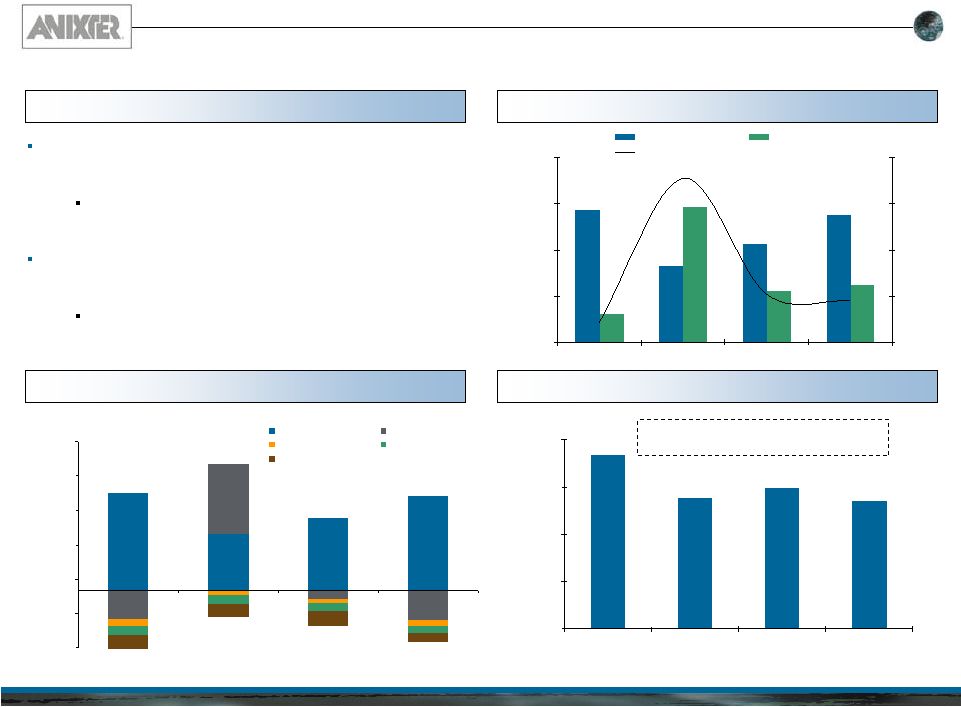
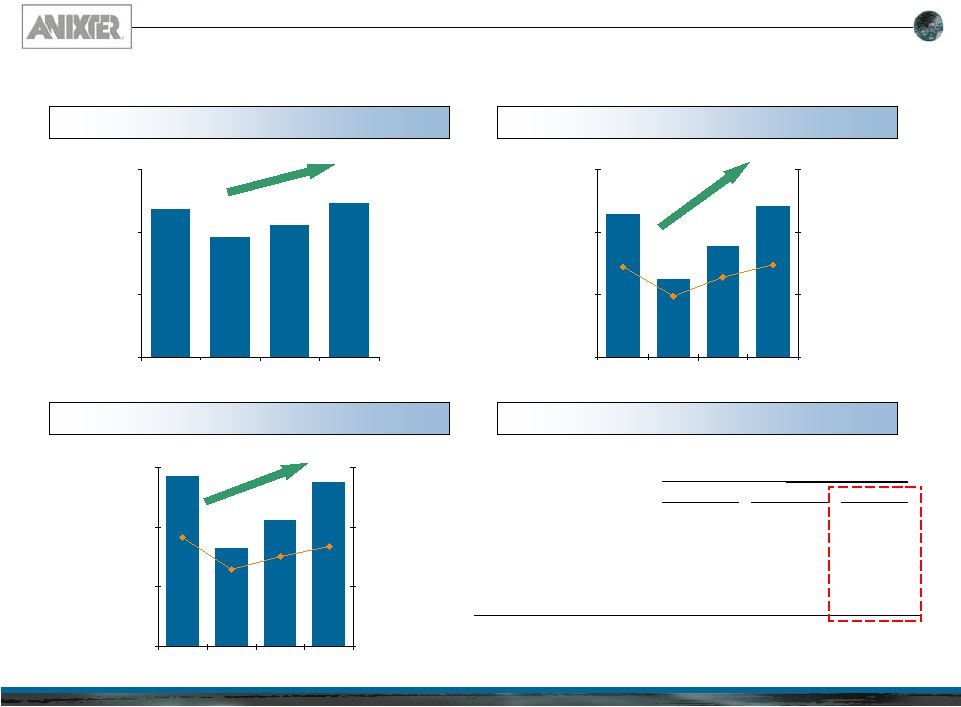
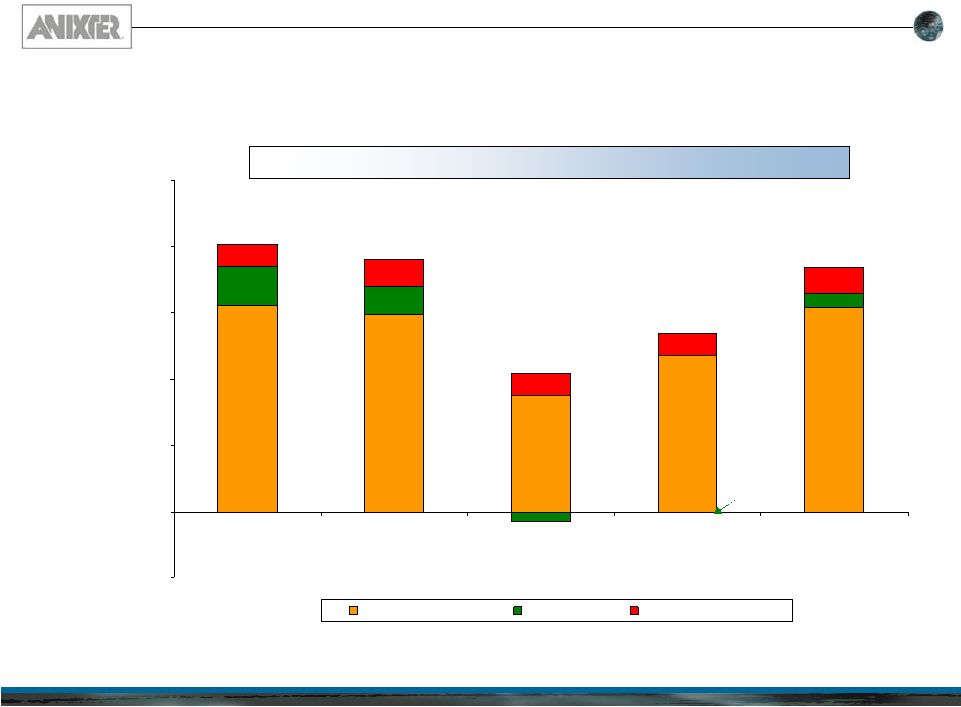
Demonstrated Ability to Manage Through Down Cycles
Countercyclical Cash Flow Profile…
…And Strong Free Cash Flow Conversion
Proactive Management of Cash Flow Drivers…
…and Conservative Management of Debt
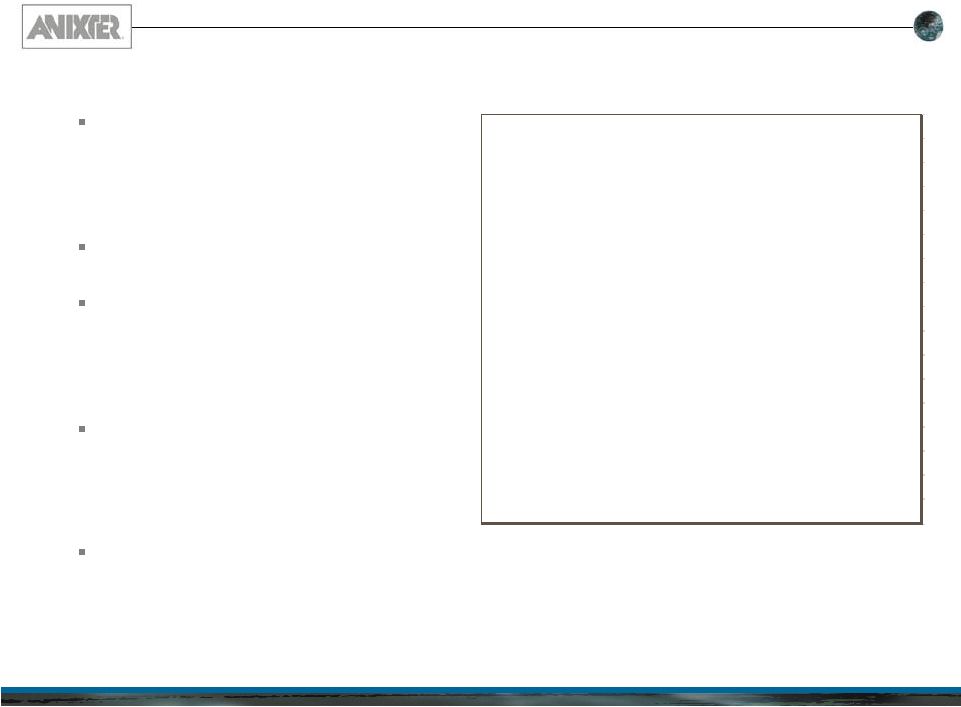
During periods of economic volatility, Anixter benefits from
increased cash flow due to reduced working capital
requirements
Management has demonstrated its ability to leverage
free cash flow to reduce debt and preserve operating
flexibility
The Company’s prudent cash management is bolstered by its
ability to monetize a significant portion of EBITDA into free
cash flow
From
FY08
–
FY11,
Anixter
averaged
a
cash
flow
conversion rate of approximately 74%
($ in millions)
($ in millions)
($ in millions)
$1,102
$810
$830
$892
$0
$300
$600
$900
$1,200
2008
2009
2010
2011
$413
$318
$429
$247
$91
$439
$166
$186
21%
178%
52%
45%
$0
$150
$300
$450
$600
2008
2009
2010
2011
0%
50%
100%
150%
200%
Adjusted EBITDA
Free Cash Flow
FCF Conversion
$429
$247
$318
$413
($123)
$307
($34)
($127)
($32)
($22)
($20)
($26)
($41)
($37)
($36)
($32)
($56)
($62)
($42)
$91
$439
$166
$186
($142)
($250)
($100)
$50
$200
$350
$500
$650
2008
2009
2010
2011
Adjusted EBITDA
Working Capital
Capital Expenditures
Cash Interest
Cash Taxes
Over $290 million of debt repaid from 2008 -
2011 |
 Investor Presentation First Quarter 2012
19
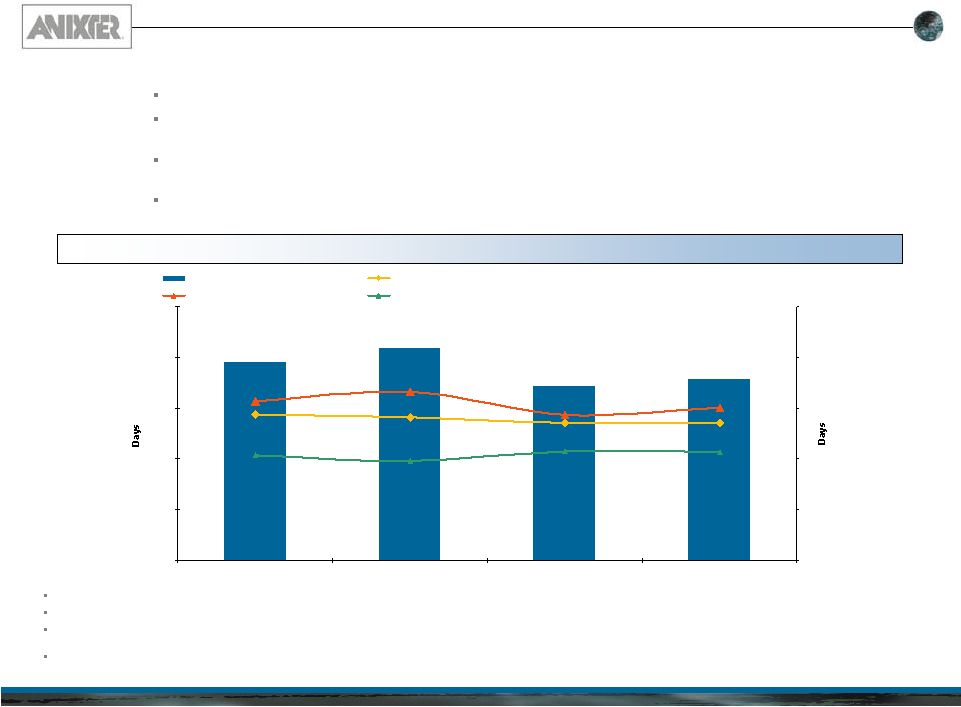
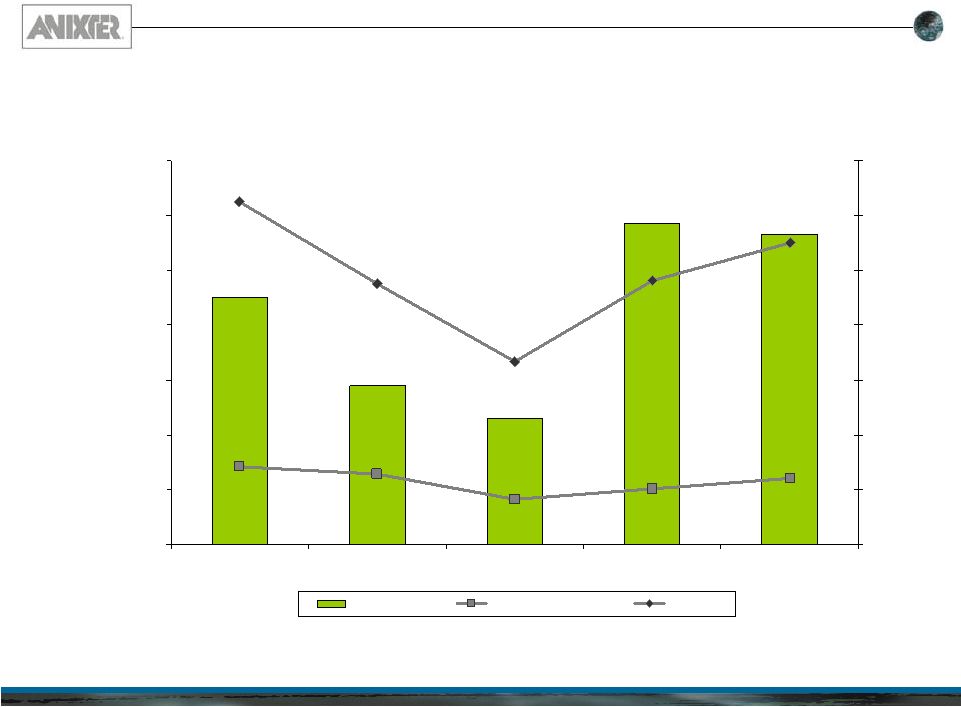
Efficient Working Capital Management
Days Sales Outstanding (“DSO”) is calculated by deriving the average of
the last 5 quarter end Accounts Receivable balances divided by Annual Sales multiplied by 360 days
Days Inventory On Hand (“DIO”) is calculated by deriving the average of
the last 5 quarter end Inventory balances divided by Annual Cost of Goods Sold multiplied by 360 days
Days
Payable
On
Hand
(“DPO”)
is
calculated
by
deriving
the
average
of
the
last
5
quarter
end
Accounts
Payable
balances
divided
by
Annual
Cost
of
Goods
Sold
multiplied
by
360
days
Cash Conversion Cycle is defined as DSO plus DIO minus DPO
Increased Efficiency in Working Capital Management Driving Measurable Results
0
25
50
75
100
125
2008
2009
2010
2011
0
25
50
75
100
125
Cash Conversion Cycle
Days Sales Outstanding
Days Inventory On Hand
Days Payable
Anixter’s focus on working capital management has yielded measurable
results The Company’s cash conversion cycle (“CCC”) decreased
significantly in 2010 and Anixter maintained a similar level in 2011 (16
day decrease in CCC from 2009 to 2011) The Company’s ability to
effectively manage working capital while maintaining its ability to quickly
respond
to
customer
orders
is
a
direct
result
of
its
operational
focus
The improved efficiency reduces the cash investment needed during growth periods
freeing up cash flow to be directed toward other strategic
initiatives |
 Investor Presentation First Quarter 2012
20
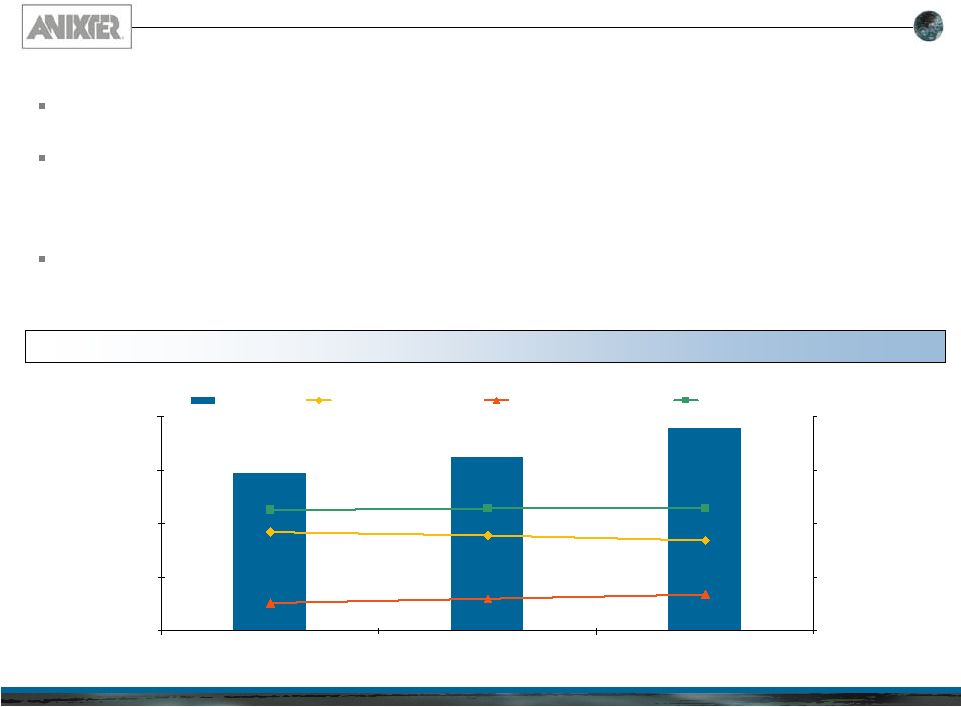
Strong Operating Leverage in Recovering Economy
Focus on Productivity-Driven Cost Management is Yielding Results
Anixter continues to capitalize on revenue growth opportunities across end markets
and increasing market
share
coming
out
of
the
downturn
–
top
line
growth
of
10.4%
in
2010
and
16.5%
in
2011
The Company’s ability to utilize existing capacity to meet increased volume
demand has allowed for growth with limited near-term expense
additions –
Drove incremental operating profit (change in operating profit divided by change
in sales) of over 11% for full year 2011
Leverage of the existing cost base, combined with active cost management, is
driving company-wide margin enhancement
–
Increase
in
EBITDA
margin
of
150
bps
from
2009
-
2011
($ in millions)
$4,779.6
$5,274.5
$6,146.9
18.5%
17.8%
16.9%
6.7%
6.0%
5.2%
22.9%
22.9%
22.5%
$0.0
$1,625.0
$3,250.0
$4,875.0
$6,500.0
2009
2010
2011
0.0%
10.0%
20.0%
30.0%
40.0%
Net Sales
Operating Exp. Margin
Adjusted EBITDA margin
Gross Profit Margin |
 Investor Presentation First Quarter 2012
21
Disciplined Capital Structure Management
Strong Financial Position
Strong Liquidity Profile Provides Cushion in
both Periods of Growth and Downturns…
…and Conservative Net Leverage Profile Allows
Management’s Focus to Remain on Operations
–
Renewal of the A/R Securitization
Anixter also used free cash flow to reduce debt by over
$290 million from 2008 to 2011
Today total leverage stands at 2.0x (1.7x net leverage)
with manageable near-term maturities
Anixter’s strong cash flow profile is complemented by
a solid liquidity profile
–
Allows Company to manage liabilities and
pursue strategic initiatives without putting
pressure on operating flexibility
Anixter has historically maintained a conservative
leverage profile with manageable debt maturities
–
Company maintained net leverage that peaked
at 2.9x throughout the downturn
$65
$112
$78
$106
$248
$313
$260
$313
$60
$195
$100
$0
$150
$300
$450
$600
$750
2008
2009
2010
2011
Cash
Revolver Availability
ARC Availability
$519
$338
$620
$373
($ in millions)
Note: Liquidity
defined
as
Cash
plus
availability
under
Credit
Lines,
including
ARC.
Net
Leverage
is
defined
as
Total
Debt
minus
Cash
divided
by
Adjusted
EBITDA.
The
calculation
of
Adjusted
EBITDA
is
provided
in the Appendix. Total Leverage is defined as Total Debt divided by Adjusted
EBITDA 2.4x
2.9x
2.6x
1.7x
0.0x
1.3x
2.5x
3.8x
2008
2009
2010
2011
Proven Commitment to Proactive Management of
Debt
Maturities
In 2009, Anixter accessed the markets via $200 million
Sr. Notes in order to provide “dry powder” to address
potential near-term maturities, including:
Potential “put” of the 3.25% Convertible Notes |
 Investor Presentation First Quarter 2012
22
Prudent Approach to Capital Allocation
Senior Management has a Record of
Strategically Balancing Capital Distributions
5-Year
Snapshot
Highlights
Discipline
in
Anixter’s
Capital Management
Capital Needs Supported by Cash Flow and Supplemented With Very Conservative Use of
Debt ($ in millions)
Anixter generates significant Cash Flow from Operations (CFO) -
covers all debt service and business investment (cap ex + acquisitions)
needs
–
Over last 5 years, 70%+ of CFO used for this purpose
In evaluating best use of additional capital, Anixter has selected to
periodically return a portion to shareholders
–
Use of special dividend / share repurchases allows Anixter to
make distributions opportunistically
Net leverage and liquidity subsequent to a distribution never moved
over 2.9x or under $338 million, respectively
$195
$125
$138
$441
$144
$0
$150
$300
$450
2007
2008
2009
2010
2011
CapEx
Share Repurchases
Acquisitions
Debt Reduction
Special Dividends
Operating Cash Flow
Amount: $108MM
Net Leverage: 1.7x
Liquidity: $519MM
Amount: $152MM
Net Leverage: 2.6x
Liquidity: $338MM
Amount: $35MM
Net Leverage: 2.9x
Liquidity: $620MM
Amount: $105MM
Net Leverage: 2.4x
Liquidity: $373MM
Amount: $242MM
Net Leverage: 2.0x
Liquidity: $405MM
Share repurchases
and special
dividends
Total Cash from Operations
1,043.7
$
Capital Outlay
$
% of CFO
Capital Expenditures
136.4
13.1%
Debt Reduction
354.1
33.9%
Share Repurchases
530.0
50.8%
Special Dividends
111.0
10.6%
Acquisitions
253.6
24.3%
Total Capital Overlay
1,385.1
$
132.7%
5-Year Summary (2007-2011)
Net Leverage is defined as Total Debt minus Cash divided by Adjusted EBITDA.
The calculation of Adjusted EBITDA is provided in the Appendix. |
 Investor Presentation First Quarter 2012
23
Experienced Management Team
Management Overview
Continuity within senior management was instrumental in Anixter’s
effective navigation through the recent economic cycle
–
CEO has 22 years of experience at the Company
–
Management team averages 25 years at the Company
–
Business Unit Presidents’
average 32 years of combined experience at
Anixter (including time with acquired company)
Name
Position
Years of Service
Robert J. Eck
President & Chief Executive Officer
22
Ted A. Dosch
Executive Vice President –
Finance & Chief Financial Officer
3
Bill Galvin
Executive Vice President, Enterprise Cabling & Security Solutions
24
Giulio Berardesca
Executive Vice President, Wire & Cable
38
Bill Standish
Executive Vice President, Operations
28
David Woodcock
President, Anixter Fasteners
34 |
 Investor Presentation First Quarter 2012
24
Solid
Financial
Performance
–
Q411
Snapshot
Solid quarter with all end markets
delivering year-over-year growth
–
Represents
the
Company’s
8
consecutive quarter of net sales
growth at the end of 2011
Net Sales growth of 8% driven by growth
across all end markets and geographies
Year-over-year operating profit was up
17% and operating margin expanded by
40 bps
–
Highlights the leverage in Anixter’s
operating structure
Strong working capital management
allowed the Company to generate
$112.9 million in cash flow from
operations (including discontinued
operations)
Diluted EPS from continuing operations
increased 26% to $1.49
Solid operating performance driven by strong cost
management and operating leverage
QTR 12/31/11
Sales
$1,499.0
Growth
8%
Operating Income
$91.6
Growth
17%
EBITDA
$102.6
Margin
7%
Diluted EPS
$1.49
Y-O-Y Increase
26%
Free Cash Flow
$134.6
Liquidity
$519.0
th
(in millions, except share amounts) |
 Investor Presentation First Quarter 2012
25
(in millions, except per share amounts)
Mar 30, 2012
Apr 1, 2011
% Chg
Sales
$1,522.7
$1,470.8
4%
Operating Income **
$86.7
$82.8
5%
Net Income **
$47.0
$44.2
6%
Diluted Earnings Per Share **
$1.37
$1.22
12%
Cash Flow Used In Operations
$(64.7)
$(5.5)
nm
Strong Operating Leverage in Recovering Economy
2012 Results –
First Quarter
First Quarter *
*
All amounts exclude discontinued operations with the exception of cash flow from
operations. **
First
quarter
of
2012
operating
income
of
$86.7
million
improved
by
12%
compared
to
$77.5
million
in
the
year
ago
quarter.
The
operating
profit
in
the
prior year quarter included a European restructuring charge of $5.3 million ($3.3
million net of tax, or $0.09 per diluted share). Excluding this charge,
operating income increased by 5%. In the first quarter of 2012, the Company
recorded a charge for interest and penalties associated with prior year tax
liabilities of $1.7 million ($1.1 million net of tax, or $0.03 per diluted share)
and a tax benefit of $9.7 million ($0.28 per diluted share) primarily related to
the reversal of deferred income tax valuation allowances in certain foreign
jurisdictions. After adjusting for these items, net income from continuing
operations in the first quarter of 2012 would have been $47.0 million, or $1.37 per diluted
share, which compares to adjusted net income from continuing operations of $44.2
million, or $1.22 per diluted share, in the prior year quarter (an increase
of 12% per diluted share). |
 Investor Presentation First Quarter 2012
26
(in millions, except per share amounts)
Dec. 30,
2011
Dec. 31,
2010
% Chg
Sales
$6,146.9
$5,274.5
17%
Operating Income **
$368.1
$267.2
38%
Net Income **
$193.2
$127.2
52%
Diluted Earnings Per Share **
$5.49
$3.58
53%
Cash Flow From Operations
$144.4
$195.2
(26%)
Strong Operating Leverage in Recovering Economy
2011 Results –
December YTD
December YTD *
* All amounts exclude discontinued operations with the exception of cash flow from operations.
** In 2011, operating income increased 36% to $362.8 million as compared to $267.2 million in
the prior year. In 2011, the Company recorded a charge of $5.3 million ($3.3 million net
of tax, or $0.09 per diluted share) related to facility consolidations and headcount reductions in Europe. Excluding the restructuring charge,
operating income increased 38%. In 2011, the Company also recorded net tax benefits of $10.8
million ($0.31 per diluted share). In 2010, the Company recorded a tax benefit of $1.3
million ($0.03 per diluted share) related to the reversal of prior year foreign taxes, recognized a foreign exchange gain of $2.1 million ($0.8
million net of tax, or $0.02 per diluted share) associated with its Venezuela operations and
recognized a loss of $31.9 million ($19.8 million net of tax, or $0.55 per diluted share)
associated with the early retirement of debt. For the year ended December 30, 2011, the Company reported net income from continuing operations of
$200.7 million, or $5.71 per diluted share, compared to $109.5 million, or $3.08 per diluted
share, in the year ago period, representing an increase of 83%. After adjusting for these items, net income increased to $193.2
million in 2011 from $127.2 million in 2010 while diluted earnings per share increased to $5.49 in
2011 from $3.58 in 2010 (an increase of 53% per diluted share). |
 Investor Presentation First Quarter 2012
27
Solid Financial Position
Strength to Continue to Capitalize on Recovery
Cash used in operations plus capital expenditures totaled $74.7
million for First Quarter 2012
Debt to Total Capital of 44.0% combined with cash balances of
$71.9 million and $301.0 million in available credit facilities
Good Borrowed Capital Credit Profile
–
5.5% weighted average cost borrowed capital
–
Scheduled maturities well spaced over coming years |
 Investor Presentation First Quarter 2012
28
Flexible / Scalable Business Model
Earnings and Cash Flow Relationship to Sales Changes
($300.00)
($200.00)
($100.00)
$0.00
$100.00
$200.00
$300.00
$400.00
$500.00
-30.00%
-20.00%
-10.00%
0.00%
10.00%
20.00%
30.00%
40.00%
50.00%
Cash Flow *
Operating Profit **
Sales Growth Over Prior Year
*
Net cash provided by (used in) operating activities (including ARC assets change)
less capital expenditures. **
Operating profit from continuing operations excluding special items outlined in the
Company’s Earnings Releases. (Dollars in Millions)
% Sales Growth over P.Y.
Fiscal Year
2001
2002
2003
2004
2005
2006
2007
2008
2009
2010
2011 |
 Investor Presentation First Quarter 2012
29
Key Investment Themes
Positioned to Optimize Benefits of Economic Recovery and
Long Term Growth
Broad End market / Geographic / Customer Diversity
Concentrated Operations and Management Infrastructure for
Operational Leverage
Strong Financial Position / Liquidity
Long History of Shareholder favorable Capital Structure Management
–
Share
Repurchases
(11%
of
outstanding
shares
repurchased
in
last
30
months)
–
Special Dividends (most recently $3.25 per share Q4 2010 and $4.50 per
share Q2 2012)
–
Responsible Levels of Leverage
Experienced Senior Management Team
–
CEO –
22 Years at Anixter
–
Senior Management Team Averages 25 Years at Anixter |
 Investor Presentation First Quarter 2012
30
Appendix |
 Investor Presentation First Quarter 2012
31
Historical Financial Results
Net Sales*
Operating Income & Margin*
EBITDA & Margin*
$5,891
$4,780
$5,275
$6,147
$0
$2,500
$5,000
$7,500
2008
2009
2010
2011
($ in millions)
$342
$185
$267
$363
5.9%
5.1%
3.9%
5.8%
$0
$150
$300
$450
2008
2009
2010
2011
0.0%
4.0%
8.0%
12.0%
Operating Leverage is Yielding Results*
Note: Excludes $100 million Goodwill Impairment in 2009
* Adjusted to exclude divested Aerospace business
($ in millions)
($ in millions)
($ in millions)
$429
$247
$318
$413
7.3%
5.2%
6.0%
6.7%
$0
$150
$300
$450
2008
2009
2010
2011
0.0%
4.0%
8.0%
12.0%
Fiscal Year End
12/30/2011
12/31/2010
% Change
Sales
$6,146.9
$5,274.5
17%
Operating Income
$362.8
$267.2
36%
Adj. EBITDA
$412.7
$317.7
30%
Net Income
1
$200.7
$109.5
83%
Diluted Earnings Per Share
1
$5.7
$3.1
85%
1
From Continuing Operations |
 Investor Presentation First Quarter 2012
32
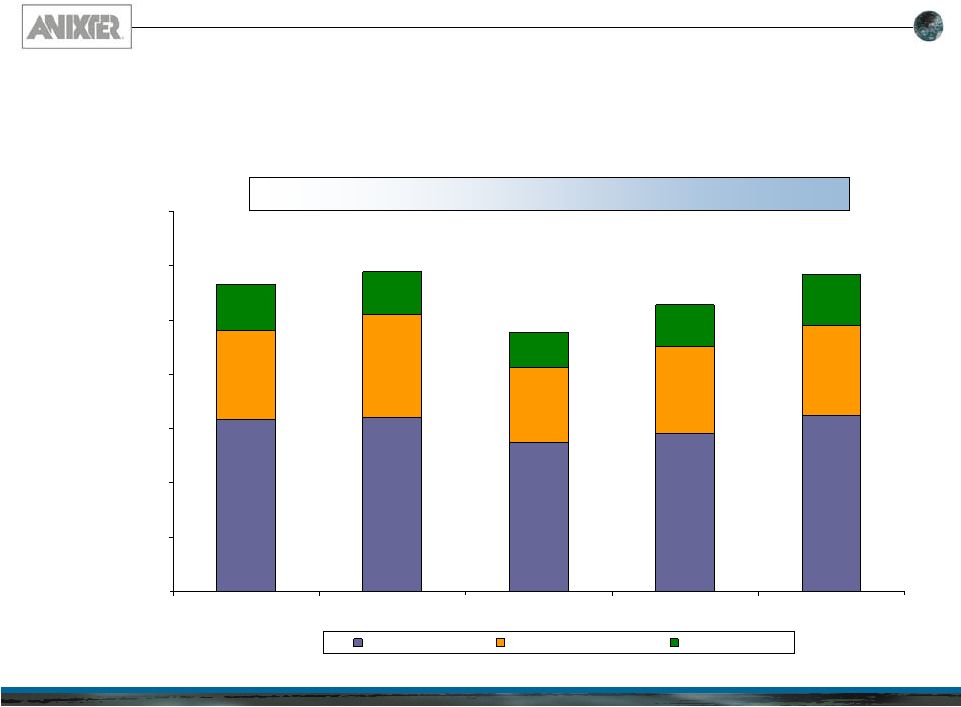
End Market Sales Mix
57.4%
54.4%
55.9%
55.2%
52.8%
29.0%
32.2%
29.0%
30.4%
31.7%
13.6%
13.4%
15.1%
14.4%
15.5%
0
1000
2000
3000
4000
5000
6000
7000
2007
2008
2009
2010
2011
(Dollars in Millions)
Enterprise
Electrical W&C
OEM Supply
$5,662
$5,891
$4,780
$5,274
$6,147
Fiscal Year |
 Investor Presentation First Quarter 2012
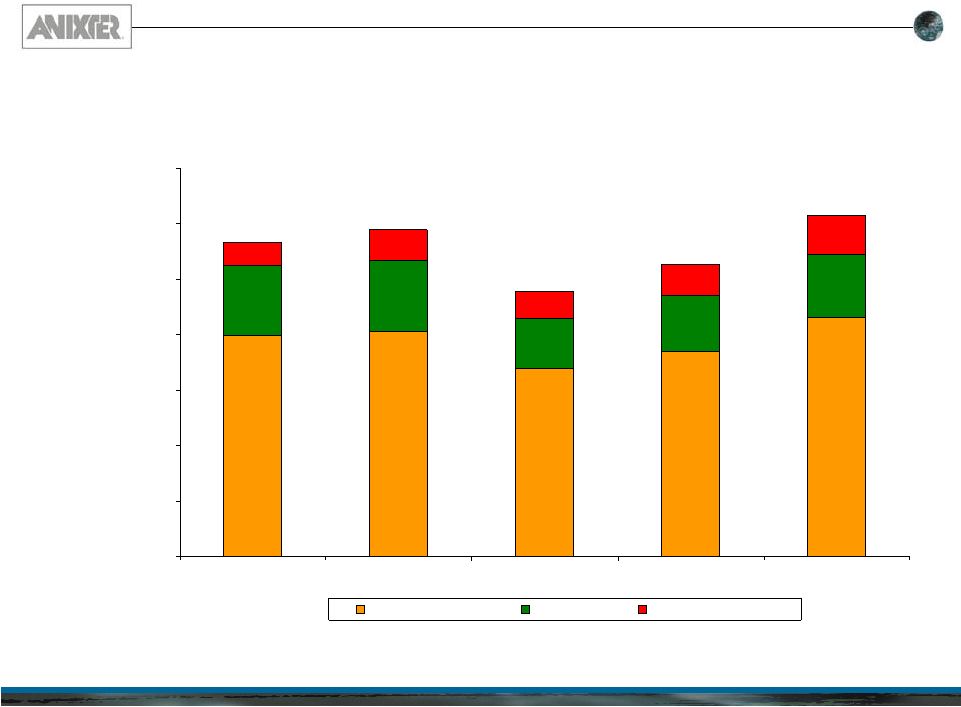
33
Sales Mix by Geography
71.1%
68.9%
70.4%
70.2%
70.0%
18.6%
21.8%
22.3%
19.1%
18.7%
10.3%
9.3%
7.3%
10.7%
11.3%
0
1,000
2,000
3,000
4,000
5,000
6,000
7,000
2007
2008
2009
2010
2011
(Dollars in Millions)
North America
Europe
Emerging Markets
$5,662
$5,891
$4,780
$5,274
$6,147 |
 Investor Presentation First Quarter 2012
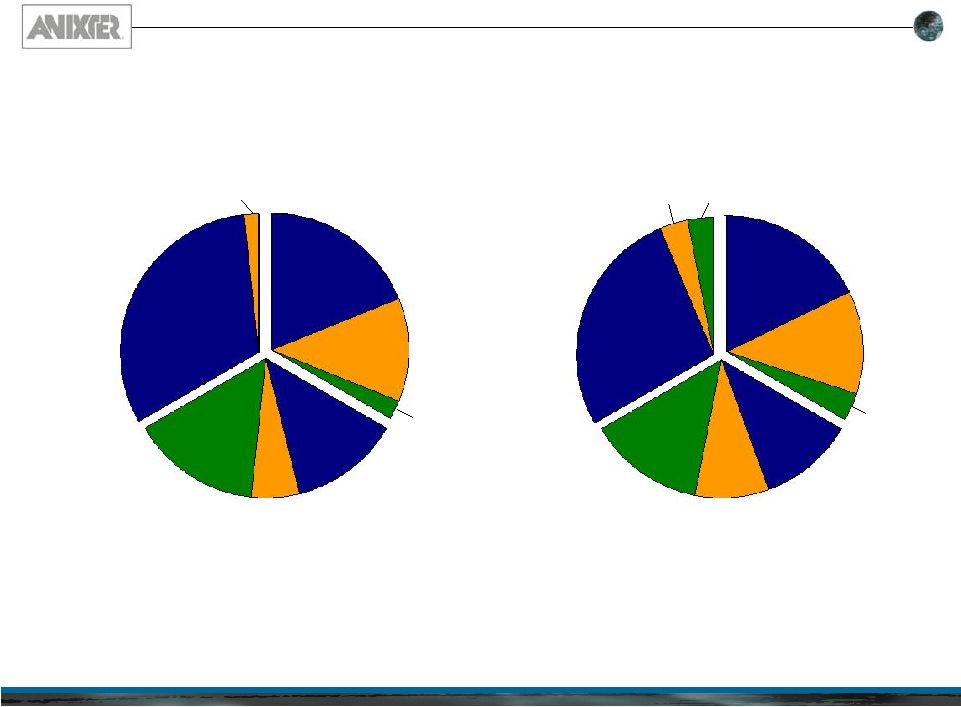
34
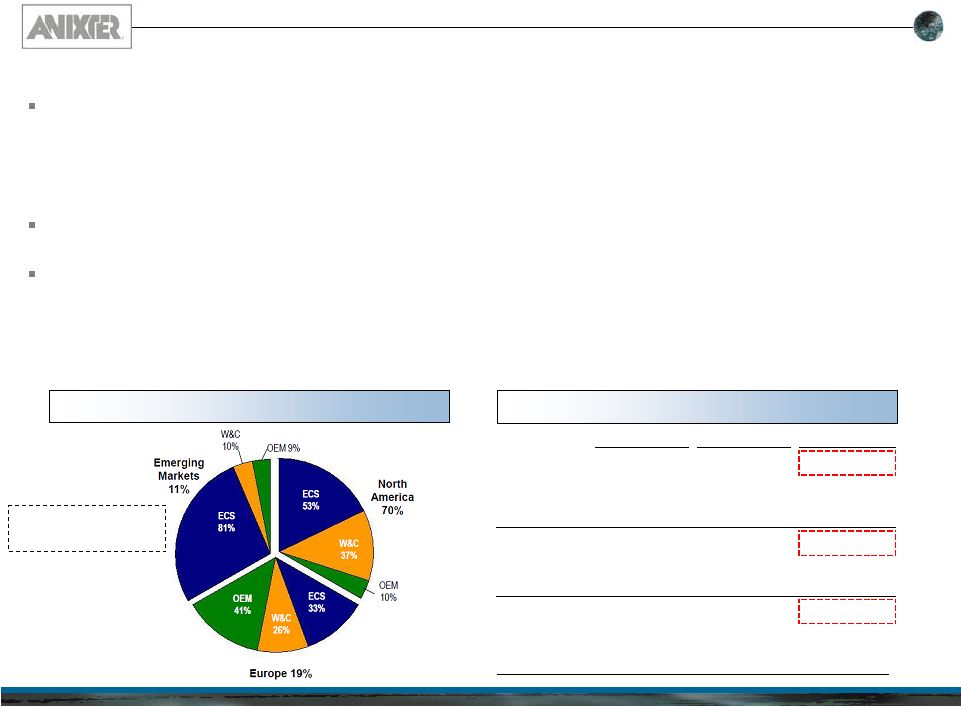
End Market Sales by Geographic Region
2007
ECS
95%
ECS
57%
ECS
38%
OEM
45%
W&C
5%
OEM
7%
North
America
70%
Europe 22%
Emerging
Markets
8%
2011
W&C
36%
ECS
33%
W&C
26%
W&C
37%
W&C
10%
OEM
10%
Europe 19%
Emerging
Markets
11%
OEM 9%
ECS
81%
ECS
53%
OEM
41%
North
America
70%
W&C
17% |
 Investor Presentation First Quarter 2012
35
2011 Segment and End Market Sales Growth
Actual and Organic
Twelve Months
Twelve Months
Ended
Ended
Twelve Months
(In millions)
December 2011
Acquisition
Foreign Exchange
Copper
December 2011
Ended
Actual
Organic
(as reported)
Impact
Impact
Impact
(as adjusted)
December 2010
Growth
Growth
North America
Enterprise Cabling and Security
2,301.6
$
(120.1)
$
(11.4)
$
-
$
2,170.1
$
2,060.7
$
11.7%
5.3%
Wire & Cable
1,579.6
-
(21.9)
(93.4)
1,464.3
1,288.6
22.6%
13.6%
OEM Supply
421.3
-
(0.2)
-
421.1
351.9
19.7%
19.7%
Total North America
4,302.5
$
(120.1)
$
(33.5)
$
(93.4)
$
4,055.5
$
3,701.2
$
16.2%
9.6%
Europe
Enterprise Cabling and Security
380.8
$
-
$
(18.6)
$
-
$
362.2
$
367.0
$
3.7%
-1.4%
Wire & Cable
299.7
-
(10.3)
(10.9)
278.5
275.6
8.8%
1.1%
OEM Supply
469.5
-
(19.1)
-
450.4
365.8
28.3%
23.1%
Total Europe
1,150.0
$
-
$
(48.0)
$
(10.9)
$
1,091.1
$
1,008.4
$
14.0%
8.2%
Emerging Markets
Enterprise Cabling and Security
563.5
$
-
$
(14.3)
$
-
$
549.2
$
484.9
$
16.2%
13.2%
Wire & Cable
70.2
-
(0.5)
-
69.7
38.3
83.1%
81.8%
OEM Supply
60.7
(1.1)
-
59.6
41.7
45.8%
43.2%
Total Emerging Markets
694.4
$
-
$
(15.9)
$
-
$
678.5
$
564.9
$
22.9%
20.1%
Anixter International
Enterprise Cabling and Security
3,245.9
$
(120.1)
$
(44.3)
$
-
$
3,081.5
$
2,912.6
$
11.4%
5.8%
Wire & Cable
1,949.5
-
(32.7)
(104.3)
1,812.5
1,602.5
21.7%
13.1%
OEM Supply
951.5
-
(20.4)
-
931.1
759.4
25.3%
22.6%
Total Anixter International
6,146.9
$
(120.1)
$
(97.4)
$
(104.3)
$
5,825.1
$
5,274.5
$
16.5%
10.4%
Twelve Months
Twelve Months
Ended
Ended
Twelve Months
December 2011
Acquisition
Foreign Exchange
Copper
December 2011
Ended
Actual
Organic
(as reported)
Impact
Impact
Impact
(as adjusted)
December 2010
Growth
Growth
Enterprise Cabling and Security
3,245.9
$
(120.1)
$
(44.3)
$
-
$
3,081.5
$
2,912.6
$
11.4%
5.8%
Wire & Cable
1,949.5
-
(32.7)
(104.3)
1,812.5
1,602.5
21.7%
13.1%
OEM Supply
951.5
-
(20.4)
-
931.1
759.4
25.3%
22.6%
Total Anixter International
6,146.9
$
(120.1)
$
(97.4)
$
(104.3)
$
5,825.1
$
5,274.5
$
16.5%
10.4%
Adjustments for:
Adjustments for:
YTD 2011 Sales Growth
End Market Sales Growth |
 Investor Presentation First Quarter 2012
36
Geographic Segment Operating Profit
83.6%
77.3%
78.4%
89.9%
88.0%
-0.3%
14.4%
10.8%
-7.3%
10.7%
8.3%
10.8%
17.4%
12.3%
-100
0
100
200
300
400
500
2007
2008*
2009 *
2010 *
2011*
(Dollars in Millions)
North America
Europe
Emerging Markets
$368
$403
$380
$267
$195
Fiscal Year
*
Adjusted for special items outlined in the Company’s Earnings Releases.
5.7% |
    Investor Presentation First Quarter 2012
37
Operating Profit Adjusted for Unusual Items
2001 (f)
2002
2003
2004 (e)
2005
2006 (d)
2007
2008 (c)
2009 (b)
2010
2011 (a)
Operating profit (1)
$102.0
$87.2
$88.1
$127.7
$175.4
$317.3
$402.7
$341.5
$84.8
$267.2
$362.8
Sales
$5,661.5
$5,891.0
$4,779.6
$5,274.5
$6,146.9
Operating profit margin
7.1%
5.8%
1.8%
5.1%
5.9%
Restructuring
31.7
-
-
5.2
-
-
-
8.1
5.7
-
5.3
Europe goodwill impairment
-
-
-
1.8
-
-
-
-
100.0
-
-
Receivable losses from customer bankruptcies
-
-
-
-
-
-
-
24.1
-
-
-
Inventory adjustment
-
-
-
(10.2)
-
-
-
2.0
4.2
-
-
Stock-based compensation modification
-
-
-
-
-
-
-
4.2
-
-
-
Sales tax related settlement
-
-
-
-
-
(2.2)
-
-
-
-
-
Amortization of Goodwill
9.0
-
-
-
-
-
-
-
-
-
-
Total adjustments
40.7
-
-
(3.2)
-
(2.2)
-
38.4
109.9
-
5.3
Operating profit, adjusted
$142.7
$87.2
$88.1
$124.5
$175.4
$315.1
$402.7
$379.9
$194.7
$267.2
$368.1
Sales
$5,661.5
$5,891.0
$4,779.6
$5,274.5
$6,146.9
Adjusted operating profit margin
7.1%
6.4%
4.1%
5.1%
6.0%
Fiscal Year
Adjustments to operating profit
(f) Adjusted EBITDA for fiscal 2001 excludes a restructuring charge of $31.7 million associated with
reducing the Company’s workforce, closing or consolidating certain facilities and exiting
the Korean market. Additionally, 2001 included goodwill amortization of $9.0 million which was no longer amortized beginning in 2002.
(c) Adjusted EBITDA for fiscal 2008 also excludes: $24.1 million related to receivable losses from
customer bankruptcies, $2.0 million related to the inventory lower of cost or market
adjustments and $8.1 million primarily related to personnel severance costs related to staffing
reductions and exit costs associated with leased facilities. (d) Adjusted EBITDA for fiscal
2006 excludes a $2.2 million favorable sales-tax related settlement in Australia. (e)
Adjusted EBITDA for fiscal 2004 excludes net favorable adjustments to cost of sales of $10.2 million arising primarily from the reduction in risks associated with the value of certain
inventories, an impairment charge of $1.8 million to write down to fair value the value assigned to a
tradename and unfavorable expenses of $5.2 million related to the relocation of the
Company’s largest distribution facility, severance costs associated with staffing reductions in
Europe and acquisition-related charges. (1) All periods restated for 2010 divestiture of
Aerospace (a) Adjusted EBITDA for fiscal 2011 also excludes $5.3 million related to facility
consolidations and headcount reductions in Europe. (b) Adjusted EBITDA for fiscal 2009
excludes: $100.0 million of non-cash goodwill impairment charge related to the European operations, $5.7 million of severance costs related to
staffing reductions in Europe and $4.2 million related to exchange rate-driven lower of cost or
market adjustment on inventory in Venezuela. |
 Investor Presentation First Quarter 2012
(1)
-
Calculated by taking FCF / EBITDA
EBITDA is defined as income
(loss) from continuing operations before interest, income taxes, depreciation and amortization. Adjusted EBITDA is defined as
EBITDA before foreign exchange and other non-operating expenses, loss on early retirement of debt
and stock-based compensation. (a) Adjusted EBITDA for fiscal 2011 also excludes $5.3
million related to facility consolidations and headcount reductions in Europe. (b) Adjusted EBITDA for fiscal 2009 excludes: $100.0 million of non-cash goodwill impairment
charge related to the European operations, $5.7 million of severance costs related to staffing
reductions in Europe and $4.2 million related to exchange rate-driven lower of cost or market adjustment on inventory in Venezuela.
(c) Adjusted EBITDA for fiscal 2008 also excludes: $24.1 million related to receivable losses from
customer bankruptcies, $2.0 million related to the inventory lower of cost or market
adjustments and $8.1 million primarily related to personnel severance costs related to staffing reductions and exit costs associated with leased
facilities.
38
EBITDA and Free Cash Flow
(In millions)
Adjusted EBITDA
FY 08 (c)
FY 09 (b)
FY 10
FY 11 (a)
11 Q4
Net income (loss) from continuing operations
$153.8
($41.4)
$109.5
$200.7
$49.8
Interest expense
60.5
66.1
53.6
50.1
12.0
Income taxes
100.7
39.8
70.7
102.8
27.4
Depreciation
24.9
24.1
22.5
22.1
5.5
Amortization of intangible assets
9.7
13.0
11.3
11.4
2.7
EBITDA
$349.6
$101.6
$267.6
$387.1
$97.4
Foreign exchange and other non-operating expense (income)
26.5
19.2
1.5
9.2
2.4
Loss on early retirement of debt
-
1.1
31.9
-
-
Stock-based compensation
18.2
15.2
16.7
11.1
2.8
Facility consolidation and headcount reductions
8.1
5.7
-
5.3
-
Europe goodwill impairment
-
100.0
-
-
-
Inventory lower of cost or market adjustment in Venezuela
-
4.2
-
-
-
Receivable losses from customer bankruptcies
24.1
-
-
-
-
Inventory lower of cost or market adjustment
2.0
-
-
-
-
Adjusted EBITDA
$428.5
$247.0
$317.7
$412.7
$102.6
Free Cash Flow
FY 08
FY 09
FY 10
FY 11
11 Q4
Adjusted EBITDA
428.5
247.0
317.7
412.7
102.6
Capital Expenditures
(32.4)
(21.9)
(19.6)
(26.4)
(6.6)
Cash-Taxes
(141.5)
(56.2)
(61.9)
(41.9)
(10.6)
Working Capital
(122.8)
306.9
(33.5)
(127.1)
52.0
Cash Interest
(40.7)
(37.2)
(36.4)
(31.6)
(2.8)
Free Cash Flow
$91.1
$438.6
$166.3
$185.7
$134.6
FCF Conversion (1)
21.3%
177.6%
52.3%
45.0%
32.8%
Average Rate (FY 2008 to FY 2011)
74.0%
Notes: |
 Investor Presentation First Quarter 2012
39
Return on Tangible Capital
4.53
4.57
3.86
3.98
4.30
7.1%
6.4%
4.1%
5.1%
6.0%
27.5%
24.1%
16.7%
23.8%
31.3%
3.4
3.6
3.8
4.0
4.2
4.4
4.6
4.8
2007
2008*
2009*
2010
2011*
Asset Turns
0%
5%
10%
15%
20%
25%
30%
35%
%
Asset Turns
Operating Profit %
ROTC %
*
Operating profit % adjusted for special items outlined in the Company’s
earnings releases (identified on p. 37). Asset Turns is defined as annual net sales divided by
year to date average tangible capital. Return on Tangible Capital (“ROTC”) is defined as year to date
operating profit excluding intangible amortization divided by year to date average tangible capital. |
 Investor Presentation First Quarter 2012
40
Debt-To-Total Capital Trend
$830
$942
$1,101
$892
$810
46.3%
50.7%
44.8%
46.9%
44.7%
0
200
400
600
800
1,000
1,200
2007
2008
2009
2010
2011
Total Debt $ millions
0%
10%
20%
30%
40%
50%
60%
70%
80%
% Debt / Total Capital
Total Debt
% Debt / Total Capital |