Attached files
| file | filename |
|---|---|
| 8-K - 8-K - Patriot Coal CORP | d350387d8k.htm |
 Annual Meeting
of Stockholders May 10, 2012
Exhibit 99.1 |
 1
Statement on Forward-Looking Information
Some of the following information contains forward-looking statements within the meaning
of Section 27A of the Securities Act of 1933 and Section 21E of the Securities Exchange
Act of 1934, as amended, and is intended to come within the safe-harbor protection
provided by those sections. Forward-Looking Statements
Certain
statements
in
this
presentation
are
forward-looking
as
defined
in
the
Private
Securities
Litigation
Reform
Act
of
1995.
These
statements
involve
certain
risks
and
uncertainties
that
may
be
beyond
our
control
and
may
cause
our
actual
future
results
to
differ
materially
from
expectations.
We
do
not
undertake
to
update
our
forward-looking
statements.
Factors
that
could
affect
our
results
include,
but
are
not
limited
to:
price
volatility
and
demand,
particularly
in
higher
margin
products;
geologic,
equipment
and
operational
risks
associated
with
mining;
changes
in
general
economic
conditions,
including
coal,
power
and
steel
market
conditions;
the
impact
of
the
restatement
for
the
years
ended
December
31,
2011
and
2010
and
the
related
material
weakness
associated
with
the
accounting
treatment
for
the
Apogee
and
Hobet
water
treatment
facilities;
coal
mining
laws
and
regulations;
the
availability
and
costs
of
competing
energy
resources;
legislative
and
regulatory
developments;
risks
associated
with
environmental
laws
and
compliance,
including
selenium-related
matters;
developments
in
greenhouse
gas
emission
regulation
and
treatment;
negotiation
of
labor
contracts,
labor
availability
and
relations;
the
outcome
of
pending
or
future
litigation;
changes
in
the
costs
to
provide
healthcare
to
eligible
active
employees
and
certain
retirees
under
postretirement
benefit
obligations;
increases
to
contribution
requirements
to
multi-employer
retiree
healthcare
and
pension
plans;
reductions
of
purchases
or
deferral
of
shipments
by
major
customers;
availability
and
costs
of
credit;
customer
performance
and
credit
risks;
inflationary
trends;
worldwide
economic
and
political
conditions;
downturns
in
consumer
and
company
spending;
supplier
and
contract
miner
performance
and
the
availability
and
cost
of
key
equipment
and
commodities;
availability
and
costs
of
transportation;
the
Company’s
ability
to
replace
coal
reserves;
the
outcome
of
commercial
negotiations
involving
sales
contracts
or
other
transactions;
our
ability
to
respond
to
changing
customer
preferences;
failure
to
comply
with
debt
covenants;
the
effects
of
mergers,
acquisitions
and
divestitures;
and
weather
patterns
affecting
energy
demand
or
disrupting
coal
supply.
The
Company
undertakes
no
obligation
(and
expressly
disclaims
any
such
obligation)
to
publicly
update
or
revise
any
forward-looking
statement,
whether
as
a
result
of
new
information,
future
events
or
otherwise.
For
additional
information
concerning
factors
that
could
cause
actual
results
to
materially
differ
from
those
projected
herein,
please
refer
to
the
Company’s
Form
10-K
and
Form
10-Q
reports. |
 2
Long-Term Growth in Global Coal Markets |
 3
Global Population Growth
The world’s urban population is expected to nearly double by 2050
29%
33%
36%
39%
43%
46%
50%
52%
54%
59%
64%
69%
0
1,000
2,000
3,000
4,000
5,000
6,000
7,000
8,000
9,000
10,000
1950
1960
1970
1980
1990
2000
2010E
2015F
2020F
2030F
2040F
2050F
Urban
Rural
Source: United Nations |
 Strong
Long-Term Global Seaborne Coal Demand Thermal
Metallurgical
Long-term sustainable seaborne demand, led by Asia
Source: McCloskey
4
+26% Increase
+68% Increase
0
100
200
300
400
500
2011
2020
0
200
400
600
800
1000
2011
2020 |
 5
Overview of Patriot |
 Patriot’s
Strengths 6
Focused on evolving growth markets
–
Metallurgical coal production
–
Increasing exports
–
Modular mine portfolio to adjust to demand
Leverage to the market
–
Met Build-Out program
–
Legacy thermal contract roll-off
Culture
–
Experienced management team
–
Comprehensive safety program & environmental stewardship
–
Disciplined approach, focused on planning and execution
Future growth
–
Organic –
Strong and accessible reserve base, particularly high-quality met
–
M&A –
Bolt-on and transformational
Product & transportation flexibility to serve long-standing customers
|
 7
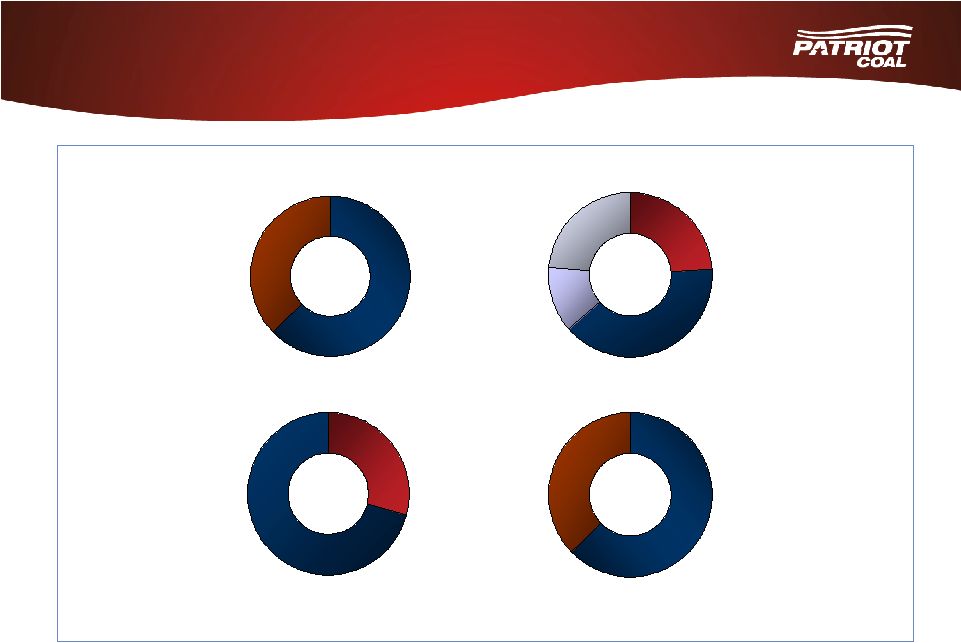
Product Diversification
Diverse locations, products & mining methods
Significant met & thermal coal exports
APP
ILB
CAPP
Met
CAPP
Thermal
NAPP
ILB
Surface
Reserves
1.9 Billion Tons
Export
Domestic
2011 Shipments
2011 Tons Sold
31.1 Million Tons
Mining Method
Underground |
 8
Safety is our Top Operational Priority
Record safety results in 2011
–
Incidence rate of 2.73 per
200,000 hours worked
–
National average of 3.61
Nationally recognized mine
rescue teams
–
Earned nine first-place
awards in the 2011 National
Mine Rescue Contest
sponsored by the U.S.
Department of Labor |
 Fortifying our
Team 9
Opened a second training
facility in West Virginia
–
Training new miners
–
Development of supervisors
and specialists
New labor agreements with the
United Mine Workers of
America
–
Cover about 44 percent of
our workforce
–
Generally extend through
2016 |
 $0
$50
$100
$150
$200
2009
2010
2011
$0
$100
$200
$300
$400
$500
12/31/09
12/31/10
12/31/11
10
Financial Metrics
EBITDA
(in Millions)
110% increase
60% increase
Steady improvement in EBITDA and liquidity
Available Liquidity
(in Millions) |
 11
How Patriot Will Participate in Global Markets |
 Met
Build-Out Program +35% increase
12
Multi-year plan to increase our
base of higher-margin
metallurgical coal products
Increase in metallurgical tons
sold, with met representing a
higher percentage of our total
sales
Modular mine portfolio allowing
the versatility to dial our met
production up or down in a timely
manner in response to market
conditions
0
2
4
6
8
2009
2010
2011
2012 |
 Increasing
Exports Expect double-digit exports in 2012
+195% increase
13
0
2
4
6
8
10
12
2009
2010
2011
2012
Met
Thermal |
 14
Current Global Coal Markets |
 Metallurgical
Current Market Conditions
Current market weakness leading to reduced U.S. coal production
15
Thermal
“Perfect Storm”
in the U.S.
Low natural gas prices
Mild winter
Increased regulation
Industrial production not
yet fully recovered
U.S. exports to Europe
expected to be sustainable
U.S. production being idled
Strengthening U.S. demand
Weaker international demand
European sovereign debt
issues
Chinese growth rate
declining slightly
U.S. exports may soften, but
expected to remain at
historically high levels
Australian production
increasing after 2011 flooding
U.S. production being idled
Demand
Supply |
 Domestic &
Global Steel Mill Utilization Both domestic & global steel mill utilization rates are
at 70-80% Global utilization has weakened in recent months
16
0
10
20
30
40
50
60
70
80
90
100
Global
U.S.
Updated:
04/28/12
80.8%
81.1% |
 17
How Patriot is Responding to Current Markets |
 Recent Actions
to Match Production to Demand Metallurgical
–
Reduced production at Rocklick and Wells complexes
–
Idled Gateway Eagle mine and one CM unit at Black Oak mine
–
Idled certain contractor mines
–
Gateway
Eagle
and
Black
Oak
on
“hot
idle”
to
quickly
bring
production
back
on-line
Thermal
–
Idled Big Mountain complex, which produced 1.8 million tons in 2011
–
Idled
Campbell’s
Creek
No.
6
and
Coalburg
mines
in
Q1,
which
together
produced 1.2 million tons in 2011
–
Idling Freedom mine in Q2, which produced 1.2 million tons in 2011
Cost reductions
Capital redeployment
18
Short-term inventory build and lower first half of 2012 shipments
|
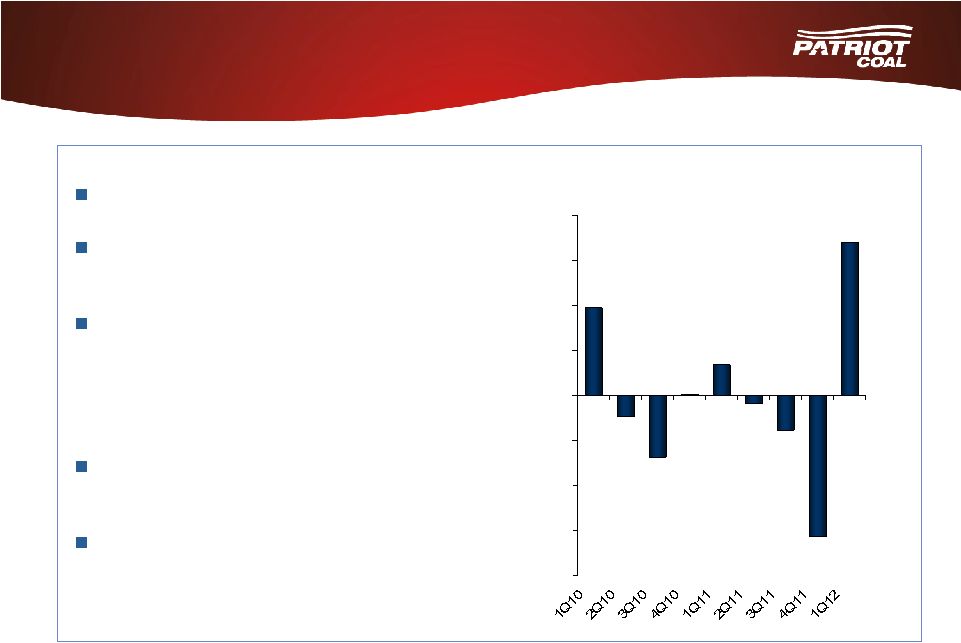 Highlights of
Q1 2012 19
Q1 2012 EBITDA of $36.2 million
Record Illinois Basin EBITDA per
ton of $6.80
Executed underwritten
commitment to provide financing
for convertible debt maturity and
replacement of existing credit
facility
Available liquidity of $338.3
million at March 31, 2012
Q1 2012 safety incidence rate of
2.86 per 200,000 hours worked,
compared with national average of
3.69
$(8)
$(6)
$(4)
$(2)
$-
$2
$4
$6
$8
Illinois Basin EBITDA/ton |
 20
New Patriot Website
www.patriotcoal.com |
 Annual Meeting
of Stockholders May 10, 2012
Contact:
Janine Orf
Vice President –
Investor Relations
314.275.3680
jorf@patriotcoal.com |
 22
Reconciliation of EBITDA to Net Income (Loss)
($ in Millions)
$(48.0)
(0.5)
12.8
(57.4)
(15.2)
(63.0)
121.5
(188.1)
$141.9
2010
2009
2011
1Q12
EBITDA
$110.7
$176.7
$36.2
Depreciation, Depletion & Amortization
(205.3)
(186.3)
(41.4)
Sales Contract Accretion
298.6
55.0
11.6
Asset Retirement Obligation Expense
(35.1)
(81.6)
(32.0)
Restructuring & Impairment Charge
(20.2)
(13.6)
(32.8)
Interest Expense & Other
(38.1)
(65.5)
(16.2)
Interest Income
16.6
0.2
0.1
Income Tax Provision
-
(0.4)
-
Net Income (Loss)
$127.2
$(115.5)
$(74.5) |