Attached files
| file | filename |
|---|---|
| 8-K - MEADOWBROOK INSURANCE GROUP, INC 8-K 5-10-2012 - MEADOWBROOK INSURANCE GROUP INC | form8k.htm |
| EX-99.1 - EXHIBIT 99.1 - MEADOWBROOK INSURANCE GROUP INC | ex99_1.htm |
EXHIBIT 99.2

Investor Supplement
First Quarter 2012

2
Forward-Looking Statements
Certain statements made by Meadowbrook Insurance Group, Inc. in this presentation may
constitute forward-looking statements including, but not limited to, those statements that
include the words "believes," "expects," "anticipates," "estimates," or similar expressions.
Please refer to the Company's most recent 10-K, 10-Q, and other Securities and Exchange
Commission filings for more information on risk factors. Actual results could differ materially.
These forward-looking statements involve risks and uncertainties including, but not limited to
the following: the frequency and severity of claims; uncertainties inherent in reserve estimates;
catastrophic events; a change in the demand for, pricing of, availability or collectability of
reinsurance; increased rate pressure on premiums; obtainment of certain rate increases in
current market conditions; investment rate of return; changes in and adherence to insurance
regulation; actions taken by regulators, rating agencies or lenders; obtainment of certain
processing efficiencies; changing rates of inflation; and general economic conditions.
Meadowbrook is not under any obligation to (and expressly disclaims any such obligation to)
update or alter its forward-looking statements whether as a result of new information, future
events or otherwise.
Notes on Non-GAAP Financial Measures
(1)Net operating income is a non-GAAP measure defined as net income excluding after-tax
realized gains and losses.
realized gains and losses.
(2)Accident year combined ratio is a non-GAAP measure that the impact of any adverse or
favorable development on prior year loss reserves.
favorable development on prior year loss reserves.
These non-GAAP metrics are common measurements for property and casualty insurance
companies. We believe this presentation enhances the understanding of our results by
highlighting the underlying profitability of our insurance business. Additionally, these measures
are key internal management performance standards.
companies. We believe this presentation enhances the understanding of our results by
highlighting the underlying profitability of our insurance business. Additionally, these measures
are key internal management performance standards.

3
Presentation Outline
Detail Financial Review
Return on Average Equity Analysis
Investment Portfolio Review
Workers’ Comp Accident Year Loss & ALAE
Analysis
Analysis

4
I. Detailed Financial Review

5
First Quarter 2012 vs. 2011
Underwriting and Investing
Activities
Activities
Top line earned premium growth driven by
rate increases, maturation of existing
programs, and new business initiatives
from recent years.
rate increases, maturation of existing
programs, and new business initiatives
from recent years.
Excluding the changes in net ultimate loss
estimates on prior year loss reserves, profit
from underwriting activities has increased
meaningfully year over year.
estimates on prior year loss reserves, profit
from underwriting activities has increased
meaningfully year over year.
Net Commissions & Fees
Increase in top line driven primarily by
commission revenues generated from a
Michigan agency that was acquired in the
fourth quarter of 2011.
commission revenues generated from a
Michigan agency that was acquired in the
fourth quarter of 2011.
General, selling & administrative expenses
were up slightly and partially offset the
increase in revenues..
were up slightly and partially offset the
increase in revenues..
Other Expenses
Other expenses were in line with prior year
quarter.
quarter.
Taxes
The effective federal tax rate on operating
income was 18.6% compared to 27.7% in
the prior year first quarter. The lower tax
rate primarily reflects tax exempt interest
accounting for a larger portion of pre-tax
income in 2012.
income was 18.6% compared to 27.7% in
the prior year first quarter. The lower tax
rate primarily reflects tax exempt interest
accounting for a larger portion of pre-tax
income in 2012.

6
First Quarter 2012 vs. 2011 Combined Ratio Analysis
Loss and LAE Ratio
The 2012 results include 5.3 points due to an increase in
net ultimate loss estimates on 2011 and prior accident
years. By contrast, the 2011 results include 1.9 points
due to a decrease in net ultimate loss estimates on 2010
and prior accident years.
net ultimate loss estimates on 2011 and prior accident
years. By contrast, the 2011 results include 1.9 points
due to a decrease in net ultimate loss estimates on 2010
and prior accident years.
The 2012 accident year loss and LAE ratio was 63.5%,
compared to 65.6% for the first quarter of 2011.
compared to 65.6% for the first quarter of 2011.
Expense Ratio
The improvement in the expense ratio primarily reflects
a reduction in variable compensation and a shift in
business mix that resulted in a lower commission
expense as compared to the prior year quarter.
a reduction in variable compensation and a shift in
business mix that resulted in a lower commission
expense as compared to the prior year quarter.

7
II. Return on Average Equity Analysis
8
ROAE (Net Operating Income) Components
2011 Including and Excluding Storm Losses
2011 Including and Excluding Storm Losses

9
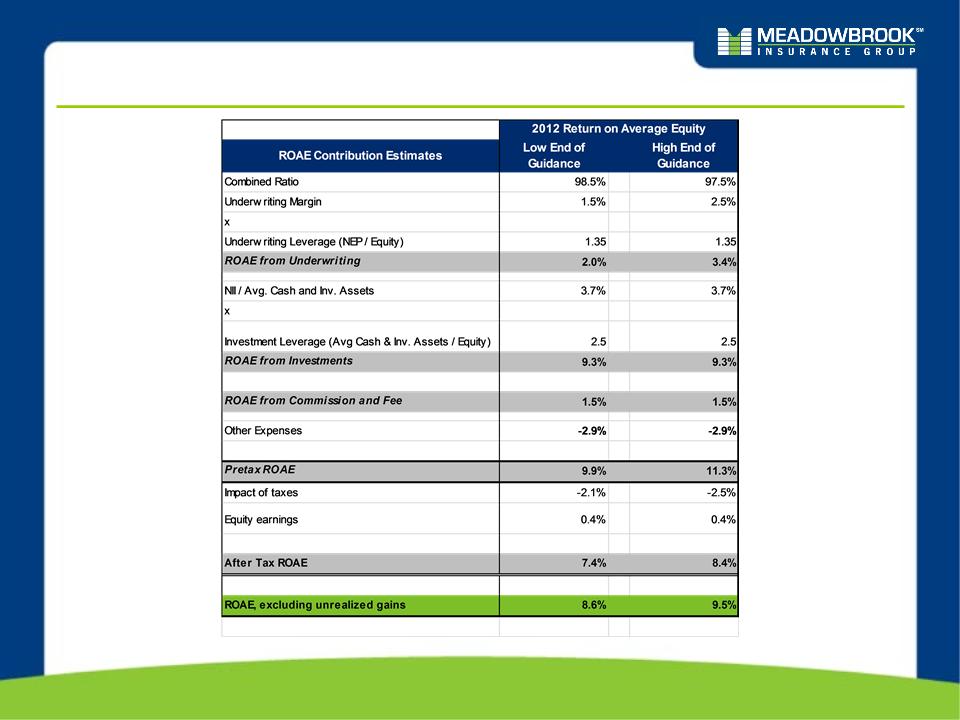
ROAE & Combined Ratio Illustration
We strive to deliver predictable earnings across the market cycle with a return on average
equity target of 10% - 17%; we view this objective relative to risk free and reinvestment
rates.
equity target of 10% - 17%; we view this objective relative to risk free and reinvestment
rates.
2012 Guided Range - Our 2012 guided range translates into an ROAE range of 7.4% to 8.4%.

10
III. Investment Portfolio Review

11
Investment Portfolio Review
We maintain a high-quality, low-risk investment portfolio.
Portfolio Allocation and Quality
NOTE: Data above as of March 31, 2012
Low equity risk exposure
• 98% fixed income and
cash
cash
• 2% equity
High credit quality
• 99% of bonds are
investment grade
investment grade
• Average S&P rating of
AA/Moody’s of Aa3
AA/Moody’s of Aa3
Duration
• Fixed income effective
duration is 4.7
duration is 4.7
• Duration on Reserves
is approximately 3.8
is approximately 3.8
|
$’s in (000’s)
|
%
Allocation 03/31/2012 |
Fair Value
|
Gross
Unrealized Gain Position |
Avg.
Moody's |
Avg.
S&P |
|
Fixed Income
|
|
|
|
|
|
|
US Government and Agencies
|
2%
|
$ 23,116
|
$ 1,629
|
Aaa
|
AA+
|
|
Corporate
|
39%
|
$ 574,813
|
$ 41,679
|
A2
|
A
|
|
Mortgage and Asset Backed
|
14%
|
$ 211,756
|
$ 13,881
|
Aaa
|
AA+
|
|
Municipal
|
43%
|
$ 625,116
|
$ 46,100
|
Aa2
|
AA+
|
|
Preferred Stock Debt
|
0%
|
$ 2,355
|
$ 431
|
Ba2
|
BB
|
|
Total Fixed Income
|
98%
|
$1,437,157
|
$
103,721 |
|
|
|
Equities
|
|
|
|
|
|
|
Preferred Stock
|
1%
|
$ 12,423
|
$ 2,228
|
|
|
|
Mutual Funds
|
1%
|
$ 15,460
|
$ 697
|
|
|
|
Total Equities
|
2%
|
$ 27,883
|
$ 2,925
|
|
|

12
Government and Agency - March 31, 2012 Profile
Summary Profile
$23.1M market value; approximately 2% of
the managed portfolio
the managed portfolio
Rated Aaa by Moody’s and AA+ by S&P
March 31, 2012 Net unrealized gain was
$1.6 M
$1.6 M
Average investment yield: 3.0%
Government & Agency vs. Entire
Portfolio
Portfolio

13
Corporate Fixed Income - March 31, 2012 Profile
Summary Profile
$574.8M market value; 39% of the investment
portfolio
portfolio
March 31, 2012 Net unrealized gain was
$41.7M.
$41.7M.
Average investment yield: 4.8%
Quality Indicators
Corporate vs. Entire Portfolio
Corporate Profile
|
|
Corporates
|
|
Average Quality
|
A
|
|
Investment Grade
|
100%
|
|
|
|
|
A-/A3 or Better
|
75%
|
|
AII BBB and Baa
|
25%
|
|
Not Rated
|
0%
|
|
Non Investment Grade
|
0%
|
|
Consumer Non-Cyclical
|
18.4%
|
|
Banking
|
13.7%
|
|
Energy
|
10.8%
|
|
Basic Industry
|
10.2%
|
|
Electric
|
9.2%
|
|
|
7.3%
|
|
Capital Goods
|
6.1%
|
|
|
5.2%
|
|
Communications
|
4.8%
|
|
|
3.5%
|
|
All Other Sectors
|
10.8%
|

14
Municipal Bonds - March 31, 2012 Profile
Summary Profile
$625.0M market value; 43% of the
investment portfolio
investment portfolio
March 31, 2012 Net unrealized gain was
$46.1M
$46.1M
• Tax exempt unrealized gain $40.6M
• Taxable unrealized gain $ 5.5M
Average tax equivalent yield: 5.4%
Quality Indicators & Geographic
Distribution
Distribution
Municipals vs. Entire Portfolio
|
State
|
% of Municipal Allocation
|
|
Texas
|
8.1%
|
|
Washington
|
6.6%
|
|
New York
|
5.9%
|
|
Colorado
|
4.8%
|
|
Tennessee
|
4.1%
|
|
Arizona
|
3.5%
|
|
Nevada
|
3.3%
|
|
Virginia
|
3.1%
|
|
Oregon
|
3.0%
|
|
Missouri
|
2.9%
|
|
All other
|
54.7%
|

15
Structured Securities - March 31, 2012 Profile
Summary Profile
$211.8M market value; 14% of the managed
portfolio
portfolio
March 31, 2012 Net unrealized gain was $13.0M
• RMBS unrealized gain $10.0M
• CMBS unrealized loss $ 2.0M
• ABS unrealized loss $ 1.0M
Average investment yield: 5.0%
Quality Indicators
Structured vs. Entire Portfolio
Structured Profile

16
Equities - March 31, 2012 Profile
Summary Profile
$27.8million market value; 2% of the managed
portfolio
portfolio
March 31, 2012 Net unrealized gain was $2.9M
Preferred stock unrealized gain $2.2M
Bond mutual fund unrealized gain
$0.7M
$0.7M
Average tax equivalent yield: 8.7%
Equities vs. Entire Portfolio
Equity Mix

17
IV. Workers’ Comp (W/C) Accident Year Loss & ALAE Analysis

18
W/C Accident Year Loss & ALAE Analysis
Rollforward of Loss & ALAE Ratio (2009AY to 2011AY)
NOTE: See next page for explanations A through E.
*2009 and 2010 re-estimated AY loss & ALAE ratios reflect reserve adjustments made following the accident year based on new loss
development information gathered subsequent to the accident year through 12/31/2011 as reflected in our insurance subsidiaries’ 2011
Combined Annual Statement Schedule P.
development information gathered subsequent to the accident year through 12/31/2011 as reflected in our insurance subsidiaries’ 2011
Combined Annual Statement Schedule P.

19
W/C Accident Year Loss & ALAE Analysis
NOTE: The following explanations relate to loss & ALAE rollforward on the prior page.
A: The 2009 AY results reflect a single large claim that added $2.7M, or 1.6% to the loss & ALAE ratio.
B: When new programs are initiated there can be timing issues that impact schedule P. Schedule P
reports all claims in the accident year based on the claim date. Earned premium is recorded in the
accounting period in which it is booked. Therefore, there could be a mismatch of losses and premiums
within schedule P between two accident years. This was the case in our 2009AY and 2010AY schedule P
as we initiated a large new program in the second half of 2009. From a schedule P perspective, there
were fewer months of net earned premium as compared to loss and ALAE for the 2009AY. Adjusting
schedule P for this timing difference, our 2009AY would have improved by 1.9%. Please note, the timing
difference referred to does not impact the comparability of our GAAP financial results, rather it is just an
anomaly that needs to be adjusted for when analyzing schedule P.
C: The remainder of the improvement between the 2009AY and the 2010AY was driven primarily by a shift
in premium volume, as new business that was added in 2010 had a lower loss & ALAE ratio than the prior
year (NOTE: NEP increased from $163.8M in 2009 to $275.6M in 2010, driven primarily by two large
programs that were initiated in the second half of 2009).
in premium volume, as new business that was added in 2010 had a lower loss & ALAE ratio than the prior
year (NOTE: NEP increased from $163.8M in 2009 to $275.6M in 2010, driven primarily by two large
programs that were initiated in the second half of 2009).
D: In 2011 we initiated efforts to remediate two programs that were not meeting our targets through
significant price increases and reducing the premium volume for this business through tightening
underwriting standards. These efforts enhanced our 2011 AY loss & ALAE ratio by 1.8%.
significant price increases and reducing the premium volume for this business through tightening
underwriting standards. These efforts enhanced our 2011 AY loss & ALAE ratio by 1.8%.
E: The remaining improvement in the 2011AY & ALAE loss ratio is driven primarily by earned rate
increases that have been obtained and outpace increasing loss costs in combination with underwriting
actions taken (NOTE: NEP increased from $275.6M in 2010 to $306.1M in 2011).
increases that have been obtained and outpace increasing loss costs in combination with underwriting
actions taken (NOTE: NEP increased from $275.6M in 2010 to $306.1M in 2011).
20
W/C Accident Year Loss & ALAE Analysis
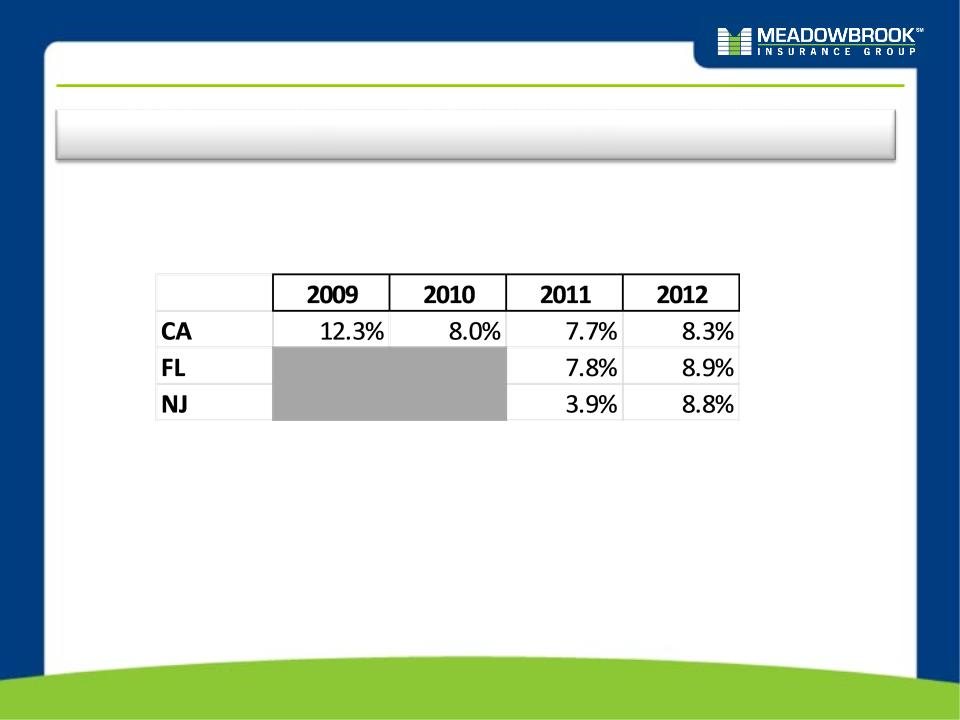
Cumulative filed rate increases on W/C line of business between 1/1/2010 and
3/31/2012 has been 16.3%.
3/31/2012 has been 16.3%.
*NOTE: The filed rate changes presented above are on a written basis. there is a lag between written and earned premium. To
illustrate, the 2010 rate increases would have a larger benefit to the 2011AY vs. the 2010 AY as these rate increases earn out
on a pro rata basis over the life of the policy.
illustrate, the 2010 rate increases would have a larger benefit to the 2011AY vs. the 2010 AY as these rate increases earn out
on a pro rata basis over the life of the policy.
Summary of Key Filed W/C Rate Increases by
State*
State*