Attached files
| file | filename |
|---|---|
| 8-K - FORM 8-K - Cooper-Standard Holdings Inc. | d350342d8k.htm |
Exhibit 99.1
| Cooper Standard First Quarter 2012 Earnings Call May 10, 2012 |
| Introduction & Agenda Introduction: Glenn Dong, Treasurer Executive Overview: Jim McElya, CEO Business Highlights: Keith Stephenson, COO Financial Review: Allen Campbell, CFO Questions & Answers 2 |
| Safe Harbor 3 This presentation includes forward-looking statements as contemplated by the 1995 Private Securities Litigation Reform Act, reflecting management's current analysis and expectations, based on what are believed to be reasonable assumptions. The words "estimates," "expects," "anticipates," "projects," "plans," "intends," "believes," "forecasts," or future or conditional verbs, such as "will," "should," "could," or "may," and variations of such words or similar expressions are intended to identify forward-looking statements. Forward-looking statements may involve known and unknown risks, uncertainties and other factors, which may cause actual results to differ materially from those projected, stated or implied, depending on many factors, including, without limitation: our dependence on the automotive industry; further restructuring of our customers; availability and cost of raw materials; pricing pressures and volume requirements of our customers; the ability to meet significant increase in customer demand; increased costs negatively impacting our profitability; competition in the automotive industry; sovereign and other risks related to our conducting operations outside the United States; foreign currency fluctuations; our ability to achieve benefits from our joint venture operations not operated for our sole benefit; our exposure to the uncertainty of political disruptions and increased violence in Mexico; the uncertainty of our ability to achieve expected cost reduction savings; our dependence on certain major customers and platforms; our exposure to product liability and warranty claims; labor conditions; our ability to attract and retain key personnel; our ability to meet customers' needs for new and improved products in a timely manner; our ability to select and integrate attractive business acquisitions; our legal rights to our intellectual property portfolio; environmental and other regulations; the outcome of legal proceedings the Company is or may become party to; volatility in our expected annual effective tax rate; impact of our capital structure on our financial condition and ability to obtain financing in the future; our ability to generate cash to meet our debt and other cash obligations; our pension plans; any impairment of a significant amount of our goodwill or other intangible asset; potential conflicts of interest between our owners and us; limitations on flexibility in operating our business contained in our debt agreements; our exposure to natural disasters; and other risks described from time to time in the Company's Securities and Exchange Commission filings. There may be other factors that may cause the company's actual results to differ materially from those projected in any forward-looking statement. Accordingly, there can be no assurance that Cooper Standard will meet future results, performance or achievements expressed or implied by such forward-looking statements. This paragraph is included to provide a safe harbor for forward-looking statements, which are not generally required to be publicly revised as circumstances change and which Cooper Standard does not intend to update. The forward-looking statements in this presentation are made as of the date hereof, and the Company does not assume any obligation to update, amend or clarify them to reflect events, new information or circumstances occurring after the date hereof. |
| Jim McElya Chairman & CEO Executive Overview First Quarter 2012 |
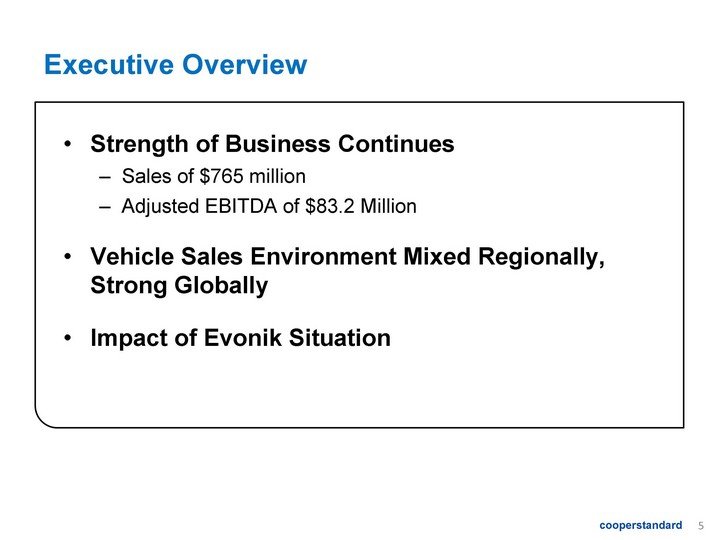
| Executive Overview Strength of Business Continues Sales of $765 million Adjusted EBITDA of $83.2 Million Vehicle Sales Environment Mixed Regionally, Strong Globally Impact of Evonik Situation |
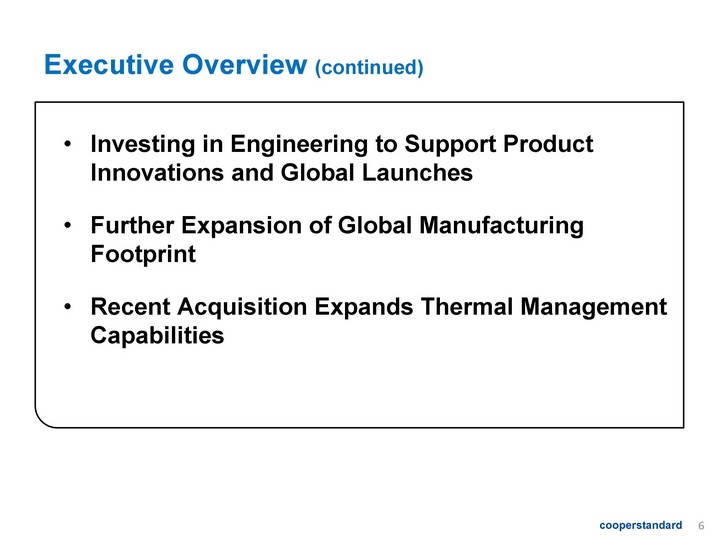
| Executive Overview (continued) Investing in Engineering to Support Product Innovations and Global Launches Further Expansion of Global Manufacturing Footprint Recent Acquisition Expands Thermal Management Capabilities |
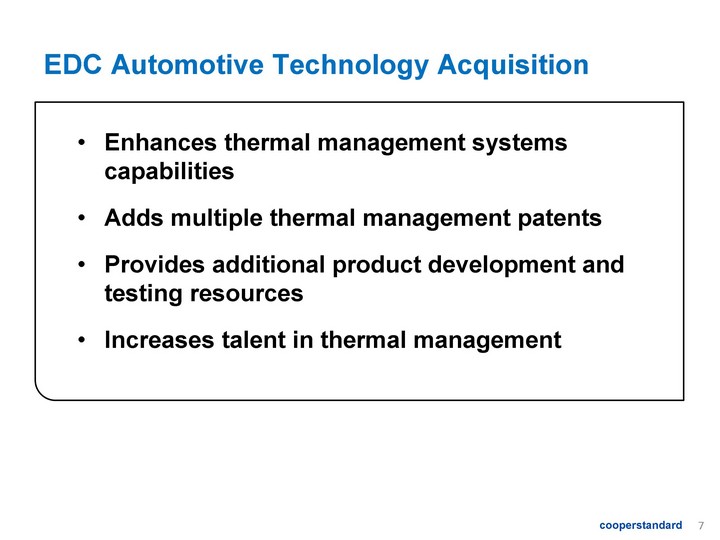
| EDC Automotive Technology Acquisition Enhances thermal management systems capabilities Adds multiple thermal management patents Provides additional product development and testing resources Increases talent in thermal management |
| Business Highlights First Quarter 2012 Keith Stephenson Chief Operating Officer |
| Business Highlights Global footprint Strategic focus Supports customers' expansions Product innovation Investment across all product lines Alternative materials development Product launches Active launch quarter Further penetration on global platforms |
| Footprint Evolution Sigit acquisition integrated into Italian business South American plant now operational and supplying product to Honda and Toyota North American hose plant consolidated Romania plant progressing Responsibly managing footprint |
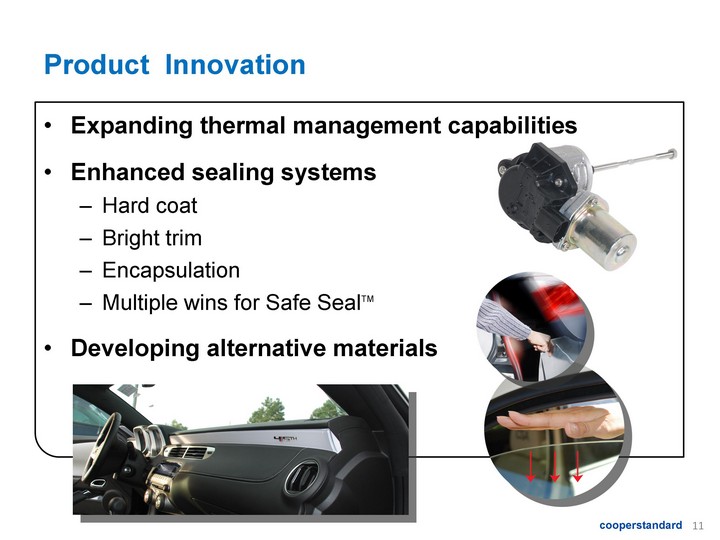
| Product Innovation Expanding thermal management capabilities Enhanced sealing systems Hard coat Bright trim Encapsulation Multiple wins for Safe SealTM Developing alternative materials |
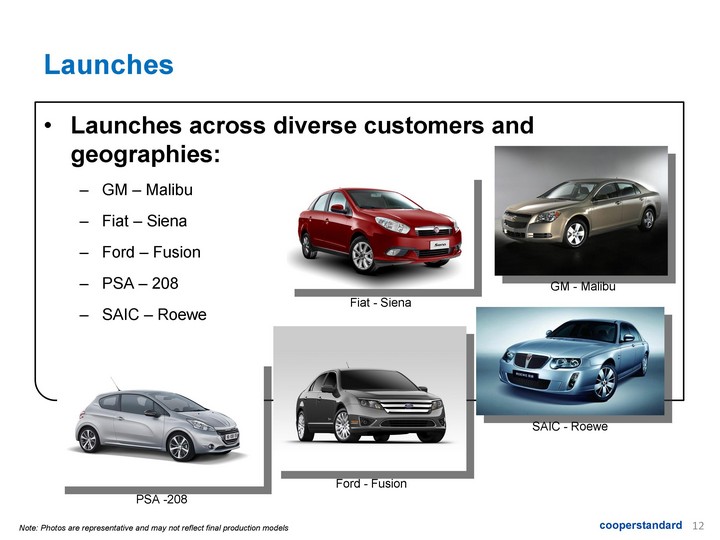
| Launches Launches across diverse customers and geographies: GM - Malibu Fiat - Siena Ford - Fusion PSA - 208 SAIC - Roewe GM - Malibu Fiat - Siena Ford - Fusion PSA -208 SAIC - Roewe Note: Photos are representative and may not reflect final production models |
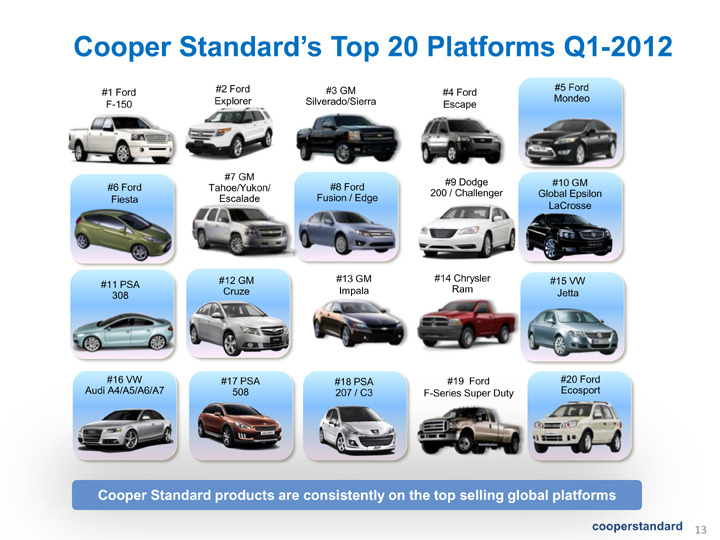
| 13 Cooper Standard's Top 20 Platforms Q1-2012 #10 GM Global Epsilon LaCrosse #4 Ford Escape #11 PSA 308 #1 Ford F-150 #7 GM Tahoe/Yukon/ Escalade #8 Ford Fusion / Edge #17 PSA 508 #2 Ford Explorer #12 GM Cruze #3 GM Silverado/Sierra #6 Ford Fiesta #13 GM Impala #5 Ford Mondeo #20 Ford Ecosport #9 Dodge 200 / Challenger #14 Chrysler Ram #19 Ford F-Series Super Duty #18 PSA 207 / C3 #16 VW Audi A4/A5/A6/A7 #15 VW Jetta Cooper Standard products are consistently on the top selling global platforms |
| Financial Overview First Quarter 2012 Allen Campbell Chief Financial Officer |
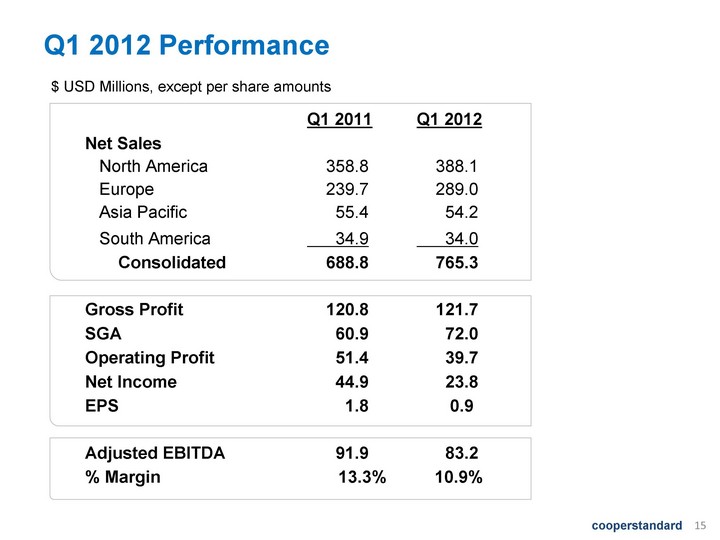
| Q1 2012 Performance 15 $ USD Millions, except per share amounts Q1 2011 Q1 2012 Net Sales North America 358.8 388.1 Europe 239.7 289.0 Asia Pacific 55.4 54.2 South America 34.9 34.0 Consolidated 688.8 765.3 Gross Profit 120.8 121.7 SGA 60.9 72.0 Operating Profit 51.4 39.7 Net Income 44.9 23.8 EPS 1.8 0.9 Adjusted EBITDA 91.9 83.2 % Margin 13.3% 10.9% |
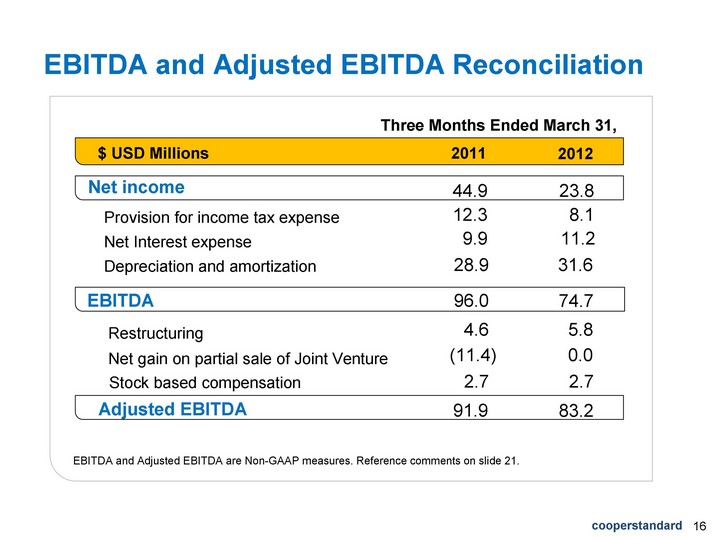
| EBITDA and Adjusted EBITDA Reconciliation 16 $ USD Millions 2011 2012 Net income Provision for income tax expense EBITDA Restructuring Adjusted EBITDA Three Months Ended March 31, Net Interest expense Depreciation and amortization Stock based compensation EBITDA and Adjusted EBITDA are Non-GAAP measures. Reference comments on slide 21. Net gain on partial sale of Joint Venture 44.9 23.8 12.3 8.1 9.9 11.2 28.9 31.6 96.0 74.7 4.6 5.8 (11.4) 0.0 2.7 2.7 91.9 83.2 |
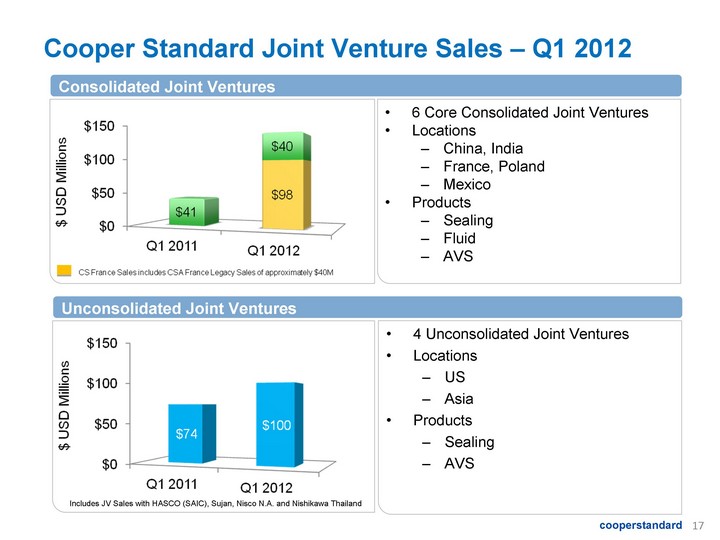
| Cooper Standard Joint Venture Sales - Q1 2012 6 Core Consolidated Joint Ventures Locations China, India France, Poland Mexico Products Sealing Fluid AVS 4 Unconsolidated Joint Ventures Locations US Asia Products Sealing AVS Consolidated Joint Ventures Unconsolidated Joint Ventures Includes JV Sales with HASCO (SAIC), Sujan, Nisco N.A. and Nishikawa Thailand |
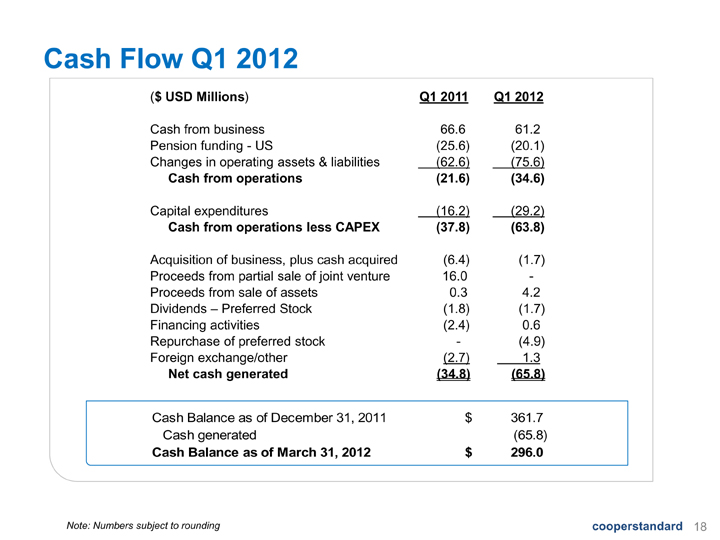
| Cash Flow Q1 2012 18 Note: Numbers subject to rounding ($ USD Millions) Q1 2011 Q1 2012 Cash from business 66.6 61.2 Pension funding - US (25.6) (20.1) Changes in operating assets & liabilities (62.6) (75.6) Cash from operations (21.6) (34.6) Capital expenditures (16.2) (29.2) Cash from operations less CAPEX (37.8) (63.8) Acquisition of business, plus cash acquired (6.4) (1.7) Proceeds from partial sale of joint venture 16.0 - Proceeds from sale of assets 0.3 4.2 Dividends - Preferred Stock (1.8) (1.7) Financing activities (2.4) 0.6 Repurchase of preferred stock - (4.9) Foreign exchange/other (2.7) 1.3 Net cash generated (34.8) (65.8) |
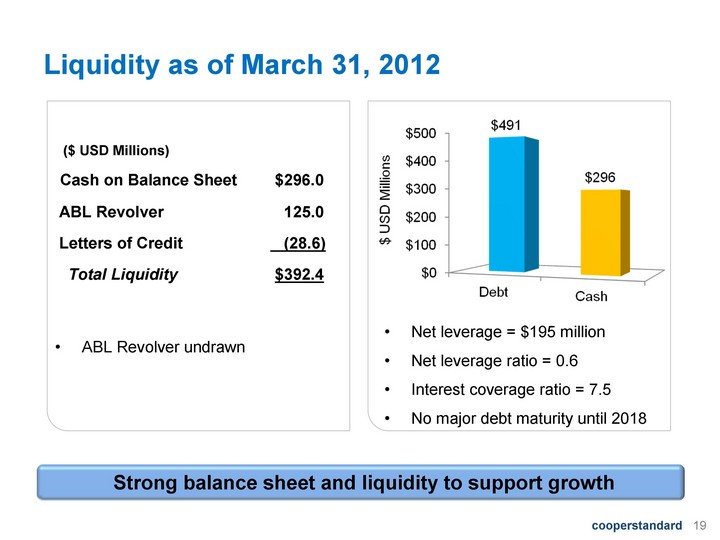
| 19 Liquidity as of March 31, 2012 Cash on Balance Sheet $296.0 ABL Revolver 125.0 Letters of Credit (28.6) Total Liquidity $392.4 Strong balance sheet and liquidity to support growth ABL Revolver undrawn Net leverage = $195 million Net leverage ratio = 0.6 Interest coverage ratio = 7.5 No major debt maturity until 2018 ($ USD Millions) |
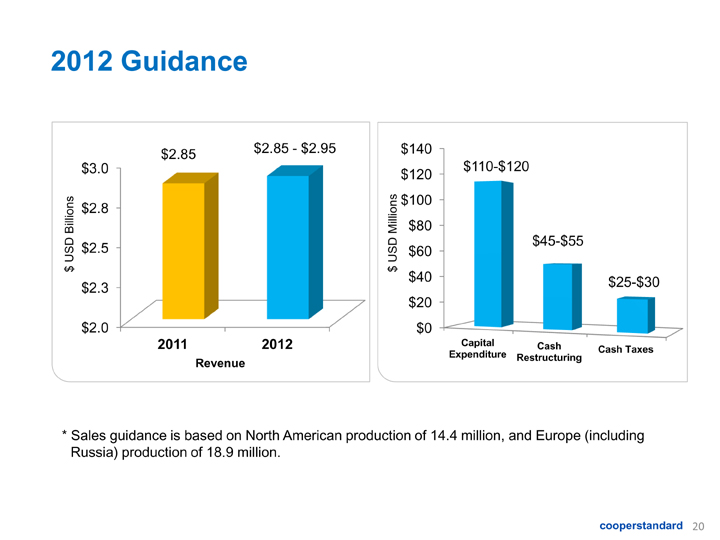
| 2012 Guidance $110- $120 $45-$55 $25-$30 * Sales guidance is based on North American production of 14.4 million, and Europe (including Russia) production of 18.9 million. $2.85 $2.85 - $2.95 Revenue |

| Non-GAAP Financial Measures 21 EBITDA and adjusted EBITDA are measures not recognized under Generally Accepted Accounting Principles (GAAP) which exclude certain non-cash and non- recurring items. When analyzing the company's operating performance, investors should use EBITDA and adjusted EBITDA in addition to, and not as alternatives for, net income (loss), operating income, or any other performance measure derived in accordance with GAAP, or as an alternative to cash flow from operating activities as a measure of the company's performance. EBITDA and adjusted EBITDA have limitations as analytical tools and should not be considered in isolation or as substitutes for analysis of the company's results of operations as reported under GAAP. Other companies may report EBITDA and adjusted EBITDA differently and therefore Cooper Standard's results may not be comparable to other similarly titled measures of other companies. |
| Questions & Answers |
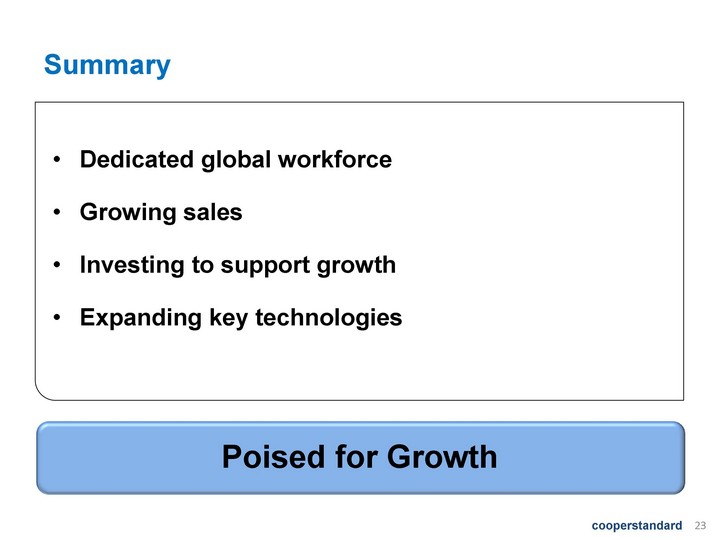
| Summary Dedicated global workforce Growing sales Investing to support growth Expanding key technologies 23 Poised for Growth |
| Appendix |
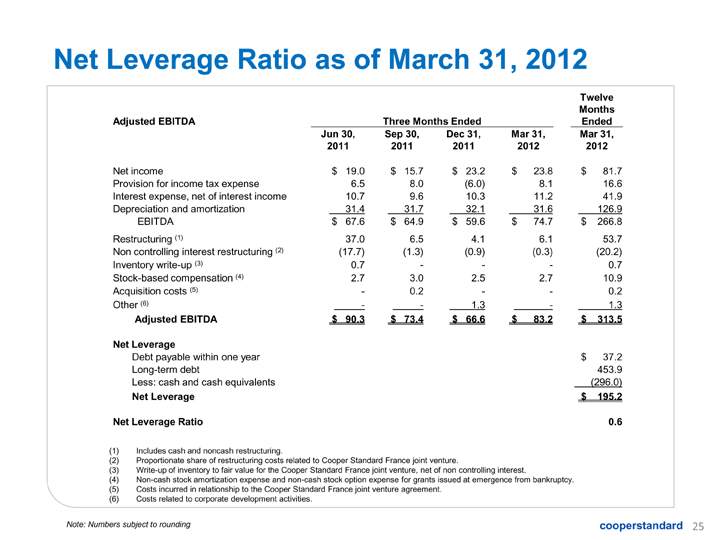
| Net Leverage Ratio as of March 31, 2012 Includes cash and noncash restructuring. Proportionate share of restructuring costs related to Cooper Standard France joint venture. Write-up of inventory to fair value for the Cooper Standard France joint venture, net of non controlling interest. Non-cash stock amortization expense and non-cash stock option expense for grants issued at emergence from bankruptcy. Costs incurred in relationship to the Cooper Standard France joint venture agreement. Costs related to corporate development activities. Adjusted EBITDA Three Months Ended Three Months Ended Three Months Ended Three Months Ended Three Months Ended Three Months Ended Three Months Ended Twelve Months Ended Jun 30, 2011 Sep 30, 2011 Dec 31, 2011 Mar 31, 2012 Mar 31, 2012 Net income $ 19.0 $ 15.7 $ 23.2 $ 23.8 $ 81.7 Provision for income tax expense 6.5 8.0 (6.0) 8.1 16.6 Interest expense, net of interest income 10.7 9.6 10.3 11.2 41.9 Depreciation and amortization 31.4 31.7 32.1 31.6 126.9 EBITDA $ 67.6 $ 64.9 $ 59.6 $ 74.7 $ 266.8 Restructuring (1) 37.0 6.5 4.1 6.1 53.7 Non controlling interest restructuring (2) (17.7) (1.3) (0.9) (0.3) (20.2) Inventory write-up (3) 0.7 - - - 0.7 Stock-based compensation (4) 2.7 3.0 2.5 2.7 10.9 Acquisition costs (5) - 0.2 - - 0.2 Other (6) - - 1.3 - 1.3 Adjusted EBITDA $ 90.3 $ 73.4 $ 66.6 $ 83.2 $ 313.5 Net Leverage Debt payable within one year $ 37.2 Long-term debt 453.9 Less: cash and cash equivalents (296.0) Net Leverage $ 195.2 Net Leverage Ratio 0.6 Note: Numbers subject to rounding |