Attached files
| file | filename |
|---|---|
| 8-K - FORM 8-K - DITECH HOLDING Corp | d352064d8k.htm |
| EX-99.1 - EX-99.1 - DITECH HOLDING Corp | d352064dex991.htm |
Exhibit 99.2

| First Quarter 2012 Earnings Presentation May 9, 2012 |
| Legal Disclaimers Disclaimer and Cautionary Note Regarding Forward-Looking Statements This press release contains forward-looking statements, including forward-looking statements within the meaning of the Private Securities Litigation Reform Act of 1995. Such forward-looking statements include, but are not limited to, statements concerning Walter Investment's plans, beliefs, objectives, expectations and intentions and other statements that are not historical or current facts. Forward-looking statements are based on Walter Investment's current expectations and involve risks and uncertainties that could cause actual results to differ materially from those expressed or implied in such forward-looking statements. Factors that could cause Walter Investment's results to differ materially from current expectations include, but are not limited to: Walter Investment's ability to implement its strategic initiatives, particularly as they relate to our ability to develop new business, including the implementation of delinquency flow programs and the receipt of new business, which are both subject to customer demand and approval, and the availability of MSRs at acceptable prices, along with the availability of capital to purchase MSRs; the Company's ability to earn anticipated levels of performance and incentive fees on serviced business; continued performance of the loans and residuals segment; economic, political and market conditions and fluctuations, government and industry regulation, including any new regulation, increased costs, and/or decrease in revenues that may result from increased scrutiny by government regulators and customers on lender-placed insurance; interest rate risk and U.S. competition; and other factors detailed in Walter Investment's 2011 Annual Report on Form 10-K and other periodic reports filed with the U.S. Securities and Exchange Commission. In addition, these statements are based on a number of assumptions that are subject to change. Accordingly, actual results may be materially higher or lower than those projected. The inclusion of such projections herein should not be regarded as a representation by Walter Investment that the projections will prove to be correct. This press release speaks only as of this date. Walter Investment disclaims any duty to update the information herein. .Non-GAAP Financial Measures To supplement Walter Investment's consolidated financial statements prepared in accordance with GAAP and to better reflect period-over-period comparisons, Walter Investment uses non-GAAP financial measures of performance, financial position, or cash flows that either exclude or include amounts that are not normally excluded or included in the most directly comparable measure, calculated and presented in accordance with GAAP. Non-GAAP financial measures do not replace and are not superior to the presentation of GAAP financial results, but are provided to (i) measure the Company's financial performance excluding depreciation and amortization costs, corporate and MSR facility interest expense, transaction and merger integration-related costs, certain other non-cash adjustments, the net impact of the consolidated Non-Residual Trust VIEs and certain other items as defined by our first and second lien credit agreements, including, but not limited to pro-forma synergies, (ii) provide investors a means of evaluating our core operating performance and (iii) improve overall understanding of Walter Investment's current financial performance and its prospects for the future. Specifically, Walter Investment believes the non-GAAP financial results provide useful information to both management and investors regarding certain additional financial and business trends relating to financial condition and operating results. In addition, management uses these measures for reviewing financial results and evaluating financial performance. The non-GAAP adjustments for all periods presented are based upon information and assumptions available as of the date of this presentation. 1 |
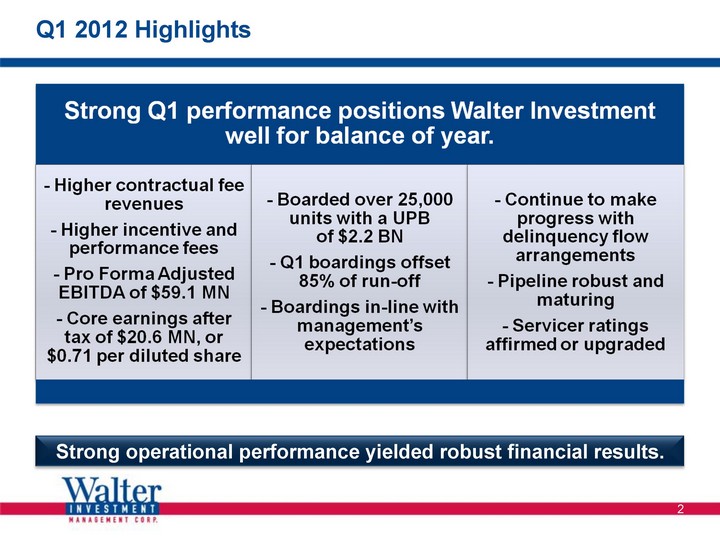
| Q1 2012 Highlights Q1 2012 Highlights 2 Strong operational performance yielded robust financial results. |
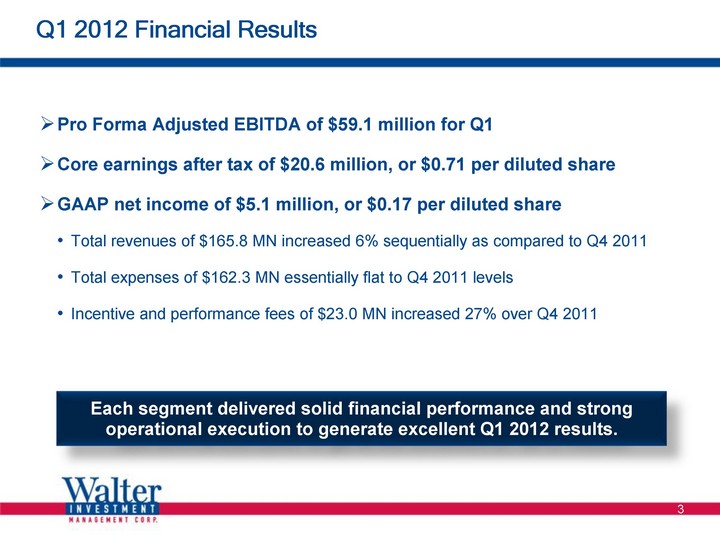
| 3 Q1 2012 Financial Results Pro Forma Adjusted EBITDA of $59.1 million for Q1 Core earnings after tax of $20.6 million, or $0.71 per diluted share GAAP net income of $5.1 million, or $0.17 per diluted share Total revenues of $165.8 MN increased 6% sequentially as compared to Q4 2011 Total expenses of $162.3 MN essentially flat to Q4 2011 levels Incentive and performance fees of $23.0 MN increased 27% over Q4 2011 Each segment delivered solid financial performance and strong operational execution to generate excellent Q1 2012 results. |
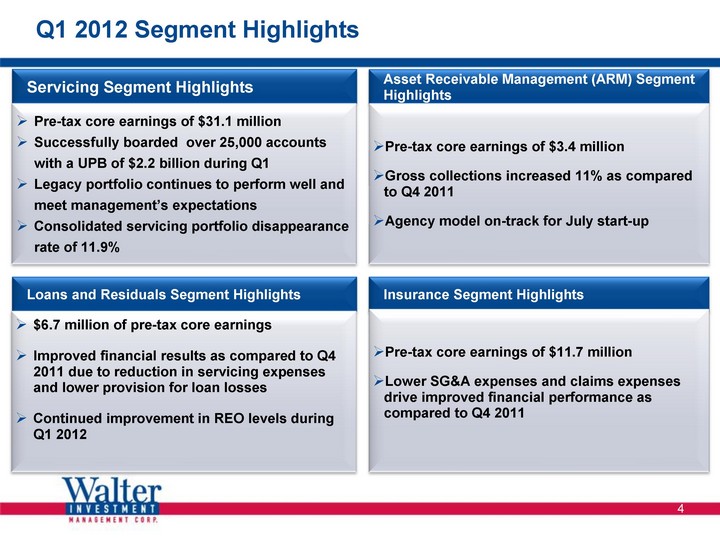
| Q1 2012 Segment Highlights 4 Loans and Residuals Segment Highlights $6.7 million of pre-tax core earnings Improved financial results as compared to Q4 2011 due to reduction in servicing expenses and lower provision for loan losses Continued improvement in REO levels during Q1 2012 Servicing Segment Highlights Pre-tax core earnings of $31.1 million Successfully boarded over 25,000 accounts with a UPB of $2.2 billion during Q1 Legacy portfolio continues to perform well and meet management's expectations Consolidated servicing portfolio disappearance rate of 11.9% Asset Receivable Management (ARM) Segment Highlights Pre-tax core earnings of $3.4 million Gross collections increased 11% as compared to Q4 2011 Agency model on-track for July start-up Insurance Segment Highlights Pre-tax core earnings of $11.7 million Lower SG&A expenses and claims expenses drive improved financial performance as compared to Q4 2011 |
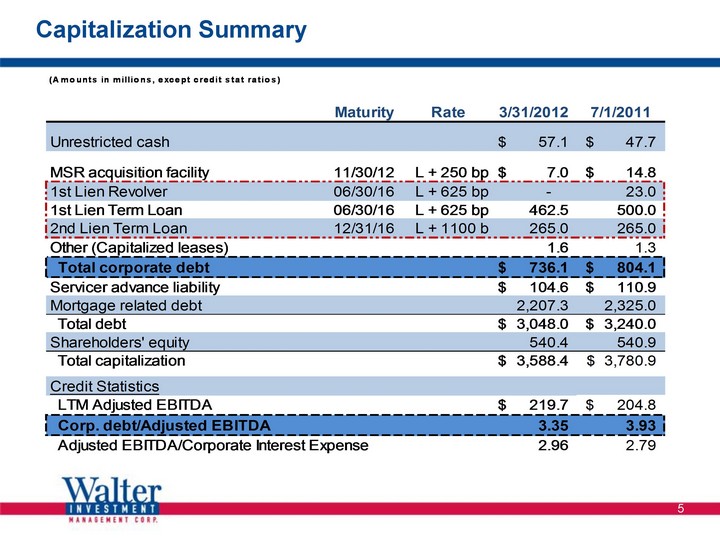
| Capitalization Summary 5 |
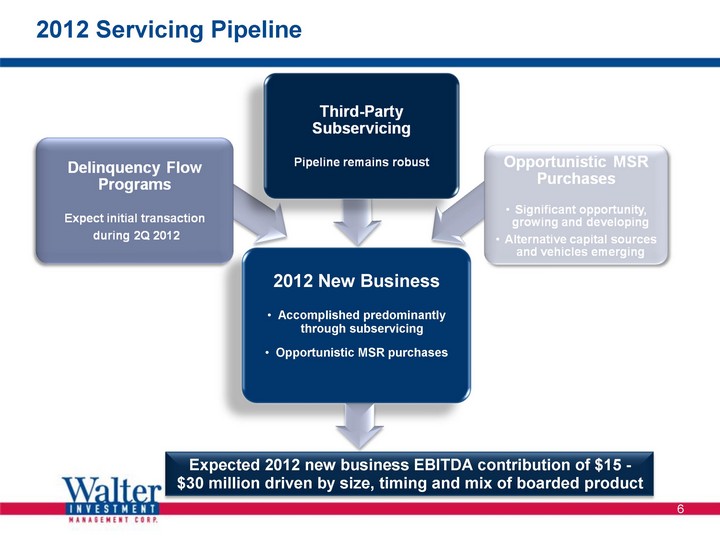
| 2012 Servicing Pipeline 2012 Servicing Pipeline 6 2012 New Business Accomplished predominantly through subservicing Opportunistic MSR purchases Expected 2012 new business EBITDA contribution of $15 - $30 million driven by size, timing and mix of boarded product |
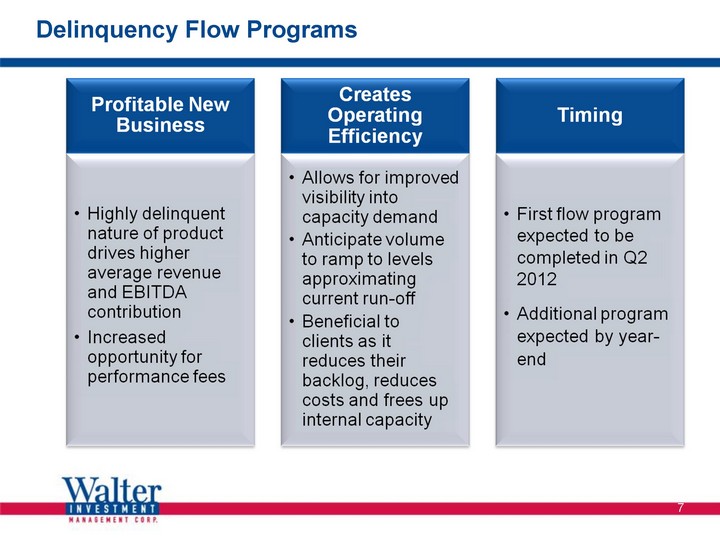
| Delinquency Flow Programs 7 |
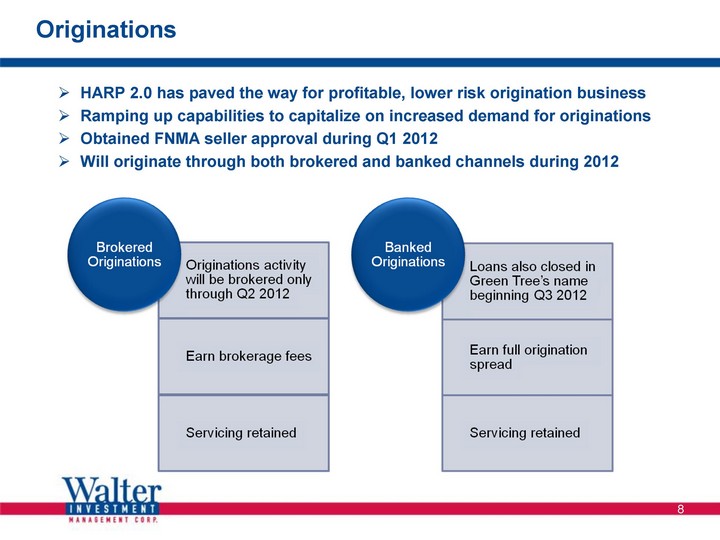
| Originations 8 HARP 2.0 has paved the way for profitable, lower risk origination business Ramping up capabilities to capitalize on increased demand for originations Obtained FNMA seller approval during Q1 2012 Will originate through both brokered and banked channels during 2012 |
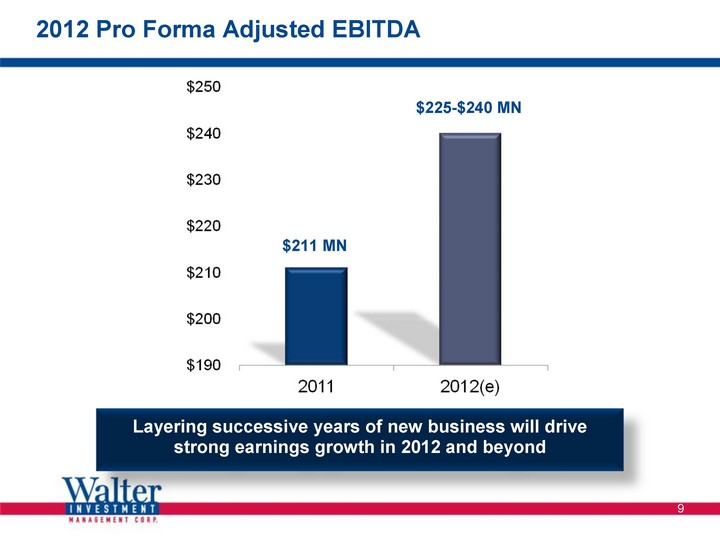
| 2012 Pro Forma Adjusted EBITDA 9 $211 MN $225-$240 MN Layering successive years of new business will drive strong earnings growth in 2012 and beyond |
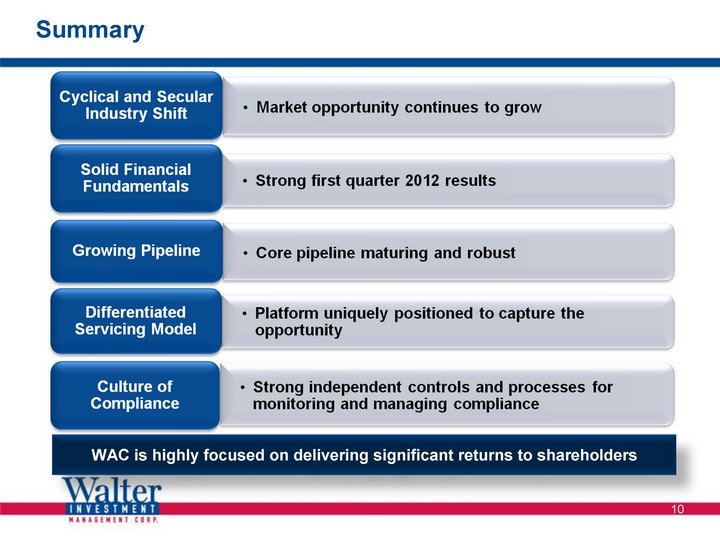
| Summary 10 WAC is highly focused on delivering significant returns to shareholders |

| Appendix |
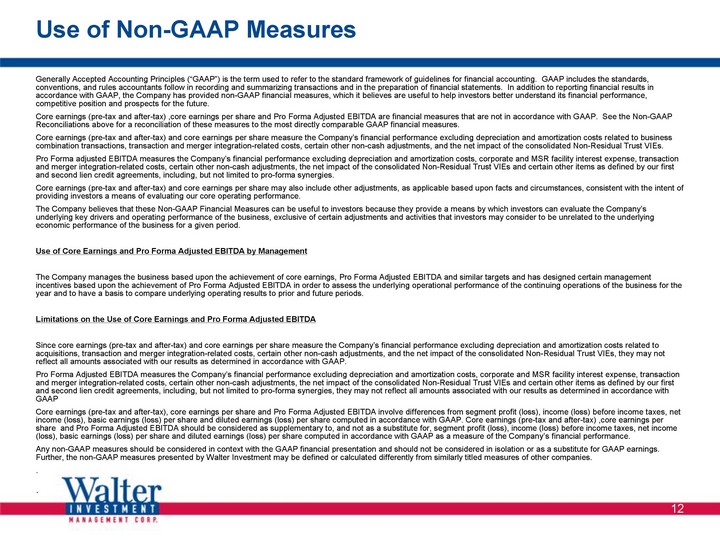
| 12 Use of Non-GAAP Measures Generally Accepted Accounting Principles ("GAAP") is the term used to refer to the standard framework of guidelines for financial accounting. GAAP includes the standards, conventions, and rules accountants follow in recording and summarizing transactions and in the preparation of financial statements. In addition to reporting financial results in accordance with GAAP, the Company has provided non-GAAP financial measures, which it believes are useful to help investors better understand its financial performance, competitive position and prospects for the future. Core earnings (pre-tax and after-tax) ,core earnings per share and Pro Forma Adjusted EBITDA are financial measures that are not in accordance with GAAP. See the Non-GAAP Reconciliations above for a reconciliation of these measures to the most directly comparable GAAP financial measures. Core earnings (pre-tax and after-tax) and core earnings per share measure the Company's financial performance excluding depreciation and amortization costs related to business combination transactions, transaction and merger integration-related costs, certain other non-cash adjustments, and the net impact of the consolidated Non-Residual Trust VIEs. Pro Forma adjusted EBITDA measures the Company's financial performance excluding depreciation and amortization costs, corporate and MSR facility interest expense, transaction and merger integration-related costs, certain other non-cash adjustments, the net impact of the consolidated Non-Residual Trust VIEs and certain other items as defined by our first and second lien credit agreements, including, but not limited to pro-forma synergies. Core earnings (pre-tax and after-tax) and core earnings per share may also include other adjustments, as applicable based upon facts and circumstances, consistent with the intent of providing investors a means of evaluating our core operating performance. The Company believes that these Non-GAAP Financial Measures can be useful to investors because they provide a means by which investors can evaluate the Company's underlying key drivers and operating performance of the business, exclusive of certain adjustments and activities that investors may consider to be unrelated to the underlying economic performance of the business for a given period. Use of Core Earnings and Pro Forma Adjusted EBITDA by Management The Company manages the business based upon the achievement of core earnings, Pro Forma Adjusted EBITDA and similar targets and has designed certain management incentives based upon the achievement of Pro Forma Adjusted EBITDA in order to assess the underlying operational performance of the continuing operations of the business for the year and to have a basis to compare underlying operating results to prior and future periods. Limitations on the Use of Core Earnings and Pro Forma Adjusted EBITDA Since core earnings (pre-tax and after-tax) and core earnings per share measure the Company's financial performance excluding depreciation and amortization costs related to acquisitions, transaction and merger integration-related costs, certain other non-cash adjustments, and the net impact of the consolidated Non-Residual Trust VIEs, they may not reflect all amounts associated with our results as determined in accordance with GAAP. Pro Forma Adjusted EBITDA measures the Company's financial performance excluding depreciation and amortization costs, corporate and MSR facility interest expense, transaction and merger integration-related costs, certain other non-cash adjustments, the net impact of the consolidated Non-Residual Trust VIEs and certain other items as defined by our first and second lien credit agreements, including, but not limited to pro-forma synergies, they may not reflect all amounts associated with our results as determined in accordance with GAAP Core earnings (pre-tax and after-tax), core earnings per share and Pro Forma Adjusted EBITDA involve differences from segment profit (loss), income (loss) before income taxes, net income (loss), basic earnings (loss) per share and diluted earnings (loss) per share computed in accordance with GAAP. Core earnings (pre-tax and after-tax) ,core earnings per share and Pro Forma Adjusted EBITDA should be considered as supplementary to, and not as a substitute for, segment profit (loss), income (loss) before income taxes, net income (loss), basic earnings (loss) per share and diluted earnings (loss) per share computed in accordance with GAAP as a measure of the Company's financial performance. Any non-GAAP measures should be considered in context with the GAAP financial presentation and should not be considered in isolation or as a substitute for GAAP earnings. Further, the non-GAAP measures presented by Walter Investment may be defined or calculated differently from similarly titled measures of other companies. . . |
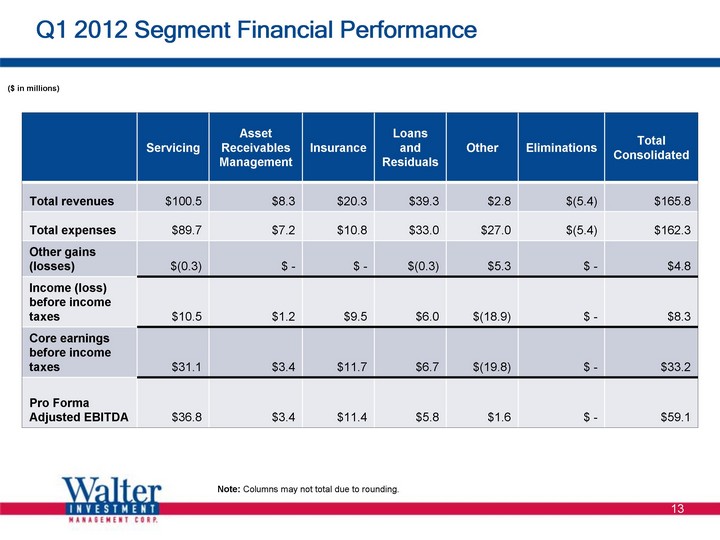
| 13 Q1 2012 Segment Financial Performance ($ in millions) Servicing Asset Receivables Management Insurance Loans and Residuals Other Eliminations Total Consolidated Total revenues $100.5 $8.3 $20.3 $39.3 $2.8 $(5.4) $165.8 Total expenses $89.7 $7.2 $10.8 $33.0 $27.0 $(5.4) $162.3 Other gains (losses) $(0.3) $ - $ - $(0.3) $5.3 $ - $4.8 Income (loss) before income taxes $10.5 $1.2 $9.5 $6.0 $(18.9) $ - $8.3 Core earnings before income taxes $31.1 $3.4 $11.7 $6.7 $(19.8) $ - $33.2 Pro Forma Adjusted EBITDA $36.8 $3.4 $11.4 $5.8 $1.6 $ - $59.1 Note: Columns may not total due to rounding. |
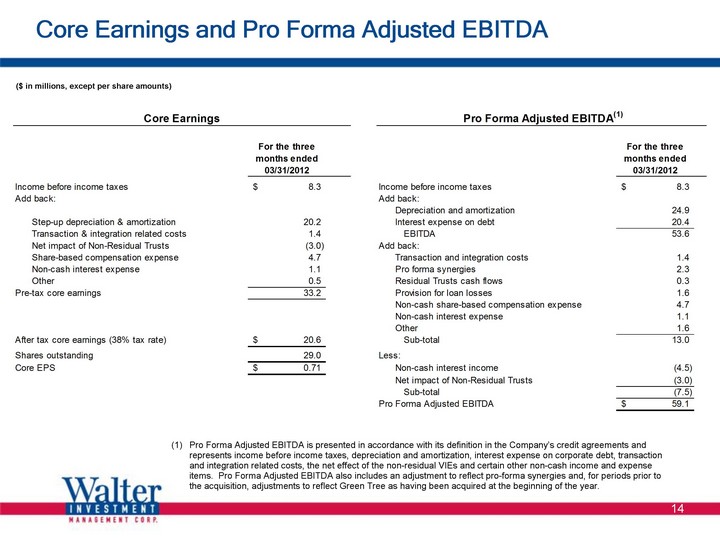
| Core Earnings and Pro Forma Adjusted EBITDA 14 Pro Forma Adjusted EBITDA is presented in accordance with its definition in the Company's credit agreements and represents income before income taxes, depreciation and amortization, interest expense on corporate debt, transaction and integration related costs, the net effect of the non-residual VIEs and certain other non-cash income and expense items. Pro Forma Adjusted EBITDA also includes an adjustment to reflect pro-forma synergies and, for periods prior to the acquisition, adjustments to reflect Green Tree as having been acquired at the beginning of the year. ($ in millions, except per share amounts) |
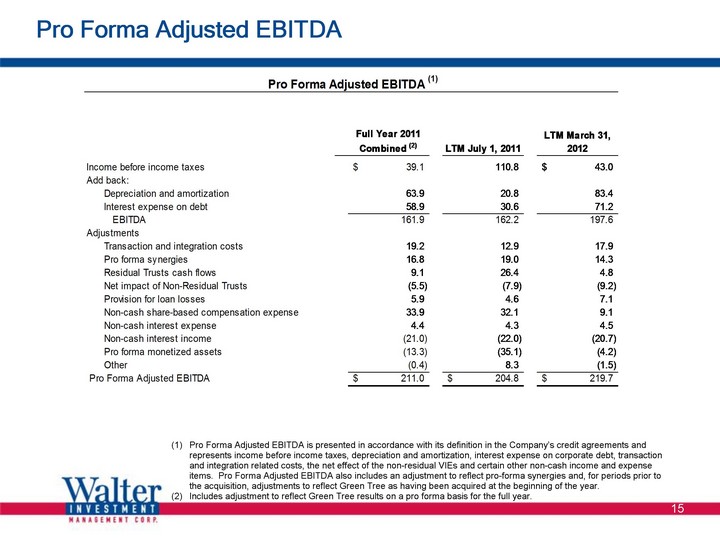
| Pro Forma Adjusted EBITDA 15 Pro Forma Adjusted EBITDA is presented in accordance with its definition in the Company's credit agreements and represents income before income taxes, depreciation and amortization, interest expense on corporate debt, transaction and integration related costs, the net effect of the non-residual VIEs and certain other non-cash income and expense items. Pro Forma Adjusted EBITDA also includes an adjustment to reflect pro-forma synergies and, for periods prior to the acquisition, adjustments to reflect Green Tree as having been acquired at the beginning of the year. Includes adjustment to reflect Green Tree results on a pro forma basis for the full year. |