Attached files
| file | filename |
|---|---|
| 8-K - FORM 8-K - SPARTON CORP | d345402d8k.htm |
| EX-99.1 - SCRIPT FOR CONFERENCE CALL DATED MAY 9, 2012 - SPARTON CORP | d345402dex991.htm |
 Fiscal 2012 Third Quarter
Financial Results
Conference Call
February 8, 2012
Exhibit 99.2 |
 2
Safe Harbor Statement
Safe Harbor Statement
Certain statements herein constitute forward-looking statements within the
meaning of the Securities Act
of
1933,
as
amended
and
the
Securities
Exchange
Act
of
1934,
as
amended.
When
used
herein,
words
such
as
“believe,”
“expect,”
“anticipate,”
“project,”
“plan,”
“estimate,”
“will”
or
“intend”
and similar words or expressions as they relate to the Company or its management
constitute forward-looking statements. These forward-looking
statements reflect our current views with respect to
future
events
and
are
based
on
currently
available
financial,
economic
and
competitive
data
and
our current business plans. The Company is under no obligation to, and expressly
disclaims any obligation to, update or alter its forward-looking
statements whether as a result of such changes, new
information,
subsequent
events
or
otherwise.
Actual
results
could
vary
materially
depending
on
risks
and
uncertainties
that
may
affect
our
operations,
markets,
prices
and
other
factors.
Important
factors that could cause actual results to differ materially from those
forward-looking statements include
those
contained
under
the
heading
of
risk
factors
and
in
the
management’s
discussion
and
analysis contained from time-to-time in the Company’s filings with the
Securities and Exchange Commission.
Adjusted
operating
income,
adjusted
net
income
and
adjusted
income
per
share
–
basic
and
diluted
and adjusted earnings before interest, taxes, depreciation and amortization
(”adjusted EBIDTA”) are non-GAAP financial measures that
exclude or add the effect of certain gains and charges, including, for
fiscal 2011, imputing taxes at a 36% effective rate. Sparton believes that the
presentation of non-GAAP financial information provides useful supplemental
information to management
and
investors
regarding
financial
and
business
trends
relating
to
the
Company’s
financial results. More detailed information, including period over period segment
comparisons, non- GAAP reconciliation tables and the reasons management
believes non-GAAP measures provide useful information to investors, is
included in the Fiscal 2012 Third Quarter Financial Results press release
and Form 10-Q dated May 8, 2012. |
 3
•
3
Quarter Highlights
•
Fiscal 2012 Third Quarter Results
•
3 Quarter Segmented Operating Results
•
Liquidity & Capital Resources
•
New Business Awards
•
Outlook
•
Q & A
Today’s Agenda
Today’s Agenda
rd
rd |
 4
•
Net sales increased by 9% from the same quarter last year (up 6%, net
of acquisitions).
•
Adjusted net income increase to $0.19 per share versus an adjusted net
income of $0.16 per share in the prior year quarter.
•
12 new business programs were awarded of which 7 were with new
customers.
•
Quarter end sales backlog increased 20% from a year ago to
approximately $146.6 million.
•
Adjusted EBITDA increased by 19% to $3.6 million.
•
Completed the repurchase program of $3.0 million of common shares.
3
rd
Quarter Highlights |
 5
Consolidated Financial Results
Consolidated Financial Results
Fiscal 2012 Third Quarter
Fiscal 2012 Third Quarter
(Adjusted)
2012
2011
2012
2011
Net Sales
$ 55,048
$ 50,352
$ 55,048
$ 50,352
$ 4,696
Gross Profit
9,161
8,202
9,055
8,202
853
16.6%
16.3%
16.4%
16.3%
Selling and Administrative Expense
5,509
5,143
5,509
5,143
(366)
10.0%
10.2%
10.0%
10.2%
Internal R&D Expense
347
282
347
282
(65)
Amortization of intangible assets
109
127
109
127
18
Gain on sale of property
-
(121)
-
-
Other operationg expense, net
26
92
26
92
66
Operating Income
3,170
2,679
3,064
2,558
506
5.8%
5.3%
5.6%
5.1%
Income Before Provision For Income Tax
3,133
2,638
3,027
2,517
510
Provision For Income Taxes
1,128
115
1,090
906
(184)
Net Income
$ 2,005
$ 2,523
$ 1,937
$ 1,611
$ 326
3.6%
5.0%
3.5%
3.2%
Income per Share, Basic and Diluted
$ 0.20
$ 0.25
$ 0.19
$ 0.16
$ 0.03
($ in 000’s, except per share)
(adjusted removes certain gains and charges, including imputing taxes at 36%
effective rate) (Reported)
(Adjusted)
Quarter ended March 31,
Quarter ended March 31,
YoY
Variance |
 6
Sales & Gross Margin Results
Sales & Gross Margin Results
Medical
Medical
SEGMENT
2012
% of Total
2011
% Change
2012
% of Total
2011
% Change
Medical
$ 27,046
49%
$ 25,377
7%
$ 82,533
51%
$ 70,072
18%
Complex Systems
12,812
23%
12,291
4%
37,921
23%
35,131
8%
DSS
19,363
35%
16,350
18%
53,126
33%
47,126
13%
Eliminations
(4,173)
-8%
(3,666)
14%
(11,329)
-7%
(9,879)
15%
Totals
$ 55,048
100%
$ 50,352
9%
$ 162,251
100%
$ 142,450
14%
SEGMENT
2012
GP %
2011
GP %
2012
GP %
2011
GP %
Medical
(a)
$ 3,487
13%
$ 3,554
14%
$ 10,984
13%
$ 9,211
13%
Complex Systems
933
7%
1,364
11%
3,327
9%
3,020
9%
DSS
4,635
24%
3,284
20%
11,824
22%
10,544
22%
Totals
$ 9,055
16%
$ 8,202
16%
$ 26,135
16%
$ 22,775
16%
(a)
Fiscal
2012
Medical
gross
margins
are
adjusted
to
remove
the
effect
of
an
acquisition
related
inventory
contingency
settlement.
($ in 000’s)
3 Months Ended March 31,
3 Months Ended March 31,
9 Months Ended March 31,
9 Months Ended March 31,
SALES
ADJUSTED GROSS MARGIN |
 7
Sales & Gross Margin Results
Sales & Gross Margin Results
Complex Systems
Complex Systems
SEGMENT
2012
% of Total
2011
% Change
2012
% of Total
2011
% Change
Medical
$ 27,046
49%
$ 25,377
7%
$ 82,533
51%
$ 70,072
18%
Complex Systems
12,812
23%
12,291
4%
37,921
23%
35,131
8%
DSS
19,363
35%
16,350
18%
53,126
33%
47,126
13%
Eliminations
(4,173)
-8%
(3,666)
14%
(11,329)
-7%
(9,879)
15%
Totals
$ 55,048
100%
$ 50,352
9%
$ 162,251
100%
$ 142,450
14%
SEGMENT
2012
GP %
2011
GP %
2012
GP %
2011
GP %
Medical
(a)
$ 3,487
13%
$ 3,554
14%
$ 10,984
13%
$ 9,211
13%
Complex Systems
933
7%
1,364
11%
3,327
9%
3,020
9%
DSS
4,635
24%
3,284
20%
11,824
22%
10,544
22%
Totals
$ 9,055
16%
$ 8,202
16%
$ 26,135
16%
$ 22,775
16%
(a)
Fiscal
2012
Medical
gross
margins
are
adjusted
to
remove
the
effect
of
an
acquisition
related
inventory
contingency
settlement.
($
in
000’s)
3 Months Ended March 31,
3 Months Ended March 31,
9 Months Ended March 31,
9 Months Ended March 31,
SALES
ADJUSTED GROSS MARGIN |
 8
Sales & Gross Margin Results
Sales & Gross Margin Results
Defense & Security Systems
Defense & Security Systems
SEGMENT
2012
% of Total
2011
% Change
2012
% of Total
2011
% Change
Medical
$ 27,046
49%
$ 25,377
7%
$ 82,533
51%
$ 70,072
18%
Complex Systems
12,812
23%
12,291
4%
37,921
23%
35,131
8%
DSS
19,363
35%
16,350
18%
53,126
33%
47,126
13%
Eliminations
(4,173)
-8%
(3,666)
14%
(11,329)
-7%
(9,879)
15%
Totals
$ 55,048
100%
$ 50,352
9%
$ 162,251
100%
$ 142,450
14%
SEGMENT
2012
GP %
2011
GP %
2012
GP %
2011
GP %
Medical
(a)
$ 3,487
13%
$ 3,554
14%
$ 10,984
13%
$ 9,211
13%
Complex Systems
933
7%
1,364
11%
3,327
9%
3,020
9%
DSS
4,635
24%
3,284
20%
11,824
22%
10,544
22%
Totals
$ 9,055
16%
$ 8,202
16%
$ 26,135
16%
$ 22,775
16%
(a)
Fiscal
2012
Medical
gross
margins
are
adjusted
to
remove
the
effect
of
an
acquisition
related
inventory
contingency
settlement.
($
in
000’s)
3 Months Ended March 31,
3 Months Ended March 31,
9 Months Ended March 31,
9 Months Ended March 31,
SALES
ADJUSTED GROSS MARGIN |
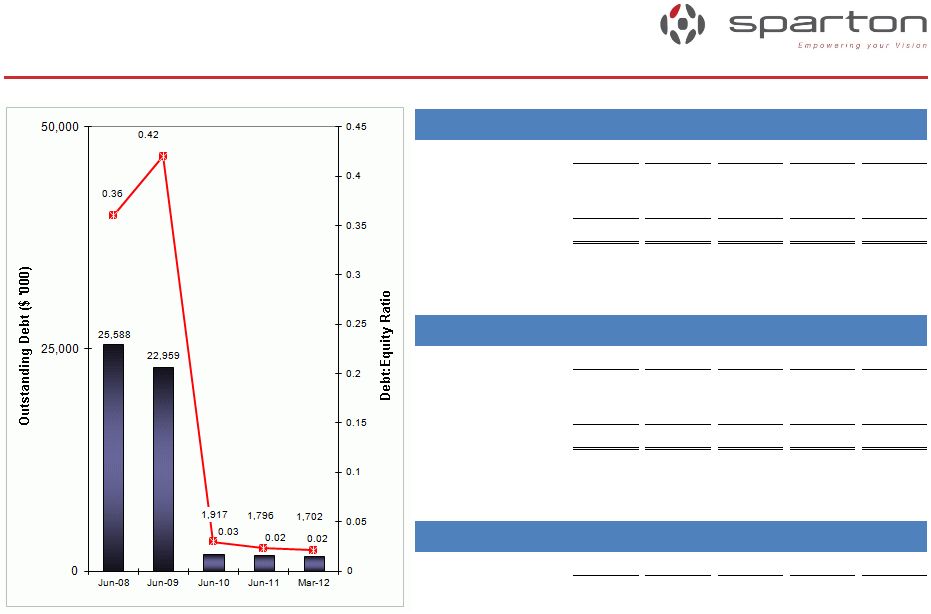 9
Liquidity & Capital Resources
Liquidity & Capital Resources
($ in '000)
Mar-11
Jun-11
Sep-11
Dec-11
Mar-12
Cash and equivalents
26,119
24,550
26,984
30,610
26,682
LOC Availability
17,497
17,541
17,533
17,290
16,469
Total
43,616
42,091
44,517
47,900
43,151
($ in '000)
Mar-11
Jun-11
Sep-11
Dec-11
Mar-12
Credit Revolver
-
-
-
-
-
IRB (Ohio)
1,826
1,796
1,766
1,735
1,702
Total
1,826
1,796
1,766
1,735
1,702
($ in '000)
Mar-11
Jun-11
Sep-11
Dec-11
Mar-12
Net Inventory
40,282
38,752
41,816
38,545
39,252
Cash Availability
Debt
Inventory |
 10
New Business Awards
New Business Awards
FY11
FY12
FY11
FY12
FY11
FY12
Q1
5
9
3
3
2,200
$
6,400
$
Q2
6
7
2
5
4,370
5,000
Q3
12
12
5
7
9,110
7,600
Q1-Q3
23
28
10
15
15,680
$
19,000
$
Q4
3
1
2,000
Total
26
11
17,680
$
Potential Future
Annualized Revenue
Programs
New Customers
New Business Awards |
 11
•
Focus on sustained profitability
–
Continue margin improvements in Complex Systems
–
Backfill Medical revenue losses with new business
–
Offset reduced U.S. Navy sonobuoy contracts with foreign sonobuoy sales
–
Continue improvements in operating performance through lean and quality
efforts •
Implementation of the strategic growth plan
–
Continue refining the new business development process to increase the new
business opportunity funnel and win more new business
–
Review the marketing initiatives to determine the most cost effective lead
generation method(s) –
Continue to exhibit in industry specific trade shows
–
Continue to invest in internal R&D for new product introductions
–
Challenge the technical staff to develop new & innovative ideas
–
Continue to look at complementary and compatible acquisitions
•
Continue to participate in investor relations events
Fiscal 2012 Outlook
Fiscal 2012 Outlook |
 12
Q & A |