Attached files
| file | filename |
|---|---|
| 8-K - 8-K - PROTECTIVE LIFE CORP | a12-11369_28k.htm |
| EX-99.1 - EX-99.1 - PROTECTIVE LIFE CORP | a12-11369_2ex99d1.htm |
Exhibit 99.2
Draft 5/8/2012

Protective Life Corporation (“PLC”)
Supplemental Schedules
First Quarter 2012
|
|
|
Draft 5/8/2012 |

ACCOUNTING CHANGES
The financial data herein reflects, for all periods presented, the adoption and retrospective application of Accounting Standards Update 2010-26 (the “Update”), which addresses diversity in practice regarding the interpretation of which costs relating to the acquisition of new or renewal insurance contracts qualify for deferral. This Update prescribes that certain incremental direct costs of successful initial or renewal contract acquisitions may be deferred. It defines incremental direct costs as those costs that result directly from and are essential to the contract transaction and would not have been incurred by the insurance entity had the contract transaction not occurred. This Update also clarifies the definition of the types of incurred costs that may be capitalized and the accounting and recognition treatment of advertising, research, and other administrative costs related to the acquisition of insurance contracts. This Update was effective for the Company on January 1, 2012.
The financial data herein also reflects, for all periods presented, a revision to the Company’s definition of operating income (loss) as it relates to embedded derivatives on our variable annuity contracts and related hedging activities, to better reflect the basis on which the performance of our business is internally assessed. This change did not impact its comparable GAAP measure income before income tax. See information related to certain non-GAAP disclosures for additional information.
|
|
Draft 5/8/2012
|

Quarterly Financial Highlights
|
(Dollars In Thousands) |
|
1ST QTR |
|
2ND QTR |
|
3RD QTR |
|
4TH QTR |
|
1ST QTR |
|
3 MOS |
| |||||||||
|
(Unaudited) |
|
2011 |
|
2011 |
|
2011 |
|
2011 |
|
2012 |
|
2011 |
|
2012 |
| |||||||
|
|
|
|
|
|
|
|
|
|
|
|
|
|
|
|
| |||||||
|
Pre-tax Operating Income (Loss) (1) |
|
|
|
|
|
|
|
|
|
|
|
|
|
|
| |||||||
|
|
|
|
|
|
|
|
|
|
|
|
|
|
|
|
| |||||||
|
Life Marketing |
|
$ |
19,273 |
|
$ |
30,263 |
|
$ |
12,777 |
|
$ |
33,810 |
|
$ |
30,369 |
|
$ |
19,273 |
|
$ |
30,369 |
|
|
Acquisitions |
|
32,391 |
|
39,429 |
|
44,028 |
|
41,545 |
|
39,099 |
|
32,391 |
|
39,099 |
| |||||||
|
Annuities |
|
18,640 |
|
17,178 |
|
20,176 |
|
24,230 |
|
35,783 |
|
18,640 |
|
35,783 |
| |||||||
|
Stable Value Products |
|
9,195 |
|
19,142 |
|
14,217 |
|
14,226 |
|
12,646 |
|
9,195 |
|
12,646 |
| |||||||
|
Asset Protection |
|
6,852 |
|
5,685 |
|
6,164 |
|
6,706 |
|
4,966 |
|
6,852 |
|
4,966 |
| |||||||
|
Corporate & Other |
|
10,021 |
|
3,977 |
|
(3,815 |
) |
(4,416 |
) |
27,880 |
|
10,021 |
|
27,880 |
| |||||||
|
Total Pre-tax Operating Income |
|
$ |
96,372 |
|
$ |
115,674 |
|
$ |
93,547 |
|
$ |
116,101 |
|
$ |
150,743 |
|
$ |
96,372 |
|
$ |
150,743 |
|
|
|
|
|
|
|
|
|
|
|
|
|
|
|
|
|
| |||||||
|
Balance Sheet Data |
|
|
|
|
|
|
|
|
|
|
|
|
|
|
| |||||||
|
|
|
|
|
|
|
|
|
|
|
|
|
|
|
|
| |||||||
|
Total GAAP Assets |
|
$ |
47,524,453 |
|
$ |
50,212,328 |
|
$ |
51,244,311 |
|
$ |
52,143,369 |
|
$ |
53,322,272 |
|
|
|
|
| ||
|
Total Protective Life Corporation’s Shareowners’ Equity |
|
$ |
2,919,665 |
|
$ |
3,104,801 |
|
$ |
3,579,515 |
|
$ |
3,711,517 |
|
$ |
3,785,810 |
|
|
|
|
| ||
|
Total Protective Life Corporation’s Shareowners’ Equity (excluding accumulated other comprehensive income (loss)) (2) |
|
$ |
2,584,721 |
|
$ |
2,635,730 |
|
$ |
2,673,447 |
|
$ |
2,726,073 |
|
$ |
2,784,007 |
|
|
|
|
| ||
|
|
|
|
|
|
|
|
|
|
|
|
|
|
|
|
| |||||||
|
Stock Data |
|
|
|
|
|
|
|
|
|
|
|
|
|
|
| |||||||
|
|
|
|
|
|
|
|
|
|
|
|
|
|
|
|
| |||||||
|
Closing Price |
|
$ |
26.55 |
|
$ |
23.13 |
|
$ |
15.63 |
|
$ |
22.56 |
|
$ |
29.62 |
|
|
|
|
| ||
|
Average Shares Outstanding |
|
|
|
|
|
|
|
|
|
|
|
|
|
|
| |||||||
|
Basic |
|
86,603,228 |
|
86,346,216 |
|
84,722,232 |
|
83,205,456 |
|
82,330,330 |
|
86,603,228 |
|
82,330,330 |
| |||||||
|
Diluted |
|
87,820,085 |
|
87,653,731 |
|
86,004,571 |
|
84,464,572 |
|
83,921,135 |
|
87,820,085 |
|
83,921,135 |
| |||||||
(1) “Pre-tax Operating Income (Loss)” is a non-GAAP financial measure. “Income (loss) Before Income Tax” is a GAAP financial measure to which “Pre-tax Operating Income” may be compared.
See Page 6 for a reconciliation of “Pre-tax Operating Income” to “Income (loss) Before Income Tax”.
(2) “Total Protective Life Corporation’s Shareowners’ equity excluding accumulated other comprehensive income (loss)” is a non-GAAP financial measure. “Total Protective Life Corporation’s Shareowners’ equity” is a GAAP financial measure to which “Total Protective Life Corporation’s Shareowners’ equity excluding accumulated other comprehensive income (loss)” may be compared.
See Page 5 for a reconciliation of “Total Protective Life Corporation’s Shareowners’ equity excluding accumulated other comprehensive income (loss)” to “Total Protective Life Corporation’s Shareowners’ equity”.
|
|
Draft 5/8/2012
|

Financial Strength Ratings as of March 31, 2012
|
|
|
A.M. Best |
|
Fitch |
|
Standard & Poor’s |
|
Moody’s |
|
|
Legal Entity |
|
|
|
|
|
|
|
|
|
|
|
|
|
|
|
|
|
|
|
|
|
Insurance companies: |
|
|
|
|
|
|
|
|
|
|
Protective Life Insurance Company |
|
A+ |
|
A |
|
AA- |
|
A2 |
|
|
West Coast Life Insurance Company |
|
A+ |
|
A |
|
AA- |
|
A2 |
|
|
Protective Life and Annuity Insurance Company |
|
A+ |
|
A |
|
AA- |
|
— |
|
|
Lyndon Property Insurance Company |
|
A- |
|
— |
|
— |
|
— |
|
|
|
Draft 5/8/2012
|

GAAP Consolidated Statements of Income
|
(Dollars In Thousands) |
|
1ST QTR |
|
2ND QTR |
|
3RD QTR |
|
4TH QTR |
|
1ST QTR |
|
3 MOS |
| |||||||||
|
(Unaudited) |
|
2011 |
|
2011 |
|
2011 |
|
2011 |
|
2012 |
|
2011 |
|
2012 |
| |||||||
|
|
|
|
|
|
|
|
|
|
|
|
|
|
|
|
| |||||||
|
REVENUES |
|
|
|
|
|
|
|
|
|
|
|
|
|
|
| |||||||
|
Gross Premiums and Policy Fees |
|
$ |
666,343 |
|
$ |
716,586 |
|
$ |
696,978 |
|
$ |
720,233 |
|
$ |
696,305 |
|
$ |
666,343 |
|
$ |
696,305 |
|
|
Reinsurance Ceded |
|
(331,808 |
) |
(364,248 |
) |
(326,967 |
) |
(371,652 |
) |
(304,558 |
) |
(331,808 |
) |
(304,558 |
) | |||||||
|
Net Premiums and Policy Fees |
|
334,535 |
|
352,338 |
|
370,011 |
|
348,581 |
|
391,747 |
|
334,535 |
|
391,747 |
| |||||||
|
Net investment income |
|
444,213 |
|
448,785 |
|
462,926 |
|
464,719 |
|
462,121 |
|
444,213 |
|
462,121 |
| |||||||
|
RIGL - Derivatives |
|
(12,686 |
) |
(34,993 |
) |
(97,816 |
) |
(9,756 |
) |
(29,909 |
) |
(12,686 |
) |
(29,909 |
) | |||||||
|
RIGL - All Other Investments |
|
4,472 |
|
58,917 |
|
138,230 |
|
33,296 |
|
35,726 |
|
4,472 |
|
35,726 |
| |||||||
|
|
|
|
|
|
|
|
|
|
|
|
|
|
|
|
| |||||||
|
OTTI losses |
|
(16,021 |
) |
(15,632 |
) |
(6,259 |
) |
(24,420 |
) |
(34,420 |
) |
(16,021 |
) |
(34,420 |
) | |||||||
|
Portion recognized in OCI (before taxes) |
|
10,358 |
|
6,145 |
|
(3,570 |
) |
1,957 |
|
15,656 |
|
10,358 |
|
15,656 |
| |||||||
|
Net OTTI losses recognized in earnings |
|
(5,663 |
) |
(9,487 |
) |
(9,829 |
) |
(22,463 |
) |
(18,764 |
) |
(5,663 |
) |
(18,764 |
) | |||||||
|
Other income |
|
72,209 |
|
87,224 |
|
75,859 |
|
72,520 |
|
111,260 |
|
72,209 |
|
111,260 |
| |||||||
|
Total Revenues |
|
837,080 |
|
902,784 |
|
939,381 |
|
886,897 |
|
952,181 |
|
837,080 |
|
952,181 |
| |||||||
|
|
|
|
|
|
|
|
|
|
|
|
|
|
|
|
| |||||||
|
BENEFITS & EXPENSES |
|
|
|
|
|
|
|
|
|
|
|
|
|
|
| |||||||
|
Benefits and settlement expenses |
|
536,369 |
|
551,553 |
|
592,792 |
|
552,759 |
|
589,629 |
|
536,369 |
|
589,629 |
| |||||||
|
Amortization of deferred policy acquisition costs and value of business acquired |
|
65,226 |
|
65,718 |
|
71,740 |
|
62,309 |
|
56,836 |
|
65,226 |
|
56,836 |
| |||||||
|
Other operating expenses |
|
105,220 |
|
110,672 |
|
112,512 |
|
109,375 |
|
116,255 |
|
105,220 |
|
116,255 |
| |||||||
|
Interest expense - subsidiaries |
|
6,666 |
|
7,108 |
|
7,168 |
|
7,081 |
|
6,109 |
|
6,666 |
|
6,109 |
| |||||||
|
Interest expense - holding company - other debt |
|
23,484 |
|
23,493 |
|
23,482 |
|
23,335 |
|
23,372 |
|
23,484 |
|
23,372 |
| |||||||
|
Interest expense - holding company - hybrid securities |
|
9,401 |
|
9,401 |
|
9,401 |
|
9,401 |
|
9,401 |
|
9,401 |
|
9,401 |
| |||||||
|
Total Benefits and Expenses |
|
746,366 |
|
767,945 |
|
817,095 |
|
764,260 |
|
801,602 |
|
746,366 |
|
801,602 |
| |||||||
|
|
|
|
|
|
|
|
|
|
|
|
|
|
|
|
| |||||||
|
INCOME BEFORE INCOME TAX |
|
90,714 |
|
134,839 |
|
122,286 |
|
122,637 |
|
150,579 |
|
90,714 |
|
150,579 |
| |||||||
|
Income tax expense |
|
31,887 |
|
46,920 |
|
39,429 |
|
36,603 |
|
51,558 |
|
31,887 |
|
51,558 |
| |||||||
|
NET INCOME |
|
58,827 |
|
87,919 |
|
82,857 |
|
86,034 |
|
99,021 |
|
58,827 |
|
99,021 |
| |||||||
|
Less: Net Income (loss) attributable to noncontrolling interests |
|
(51 |
) |
296 |
|
— |
|
— |
|
— |
|
(51 |
) |
— |
| |||||||
|
NET INCOME AVAILABLE TO PLC’S COMMON SHAREOWNERS |
|
$ |
58,878 |
|
$ |
87,623 |
|
$ |
82,857 |
|
$ |
86,034 |
|
$ |
99,021 |
|
$ |
58,878 |
|
$ |
99,021 |
|
|
|
|
|
|
|
|
|
|
|
|
|
|
|
|
|
| |||||||
|
PER SHARE DATA FOR QUARTER |
|
|
|
|
|
|
|
|
|
|
|
|
|
|
| |||||||
|
Operating income-diluted (1) |
|
$ |
0.71 |
|
$ |
0.86 |
|
$ |
0.74 |
|
$ |
0.97 |
|
$ |
1.18 |
|
|
|
|
| ||
|
RIGL - Derivatives net of gains related to corp debt, investments and annuities |
|
(0.06 |
) |
(0.22 |
) |
(0.69 |
) |
(0.03 |
) |
(0.18 |
) |
|
|
|
| |||||||
|
RIGL - All Other Investments |
|
0.02 |
|
0.36 |
|
0.91 |
|
0.08 |
|
0.18 |
|
|
|
|
| |||||||
|
Net income available to PLC’s common shareowners-diluted |
|
$ |
0.67 |
|
$ |
1.00 |
|
$ |
0.96 |
|
$ |
1.02 |
|
$ |
1.18 |
|
|
|
|
| ||
|
Average shares outstanding-diluted |
|
87,820,085 |
|
87,653,731 |
|
86,004,571 |
|
84,464,572 |
|
83,921,135 |
|
|
|
|
| |||||||
|
Dividends paid |
|
$ |
0.14 |
|
$ |
0.16 |
|
$ |
0.16 |
|
$ |
0.16 |
|
$ |
0.16 |
|
|
|
|
| ||
|
PER SHARE DATA FOR YTD |
|
|
|
|
|
|
|
|
|
|
|
|
|
|
| |||||||
|
Operating income-diluted (1) |
|
$ |
0.71 |
|
$ |
1.57 |
|
$ |
2.32 |
|
$ |
3.28 |
|
$ |
1.18 |
|
|
|
|
| ||
|
RIGL - Derivatives net of gains related to corp debt, investments and annuities |
|
(0.06 |
) |
(0.28 |
) |
(0.97 |
) |
(1.00 |
) |
(0.18 |
) |
|
|
|
| |||||||
|
RIGL - All Other Investments |
|
0.02 |
|
0.38 |
|
1.28 |
|
1.37 |
|
0.18 |
|
|
|
|
| |||||||
|
Net income available to PLC’s common shareowners-diluted |
|
$ |
0.67 |
|
$ |
1.67 |
|
$ |
2.63 |
|
$ |
3.65 |
|
$ |
1.18 |
|
|
|
|
| ||
|
Average shares outstanding-diluted |
|
87,820,085 |
|
87,736,449 |
|
87,152,812 |
|
86,475,229 |
|
83,921,135 |
|
|
|
|
| |||||||
|
Dividends paid |
|
$ |
0.14 |
|
$ |
0.30 |
|
$ |
0.46 |
|
$ |
0.62 |
|
$ |
0.16 |
|
|
|
|
| ||
(1) “Operating Income” is a non-GAAP financial measure. “Net income available to PLC’s common shareowners” is a GAAP financial measure to which “Operating Income” may be compared.
|
|
Page 4 |

GAAP Consolidated Balance Sheets
|
(Dollars In Thousands) |
|
1ST QTR |
|
2ND QTR |
|
3RD QTR |
|
4TH QTR |
|
1ST QTR |
| |||||
|
(Unaudited) |
|
2011 |
|
2011 |
|
2011 |
|
2011 |
|
2012 |
| |||||
|
ASSETS |
|
|
|
|
|
|
|
|
|
|
| |||||
|
|
|
|
|
|
|
|
|
|
|
|
| |||||
|
Fixed maturities |
|
$ |
24,676,049 |
|
$ |
26,133,625 |
|
$ |
27,855,004 |
|
$ |
27,983,446 |
|
$ |
28,189,744 |
|
|
Equity securities |
|
352,927 |
|
349,738 |
|
327,802 |
|
335,232 |
|
360,527 |
| |||||
|
Mortgage loans |
|
4,873,678 |
|
5,349,851 |
|
5,377,977 |
|
5,353,481 |
|
5,314,496 |
| |||||
|
Investment real estate |
|
21,884 |
|
23,737 |
|
27,495 |
|
29,899 |
|
31,527 |
| |||||
|
Policy loans |
|
784,320 |
|
881,757 |
|
880,203 |
|
879,819 |
|
877,850 |
| |||||
|
Other long-term investments |
|
276,291 |
|
297,825 |
|
284,550 |
|
257,714 |
|
324,001 |
| |||||
|
Long-term investments |
|
30,985,149 |
|
33,036,533 |
|
34,753,031 |
|
34,839,591 |
|
35,098,145 |
| |||||
|
Short-term investments |
|
406,676 |
|
134,698 |
|
80,387 |
|
101,489 |
|
110,194 |
| |||||
|
Total investments |
|
31,391,825 |
|
33,171,231 |
|
34,833,418 |
|
34,941,080 |
|
35,208,339 |
| |||||
|
Cash |
|
230,938 |
|
419,210 |
|
332,487 |
|
267,298 |
|
175,353 |
| |||||
|
Accrued investment income |
|
343,181 |
|
345,906 |
|
363,548 |
|
350,580 |
|
362,837 |
| |||||
|
Accounts and premiums receivable |
|
63,547 |
|
68,559 |
|
60,008 |
|
84,754 |
|
90,372 |
| |||||
|
Reinsurance receivable |
|
5,659,191 |
|
5,730,025 |
|
5,645,080 |
|
5,645,471 |
|
5,674,662 |
| |||||
|
Deferred policy acquisition costs and value of business acquired |
|
3,114,003 |
|
3,252,931 |
|
3,221,007 |
|
3,248,041 |
|
3,234,596 |
| |||||
|
Goodwill |
|
113,983 |
|
113,209 |
|
112,434 |
|
111,659 |
|
110,884 |
| |||||
|
Property and equipment, net |
|
42,585 |
|
43,142 |
|
45,997 |
|
48,578 |
|
48,596 |
| |||||
|
Other assets |
|
176,778 |
|
180,602 |
|
201,516 |
|
150,549 |
|
163,360 |
| |||||
|
Current/Deferred income tax |
|
29,422 |
|
39,936 |
|
11,142 |
|
50,783 |
|
— |
| |||||
|
Assets related to separate accounts |
|
|
|
|
|
|
|
|
|
|
| |||||
|
Variable annuity |
|
5,797,956 |
|
6,291,158 |
|
5,947,391 |
|
6,741,959 |
|
7,698,456 |
| |||||
|
Variable universal life |
|
561,044 |
|
556,419 |
|
470,283 |
|
502,617 |
|
554,817 |
| |||||
|
|
|
|
|
|
|
|
|
|
|
|
| |||||
|
TOTAL ASSETS |
|
$ |
47,524,453 |
|
$ |
50,212,328 |
|
$ |
51,244,311 |
|
$ |
52,143,369 |
|
$ |
53,322,272 |
|
|
|
Page 5 |

GAAP Consolidated Balance Sheets - Continued
|
(Dollars In Thousands) |
|
1ST QTR |
|
2ND QTR |
|
3RD QTR |
|
4TH QTR |
|
1ST QTR |
| |||||
|
(Unaudited) |
|
2011 |
|
2011 |
|
2011 |
|
2011 |
|
2012 |
| |||||
|
|
|
|
|
|
|
|
|
|
|
|
| |||||
|
LIABILITIES |
|
|
|
|
|
|
|
|
|
|
| |||||
|
Policy liabilities and accruals |
|
|
|
|
|
|
|
|
|
|
| |||||
|
Future policy benefits and claims |
|
$ |
18,727,050 |
|
$ |
20,619,144 |
|
$ |
20,665,267 |
|
$ |
20,867,989 |
|
$ |
20,981,983 |
|
|
Unearned premiums |
|
1,201,591 |
|
1,225,066 |
|
1,244,457 |
|
1,258,785 |
|
1,283,441 |
| |||||
|
Stable value product deposits |
|
2,664,139 |
|
2,565,235 |
|
2,827,862 |
|
2,769,510 |
|
2,772,378 |
| |||||
|
Annuity deposits |
|
10,781,341 |
|
10,899,995 |
|
10,975,016 |
|
10,946,848 |
|
10,856,119 |
| |||||
|
Other policyholders’ funds |
|
557,378 |
|
589,879 |
|
575,056 |
|
546,516 |
|
537,909 |
| |||||
|
Repurchase program borrowings |
|
— |
|
— |
|
157,103 |
|
— |
|
221,569 |
| |||||
|
Other liabilities |
|
975,974 |
|
964,392 |
|
1,196,554 |
|
1,065,451 |
|
1,055,568 |
| |||||
|
Mortgage loan backed certificates |
|
51,540 |
|
42,862 |
|
32,471 |
|
19,755 |
|
8,834 |
| |||||
|
Deferred income taxes |
|
781,515 |
|
896,221 |
|
1,139,532 |
|
1,260,629 |
|
1,241,670 |
| |||||
|
Income tax payable |
|
— |
|
— |
|
— |
|
— |
|
22,725 |
| |||||
|
Non-recourse funding obligations |
|
496,700 |
|
438,300 |
|
414,800 |
|
407,800 |
|
297,000 |
| |||||
|
Debt |
|
1,484,852 |
|
1,494,852 |
|
1,495,000 |
|
1,520,000 |
|
1,480,000 |
| |||||
|
Subordinated debt securities |
|
524,743 |
|
524,743 |
|
524,743 |
|
524,743 |
|
524,743 |
| |||||
|
Liabilities related to separate accounts |
|
|
|
|
|
|
|
|
|
|
| |||||
|
Variable annuity |
|
5,797,956 |
|
6,291,158 |
|
5,947,391 |
|
6,741,959 |
|
7,698,456 |
| |||||
|
Variable universal life |
|
561,044 |
|
556,419 |
|
470,283 |
|
502,617 |
|
554,817 |
| |||||
|
TOTAL LIABILITIES |
|
44,605,823 |
|
47,108,266 |
|
47,665,535 |
|
48,432,602 |
|
49,537,212 |
| |||||
|
|
|
|
|
|
|
|
|
|
|
|
| |||||
|
SHAREOWNERS’ EQUITY |
|
|
|
|
|
|
|
|
|
|
| |||||
|
Common stock |
|
44,388 |
|
44,388 |
|
44,388 |
|
44,388 |
|
44,388 |
| |||||
|
Additional paid-in-capital |
|
590,783 |
|
592,451 |
|
594,084 |
|
598,106 |
|
593,930 |
| |||||
|
Treasury stock |
|
(25,763 |
) |
(50,326 |
) |
(83,549 |
) |
(107,740 |
) |
(131,578 |
) | |||||
|
Retained earnings |
|
1,975,313 |
|
2,049,217 |
|
2,118,524 |
|
2,191,319 |
|
2,277,267 |
| |||||
|
Accumulated other comprehensive income (loss) |
|
334,944 |
|
469,071 |
|
906,068 |
|
985,444 |
|
1,001,803 |
| |||||
|
TOTAL PROTECTIVE LIFE CORPORATION’S SHAREOWNERS’ EQUITY |
|
2,919,665 |
|
3,104,801 |
|
3,579,515 |
|
3,711,517 |
|
3,785,810 |
| |||||
|
Noncontrolling interest |
|
(1,035 |
) |
(739 |
) |
(739 |
) |
(750 |
) |
(750 |
) | |||||
|
TOTAL EQUITY |
|
2,918,630 |
|
3,104,062 |
|
3,578,776 |
|
3,710,767 |
|
3,785,060 |
| |||||
|
TOTAL LIABILITIES AND SHAREOWNERS’ EQUITY |
|
$ |
47,524,453 |
|
$ |
50,212,328 |
|
$ |
51,244,311 |
|
$ |
52,143,369 |
|
$ |
53,322,272 |
|
|
|
|
|
|
|
|
|
|
|
|
|
| |||||
|
PROTECTIVE LIFE CORPORATION’S SHAREOWNERS’ EQUITY PER SHARE |
|
|
|
|
|
|
|
|
|
|
| |||||
|
Total Protective Life Corporation’s Shareowners’ Equity |
|
$ |
34.07 |
|
$ |
36.68 |
|
$ |
43.22 |
|
$ |
45.45 |
|
$ |
46.74 |
|
|
Less: Accumulated other comprehensive income (loss) |
|
3.91 |
|
5.54 |
|
10.94 |
|
12.07 |
|
12.37 |
| |||||
|
Excluding accumulated other comprehensive income (loss) (1) |
|
$ |
30.16 |
|
$ |
31.14 |
|
$ |
32.28 |
|
$ |
33.38 |
|
$ |
34.37 |
|
|
|
|
|
|
|
|
|
|
|
|
|
| |||||
|
Total Protective Life Corporation’s Shareowners’ Equity |
|
$ |
2,919,665 |
|
$ |
3,104,801 |
|
$ |
3,579,515 |
|
$ |
3,711,517 |
|
$ |
3,785,810 |
|
|
Less: Accumulated other comprehensive income (loss) |
|
334,944 |
|
469,071 |
|
906,068 |
|
985,444 |
|
1,001,803 |
| |||||
|
Total Protective Life Corporation’s Shareowners’ Equity (excluding accumulated other comprehensive income (loss)) (1) |
|
$ |
2,584,721 |
|
$ |
2,635,730 |
|
$ |
2,673,447 |
|
$ |
2,726,073 |
|
$ |
2,784,007 |
|
|
|
|
|
|
|
|
|
|
|
|
|
| |||||
|
Common shares outstanding |
|
85,705,659 |
|
84,650,243 |
|
82,812,088 |
|
81,669,195 |
|
80,998,430 |
| |||||
|
Treasury Stock shares |
|
3,071,301 |
|
4,126,717 |
|
5,964,872 |
|
7,107,765 |
|
7,778,530 |
| |||||
(1) “Total Protective Life Corporation’s Shareowners’ equity excluding accumulated other comprehensive income (loss)” is a non-GAAP financial measure. “Total Protective Life Corporation’s Shareowners’ equity” is a GAAP financial measure to which “Total Protective Life Corporation’s Shareowners’ equity excluding accumulated other comprehensive income (loss)” may be compared.
|
|
Page 6 |

Calculation of Operating Earnings Per Share
|
(Dollars In Thousands) |
|
1ST QTR |
|
2ND QTR |
|
3RD QTR |
|
4TH QTR |
|
1ST QTR |
|
3 MOS |
| |||||||||
|
(Unaudited) |
|
2011 |
|
2011 |
|
2011 |
|
2011 |
|
2012 |
|
2011 |
|
2012 |
| |||||||
|
|
|
|
|
|
|
|
|
|
|
|
|
|
|
|
| |||||||
|
CALCULATION OF NET INCOME PER SHARE |
|
|
|
|
|
|
|
|
|
|
|
|
|
|
| |||||||
|
|
|
|
|
|
|
|
|
|
|
|
|
|
|
|
| |||||||
|
Net income available to PLC’s common shareowners |
|
$ |
58,878 |
|
$ |
87,623 |
|
$ |
82,857 |
|
$ |
86,034 |
|
$ |
99,021 |
|
$ |
58,878 |
|
$ |
99,021 |
|
|
|
|
|
|
|
|
|
|
|
|
|
|
|
|
|
| |||||||
|
Average shares outstanding-basic |
|
86,603,228 |
|
86,346,216 |
|
84,722,232 |
|
83,205,456 |
|
82,330,330 |
|
86,603,228 |
|
82,330,330 |
| |||||||
|
Average shares outstanding-diluted |
|
87,820,085 |
|
87,653,731 |
|
86,004,571 |
|
84,464,572 |
|
83,921,135 |
|
87,820,085 |
|
83,921,135 |
| |||||||
|
|
|
|
|
|
|
|
|
|
|
|
|
|
|
|
| |||||||
|
Net income available to PLC’s common shareowners per share-basic |
|
$ |
0.68 |
|
$ |
1.01 |
|
$ |
0.98 |
|
$ |
1.03 |
|
$ |
1.20 |
|
$ |
0.68 |
|
$ |
1.20 |
|
|
Net income available to PLC’s common shareowners per share-diluted |
|
$ |
0.67 |
|
$ |
1.00 |
|
$ |
0.96 |
|
$ |
1.02 |
|
$ |
1.18 |
|
$ |
0.67 |
|
$ |
1.18 |
|
|
|
|
|
|
|
|
|
|
|
|
|
|
|
|
|
| |||||||
|
Income from continuing operations |
|
$ |
58,878 |
|
$ |
87,623 |
|
$ |
82,857 |
|
$ |
86,034 |
|
$ |
99,021 |
|
$ |
58,878 |
|
$ |
99,021 |
|
|
|
|
|
|
|
|
|
|
|
|
|
|
|
|
|
| |||||||
|
EPS (basic) |
|
$ |
0.68 |
|
$ |
1.01 |
|
$ |
0.98 |
|
$ |
1.03 |
|
$ |
1.20 |
|
$ |
0.68 |
|
$ |
1.20 |
|
|
EPS (diluted) |
|
$ |
0.67 |
|
$ |
1.00 |
|
$ |
0.96 |
|
$ |
1.02 |
|
$ |
1.18 |
|
$ |
0.67 |
|
$ |
1.18 |
|
|
|
|
|
|
|
|
|
|
|
|
|
|
|
|
|
| |||||||
|
CALCULATION OF REALIZED INVESTMENT GAINS (LOSSES) PER SHARE |
|
|
|
|
|
|
|
|
|
|
|
|
|
|
| |||||||
|
|
|
|
|
|
|
|
|
|
|
|
|
|
|
|
| |||||||
|
RIGL - Derivatives |
|
$ |
(12,686 |
) |
$ |
(34,993 |
) |
$ |
(97,816 |
) |
$ |
(9,756 |
) |
$ |
(29,909 |
) |
$ |
(12,686 |
) |
$ |
(29,909 |
) |
|
VA GMWB economic cost |
|
4,345 |
|
5,153 |
|
5,902 |
|
6,481 |
|
7,240 |
|
4,345 |
|
7,240 |
| |||||||
|
RIGL - All Other Investments |
|
(1,191 |
) |
49,430 |
|
128,401 |
|
10,833 |
|
16,962 |
|
(1,191 |
) |
16,962 |
| |||||||
|
Related amortization of DAC & VOBA |
|
3,925 |
|
(721 |
) |
(7,748 |
) |
(1,022 |
) |
5,543 |
|
3,925 |
|
5,543 |
| |||||||
|
|
|
(5,607 |
) |
18,869 |
|
28,739 |
|
6,536 |
|
(164 |
) |
(5,607 |
) |
(164 |
) | |||||||
|
Tax effect |
|
1,962 |
|
(6,604 |
) |
(10,059 |
) |
(2,288 |
) |
58 |
|
1,962 |
|
58 |
| |||||||
|
|
|
$ |
(3,645 |
) |
$ |
12,265 |
|
$ |
18,680 |
|
$ |
4,248 |
|
$ |
(106 |
) |
$ |
(3,645 |
) |
$ |
(106 |
) |
|
|
|
|
|
|
|
|
|
|
|
|
|
|
|
|
| |||||||
|
RIGL - Derivatives per share-diluted |
|
$ |
(0.06 |
) |
$ |
(0.22 |
) |
$ |
(0.69 |
) |
$ |
(0.03 |
) |
$ |
(0.18 |
) |
$ |
(0.06 |
) |
$ |
(0.18 |
) |
|
RIGL - All Other Investments per share-diluted |
|
$ |
0.02 |
|
$ |
0.36 |
|
$ |
0.91 |
|
$ |
0.08 |
|
$ |
0.18 |
|
$ |
0.02 |
|
$ |
0.18 |
|
|
|
|
|
|
|
|
|
|
|
|
|
|
|
|
|
| |||||||
|
OPERATING INCOME PER SHARE (1) |
|
|
|
|
|
|
|
|
|
|
|
|
|
|
| |||||||
|
|
|
|
|
|
|
|
|
|
|
|
|
|
|
|
| |||||||
|
Net income available to PLC’s common shareowners per share-diluted |
|
$ |
0.67 |
|
$ |
1.00 |
|
$ |
0.96 |
|
$ |
1.02 |
|
$ |
1.18 |
|
$ |
0.67 |
|
$ |
1.18 |
|
|
Less: RIGL - Derivatives per share-diluted |
|
(0.06 |
) |
(0.22 |
) |
(0.69 |
) |
(0.03 |
) |
(0.18 |
) |
(0.06 |
) |
(0.18 |
) | |||||||
|
Less: RIGL - All Other Investments per share-diluted |
|
0.02 |
|
0.36 |
|
0.91 |
|
0.08 |
|
0.18 |
|
0.02 |
|
0.18 |
| |||||||
|
Operating income per share-diluted |
|
$ |
0.71 |
|
$ |
0.86 |
|
$ |
0.74 |
|
$ |
0.97 |
|
$ |
1.18 |
|
$ |
0.71 |
|
$ |
1.18 |
|
|
|
|
|
|
|
|
|
|
|
|
|
|
|
|
|
| |||||||
|
NET OPERATING INCOME (1) |
|
|
|
|
|
|
|
|
|
|
|
|
|
|
| |||||||
|
|
|
|
|
|
|
|
|
|
|
|
|
|
|
|
| |||||||
|
Net income available to PLC’s common shareowners |
|
$ |
58,878 |
|
$ |
87,623 |
|
$ |
82,857 |
|
$ |
86,034 |
|
$ |
99,021 |
|
$ |
58,878 |
|
$ |
99,021 |
|
|
Less: RIGL - Derivatives net of tax |
|
(5,422 |
) |
(19,396 |
) |
(59,744 |
) |
(2,129 |
) |
(14,735 |
) |
(5,422 |
) |
(14,735 |
) | |||||||
|
Less: RIGL - All Other Investments net of tax and amortization |
|
1,777 |
|
31,661 |
|
78,424 |
|
6,377 |
|
14,629 |
|
1,777 |
|
14,629 |
| |||||||
|
Net operating income |
|
$ |
62,523 |
|
$ |
75,358 |
|
$ |
64,177 |
|
$ |
81,786 |
|
$ |
99,127 |
|
$ |
62,523 |
|
$ |
99,127 |
|
|
|
|
|
|
|
|
|
|
|
|
|
|
|
|
|
| |||||||
|
PRE-TAX OPERATING INCOME (2) |
|
|
|
|
|
|
|
|
|
|
|
|
|
|
| |||||||
|
|
|
|
|
|
|
|
|
|
|
|
|
|
|
|
| |||||||
|
Income before income tax and discontinued operations |
|
$ |
90,714 |
|
$ |
134,839 |
|
$ |
122,286 |
|
$ |
122,637 |
|
$ |
150,579 |
|
$ |
90,714 |
|
$ |
150,579 |
|
|
Less: RIGL - Derivatives |
|
(12,686 |
) |
(34,993 |
) |
(97,816 |
) |
(9,756 |
) |
(29,909 |
) |
(12,686 |
) |
(29,909 |
) | |||||||
|
Less: VA GMWB economic cost |
|
4,345 |
|
5,153 |
|
5,902 |
|
6,481 |
|
7,240 |
|
4,345 |
|
7,240 |
| |||||||
|
Less: RIGL - All Other Investments |
|
(1,191 |
) |
49,430 |
|
128,401 |
|
10,833 |
|
16,962 |
|
(1,191 |
) |
16,962 |
| |||||||
|
Less: Related amortization of DAC & VOBA |
|
3,925 |
|
(721 |
) |
(7,748 |
) |
(1,022 |
) |
5,543 |
|
3,925 |
|
5,543 |
| |||||||
|
Less: Minority Interest |
|
(51 |
) |
296 |
|
— |
|
— |
|
— |
|
(51 |
) |
— |
| |||||||
|
Pre-tax operating income |
|
$ |
96,372 |
|
$ |
115,674 |
|
$ |
93,547 |
|
$ |
116,101 |
|
$ |
150,743 |
|
$ |
96,372 |
|
$ |
150,743 |
|
(1) “Net Operating Income” and “Operating Income Per Share” are non-GAAP financial measures. “Net Income available to PLC’s common shareowners” and “Net Income available to PLC’s common shareowners Per Share” are GAAP financial measures to which “Net Operating Income” and “Operating Income Per Share” may be compared.
(2) “Pre-tax Operating Income” is a non-GAAP financial measure. “Income Before Income Tax” is a GAAP financial measure to which “Pre-tax Operating Income” may be compared.
|
|
|
Page 7 |

Invested Asset Summary
|
(Dollars In Millions) |
|
1ST QTR |
|
2ND QTR |
|
3RD QTR |
|
4TH QTR |
|
1ST QTR |
|
|
| |||||
|
(Unaudited) |
|
2011 |
|
2011 |
|
2011 |
|
2011 |
|
2012 |
|
|
| |||||
|
|
|
|
|
|
|
|
|
|
|
|
|
|
| |||||
|
Total Portfolio |
|
|
|
|
|
|
|
|
|
|
|
|
| |||||
|
|
|
|
|
|
|
|
|
|
|
|
|
|
| |||||
|
Fixed Maturities |
|
$ |
24,676.0 |
|
$ |
26,133.6 |
|
$ |
27,855.0 |
|
$ |
27,983.5 |
|
$ |
28,189.7 |
|
80 |
% |
|
Mortgage Loans |
|
4,873.7 |
|
5,349.9 |
|
5,378.0 |
|
5,353.5 |
|
5,314.5 |
|
15 |
% | |||||
|
Investment Real Estate |
|
21.9 |
|
23.7 |
|
27.5 |
|
29.9 |
|
31.5 |
|
0 |
% | |||||
|
Equity Securities |
|
352.9 |
|
349.7 |
|
327.8 |
|
335.2 |
|
360.5 |
|
1 |
% | |||||
|
Policy Loans |
|
784.3 |
|
881.8 |
|
880.2 |
|
879.8 |
|
877.9 |
|
3 |
% | |||||
|
Short-Term Investments |
|
406.7 |
|
134.7 |
|
80.4 |
|
101.5 |
|
110.2 |
|
0 |
% | |||||
|
Other Long-Term Investments |
|
276.3 |
|
297.8 |
|
284.5 |
|
257.7 |
|
324.0 |
|
1 |
% | |||||
|
Total Invested Assets |
|
$ |
31,391.8 |
|
$ |
33,171.2 |
|
$ |
34,833.4 |
|
$ |
34,941.1 |
|
$ |
35,208.3 |
|
100 |
% |

|
|
|
Page 8 |

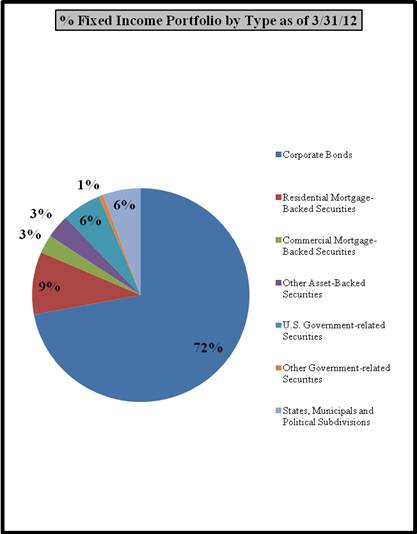
Invested Asset Summary - Fixed Income
|
(Dollars In Millions) |
|
1ST QTR |
|
2ND QTR |
|
3RD QTR |
|
4TH QTR |
|
1ST QTR |
|
|
| |||||
|
(Unaudited) |
|
2011 |
|
2011 |
|
2011 |
|
2011 |
|
2012 |
|
|
| |||||
|
|
|
|
|
|
|
|
|
|
|
|
|
|
| |||||
|
Fixed Income |
|
|
|
|
|
|
|
|
|
|
|
|
| |||||
|
|
|
|
|
|
|
|
|
|
|
|
|
|
| |||||
|
Corporate Bonds |
|
$ |
17,638.5 |
|
$ |
18,741.8 |
|
$ |
19,856.5 |
|
$ |
20,148.4 |
|
$ |
20,321.8 |
|
72 |
% |
|
Residential Mortgage-Backed Securities |
|
2,633.8 |
|
2,702.2 |
|
2,827.2 |
|
2,656.1 |
|
2,664.5 |
|
9 |
% | |||||
|
Commercial Mortgage-Backed Securities |
|
316.4 |
|
452.6 |
|
640.3 |
|
741.8 |
|
785.1 |
|
3 |
% | |||||
|
Other Asset-Backed Securities |
|
1,062.1 |
|
1,029.1 |
|
953.7 |
|
971.0 |
|
996.8 |
|
3 |
% | |||||
|
U.S. Government-related Securities |
|
1,607.7 |
|
1,577.2 |
|
1,813.4 |
|
1,771.5 |
|
1,645.1 |
|
6 |
% | |||||
|
Other Government-related Securities |
|
262.2 |
|
232.5 |
|
192.0 |
|
137.9 |
|
180.0 |
|
1 |
% | |||||
|
States, Municipals and Political Subdivisions |
|
1,155.3 |
|
1,398.2 |
|
1,571.9 |
|
1,556.8 |
|
1,596.4 |
|
6 |
% | |||||
|
Total Fixed Income Portfolio |
|
$ |
24,676.0 |
|
$ |
26,133.6 |
|
$ |
27,855.0 |
|
$ |
27,983.5 |
|
$ |
28,189.7 |
|
100 |
% |
|
|
|
|
|
|
|
|
|
|
|
|
|
|
| |||||
|
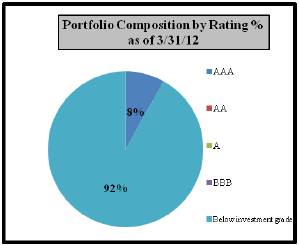
Fixed Income - Quality |
|
|
|
|
|
|
|
|
|
|
|
|
| |||||
|
|
|
|
|
|
|
|
|
|
|
|
|
|
| |||||
|
AAA |
|
16.9 |
% |
17.3 |
% |
17.6 |
% |
16.5 |
% |
16.2 |
% |
|
| |||||
|
AA |
|
6.5 |
% |
6.8 |
% |
7.9 |
% |
8.0 |
% |
8.0 |
% |
|
| |||||
|
A |
|
21.8 |
% |
25.2 |
% |
26.7 |
% |
27.5 |
% |
28.7 |
% |
|
| |||||
|
BBB |
|
45.1 |
% |
42.5 |
% |
40.4 |
% |
41.0 |
% |
39.5 |
% |
|
| |||||
|
Below investment grade |
|
9.7 |
% |
8.2 |
% |
7.4 |
% |
7.0 |
% |
7.6 |
% |
|
| |||||
|
|
|
100.0 |
% |
100.0 |
% |
100.0 |
% |
100.0 |
% |
100.0 |
% |
|
| |||||
Note: Prior period ratings and investment classifications have been restated to be consistent with current quarter presentation.
|
|
|
Page 9 |

Fixed Maturities by NAIC Rating
STAT Carry Value % of Total
|
|
|
1ST QTR |
|
2ND QTR |
|
3RD QTR |
|
4TH QTR |
|
1ST QTR |
|
|
(Unaudited) |
|
2011 |
|
2011 |
|
2011 |
|
2011 |
|
2012 |
|
|
|
|
|
|
|
|
|
|
|
|
|
|
|
NAIC Rating |
|
|
|
|
|
|
|
|
|
|
|
|
1 |
|
52.50 |
% |
55.32 |
% |
57.10 |
% |
56.07 |
% |
55.97 |
% |
|
2 |
|
42.31 |
% |
40.33 |
% |
38.61 |
% |
38.92 |
% |
38.64 |
% |
|
3 |
|
2.79 |
% |
2.31 |
% |
2.28 |
% |
2.80 |
% |
3.47 |
% |
|
4 |
|
1.18 |
% |
1.01 |
% |
1.11 |
% |
1.31 |
% |
0.76 |
% |
|
5 |
|
0.72 |
% |
0.87 |
% |
0.75 |
% |
0.73 |
% |
0.96 |
% |
|
6 |
|
0.50 |
% |
0.16 |
% |
0.15 |
% |
0.17 |
% |
0.20 |
% |
|
|
|
|
|
|
|
|
|
|
|
|
|
|
|
|
100.00 |
% |
100.00 |
% |
100.00 |
% |
100.00 |
% |
100.00 |
% |
|
|
|
|
|
|
|
|
|
|
|
|
|
|
Below investment grade (using NAIC 3-6) |
|
5.19 |
% |
4.35 |
% |
4.29 |
% |
5.01 |
% |
5.39 |
% |
Note: NAIC Ratings reflect statutory carrying values
|
|
|

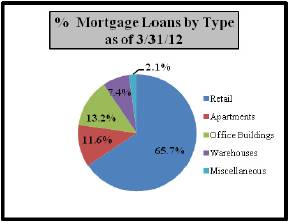
Invested Asset Summary - Mortgages
|
(Dollars In Millions) |
|
1ST QTR |
|
2ND QTR |
|
3RD QTR |
|
4TH QTR |
|
1ST QTR |
| |||||
|
(Unaudited) |
|
2011 |
|
2011 |
|
2011 |
|
2011 |
|
2012 |
| |||||
|
|
|
|
|
|
|
|
|
|
|
|
| |||||
|
Mortgage Loans - Type |
|
|
|
|
|
|
|
|
|
|
| |||||
|
|
|
|
|
|
|
|
|
|
|
|
| |||||
|
Retail |
|
66.6 |
% |
64.4 |
% |
65.4 |
% |
65.7 |
% |
65.7 |
% | |||||
|
Apartments |
|
11.9 |
% |
11.4 |
% |
11.0 |
% |
11.3 |
% |
11.6 |
% | |||||
|
Office Buildings |
|
12.6 |
% |
14.1 |
% |
13.7 |
% |
13.4 |
% |
13.2 |
% | |||||
|
Warehouses |
|
6.9 |
% |
8.0 |
% |
7.7 |
% |
7.6 |
% |
7.4 |
% | |||||
|
Miscellaneous |
|
2.0 |
% |
2.1 |
% |
2.2 |
% |
2.0 |
% |
2.1 |
% | |||||
|
|
|
100.0 |
% |
100.0 |
% |
100.0 |
% |
100.0 |
% |
100.0 |
% | |||||
|
|
|
|
|
|
|
|
|
|
|
|
| |||||
|
Delinquent Loans & Foreclosed Properties |
|
|
|
|
|
|
|
|
|
|
| |||||
|
|
|
|
|
|
|
|
|
|
|
|
| |||||
|
60 Days Past Due (1) |
|
$ |
— |
|
$ |
10.3 |
|
$ |
6.9 |
|
$ |
2.4 |
|
$ |
5.3 |
|
|
90 Days Past Due |
|
12.5 |
|
15.7 |
|
16.2 |
|
12.5 |
|
5.6 |
| |||||
|
Renegotiated Loans (2) |
|
16.1 |
|
16.1 |
|
16.1 |
|
16.1 |
|
— |
| |||||
|
Foreclosed Real Estate |
|
1.6 |
|
1.7 |
|
5.5 |
|
10.4 |
|
2.7 |
| |||||
|
|
|
$ |
30.2 |
|
$ |
43.8 |
|
$ |
44.7 |
|
$ |
41.4 |
|
$ |
13.6 |
|
|
|
|
|
|
|
|
|
|
|
|
|
| |||||
|
% of Commercial Mortgage Loan Portfolio |
|
0.6 |
% |
0.8 |
% |
0.8 |
% |
0.8 |
% |
0.3 |
% | |||||
(1) Includes $2.3 million of nonperforming loans subject to a pooling and servicing agreement for 4Q11 and 1Q12
(2) Loans restructured under the terms of a pooling and servicing agreement.
|
|
Draft 5/8/2012
|

Invested Asset Summary - Trading Portfolios
|
(Dollars In Millions) |
|
1ST QTR |
|
2ND QTR |
|
3RD QTR |
|
4TH QTR |
|
1ST QTR |
| |||||
|
(Unaudited) |
|
2011 |
|
2011 |
|
2011 |
|
2011 |
|
2012 |
| |||||
|
|
|
|
|
|
|
|
|
|
|
|
| |||||
|
Trading Portfolio Composition (excl. Modco Trading Portfolio) |
|
|
|
|
|
|
|
|
|
|
| |||||
|
|
|
|
|
|
|
|
|
|
|
|
| |||||
|
Rating |
|
|
|
|
|
|
|
|
|
|
| |||||
|
AAA |
|
$ |
7.9 |
|
$ |
3.0 |
|
$ |
2.6 |
|
$ |
2.2 |
|
$ |
1.7 |
|
|
AA |
|
0.7 |
|
— |
|
— |
|
— |
|
— |
| |||||
|
A |
|
— |
|
— |
|
— |
|
— |
|
— |
| |||||
|
BBB |
|
13.2 |
|
6.0 |
|
— |
|
— |
|
— |
| |||||
|
Below investment grade |
|
48.1 |
|
20.7 |
|
23.8 |
|
21.0 |
|
19.1 |
| |||||
|
Total |
|
$ |
69.9 |
|
$ |
29.7 |
|
$ |
26.4 |
|
$ |
23.2 |
|
$ |
20.8 |
|
|
Modco Trading Portfolio |
|
|
|
|
|
|
|
|
|
|
| |||||
|
|
|
|
|
|
|
|
|
|
|
|
| |||||
|
Rating |
|
|
|
|
|
|
|
|
|
|
| |||||
|
AAA |
|
$ |
789.0 |
|
$ |
768.0 |
|
$ |
871.5 |
|
$ |
845.5 |
|
$ |
607.9 |
|
|
AA |
|
296.8 |
|
316.5 |
|
325.2 |
|
267.4 |
|
259.6 |
| |||||
|
A |
|
589.2 |
|
693.1 |
|
654.5 |
|
702.9 |
|
742.3 |
| |||||
|
BBB |
|
871.4 |
|
869.4 |
|
888.8 |
|
909.3 |
|
1,007.5 |
| |||||
|
Below investment grade |
|
233.1 |
|
210.1 |
|
231.9 |
|
211.7 |
|
338.8 |
| |||||
|
Short-term investments |
|
155.4 |
|
102.2 |
|
67.6 |
|
85.8 |
|
63.6 |
| |||||
|
Total |
|
$ |
2,934.9 |
|
$ |
2,959.3 |
|
$ |
3,039.5 |
|
$ |
3,022.6 |
|
$ |
3,019.7 |
|
Note: Prior period ratings have been restated to be consistent with current quarter presentation.

|
|
Draft 5/8/2012
|

Invested Asset Summary - MBS - Alt-A
Mortgage-backed Securities Collateralized by Alt-A Mortgage Loans as of March 31, 2012:
|
(Dollars In Millions) |
|
2008 and |
|
|
|
|
|
|
|
|
|
|
| ||||||
|
(Unaudited) |
|
Prior |
|
2009 |
|
2010 |
|
2011 |
|
2012 |
|
Total |
| ||||||
|
|
|
|
|
|
|
|
|
|
|
|
|
|
| ||||||
|
Estimated Fair Value of Security by Year of Security Origination |
|
|
|
|
|
|
|
|
|
|
|
|
| ||||||
|
|
|
|
|
|
|
|
|
|
|
|
|
|
| ||||||
|
Rating |
|
|
|
|
|
|
|
|
|
|
|
|
| ||||||
|
A |
|
$ |
3.3 |
|
$ |
— |
|
$ |
— |
|
$ |
— |
|
$ |
— |
|
$ |
3.3 |
|
|
BBB |
|
6.9 |
|
— |
|
— |
|
— |
|
— |
|
6.9 |
| ||||||
|
Below investment grade |
|
418.8 |
|
— |
|
— |
|
— |
|
— |
|
418.8 |
| ||||||
|
Total mortgage-backed securities collateralized by Alt-A mortgage loans |
|
$ |
429.0 |
|
$ |
— |
|
$ |
— |
|
$ |
— |
|
$ |
— |
|
$ |
429.0 |
|
|
|
|
|
|
|
|
|
|
|
|
|
|
|
| ||||||
|
Estimated Unrealized Gain (Loss) of Security by Year of Security Origination |
|
|
|
|
|
|
|
|
|
|
|
|
| ||||||
|
|
|
|
|
|
|
|
|
|
|
|
|
|
| ||||||
|
Rating |
|
|
|
|
|
|
|
|
|
|
|
|
| ||||||
|
A |
|
$ |
— |
|
$ |
— |
|
$ |
— |
|
$ |
— |
|
$ |
— |
|
$ |
— |
|
|
BBB |
|
0.8 |
|
— |
|
— |
|
— |
|
— |
|
0.8 |
| ||||||
|
Below investment grade |
|
(39.2 |
) |
— |
|
— |
|
— |
|
— |
|
(39.2 |
) | ||||||
|
Total mortgage-backed securities collateralized by Alt-A mortgage loans |
|
$ |
(38.4 |
) |
$ |
— |
|
$ |
— |
|
$ |
— |
|
$ |
— |
|
$ |
(38.4 |
) |
|
|
Draft 5/8/2012
|

Invested Asset Summary - MBS - Prime
Mortgage-backed Securities Collateralized by Prime Loans as of March 31, 2012:
|
(Dollars In Millions) |
|
2008 and |
|
|
|
|
|
|
|
|
|
|
| ||||||
|
(Unaudited) |
|
Prior |
|
2009 |
|
2010 |
|
2011 |
|
2012 |
|
Total |
| ||||||
|
|
|
|
|
|
|
|
|
|
|
|
|
|
| ||||||
|
Estimated Fair Value of Security by Year of Security Origination |
|
|
|
|
|
|
|
|
|
|
|
|
| ||||||
|
|
|
|
|
|
|
|
|
|
|
|
|
|
| ||||||
|
Rating |
|
|
|
|
|
|
|
|
|
|
|
|
| ||||||
|
AAA |
|
$ |
668.4 |
|
$ |
84.6 |
|
$ |
405.5 |
|
$ |
363.7 |
|
$ |
— |
|
$ |
1,522.2 |
|
|
AA |
|
5.5 |
|
— |
|
— |
|
— |
|
— |
|
5.5 |
| ||||||
|
A |
|
59.6 |
|
— |
|
— |
|
— |
|
— |
|
59.6 |
| ||||||
|
BBB |
|
21.2 |
|
— |
|
— |
|
— |
|
— |
|
21.2 |
| ||||||
|
Below investment grade |
|
626.5 |
|
— |
|
— |
|
— |
|
— |
|
626.5 |
| ||||||
|
Total mortgage-backed securities collateralized by prime loans |
|
$ |
1,381.2 |
|
$ |
84.6 |
|
$ |
405.5 |
|
$ |
363.7 |
|
$ |
— |
|
$ |
2,235.0 |
|
|
|
|
|
|
|
|
|
|
|
|
|
|
|
| ||||||
|
Includes $1.4 million of agency mortgage backed securities |
|
|
|
|
|
|
|
|
|
|
|
|
| ||||||
|
|
|
|
|
|
|
|
|
|
|
|
|
|
| ||||||
|
Estimated Unrealized Gain (Loss) of Security by Year of Security Origination |
|
|
|
|
|
|
|
|
|
|
|
|
| ||||||
|
|
|
|
|
|
|
|
|
|
|
|
|
|
| ||||||
|
Rating |
|
|
|
|
|
|
|
|
|
|
|
|
| ||||||
|
AAA |
|
$ |
42.0 |
|
$ |
7.2 |
|
$ |
17.3 |
|
$ |
15.6 |
|
$ |
— |
|
$ |
82.1 |
|
|
AA |
|
0.2 |
|
— |
|
— |
|
— |
|
— |
|
0.2 |
| ||||||
|
A |
|
1.6 |
|
— |
|
— |
|
— |
|
— |
|
1.6 |
| ||||||
|
BBB |
|
0.4 |
|
— |
|
— |
|
— |
|
— |
|
0.4 |
| ||||||
|
Below investment grade |
|
(12.3 |
) |
— |
|
— |
|
— |
|
— |
|
(12.3 |
) | ||||||
|
Total mortgage-backed securities collateralized by prime loans |
|
$ |
31.9 |
|
$ |
7.2 |
|
$ |
17.3 |
|
$ |
15.6 |
|
$ |
— |
|
$ |
72.0 |
|
|
|
Draft 5/8/2012
|

Invested Asset Summary - CMBS
Commercial Mortgage-backed Securities as of March 31, 2012:
|
(Dollars In Millions) |
|
2008 and |
|
|
|
|
|
|
|
|
|
|
| ||||||
|
(Unaudited) |
|
Prior |
|
2009 |
|
2010 |
|
2011 |
|
2012 |
|
Total |
| ||||||
|
|
|
|
|
|
|
|
|
|
|
|
|
|
| ||||||
|
Estimated Fair Value of Security by Year of Security Origination |
|
|
|
|
|
|
|
|
|
|
|
|
| ||||||
|
|
|
|
|
|
|
|
|
|
|
|
|
|
| ||||||
|
Rating |
|
|
|
|
|
|
|
|
|
|
|
|
| ||||||
|
AAA |
|
$ |
191.5 |
|
$ |
— |
|
$ |
82.2 |
|
$ |
233.9 |
|
$ |
35.3 |
|
$ |
542.9 |
|
|
AA |
|
5.2 |
|
— |
|
31.7 |
|
37.2 |
|
— |
|
74.1 |
| ||||||
|
A |
|
39.0 |
|
5.8 |
|
34.4 |
|
78.3 |
|
10.6 |
|
168.1 |
| ||||||
|
Total commercial mortgage-backed securities |
|
$ |
235.7 |
|
$ |
5.8 |
|
$ |
148.3 |
|
$ |
349.4 |
|
$ |
45.9 |
|
$ |
785.1 |
|
|
|
|
|
|
|
|
|
|
|
|
|
|
|
| ||||||
|
Estimated Unrealized Gain (Loss) of Security by Year of Security Origination |
|
|
|
|
|
|
|
|
|
|
|
|
| ||||||
|
|
|
|
|
|
|
|
|
|
|
|
|
|
| ||||||
|
Rating |
|
|
|
|
|
|
|
|
|
|
|
|
| ||||||
|
AAA |
|
$ |
5.1 |
|
$ |
— |
|
$ |
6.3 |
|
$ |
18.4 |
|
$ |
(0.2 |
) |
$ |
29.6 |
|
|
AA |
|
0.1 |
|
— |
|
0.5 |
|
1.4 |
|
— |
|
2.0 |
| ||||||
|
A |
|
1.6 |
|
0.1 |
|
1.7 |
|
1.4 |
|
(0.4 |
) |
4.4 |
| ||||||
|
Total commercial mortgage-backed securities |
|
$ |
6.8 |
|
$ |
0.1 |
|
$ |
8.5 |
|
$ |
21.2 |
|
$ |
(0.6 |
) |
$ |
36.0 |
|
|
|
Draft 5/8/2012
|

Invested Asset Summary - ABS(1)
Other Asset-backed Securities(1) as of March 31, 2012:
|
(Dollars In Millions) |
|
2008 and |
|
|
|
|
|
|
|
|
|
|
| ||||||
|
(Unaudited) |
|
Prior |
|
2009 |
|
2010 |
|
2011 |
|
2012 |
|
Total |
| ||||||
|
|
|
|
|
|
|
|
|
|
|
|
|
|
| ||||||
|
Estimated Fair Value of Security by Year of Security Origination |
|
|
|
|
|
|
|
|
|
|
|
|
| ||||||
|
|
|
|
|
|
|
|
|
|
|
|
|
|
| ||||||
|
Rating |
|
|
|
|
|
|
|
|
|
|
|
|
| ||||||
|
AAA |
|
$ |
566.2 |
|
$ |
2.8 |
|
$ |
32.1 |
|
$ |
26.1 |
|
$ |
10.1 |
|
$ |
637.3 |
|
|
AA |
|
160.7 |
|
— |
|
— |
|
— |
|
— |
|
160.7 |
| ||||||
|
A |
|
27.9 |
|
— |
|
— |
|
74.1 |
|
— |
|
102.0 |
| ||||||
|
BBB |
|
3.3 |
|
— |
|
— |
|
— |
|
— |
|
3.3 |
| ||||||
|
Below investment grade |
|
93.5 |
|
— |
|
— |
|
— |
|
— |
|
93.5 |
| ||||||
|
Total other asset-backed securities |
|
$ |
851.6 |
|
$ |
2.8 |
|
$ |
32.1 |
|
$ |
100.2 |
|
$ |
10.1 |
|
$ |
996.8 |
|
|
|
|
|
|
|
|
|
|
|
|
|
|
|
| ||||||
|
Estimated Unrealized Gain (Loss) of Security by Year of Security Origination |
|
|
|
|
|
|
|
|
|
|
|
|
| ||||||
|
|
|
|
|
|
|
|
|
|
|
|
|
|
| ||||||
|
Rating |
|
|
|
|
|
|
|
|
|
|
|
|
| ||||||
|
AAA |
|
$ |
(38.0 |
) |
$ |
— |
|
$ |
0.1 |
|
$ |
0.3 |
|
$ |
0.1 |
|
$ |
(37.5 |
) |
|
AA |
|
(14.3 |
) |
— |
|
— |
|
— |
|
— |
|
(14.3 |
) | ||||||
|
A |
|
(0.4 |
) |
— |
|
— |
|
2.9 |
|
— |
|
2.5 |
| ||||||
|
BBB |
|
— |
|
— |
|
— |
|
— |
|
— |
|
— |
| ||||||
|
Below investment grade |
|
(39.2 |
) |
— |
|
— |
|
— |
|
— |
|
(39.2 |
) | ||||||
|
Total other asset-backed securities |
|
$ |
(91.9 |
) |
$ |
— |
|
$ |
0.1 |
|
$ |
3.2 |
|
$ |
0.1 |
|
$ |
(88.5 |
) |
(1) Excludes Residential and Commercial mortgage-backed securities
|
|
Draft 5/8/2012
|

Life Marketing Quarterly Trends
|
(Dollars In Thousands) |
|
1ST QTR |
|
2ND QTR |
|
3RD QTR |
|
4TH QTR |
|
1ST QTR |
|
3 MOS |
| |||||||||
|
(Unaudited) |
|
2011 |
|
2011 |
|
2011 |
|
2011 |
|
2012 |
|
2011 |
|
2012 |
| |||||||
|
|
|
|
|
|
|
|
|
|
|
|
|
|
|
|
| |||||||
|
REVENUES |
|
|
|
|
|
|
|
|
|
|
|
|
|
|
| |||||||
|
Gross Premiums and Policy Fees |
|
$ |
393,665 |
|
$ |
406,566 |
|
$ |
383,293 |
|
$ |
408,057 |
|
$ |
388,117 |
|
$ |
393,665 |
|
$ |
388,117 |
|
|
Reinsurance Ceded |
|
(198,086 |
) |
(219,292 |
) |
(191,498 |
) |
(237,886 |
) |
(192,755 |
) |
(198,086 |
) |
(192,755 |
) | |||||||
|
Net Premiums and Policy Fees |
|
195,579 |
|
187,274 |
|
191,795 |
|
170,171 |
|
195,362 |
|
195,579 |
|
195,362 |
| |||||||
|
Net investment income |
|
106,627 |
|
110,230 |
|
112,396 |
|
116,922 |
|
119,026 |
|
106,627 |
|
119,026 |
| |||||||
|
Other income |
|
28,131 |
|
28,923 |
|
27,048 |
|
26,205 |
|
29,154 |
|
28,131 |
|
29,154 |
| |||||||
|
Total Revenues |
|
330,337 |
|
326,427 |
|
331,239 |
|
313,298 |
|
343,542 |
|
330,337 |
|
343,542 |
| |||||||
|
|
|
|
|
|
|
|
|
|
|
|
|
|
|
|
| |||||||
|
BENEFITS & EXPENSES |
|
|
|
|
|
|
|
|
|
|
|
|
|
|
| |||||||
|
Benefits and settlement expenses |
|
245,162 |
|
236,439 |
|
269,996 |
|
226,501 |
|
254,579 |
|
245,162 |
|
254,579 |
| |||||||
|
Amortization of deferred policy acquisition costs and value of business acquired |
|
27,982 |
|
22,047 |
|
15,214 |
|
22,218 |
|
22,594 |
|
27,982 |
|
22,594 |
| |||||||
|
Other operating expenses |
|
37,920 |
|
37,678 |
|
33,252 |
|
30,769 |
|
36,000 |
|
37,920 |
|
36,000 |
| |||||||
|
Total Benefits and Expenses |
|
311,064 |
|
296,164 |
|
318,462 |
|
279,488 |
|
313,173 |
|
311,064 |
|
313,173 |
| |||||||
|
|
|
|
|
|
|
|
|
|
|
|
|
|
|
|
| |||||||
|
INCOME BEFORE INCOME TAX |
|
$ |
19,273 |
|
$ |
30,263 |
|
$ |
12,777 |
|
$ |
33,810 |
|
$ |
30,369 |
|
$ |
19,273 |
|
$ |
30,369 |
|
Life Marketing Key Data
|
(Dollars In Thousands) |
|
1ST QTR |
|
2ND QTR |
|
3RD QTR |
|
4TH QTR |
|
1ST QTR |
|
3 MOS |
| |||||||||
|
(Unaudited) |
|
2011 |
|
2011 |
|
2011 |
|
2011 |
|
2012 |
|
2011 |
|
2012 |
| |||||||
|
|
|
|
|
|
|
|
|
|
|
|
|
|
|
|
| |||||||
|
SALES BY PRODUCT |
|
|
|
|
|
|
|
|
|
|
|
|
|
|
| |||||||
|
Traditional |
|
$ |
1,863 |
|
$ |
1,305 |
|
$ |
516 |
|
$ |
162 |
|
$ |
287 |
|
$ |
1,863 |
|
$ |
287 |
|
|
Universal life |
|
35,945 |
|
32,988 |
|
25,670 |
|
23,344 |
|
20,962 |
|
35,945 |
|
20,962 |
| |||||||
|
Bank-owned life insurance |
|
4,661 |
|
3,460 |
|
1,520 |
|
1,722 |
|
1,345 |
|
4,661 |
|
1,345 |
| |||||||
|
Total |
|
$ |
42,469 |
|
$ |
37,753 |
|
$ |
27,706 |
|
$ |
25,228 |
|
$ |
22,594 |
|
$ |
42,469 |
|
$ |
22,594 |
|
|
|
|
|
|
|
|
|
|
|
|
|
|
|
|
|
| |||||||
|
SALES BY DISTRIBUTION |
|
|
|
|
|
|
|
|
|
|
|
|
|
|
| |||||||
|
Independent agents |
|
$ |
29,243 |
|
$ |
25,690 |
|
$ |
19,185 |
|
$ |
15,280 |
|
$ |
13,940 |
|
$ |
29,243 |
|
$ |
13,940 |
|
|
Stockbrokers/banks |
|
8,343 |
|
8,427 |
|
6,907 |
|
8,000 |
|
6,976 |
|
8,343 |
|
6,976 |
| |||||||
|
BOLI/other |
|
4,883 |
|
3,636 |
|
1,614 |
|
1,948 |
|
1,678 |
|
4,883 |
|
1,678 |
| |||||||
|
Total |
|
$ |
42,469 |
|
$ |
37,753 |
|
$ |
27,706 |
|
$ |
25,228 |
|
$ |
22,594 |
|
$ |
42,469 |
|
$ |
22,594 |
|
|
|
Draft 5/8/2012
|

Annuities Quarterly Trends
|
(Dollars In Thousands) |
|
1ST QTR |
|
2ND QTR |
|
3RD QTR |
|
4TH QTR |
|
1ST QTR |
|
3 MOS |
| |||||||||
|
(Unaudited) |
|
2011 |
|
2011 |
|
2011 |
|
2011 |
|
2012 |
|
2011 |
|
2012 |
| |||||||
|
|
|
|
|
|
|
|
|
|
|
|
|
|
|
|
| |||||||
|
REVENUES |
|
|
|
|
|
|
|
|
|
|
|
|
|
|
| |||||||
|
Gross Premiums and Policy Fees |
|
$ |
14,923 |
|
$ |
16,709 |
|
$ |
17,670 |
|
$ |
19,083 |
|
$ |
21,928 |
|
$ |
14,923 |
|
$ |
21,928 |
|
|
Reinsurance Ceded |
|
(21 |
) |
(17 |
) |
(16 |
) |
(12 |
) |
(13 |
) |
(21 |
) |
(13 |
) | |||||||
|
Net Premiums and Policy Fees |
|
14,902 |
|
16,692 |
|
17,654 |
|
19,071 |
|
21,915 |
|
14,902 |
|
21,915 |
| |||||||
|
Net investment income |
|
124,356 |
|
128,202 |
|
127,095 |
|
127,577 |
|
125,985 |
|
124,356 |
|
125,985 |
| |||||||
|
RIGL - Derivatives |
|
(21,483 |
) |
(2,196 |
) |
23,435 |
|
(5,579 |
) |
(41,200 |
) |
(21,483 |
) |
(41,200 |
) | |||||||
|
RIGL - All Other Investments |
|
999 |
|
(2,215 |
) |
501 |
|
10,176 |
|
15,013 |
|
999 |
|
15,013 |
| |||||||
|
Other income |
|
11,358 |
|
13,119 |
|
14,516 |
|
16,167 |
|
17,711 |
|
11,358 |
|
17,711 |
| |||||||
|
Total Revenues |
|
130,132 |
|
153,602 |
|
183,201 |
|
167,412 |
|
139,424 |
|
130,132 |
|
139,424 |
| |||||||
|
|
|
|
|
|
|
|
|
|
|
|
|
|
|
|
| |||||||
|
BENEFITS & EXPENSES |
|
|
|
|
|
|
|
|
|
|
|
|
|
|
| |||||||
|
Benefits and settlement expenses |
|
96,247 |
|
99,856 |
|
93,438 |
|
101,247 |
|
91,909 |
|
96,247 |
|
91,909 |
| |||||||
|
Amortization of deferred policy acquisition costs and value of business acquired |
|
6,500 |
|
15,053 |
|
25,664 |
|
9,984 |
|
1,873 |
|
6,500 |
|
1,873 |
| |||||||
|
Other operating expenses |
|
20,260 |
|
21,324 |
|
21,468 |
|
22,255 |
|
23,296 |
|
20,260 |
|
23,296 |
| |||||||
|
Total Benefits and Expenses |
|
123,007 |
|
136,233 |
|
140,570 |
|
133,486 |
|
117,078 |
|
123,007 |
|
117,078 |
| |||||||
|
|
|
|
|
|
|
|
|
|
|
|
|
|
|
|
| |||||||
|
INCOME BEFORE INCOME TAX |
|
7,125 |
|
17,369 |
|
42,631 |
|
33,926 |
|
22,346 |
|
7,125 |
|
22,346 |
| |||||||
|
|
|
|
|
|
|
|
|
|
|
|
|
|
|
|
| |||||||
|
Adjustments to Reconcile to Operating Income: |
|
|
|
|
|
|
|
|
|
|
|
|
|
|
| |||||||
|
Less: RIGL - Derivatives, net of economic cost |
|
(17,138 |
) |
2,957 |
|
29,337 |
|
902 |
|
(33,960 |
) |
(17,138 |
) |
(33,960 |
) | |||||||
|
Less: RIGL - All Other Investments |
|
999 |
|
(2,215 |
) |
501 |
|
10,176 |
|
15,013 |
|
999 |
|
15,013 |
| |||||||
|
Less: Amortization related to benefit and settlement expenses |
|
(1,403 |
) |
(105 |
) |
2,195 |
|
405 |
|
(1,619 |
) |
(1,403 |
) |
(1,619 |
) | |||||||
|
Less: Related amortization of DAC |
|
6,027 |
|
(446 |
) |
(9,578 |
) |
(1,787 |
) |
7,129 |
|
6,027 |
|
7,129 |
| |||||||
|
|
|
|
|
|
|
|
|
|
|
|
|
|
|
|
| |||||||
|
PRE-TAX OPERATING INCOME |
|
$ |
18,640 |
|
$ |
17,178 |
|
$ |
20,176 |
|
$ |
24,230 |
|
$ |
35,783 |
|
$ |
18,640 |
|
$ |
35,783 |
|
Annuities Key Data
|
|
|
1ST QTR |
|
2ND QTR |
|
3RD QTR |
|
4TH QTR |
|
1ST QTR |
|
3 MOS |
| |||||||||
|
|
|
2011 |
|
2011 |
|
2011 |
|
2011 |
|
2012 |
|
2011 |
|
2012 |
| |||||||
|
|
|
|
|
|
|
|
|
|
|
|
|
|
|
|
| |||||||
|
SALES |
|
|
|
|
|
|
|
|
|
|
|
|
|
|
| |||||||
|
Variable Annuity |
|
$ |
607,795 |
|
$ |
669,021 |
|
$ |
573,166 |
|
$ |
498,617 |
|
$ |
567,408 |
|
$ |
607,795 |
|
$ |
567,408 |
|
|
Immediate Annuity |
|
19,194 |
|
14,200 |
|
18,160 |
|
14,696 |
|
14,068 |
|
19,194 |
|
14,068 |
| |||||||
|
Single Premium Deferred Annuity |
|
246,942 |
|
212,323 |
|
255,715 |
|
173,420 |
|
138,314 |
|
246,942 |
|
138,314 |
| |||||||
|
Market Value Adjusted Annuity |
|
42,950 |
|
18,989 |
|
12,671 |
|
2,595 |
|
155 |
|
42,950 |
|
155 |
| |||||||
|
Equity Indexed Annuity |
|
178 |
|
291 |
|
79 |
|
179 |
|
289 |
|
178 |
|
289 |
| |||||||
|
Total |
|
$ |
917,059 |
|
$ |
914,824 |
|
$ |
859,791 |
|
$ |
689,507 |
|
$ |
720,234 |
|
$ |
917,059 |
|
$ |
720,234 |
|
|
|
|
|
|
|
|
|
|
|
|
|
|
|
|
|
| |||||||
|
PRE-TAX OPERATING INCOME |
|
|
|
|
|
|
|
|
|
|
|
|
|
|
| |||||||
|
Variable Annuity |
|
$ |
5,993 |
|
$ |
5,094 |
|
$ |
(10,223 |
) |
$ |
13,242 |
|
$ |
17,343 |
|
$ |
5,993 |
|
$ |
17,343 |
|
|
Fixed Annuity |
|
12,647 |
|
12,084 |
|
30,399 |
|
10,988 |
|
18,440 |
|
12,647 |
|
18,440 |
| |||||||
|
Total |
|
$ |
18,640 |
|
$ |
17,178 |
|
$ |
20,176 |
|
$ |
24,230 |
|
$ |
35,783 |
|
$ |
18,640 |
|
$ |
35,783 |
|
|
|
|
|
|
|
|
|
|
|
|
|
|
|
|
|
| |||||||
|
DEPOSIT BALANCE |
|
|
|
|
|
|
|
|
|
|
|
|
|
|
| |||||||
|
VA Fixed Annuity |
|
$ |
493,686 |
|
$ |
541,252 |
|
$ |
533,211 |
|
$ |
510,567 |
|
$ |
515,613 |
|
|
|
|
| ||
|
VA Separate Account Annuity |
|
5,058,135 |
|
5,579,541 |
|
5,367,490 |
|
6,140,365 |
|
7,050,549 |
|
|
|
|
| |||||||
|
Sub-total |
|
5,551,821 |
|
6,120,793 |
|
5,900,701 |
|
6,650,932 |
|
7,566,162 |
|
|
|
|
| |||||||
|
Fixed Annuity |
|
7,931,246 |
|
8,035,741 |
|
8,125,616 |
|
8,152,841 |
|
8,069,304 |
|
|
|
|
| |||||||
|
Total |
|
$ |
13,483,067 |
|
$ |
14,156,534 |
|
$ |
14,026,317 |
|
$ |
14,803,773 |
|
$ |
15,635,466 |
|
|
|
|
| ||
|
|
Draft 5/8/2012
|

Stable Value Products Quarterly Trends
|
(Dollars In Thousands) |
|
1ST QTR |
|
2ND QTR |
|
3RD QTR |
|
4TH QTR |
|
1ST QTR |
|
3 MOS |
| |||||||||
|
(Unaudited) |
|
2011 |
|
2011 |
|
2011 |
|
2011 |
|
2012 |
|
2011 |
|
2012 |
| |||||||
|
|
|
|
|
|
|
|
|
|
|
|
|
|
|
|
| |||||||
|
REVENUES |
|
|
|
|
|
|
|
|
|
|
|
|
|
|
| |||||||
|
Net investment income |
|
$ |
36,104 |
|
$ |
39,376 |
|
$ |
35,173 |
|
$ |
34,497 |
|
$ |
32,402 |
|
$ |
36,104 |
|
$ |
32,402 |
|
|
RIGL - Derivatives |
|
645 |
|
(617 |
) |
(485 |
) |
98 |
|
646 |
|
645 |
|
646 |
| |||||||
|
RIGL - All Other Investments |
|
7,967 |
|
7,661 |
|
10,471 |
|
(774 |
) |
1,607 |
|
7,967 |
|
1,607 |
| |||||||
|
Other income |
|
(1 |
) |
1 |
|
(1 |
) |
— |
|
1 |
|
(1 |
) |
1 |
| |||||||
|
Total Revenues |
|
44,715 |
|
46,421 |
|
45,158 |
|
33,821 |
|
34,656 |
|
44,715 |
|
34,656 |
| |||||||
|
|
|
|
|
|
|
|
|
|
|
|
|
|
|
|
| |||||||
|
BENEFITS & EXPENSES |
|
|
|
|
|
|
|
|
|
|
|
|
|
|
| |||||||
|
Benefits and settlement expenses |
|
22,790 |
|
19,381 |
|
19,641 |
|
19,444 |
|
18,957 |
|
22,790 |
|
18,957 |
| |||||||
|
Amortization of deferred policy acquisition costs and value of business acquired |
|
3,547 |
|
286 |
|
502 |
|
221 |
|
196 |
|
3,547 |
|
196 |
| |||||||
|
Other operating expenses |
|
571 |
|
568 |
|
812 |
|
606 |
|
604 |
|
571 |
|
604 |
| |||||||
|
Total Benefits and Expenses |
|
26,908 |
|
20,235 |
|
20,955 |
|
20,271 |
|
19,757 |
|
26,908 |
|
19,757 |
| |||||||
|
|
|
|
|
|
|
|
|
|
|
|
|
|
|
|
| |||||||
|
INCOME BEFORE INCOME TAX |
|
17,807 |
|
26,186 |
|
24,203 |
|
13,550 |
|
14,899 |
|
17,807 |
|
14,899 |
| |||||||
|
|
|
|
|
|
|
|
|
|
|
|
|
|
|
|
| |||||||
|
Adjustments to Reconcile to Operating Income: |
|
|
|
|
|
|
|
|
|
|
|
|
|
|
| |||||||
|
Less: RIGL-Derivatives |
|
645 |
|
(617 |
) |
(485 |
) |
98 |
|
646 |
|
645 |
|
646 |
| |||||||
|
Less: RIGL-All Other Investments |
|
7,967 |
|
7,661 |
|
10,471 |
|
(774 |
) |
1,607 |
|
7,967 |
|
1,607 |
| |||||||
|
|
|
|
|
|
|
|
|
|
|
|
|
|
|
|
| |||||||
|
PRE-TAX OPERATING INCOME |
|
$ |
9,195 |
|
$ |
19,142 |
|
$ |
14,217 |
|
$ |
14,226 |
|
$ |
12,646 |
|
$ |
9,195 |
|
$ |
12,646 |
|
Stable Value Products Key Data
|
|
|
1ST QTR |
|
2ND QTR |
|
3RD QTR |
|
4TH QTR |
|
1ST QTR |
|
3 MOS |
| |||||||||
|
|
|
2011 |
|
2011 |
|
2011 |
|
2011 |
|
2012 |
|
2011 |
|
2012 |
| |||||||
|
|
|
|
|
|
|
|
|
|
|
|
|
|
|
|
| |||||||
|
SALES |
|
|
|
|
|
|
|
|
|
|
|
|
|
|
| |||||||
|
GIC |
|
$ |
74,658 |
|
$ |
161,137 |
|
$ |
230,000 |
|
$ |
32,900 |
|
$ |
26,000 |
|
$ |
74,658 |
|
$ |
26,000 |
|
|
GFA - Direct Institutional |
|
— |
|
100,000 |
|
200,000 |
|
— |
|
150,000 |
|
— |
|
150,000 |
| |||||||
|
Total |
|
$ |
74,658 |
|
$ |
261,137 |
|
$ |
430,000 |
|
$ |
32,900 |
|
$ |
176,000 |
|
$ |
74,658 |
|
$ |
176,000 |
|
|
|
|
|
|
|
|
|
|
|
|
|
|
|
|
|
| |||||||
|
DEPOSIT BALANCE |
|
|
|
|
|
|
|
|
|
|
|
|
|
|
| |||||||
|
Quarter End Balance |
|
$ |
2,664,139 |
|
$ |
2,565,235 |
|
$ |
2,827,862 |
|
$ |
2,769,510 |
|
$ |
2,772,378 |
|
|
|
|
| ||
|
Average Daily Balance |
|
$ |
2,750,596 |
|
$ |
2,450,620 |
|
$ |
2,710,571 |
|
$ |
2,827,891 |
|
$ |
2,784,389 |
|
|
|
|
| ||
|
|
|
|
|
|
|
|
|
|
|
|
|
|
|
|
| |||||||
|
OPERATING SPREAD |
|
1.34 |
% |
3.12 |
% |
2.10 |
% |
2.01 |
% |
1.82 |
% |
|
|
|
| |||||||
|
|
|
|
|
|
|
|
|
|
|
|
|
|
|
|
| |||||||
|
ADJUSTED OPERATING SPREAD (1) |
|
1.31 |
% |
1.97 |
% |
1.92 |
% |
2.00 |
% |
1.80 |
% |
|
|
|
| |||||||
(1) Excludes participating mortgage loan income and bank loan participation fee income
|
|
|
Page 19 |

Asset Protection Quarterly Trends
|
(Dollars In Thousands) |
|
1ST QTR |
|
2ND QTR |
|
3RD QTR |
|
4TH QTR |
|
1ST QTR |
|
3 MOS |
| ||||||||||||||||
|
(Unaudited) |
|
2011 |
|
2011 |
|
2011 |
|
2011 |
|
2012 |
|
2011 |
|
2012 |
| ||||||||||||||
|
|
|
|
|
|
|
|
|
|
|
|
|
|
|
|
| ||||||||||||||
|
REVENUES |
|
|
|
|
|
|
|
|
|
|
|
|
|
|
| ||||||||||||||
|
Gross Premiums and Policy Fees |
|
$ |
|
71,606 |
|
$ |
|
72,333 |
|
$ |
|
70,646 |
|
$ |
|
69,621 |
|
$ |
|
68,936 |
|
$ |
|
71,606 |
|
$ |
|
68,936 |
|
|
Reinsurance Ceded |
|
(31,813 |
) |
(32,253 |
) |
(31,782 |
) |
(32,215 |
) |
(31,473 |
) |
(31,813 |
) |
(31,473 |
) | ||||||||||||||
|
Net Premiums and Policy Fees |
|
39,793 |
|
40,080 |
|
38,864 |
|
37,406 |
|
37,463 |
|
39,793 |
|
37,463 |
| ||||||||||||||
|
Net investment income |
|
6,984 |
|
6,788 |
|
6,675 |
|
6,054 |
|
6,542 |
|
6,984 |
|
6,542 |
| ||||||||||||||
|
Other income |
|
21,126 |
|
22,909 |
|
25,750 |
|
24,842 |
|
26,601 |
|
21,126 |
|
26,601 |
| ||||||||||||||
|
Total Revenues |
|
67,903 |
|
69,777 |
|
71,289 |
|
68,302 |
|
70,606 |
|
67,903 |
|
70,606 |
| ||||||||||||||
|
|
|
|
|
|
|
|
|
|
|
|
|
|
|
|
| ||||||||||||||
|
BENEFITS & EXPENSES |
|
|
|
|
|
|
|
|
|
|
|
|
|
|
| ||||||||||||||
|
Benefits and settlement expenses |
|
23,866 |
|
25,147 |
|
26,529 |
|
23,968 |
|
24,048 |
|
23,866 |
|
24,048 |
| ||||||||||||||
|
Amortization of deferred policy acquisition costs and value of business acquired |
|
10,236 |
|
9,927 |
|
9,227 |
|
8,690 |
|
8,677 |
|
10,236 |
|
8,677 |
| ||||||||||||||
|
Other operating expenses |
|
27,000 |
|
28,722 |
|
29,369 |
|
28,938 |
|
32,915 |
|
27,000 |
|
32,915 |
| ||||||||||||||
|
Total Benefits and Expenses |
|
61,102 |
|
63,796 |
|
65,125 |
|
61,596 |
|
65,640 |
|
61,102 |
|
65,640 |
| ||||||||||||||
|
|
|
|
|
|
|
|
|
|
|
|
|
|
|
|
| ||||||||||||||
|
INCOME BEFORE INCOME TAX |
|
6,801 |
|
5,981 |
|
6,164 |
|
6,706 |
|
4,966 |
|
6,801 |
|
4,966 |
| ||||||||||||||
|
Less: noncontrolling interests |
|
(51 |
) |
296 |
|
— |
|
— |
|
— |
|
(51 |
) |
— |
| ||||||||||||||
|
OPERATING INCOME |
|
$ |
|
6,852 |
|
$ |
|
5,685 |
|
$ |
|
6,164 |
|
$ |
|
6,706 |
|
$ |
|
4,966 |
|
$ |
|
6,852 |
|
$ |
|
4,966 |
|
Asset Protection Key Data
|
|
|
1ST QTR |
|
2ND QTR |
|
3RD QTR |
|
4TH QTR |
|
1ST QTR |
|
3 MOS |
| |||||||||
|
|
|
2011 |
|
2011 |
|
2011 |
|
2011 |
|
2012 |
|
2011 |
|
2012 |
| |||||||
|
|
|
|
|
|
|
|
|
|
|
|
|
|
|
|
| |||||||
|
SALES |
|
|
|
|
|
|
|
|
|
|
|
|
|
|
| |||||||
|
Credit insurance |
|
$ |
8,766 |
|
$ |
9,650 |
|
$ |
8,970 |
|
$ |
8,381 |
|
$ |
8,802 |
|
$ |
8,766 |
|
$ |
8,802 |
|
|
Service contracts |
|
64,178 |
|
79,142 |
|
83,109 |
|
80,544 |
|
82,800 |
|
64,178 |
|
82,800 |
| |||||||
|
Other products |
|
17,244 |
|
20,116 |
|
18,532 |
|
17,016 |
|
18,295 |
|
17,244 |
|
18,295 |
| |||||||
|
Total |
|
$ |
90,188 |
|
$ |
108,908 |
|
$ |
110,611 |
|
$ |
105,941 |
|
$ |
109,897 |
|
$ |
90,188 |
|
$ |
109,897 |
|
|
|
|
Page 20 |

Acquisitions Quarterly Trends
|
(Dollars In Thousands) |
|
1ST QTR |
|
2ND QTR |
|
3RD QTR |
|
4TH QTR |
|
1ST QTR |
|
3 MOS |
| |||||||||
|
(Unaudited) |
|
2011 |
|
2011 |
|
2011 |
|
2011 |
|
2012 |
|
2011 |
|
2012 |
| |||||||
|
|
|
|
|
|
|
|
|
|
|
|
|
|
|
|
| |||||||
|
REVENUES |
|
|
|
|
|
|
|
|
|
|
|
|
|
|
| |||||||
|
Gross Premiums and Policy Fees |
|
$ |
180,494 |
|
$ |
215,533 |
|
$ |
219,970 |
|
$ |
218,502 |
|
$ |
212,158 |
|
$ |
180,494 |
|
$ |
212,158 |
|
|
Reinsurance Ceded |
|
(101,794 |
) |
(112,681 |
) |
(103,667 |
) |
(101,534 |
) |
(80,301 |
) |
(101,794 |
) |
(80,301 |
) | |||||||
|
Net Premiums and Policy Fees |
|
78,700 |
|
102,852 |
|
116,303 |
|
116,968 |
|
131,857 |
|
78,700 |
|
131,857 |
| |||||||
|
Net investment income |
|
117,938 |
|
132,710 |
|
140,352 |
|
138,261 |
|
138,121 |
|
117,938 |
|
138,121 |
| |||||||
|
RIGL - Derivatives |
|
7,480 |
|
(28,858 |
) |
(109,437 |
) |
(3,116 |
) |
10,640 |
|
7,480 |
|
10,640 |
| |||||||
|
RIGL - All Other Investments |
|
(5,274 |
) |
34,676 |
|
124,416 |
|
13,289 |
|
17,312 |
|
(5,274 |
) |
17,312 |
| |||||||
|
Other income |
|
1,279 |
|
1,391 |
|
1,432 |
|
1,459 |
|
1,579 |
|
1,279 |
|
1,579 |
| |||||||
|
Total Revenues |
|
200,123 |
|
242,771 |
|
273,066 |
|
266,861 |
|
299,509 |
|
200,123 |
|
299,509 |
| |||||||
|
|
|
|
|
|
|
|
|
|
|
|
|
|
|
|
| |||||||
|
BENEFITS & EXPENSES |
|
|
|
|
|
|
|
|
|
|
|
|
|
|
| |||||||
|
Benefits and settlement expenses |
|
142,481 |
|
164,906 |
|
176,850 |
|
178,056 |
|
194,173 |
|
142,481 |
|
194,173 |
| |||||||
|
Amortization of deferred policy acquisition costs and value of business acquired |
|
16,603 |
|
18,053 |
|
20,807 |
|
19,578 |
|
23,142 |
|
16,603 |
|
23,142 |
| |||||||
|
Other operating expenses |
|
7,141 |
|
14,735 |
|
16,767 |
|
17,149 |
|
15,110 |
|
7,141 |
|
15,110 |
| |||||||
|
Total Benefits and Expenses |
|
166,225 |
|
197,694 |
|
214,424 |
|
214,783 |
|
232,425 |
|
166,225 |
|
232,425 |
| |||||||
|
|
|
|
|
|
|
|
|
|
|
|
|
|
|
|
| |||||||
|
INCOME BEFORE INCOME TAX |
|
33,898 |
|
45,077 |
|
58,642 |
|
52,078 |
|
67,084 |
|
33,898 |
|
67,084 |
| |||||||
|
|
|
|
|
|
|
|
|
|
|
|
|
|
|
|
| |||||||
|
Adjustments to Reconcile to Operating Income: |
|
|
|
|
|
|
|
|
|
|
|
|
|
|
| |||||||
|
Less: RIGL - Derivatives |
|
7,480 |
|
(28,858 |
) |
(109,437 |
) |
(3,116 |
) |
10,640 |
|
7,480 |
|
10,640 |
| |||||||
|
Less: RIGL - All Other Investments |
|
(5,274 |
) |
34,676 |
|
124,416 |
|
13,289 |
|
17,312 |
|
(5,274 |
) |
17,312 |
| |||||||
|
Less: Related amortization of deferred policy acquisition costs and value of business acquired |
|
(699 |
) |
(170 |
) |
(365 |
) |
360 |
|
33 |
|
(699 |
) |
33 |
| |||||||
|
|
|
|
|
|
|
|
|
|
|
|
|
|
|
|
| |||||||
|
PRE-TAX OPERATING INCOME |
|
$ |
32,391 |
|
$ |
39,429 |
|
$ |
44,028 |
|
$ |
41,545 |
|
$ |
39,099 |
|
$ |
32,391 |
|
$ |
39,099 |
|
|
|
|
Page 21 |

Corporate & Other Quarterly Trends
|
(Dollars In Thousands) |
|
1ST QTR |
|
2ND QTR |
|
3RD QTR |
|
4TH QTR |
|
1ST QTR |
|
3 MOS |
| |||||||||
|
(Unaudited) |
|
2011 |
|
2011 |
|
2011 |
|
2011 |
|
2012 |
|
2011 |
|
2012 |
| |||||||
|
|
|
|
|
|
|
|
|
|
|
|
|
|
|
|
| |||||||
|
REVENUES |
|
|
|
|
|
|
|
|
|
|
|
|
|
|
| |||||||
|
Gross Premiums and Policy Fees |
|
$ |
5,655 |
|
$ |
5,445 |
|
$ |
5,399 |
|
$ |
4,970 |
|
$ |
5,166 |
|
$ |
5,655 |
|
$ |
5,166 |
|
|
Reinsurance Ceded |
|
(94 |
) |
(5 |
) |
(4 |
) |
(5 |
) |
(16 |
) |
(94 |
) |
(16 |
) | |||||||
|
Net Premiums and Policy Fees |
|
5,561 |
|
5,440 |
|
5,395 |
|
4,965 |
|
5,150 |
|
5,561 |
|
5,150 |
| |||||||
|
Net investment income |
|
52,204 |
|
31,479 |
|
41,235 |
|
41,408 |
|
40,045 |
|
52,204 |
|
40,045 |
| |||||||
|
RIGL - Derivatives |
|
672 |
|
(3,322 |
) |
(11,329 |
) |
(1,159 |
) |
5 |
|
672 |
|
5 |
| |||||||
|
RIGL - All Other Investments |
|
(4,883 |
) |
9,308 |
|
(6,987 |
) |
(11,858 |
) |
(16,970 |
) |
(4,883 |
) |
(16,970 |
) | |||||||
|
Other income |
|
10,316 |
|
20,881 |
|
7,114 |
|
3,847 |
|
36,214 |
|
10,316 |
|
36,214 |
| |||||||
|
Total Revenues |
|
63,870 |
|
63,786 |
|
35,428 |
|
37,203 |
|
64,444 |
|
63,870 |
|
64,444 |
| |||||||
|
|
|
|
|
|
|
|
|
|
|
|
|
|
|
|
| |||||||
|
BENEFITS & EXPENSES |
|
|
|
|
|
|
|
|
|
|
|
|
|
|
| |||||||
|
Benefits and settlement expenses |
|
5,823 |
|
5,824 |
|
6,338 |
|
3,543 |
|
5,963 |
|
5,823 |
|
5,963 |
| |||||||
|
Amortization of deferred policy acquisition costs and value of business acquired |
|
358 |
|
352 |
|
326 |
|
1,618 |
|
354 |
|
358 |
|
354 |
| |||||||
|
Other operating expenses |
|
51,879 |
|
47,647 |
|
50,895 |
|
49,475 |
|
47,212 |
|
51,879 |
|
47,212 |
| |||||||
|
Total Benefits and Expenses |
|
58,060 |
|
53,823 |
|
57,559 |
|
54,636 |
|
53,529 |
|
58,060 |
|
53,529 |
| |||||||
|
|
|
|
|
|
|
|
|
|
|
|
|
|
|
|
| |||||||
|
INCOME (LOSS) BEFORE INCOME TAX |
|
5,810 |
|
9,963 |
|
(22,131 |
) |
(17,433 |
) |
10,915 |
|
5,810 |
|
10,915 |
| |||||||
|
|
|
|
|
|
|
|
|
|
|
|
|
|
|
|
| |||||||
|
Adjustments to Reconcile to Operating Income: |
|
|
|
|
|
|
|
|
|
|
|
|
|
|
| |||||||
|
Less: RIGL-Derivatives |
|
672 |
|
(3,322 |
) |
(11,329 |
) |
(1,159 |
) |
5 |
|
672 |
|
5 |
| |||||||
|
Less: RIGL-All Other Investments |
|
(4,883 |
) |
9,308 |
|
(6,987 |
) |
(11,858 |
) |
(16,970 |
) |
(4,883 |
) |
(16,970 |
) | |||||||
|
Less: noncontrolling interests |
|
— |
|
— |
|
— |
|
— |
|
— |
|
— |
|
— |
| |||||||
|
|
|
|
|
|
|
|
|
|
|
|
|
|
|
|
| |||||||
|
PRE-TAX OPERATING INCOME (LOSS) |
|
$ |
10,021 |
|
$ |
3,977 |
|
$ |
(3,815 |
) |
$ |
(4,416 |
) |
$ |
27,880 |
|
$ |
10,021 |
|
$ |
27,880 |
|
|
|
|
Page 22 |

INFORMATION RELATED TO CERTAIN NON-GAAP DISCLOSURES
The following pages contain information related to certain non-GAAP disclosures (consolidated and segment operating income (loss), operating income per diluted share, shareowners’ equity per share excluding accumulated other comprehensive income (loss), operating income return on average equity, and net income return on average equity).
All income per share results are presented on a diluted basis, unless otherwise noted.
CONSOLIDATED AND SEGMENT OPERATING INCOME (LOSS) AND OPERATING INCOME PER DILUTED SHARE
Consolidated and segment operating income (loss) and operating income per diluted share (hereinafter collectively referred to as “consolidated and segment operating income”) are defined as income before income tax, excluding net realized investment gains and losses (excluding periodic settlements of derivatives associated with debt and certain investments) net of the related amortization of deferred acquisition costs (“DAC”) and value of business acquired (“VOBA”). Operating earnings exclude changes in the guaranteed minimum withdrawal benefits (“GMWB”) embedded derivatives (excluding the portion attributed to economic cost), realized and unrealized gains (losses) on derivatives used to hedge the VA product, actual GMWB incurred claims and net of the related amortization of DAC attributed to each of these items.
In the first quarter of 2012, management revised the definition of operating income (loss) as it relates to certain features of our variable annuity contracts and related hedging activities, to better reflect the basis on which the performance of its business is internally assessed. Under the revised definition, the following items will be excluded from operating income:
· Changes in GMWB embedded derivatives related to this rider feature of certain variable annuity products (excluding the portion attributed to economic costs). Economic cost is the long-term expected average cost of providing the product benefit over the life of the policy based on product pricing assumptions. These include assumptions about the economic/market environment, and elective and non-elective policy owner behavior (e.g. lapses, withdrawal timing, mortality, etc.). These features are considered embedded derivatives under ASC 815.
· Changes in value of certain derivative instruments used to mitigate the risk related to variable annuity contracts.
· That portion of the change in balance sheet components amortized over estimated gross profit that is attributed to the embedded GMWB derivative and related economic hedges (e.g. DAC amortization).
Management believes that consolidated and segment operating income (loss) provides relevant and useful information to investors, as it represents the basis on which the performance of the Company’s business is internally assessed. Although the items excluded from consolidated and segment operating income may be significant components in understanding and assessing the Company’s overall financial performance, management believes that consolidated and segment operating income enhances an investor’s understanding of the Company’s results of operations by highlighting the income (loss) generally attributable to the normal, recurring operations of the Company’s business.
SHAREOWNERS’ EQUITY PER SHARE EXCLUDING ACCUMULATED OTHER COMPREHENSIVE INCOME (LOSS)
As prescribed by GAAP, certain investments are recorded at their market values with the resulting unrealized gains (losses) affected by a related adjustment to DAC and VOBA, net of income tax, reported as a component of shareowners’ equity. The market values of fixed maturities increase or decrease as interest rates change. The Company believes that an insurance company’s shareowners’ equity per share may be difficult to analyze without disclosing the effects of recording accumulated other comprehensive income (loss), including unrealized gains (losses) on investments. Therefore, the Company reports the non-GAAP measure shareowners’ equity per share excluding accumulated other comprehensive income (loss), including unrealized gains (losses) on investments. This non-GAAP measure may be reconciled to the GAAP measure, shareowners’ equity per share by including accumulated other comprehensive income (loss), including unrealized gains (losses) on investments.
OPERATING INCOME RETURN ON AVERAGE EQUITY
Operating income return on average equity is a measure used by management to evaluate the Company’s performance. It is calculated by dividing operating income (as defined above) for a rolling twelve month period by the average ending balance of shareowners’ equity excluding accumulated other comprehensive income (loss) for the five most recent quarters.
NET INCOME RETURN ON AVERAGE EQUITY
Net income return on average equity is a measure used by management to evaluate the Company’s performance. It is calculated by dividing net income for a rolling twelve month period by the average ending balance of shareowners’ equity excluding accumulated other comprehensive income (loss) for the five most recent quarters.
|
|

Reconciliation of Segment Operating Income (Loss) to Net Income available to PLC’s common shareowners
|
(Dollars In Thousands) |
|
1ST QTR |
|
1ST QTR |
| ||
|
(Unaudited) |
|
2011 |
|
2012 |
| ||
|
|
|
|
|
|
| ||
|
Life Marketing |
|
$ |
19,273 |
|
$ |
30,369 |
|
|
Acquisitions |
|
32,391 |
|
39,099 |
| ||
|
Annuities |
|
18,640 |
|
35,783 |
| ||
|
Stable Value Products |
|
9,195 |
|
12,646 |
| ||
|
Asset Protection |
|
6,852 |
|
4,966 |
| ||
|
Corporate & Other |
|
10,021 |
|
27,880 |
| ||
|
|
|
|
|
|
| ||
|
Total Pre-tax operating income |
|
96,372 |
|
150,743 |
| ||
|
|
|
|
|
|
| ||
|
Realized Investment Gains (Losses) - Investments |
|
2,734 |
|
22,505 |
| ||
|
Realized Investment Gains (Losses) - Derivatives |
|
(8,341 |
) |
(22,669 |
) | ||
|
Income Tax Expense |
|
(31,887 |
) |
(51,558 |
) | ||
|
|
|
|
|
|
| ||
|
Net income available to PLC’s common shareowners |
|
$ |
58,878 |
|
$ |
99,021 |
|
|
|

Reconciliation of Operating Income per Diluted Share to Net Income Available to PLC’s Common Shareowners per Diluted Share
|
|
|
1ST QTR |
|
2ND QTR |
|
3RD QTR |
|
4TH QTR |
|
1ST QTR |
|
3 MOS |
| |||||||||
|
(Unaudited) |
|
2011 |
|
2011 |
|
2011 |
|
2011 |
|
2012 |
|
2011 |
|
2012 |
| |||||||
|
|
|
|
|
|
|
|
|
|
|
|
|
|
|
|
| |||||||
|
OPERATING INCOME PER SHARE |
|
|
|
|
|
|
|
|
|
|
|
|
|
|
| |||||||
|
|
|
|
|
|
|
|
|
|
|
|
|
|
|
|
| |||||||
|
Operating income per share-diluted |
|
$ |
0.71 |
|
$ |
0.86 |
|
$ |
0.74 |
|
$ |
0.97 |
|
$ |
1.18 |
|
$ |
0.71 |
|
$ |
1.18 |
|
|
RIGL - Derivatives per share-diluted |
|
(0.06 |
) |
(0.22 |
) |
(0.69 |
) |
(0.03 |
) |
(0.18 |
) |
(0.06 |
) |
(0.18 |
) | |||||||
|
RIGL - All Other Investments-diluted |
|
0.02 |
|
0.36 |
|
0.91 |
|
0.08 |
|
0.18 |
|
0.02 |
|
0.18 |
| |||||||
|
Net income available to PLC’s common shareowners per share-diluted |
|
$ |
0.67 |
|
$ |
1.00 |
|
$ |
0.96 |
|
$ |
1.02 |
|
$ |
1.18 |
|
$ |
0.67 |
|
$ |
1.18 |
|
|
|

Reconciliation of Total Protective Life Corporation’s Shareowners’ Equity per Share to Total Protective Life Corporation’s Shareowners’ Equity (Excl. AOCI) per share
|
|
|
1ST QTR |
|
2ND QTR |
|
3RD QTR |
|
4TH QTR |
|
1ST QTR |
| |||||
|
(Unaudited) |
|
2011 |
|
2011 |
|
2011 |
|
2011 |
|
2012 |
| |||||
|
|
|
|
|
|
|
|
|
|
|
|
| |||||
|
PROTECTIVE LIFE CORPORATION’S SHAREOWNERS’ EQUITY PER SHARE |
|
|
|
|
|
|
|
|
|
|
| |||||
|
Total Protective Life Corporation’s Shareowners’ Equity |
|
$ |
34.07 |
|
$ |
36.68 |
|
$ |
43.22 |
|
$ |
45.45 |
|
$ |
46.74 |
|
|
Less: Accumulated other comprehensive income (loss) |
|
3.91 |
|
5.54 |
|
10.94 |
|
12.07 |
|
12.37 |
| |||||
|
Excluding accumulated other comprehensive income (loss) |
|
$ |
30.16 |
|
$ |
31.14 |
|
$ |
32.28 |
|
$ |
33.38 |
|
$ |
34.37 |
|
|
|
Page 26 |

Calculation of Operating Income Return on Average Equity Rolling Twelve Months Ended March 31, 2012
|
(Dollars In Thousands) |
|
Three Months |
|
Twelve Months |
| |||||||||||
|
(Unaudited) |
|
6/30/2011 |
|
9/30/2011 |
|
12/31/2011 |
|
3/31/2012 |
|
3/31/2012 |
| |||||
|
NUMERATOR: |
|
|
|
|
|
|
|
|
|
|
| |||||
|
Net income available to PLC’s common shareowners |
|
$ |
87,623 |
|
$ |
82,857 |
|
$ |
86,034 |
|
$ |
99,021 |
|
$ |
355,535 |
|
|
Less: |
|
|
|
|
|
|
|
|
|
|
| |||||
|
Realized investment gains (losses), net of income tax |
|
|
|
|
|
|
|
|
|
|
| |||||
|
Investments |
|
32,129 |
|
83,460 |
|
7,041 |
|
11,025 |
|
133,655 |
| |||||
|
Derivatives |
|
(19,396 |
) |
(59,744 |
) |
(2,129 |
) |
(14,734 |
) |
(96,003 |
) | |||||
|
Related amortization of DAC and VOBA, net of income tax |
|
(468 |
) |
(5,036 |
) |
(664 |
) |
3,603 |
|
(2,565 |
) | |||||
|
Add back: |
|
|
|
|
|
|
|
|
|
|
| |||||
|
Derivative gains related to Corp. debt and investments, net of income tax |
|
— |
|
— |
|
— |
|
— |
|
— |
| |||||
|
Operating Income |
|
$ |
75,358 |
|
$ |
64,177 |
|
$ |
81,786 |
|
$ |
99,127 |
|
$ |
320,448 |
|
|
|
|
|
|
|
|
Total |
| |||
|
|
|
|
|
|
|
Protective Life |
| |||
|
|
|
|
|
|
|
Corporation’s |
| |||
|
|
|
Total |
|
|
|
Shareowners’ |
| |||
|
|
|
Protective Life |
|
Accumulated |
|
Equity Excluding |
| |||
|
|
|
Corporation’s |
|
Other |
|
Accumulated Other |
| |||
|
|
|
Shareowners’ |
|
Comprehensive |
|
Comprehensive |
| |||
|
|
|
Equity |
|
Income (Loss) |
|
Income (Loss) |
| |||
|
DENOMINATOR: |
|
|
|
|
|
|
| |||
|
March 31, 2011 |
|
$ |
2,919,665 |
|
$ |
334,944 |
|
$ |
2,584,721 |
|
|
June 30, 2011 |
|
3,104,801 |
|
469,071 |
|
2,635,730 |
| |||
|
September 30, 2011 |
|
3,579,515 |
|
906,068 |
|
2,673,447 |
| |||
|
December 31, 2011 |
|
3,711,517 |
|
985,444 |
|
2,726,073 |
| |||
|
March 31, 2012 |
|
3,785,810 |
|
1,001,803 |
|
2,784,007 |
| |||
|
Total |
|
|
|
|
|
$ |
13,403,978 |
| ||
|
|
|
|
|
|
|
|
| |||
|
Average |
|
|
|
|
|
$ |
2,680,796 |
| ||
|
|
|
|
|
|
|
|
| |||
|
Operating Income Return on Average Equity |
|
|
|
|
|
12.0 |
% | |||
|
|
Page 27 |

Calculation of Operating Income Return on Average Equity Rolling Twelve Months Ended March 31, 2011
|
|
|
|
|
|
|
|
|
|
|
|
| |||||
|
(Dollars In Thousands) |
|
Three Months |
|
Twelve Months |
| |||||||||||
|
(Unaudited) |
|
6/30/2010 |
|
9/30/2010 |
|
12/31/2010 |
|
3/31/2011 |
|
3/31/2011 |
| |||||
|
NUMERATOR: |
|
|
|
|
|
|
|
|
|
|
| |||||
|
Net income available to PLC’s common shareowners |
|
$ |
25,032 |
|
$ |
55,762 |
|
$ |
81,383 |
|
$ |
58,878 |
|
$ |
221,055 |
|
|
Less: |
|
|
|
|
|
|
|
|
|
|
| |||||
|
Realized investment gains (losses), net of income tax |
|
|
|
|
|
|
|
|
|
|
| |||||
|
Investments |
|
33,089 |
|
67,062 |
|
(50,214 |
) |
(774 |
) |
49,163 |
| |||||
|
Derivatives |
|
(76,276 |
) |
(59,324 |
) |
66,541 |
|
(5,422 |
) |
(74,481 |
) | |||||
|
Related amortization of DAC and VOBA, net of income tax |
|
14,417 |
|
(760 |
) |
723 |
|
2,551 |
|
16,931 |
| |||||
|
Add back: |
|
|
|
|
|
|
|
|
|
|
| |||||
|
Derivative gains related to Corp. debt and investments, net of income tax |
|
27 |
|
27 |
|
27 |
|
— |
|
81 |
| |||||
|
Operating Income |
|
$ |
53,829 |
|
$ |
48,811 |
|
$ |
64,360 |
|
$ |
62,523 |
|
$ |
229,523 |
|
|
|
|
|
|
|
|
Total |
| |||
|
|
|
|
|
|
|
Protective Life |
| |||
|
|
|
|
|
|
|
Corporation’s |
| |||
|
|
|
Total |
|
|
|
Shareowners’ |
| |||
|
|
|
Protective Life |
|
Accumulated |
|
Equity Excluding |
| |||
|
|
|
Corporation’s |
|
Other |
|
Accumulated Other |
| |||
|
|
|
Shareowners’ |
|
Comprehensive |
|
Comprehensive |
| |||
|
|
|
Equity |
|
Income (Loss) |
|
Income (Loss) |
| |||
|
DENOMINATOR: |
|
|
|
|
|
|
| |||
|
March 31, 2010 |
|
$ |
2,348,512 |
|
$ |
(52,027 |
) |
$ |
2,400,539 |
|
|
June 30, 2010 |
|
2,605,378 |
|
189,818 |
|
2,415,560 |
| |||
|
September 30, 2010 |
|
3,086,756 |
|
624,562 |
|
2,462,194 |
| |||
|
December 31, 2010 |
|
2,841,188 |
|
307,850 |
|
2,533,338 |
| |||
|
March 31, 2011 |
|
2,919,665 |
|
334,944 |
|
2,584,721 |
| |||
|
Total |
|
|
|
|
|
$ |
12,396,352 |
| ||
|
|
|
|
|
|
|
|
| |||
|
Average |
|
|
|
|
|
$ |
2,479,270 |
| ||
|
|
|
|
|
|
|
|
| |||
|
Operating Income Return on Average Equity |
|
|
|
|
|
9.3 |
% | |||
|
|
Page 28 |

Calculation of Net Income Available to PLC’s common shareowners Return on Average Equity Rolling Twelve Months Ended March 31, 2012
|
(Dollars In Thousands) |
|
Three Months |
|
Twelve Months |
| |||||||||||
|
(Unaudited) |
|
6/30/2011 |
|
9/30/2011 |
|
12/31/2011 |
|
3/31/2012 |
|
3/31/2012 |
| |||||
|
NUMERATOR: |
|
|
|
|
|
|
|
|
|
|
| |||||
|
Net income available to PLC’s common shareowners |
|
$ |
87,623 |
|
$ |
82,857 |
|
$ |
86,034 |
|
$ |
99,021 |
|
$ |
355,535 |
|
|
|
|
|
|
|
|
Total |
| |||
|
|
|
|
|
|
|
Protective Life |
| |||
|
|
|
|
|
|
|
Corporation’s |
| |||
|
|
|
Total |
|
|
|
Shareowners’ |
| |||
|
|
|
Protective Life |
|
Accumulated |
|
Equity Excluding |
| |||
|
|
|
Corporation’s |
|
Other |
|
Accumulated Other |
| |||
|
|
|
Shareowners’ |
|
Comprehensive |
|
Comprehensive |
| |||
|
|
|
Equity |
|
Income (Loss) |
|
Income (Loss) |
| |||
|
DENOMINATOR: |
|
|
|
|
|
|
| |||
|
March 31, 2011 |
|
$ |
2,919,665 |
|
$ |
334,944 |
|
$ |
2,584,721 |
|
|
June 30, 2011 |
|
3,104,801 |
|
469,071 |
|
2,635,730 |
| |||
|
September 30, 2011 |
|
3,579,515 |
|
906,068 |
|
2,673,447 |
| |||
|
December 31, 2011 |
|
3,711,517 |
|
985,444 |
|
2,726,073 |
| |||
|
March 31, 2012 |
|
3,785,810 |
|
1,001,803 |
|
2,784,007 |
| |||
|
Total |
|
|
|
|
|
$ |
13,403,978 |
| ||
|
|
|
|
|
|
|
|
| |||
|
Average |
|
|
|
|
|
$ |
2,680,796 |
| ||
|
|
|
|
|
|
|
|
| |||
|
Net income available to PLC’s common shareowners Return on Average Equity |
|
|
|
|
|
13.3 |
% | |||
|
|
Page 29 |

Calculation of Net Income available to PLC’s common shareowners Return on Average Equity Rolling Twelve Months Ended March 31, 2011
|
(Dollars In Thousands) |
|
Three Months |
|
Twelve Months |
| |||||||||||
|
(Unaudited) |
|
6/30/2010 |
|
9/30/2010 |
|
12/31/2010 |
|
3/31/2011 |
|
3/31/2011 |
| |||||
|
NUMERATOR: |
|
|
|
|
|
|
|
|
|
|
| |||||
|
Net income available to PLC’s common shareowners |
|
$ |
25,032 |
|
$ |
55,762 |
|
$ |
81,383 |
|
$ |
58,878 |
|
$ |
221,055 |
|
|
|
|
|
|
|
|
Total |
| |||
|
|
|
|
|
|
|
Protective Life |
| |||
|
|
|
|
|
|
|
Corporation’s |
| |||
|
|
|
Total |
|
|
|
Shareowners’ |
| |||
|
|
|
Protective Life |
|
Accumulated |
|
Equity Excluding |
| |||
|
|
|
Corporation’s |
|
Other |
|
Accumulated Other |
| |||
|
|
|
Shareowners’ |
|
Comprehensive |
|
Comprehensive |
| |||
|
|
|
Equity |
|
Income (Loss) |
|
Income (Loss) |
| |||
|
DENOMINATOR: |
|
|
|
|
|
|
| |||
|
March 31, 2010 |
|
$ |
2,348,512 |
|
$ |
(52,027 |
) |
$ |
2,400,539 |
|
|
June 30, 2010 |
|
2,605,378 |
|
189,818 |
|
2,415,560 |
| |||
|
September 30, 2010 |
|
3,086,756 |
|
624,562 |
|
2,462,194 |
| |||
|
December 31, 2010 |
|
2,841,188 |
|
307,850 |
|
2,533,338 |
| |||
|
March 31, 2011 |
|
2,919,665 |
|
334,944 |
|
2,584,721 |
| |||
|
Total |
|
|
|
|
|
$ |
12,396,352 |
| ||
|
|
|
|
|
|
|
|
| |||
|
Average |
|
|
|
|
|
$ |
2,479,270 |
| ||
|
|
|
|
|
|
|
|
| |||
|
Net income available to PLC’s common shareowners Return on Average Equity |
|
|
|
|
|
8.9 |
% | |||
|
|
Page 30 |

Summary of Impact of DAC Accounting & Operating Definition Change
|
(Dollars In Thousands) |
|
1ST QTR |
|
2ND QTR |
|
3RD QTR |
|
4TH QTR |
|
12 MOS |
| |||||
|
(Unaudited) |
|
2011 |
|
2011 |
|
2011 |
|
2011 |
|
2011 |
| |||||
|
|
|
|
|
|
|
|
|
|
|
|
| |||||
|
GAAP Consolidated Statement of Income Data: |
|
|
|
|
|
|
|
|
|
|
| |||||
|
Pre-tax Operating Income (Loss) (1) |
|
|
|
|
|
|
|
|
|
|
| |||||
|
Life Marketing as originally reported |
|
$ |
26,239 |
|
$ |
33,704 |
|
$ |
20,321 |
|
$ |
36,010 |
|
$ |
116,274 |
|
|
DAC change |
|
(6,966 |
) |
(3,441 |
) |
(7,544 |
) |
(2,200 |
) |
(20,151 |
) | |||||
|
Life Marketing as adjusted |
|
19,273 |
|
30,263 |
|
12,777 |
|
33,810 |
|
96,123 |
| |||||
|
|
|
|
|
|
|
|
|
|
|
|
| |||||
|
Asset Protection as originally reported |
|
6,542 |
|
5,530 |
|
6,019 |
|
6,571 |
|
24,662 |
| |||||
|
DAC change |
|
310 |
|
155 |
|
145 |
|
135 |
|
745 |
| |||||
|
Asset Protection as adjusted |
|
6,852 |
|
5,685 |
|
6,164 |
|
6,706 |
|
25,407 |
| |||||
|
|
|
|
|
|
|
|
|
|
|
|
| |||||
|
Annuities as originally reported |
|
13,085 |
|
24,375 |
|
43,784 |
|
29,482 |
|
110,726 |
| |||||
|
DAC change |
|
(4,935 |
) |
(5,237 |
) |
(4,179 |
) |
(4,451 |
) |
(18,802 |
) | |||||
|
VA change to operating income |
|
10,490 |
|
(1,960 |
) |
(19,429 |
) |
(801 |
) |
(11,700 |
) | |||||
|
Annuities as adjusted |
|
18,640 |
|
17,178 |
|
20,176 |
|
24,230 |
|
80,224 |
| |||||
|
|
|
|
|
|
|
|
|
|
|
|
| |||||
|
Stable Value Products |
|
9,195 |
|
19,142 |
|
14,217 |
|
14,226 |
|
56,780 |
| |||||
|
Acquisitions |
|
32,391 |
|
39,429 |
|
44,028 |
|
41,545 |
|
157,393 |
| |||||
|
Corporate & Other |
|
10,021 |
|
3,977 |
|
(3,815 |
) |
(4,416 |
) |
5,767 |
| |||||
|
|
|
|
|
|
|
|
|
|
|
|
| |||||
|
Total Pre-tax Operating Income as originally reported |
|
97,473 |
|
126,157 |
|
124,554 |
|
123,418 |
|
471,602 |
| |||||
|
DAC change |
|
(11,591 |
) |
(8,523 |
) |
(11,578 |
) |
(6,516 |
) |
(38,208 |
) | |||||
|
VA change to operating income |
|
10,490 |
|
(1,960 |
) |
(19,429 |
) |
(801 |
) |
(11,700 |
) | |||||
|
Total Pre-tax Operating Income as adjusted |
|
96,372 |
|
115,674 |
|
93,547 |
|
116,101 |
|
421,694 |
| |||||
|
|
|
|
|
|
|
|
|
|
|
|
| |||||
|
Income before income tax as originally reported |
|
104,095 |
|
143,273 |
|
131,203 |
|
128,581 |
|
507,152 |
| |||||
|
DAC change |
|
(13,381 |
) |
(8,434 |
) |
(8,917 |
) |
(5,944 |
) |
(36,676 |
) | |||||
|
Income before income tax as adjusted |
|
90,714 |
|
134,839 |
|
122,286 |
|
122,637 |
|
470,476 |
| |||||
|
|
|
|
|
|
|
|
|
|
|
|
| |||||
|
Net Income Available to PLC’s Common Shareowners as originally reported |
|
67,517 |
|
93,068 |
|
88,614 |
|
89,871 |
|
339,070 |
| |||||
|
DAC change |
|
(8,639 |
) |
(5,445 |
) |
(5,757 |
) |
(3,837 |
) |
(23,678 |
) | |||||
|
Net Income Available to PLC’s Common Shareowners as adjusted |
|
58,878 |
|
87,623 |
|
82,857 |
|
86,034 |
|
315,392 |
| |||||
|
|
|
|
|
|
|
|
|
|
|
|
| |||||
|
Per Share Data (Diluted): |
|
|
|
|
|
|
|
|
|
|
| |||||
|
Operating Earnings per Share as originally reported (1) |
$ |
0.72 |
|
$ |
0.94 |
|
$ |
0.98 |
|
$ |
1.02 |
|
$ |
3.65 |
| |
|
DAC change |
|
(0.09 |
) |
(0.06 |
) |
(0.09 |
) |
(0.05 |
) |
(0.28 |
) | |||||
|
VA change to operating income |
|
0.08 |
|
(0.02 |
) |
(0.15 |
) |
— |
|
(0.09 |
) | |||||
|
Operating Earnings per Share as adjusted |
|
$ |
0.71 |
|
$ |
0.86 |
|
$ |
0.74 |
|
$ |
0.97 |
|
$ |
3.28 |
|
|
|
|
|
|
|
|
|
|
|
|
|
| |||||
|
Net Income Available to PLC’s Common Shareowners as originally reported |
|
$ |
0.77 |
|
$ |
1.06 |
|
$ |
1.03 |
|
$ |
1.06 |
|
$ |
3.92 |
|
|
DAC change |
|
(0.10 |
) |
(0.06 |
) |
(0.07 |
) |
(0.04 |
) |
(0.27 |
) | |||||
|
Net Income Available to PLC’s Common Shareowners as adjusted |
|
$ |
0.67 |
|
$ |
1.00 |
|
$ |
0.96 |
|
$ |
1.02 |
|
$ |
3.65 |
|
(1) “Operating income” is a non-GAAP financial measure. “Net income available to PLC’s common shareowners” is a GAAP financial measure to which “Operating Income” may be compared.
|
|
Page 31 |

Summary of Impact of DAC Accounting Change
|
(Dollars In Thousands) |
|
1ST QTR |
|
2ND QTR |
|
3RD QTR |
|
4TH QTR |
| ||||
|
(Unaudited) |
|
2011 |
|
2011 |
|
2011 |
|
2011 |
| ||||
|
|
|
|
|
|
|
|
|
|
| ||||
|
GAAP Consolidated Balance Sheet Data: |
|
|
|
|
|
|
|
|
| ||||
|
|
|
|
|
|
|
|
|
|
| ||||
|
Total GAAP Assets as originally reported |
|
$ |
48,295,466 |
|
$ |
50,987,849 |
|
$ |
52,023,403 |
|
$ |
52,932,085 |
|
|
DAC change |
|
(771,013 |
) |
(775,521 |
) |
(779,092 |
) |
(788,716 |
) | ||||
|
Total GAAP Assets as adjusted |
|
$ |
47,524,453 |
|
$ |
50,212,328 |
|
$ |
51,244,311 |
|
$ |
52,143,369 |
|
|
|
|
|
|
|
|
|
|
|
| ||||
|
Total PLC’s Shareowners’ Equity as originally reported |
|
3,417,209 |
|
3,605,238 |
|
4,082,235 |
|
4,220,465 |
| ||||
|
DAC change |
|
(497,544 |
) |
(500,437 |
) |
(502,720 |
) |
(508,948 |
) | ||||
|
Total PLC’s Shareowners’ Equity as adjusted |
|
$ |
2,919,665 |
|
$ |
3,104,801 |
|
$ |
3,579,515 |
|
$ |
3,711,517 |
|
|
|
|
|
|
|
|
|
|
|
| ||||
|
Total PLC’s Shareowners’ Equity Excluding AOCI as originally reported (1) |
|
3,097,855 |
|
3,154,309 |
|
3,197,783 |
|
3,254,246 |
| ||||
|
DAC change |
|
(513,134 |
) |
(518,579 |
) |
(524,336 |
) |
(528,173 |
) | ||||
|
Total PLC’s Shareowners’ Equity Excluding AOCI as adjusted (1) |
|
$ |
2,584,721 |
|
$ |
2,635,730 |
|
$ |
2,673,447 |
|
$ |
2,726,073 |
|
|
|
|
|
|
|
|
|
|
|
| ||||
|
Per Share Data (Common Shares Outstanding): |
|
|
|
|
|
|
|
|
| ||||
|
|
|
|
|
|
|
|
|
|
| ||||
|
Total PLC’s Shareowners’ Equity as originally reported |
|
39.87 |
|
42.59 |
|
49.30 |
|
51.68 |
| ||||
|
DAC change |
|
(5.80 |
) |
(5.91 |
) |
(6.08 |
) |
(6.23 |
) | ||||
|
Total PLC’s Shareowners’ Equity as adjusted |
|
$ |
34.07 |
|
$ |
36.68 |
|
$ |
43.22 |
|
$ |
45.45 |
|
|
|
|
|
|
|
|
|
|
|
| ||||
|
Total PLC’s Shareowners’ Equity Excluding AOCI as originally reported (1) |
|
36.15 |
|
37.26 |
|
38.61 |
|
39.85 |
| ||||
|
DAC change |
|
(5.99 |
) |
(6.12 |
) |
(6.33 |
) |
(6.47 |
) | ||||
|
Total PLC’s Shareowners’ Equity Excluding AOCI as adjusted (1) |
|
$ |
30.16 |
|
$ |
31.14 |
|
$ |
32.28 |
|
$ |
33.38 |
|
(1) “Total PLC’s Shareowners’ Equity excluding accumulated other comprehensive income (loss)” is a non-GAAP financial measure. “Total PLC Shareowners’ equity” is a GAAP financial measure to which “Total PLC’s Shareowners’ Equity excluding accumulated other comprehensive income (loss)” can be compared.
|
|
Draft 5/8/2012
|

Summary of Impact of DAC Accounting & Operating Definition Change
|
(Dollars In Thousands) |
|
|
|
|
|
|
|
|
| ||||
|
(Unaudited) |
|
2007 |
|
2008 |
|
2009 |
|
2010 |
| ||||
|
|
|
|
|
|
|
|
|
|
| ||||
|
GAAP Consolidated Statement of Income Data: |
|
|
|
|
|
|
|
|
| ||||
|
|
|
|
|
|
|
|
|
|
| ||||
|
Pre-tax Operating Income (Loss) (1) |
|
|
|
|
|
|
|
|
| ||||
|
Life Marketing as originally reported |
|
$ |
189,186 |
|
$ |
188,535 |
|
$ |
137,826 |
|
$ |
147,470 |
|
|
DAC change |
|
(48,411 |
) |
(42,714 |
) |
(30,018 |
) |
(23,606 |
) | ||||
|
Life Marketing as adjusted |
|
140,775 |
|
145,821 |
|
107,808 |
|
123,864 |
| ||||
|
|
|
|
|
|
|
|
|
|
| ||||
|
Asset Protection as originally reported |
|
41,559 |
|
30,789 |
|
23,229 |
|
29,897 |
| ||||
|
DAC change |
|
244 |
|
1,729 |
|
3,019 |
|
1,594 |
| ||||
|
Asset Protection as adjusted |
|
41,803 |
|
32,518 |
|
26,248 |
|
31,491 |
| ||||
|
|
|
|
|
|
|
|
|
|
| ||||
|
Annuities as originally reported |
|
23,051 |
|
18,707 |
|
56,642 |
|
53,901 |
| ||||
|
DAC change |
|
(18,201 |
) |
(27,212 |
) |
(15,997 |
) |
(22,689 |
) | ||||
|
VA change to operating income |
|
— |
|
16,744 |
|
(18,591 |
) |
20,951 |
| ||||
|
Annuities as adjusted |
|
4,850 |
|
8,239 |
|
22,054 |
|
52,163 |
| ||||
|
|
|
|
|
|
|
|
|
|
| ||||
|
Stable Value Products |
|
50,231 |
|
89,811 |
|
61,963 |
|
39,207 |
| ||||
|
Acquisitions |
|
129,247 |
|
136,479 |
|
133,760 |
|
111,143 |
| ||||
|
Corporate & Other |
|
(3,416 |
) |
(105,986 |
) |
81,980 |
|
(25,053 |
) | ||||
|
|
|
|
|
|
|
|
|
|
| ||||
|
Total Pre-tax Operating Income as originally reported |
|
429,858 |
|
358,335 |
|
495,400 |
|
356,565 |
| ||||
|
DAC change |
|
(66,368 |
) |
(68,197 |
) |
(42,996 |
) |
(44,701 |
) | ||||
|
VA change to operating income |
|
— |
|
16,744 |
|
(18,591 |
) |
20,951 |
| ||||
|
Total Pre-tax Operating Income as adjusted |
|
363,490 |
|
306,882 |
|
433,813 |
|
332,815 |
| ||||
|
|
|
|
|
|
|
|
|
|
| ||||
|
Income before income tax as originally reported |
|
436,088 |
|
(75,131 |
) |
416,778 |
|
388,863 |
| ||||
|
DAC change |
|
(66,368 |
) |
(68,197 |
) |
(34,593 |
) |
(54,091 |
) | ||||
|
Income before income tax as adjusted |
|
369,720 |
|
(143,328 |
) |
382,185 |
|
334,772 |
| ||||
|
|
|
|
|
|
|
|
|
|
| ||||
|
Net Income Available to PLC’s Common Shareowners |
|
289,566 |
|
(41,855 |
) |
271,488 |
|
260,241 |
| ||||
|
DAC change |
|
(42,837 |
) |
(44,031 |
) |
(22,351 |
) |
(34,927 |
) | ||||
|
Net Income Available to PLC’s Common Shareowners |
|
246,729 |
|
(85,886 |
) |
249,137 |
|
225,314 |
| ||||
|
|
|
|
|
|
|
|
|
|
| ||||
|
Per Share Data (Diluted): |
|
|
|
|
|
|
|
|
| ||||
|
Operating Earnings per Share as originally reported (1) |
|
$ |
3.99 |
|
$ |
3.37 |
|
$ |
3.97 |
|
$ |
2.73 |
|
|
DAC change |
|
(0.60 |
) |
(0.62 |
) |
(0.34 |
) |
(0.33 |
) | ||||
|
VA change to operating income |
|
— |
|
0.15 |
|
(0.15 |
) |
0.15 |
| ||||
|
Operating Earnings per Share as adjusted |
|
$ |
3.39 |
|
$ |
2.90 |
|
$ |
3.48 |
|
$ |
2.55 |
|
|
|
|
|
|
|
|
|
|
|
| ||||
|
Net Income Available to PLC’s Common Shareowners as originally reported |
|
$ |
4.05 |
|
$ |
(0.59 |
) |
$ |
3.34 |
|
$ |
2.97 |
|
|
DAC change |
|
(0.60 |
) |
(0.62 |
) |
(0.27 |
) |
(0.40 |
) | ||||
|
Net Income Available to PLC’s Common Shareowners as adjusted |
|
$ |
3.45 |
|
$ |
(1.21 |
) |
$ |
3.07 |
|
$ |
2.57 |
|
(1) “Operating income” is a non-GAAP financial measure. “Net income available to PLC’s common shareowners” is a GAAP financial measure to which “Operating Income” may be compared.
|
|
Draft 5/8/2012
|

Summary of Impact of DAC Accounting Change
|
(Dollars In Thousands) |
|
|
|
|
|
|
|
|
| ||||
|
(Unaudited) |
|
2007 |
|
2008 |
|
2009 |
|
2010 |
| ||||
|
|
|
|
|
|
|
|
|
|
| ||||
|
GAAP Consolidated Balance Sheet Data: |
|
|
|
|
|
|
|
|
| ||||
|
|
|
|
|
|
|
|
|
|
| ||||
|
Total GAAP Assets as originally reported |
|
$ |
41,786,041 |
|
$ |
39,572,449 |
|
$ |
42,311,587 |
|
$ |
47,562,786 |
|
|
DAC change |
|
(624,656 |
) |
(729,089 |
) |
(728,036 |
) |
(759,163 |
) | ||||
|
Total GAAP Assets as adjusted |
|
$ |
41,161,385 |
|
$ |
38,843,360 |
|
$ |
41,583,551 |
|
$ |
46,803,623 |
|
|
|
|
|
|
|
|
|
|
|
| ||||
|
Total PLC’s Shareowners’ Equity as originally reported |
|
2,456,761 |
|
761,095 |
|
2,478,821 |
|
3,331,087 |
| ||||
|
DAC change |
|
(403,135 |
) |
(470,538 |
) |
(469,892 |
) |
(489,899 |
) | ||||
|
Total PLC’s Shareowners’ Equity as adjusted |
|
$ |
2,053,626 |
|
$ |
290,557 |
|
$ |
2,008,929 |
|
$ |
2,841,188 |
|
|
|
|
|
|
|
|
|
|
|
| ||||
|
Total PLC’s Shareowners’ Equity Excluding AOCI as originally reported (1) |
|
2,537,290 |
|
2,428,151 |
|
2,799,990 |
|
3,037,833 |
| ||||
|
DAC change |
|
(403,186 |
) |
(447,217 |
) |
(469,568 |
) |
(504,495 |
) | ||||
|
Total PLC’s Shareowners’ Equity Excluding AOCI as adjusted (1) |
|
$ |
2,134,104 |
|
$ |
1,980,934 |
|
$ |
2,330,422 |
|
$ |
2,533,338 |
|
|
|
|
|
|
|
|
|
|
|
| ||||
|
Per Share Data (Common Shares Outstanding): |
|
|
|
|
|
|
|
|
| ||||
|
|
|
|
|
|
|
|
|
|
| ||||
|
Total PLC’s Shareowners’ Equity as originally reported |
|
35.02 |
|
10.89 |
|
28.96 |
|
38.88 |
| ||||
|
DAC change |
|
(5.74 |
) |
(6.73 |
) |
(5.49 |
) |
(5.71 |
) | ||||
|
Total PLC’s Shareowners’ Equity as adjusted |
|
$ |
29.28 |
|
$ |
4.16 |
|
$ |
23.47 |
|
$ |
33.17 |
|
|
|
|
|
|
|
|
|
|
|
| ||||
|
Total PLC’s Shareowners’ Equity Excluding AOCI as originally reported (1) |
|
36.17 |
|
34.74 |
|
32.72 |
|
35.46 |
| ||||
|
DAC change |
|
(5.75 |
) |
(6.40 |
) |
(5.49 |
) |
(5.89 |
) | ||||
|
Total PLC’s Shareowners’ Equity Excluding AOCI as adjusted (1) |
|
$ |
30.42 |
|
$ |
28.34 |
|
$ |
27.23 |
|
$ |
29.57 |
|
(1) “Total PLC’s Shareowners’ Equity excluding accumulated other comprehensive income (loss)” is a non-GAAP financial measure. “Total PLC Shareowners’ equity” is a GAAP financial measure to which “Total PLC’s Shareowners’ Equity excluding accumulated other comprehensive income (loss)” can be compared.