Attached files
| file | filename |
|---|---|
| 8-K - 8-K - EnergySolutions, Inc. | a12-11613_18k.htm |
| EX-99.1 - EX-99.1 - EnergySolutions, Inc. | a12-11613_1ex99d1.htm |
Exhibit 99.2
|
|
ENERGYSOLUTIONS May 9, 2012 |

|
|
Forward-looking statements disclaimer This presentation is made in conjunction with the first quarter 2012 conference call which contains forward-looking statements that involve substantial risks and uncertainties. You can identify forward-looking statements by words such as anticipate, believe, could, estimate, expect, intend, may, plan, should, will, would or similar words. You should consider these statements carefully because they discuss our plans, targets, strategies, prospects and expectations concerning our business, operating results, financial condition and other similar matters. We believe that it is important to communicate our future expectations to our investors. There may be events in the future, however, that we are not able to predict accurately or control. Our actual results may differ materially from the expectations we describe in our forward looking statements. Factors or events that could cause our actual results to materially differ may emerge from time to time, and it is not possible for us to accurately predict all of them. Before you invest in our common stock, you should be aware that the occurrence of any such event could have a material adverse effect on our business, results of operation and financial position. Any forward-looking statement made by us in this presentation speaks only as of the date on which we make it. We undertake no obligation to update or revise any forward-looking statements, whether as a result of new information, future events or otherwise, except as required by law. |
|
|
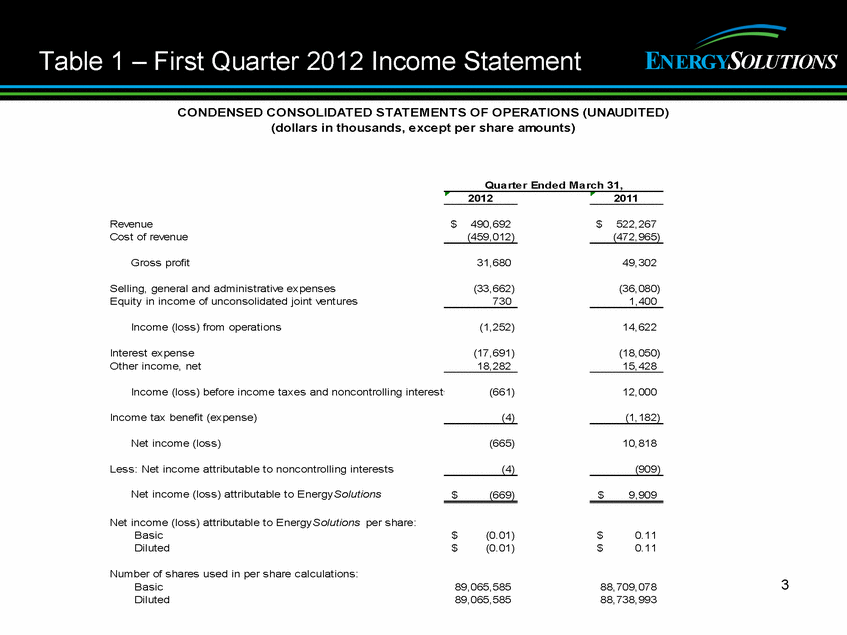
Table 1 – First Quarter 2012 Income Statement 3 Quarter Ended March 31, 2012 2011 Revenue $ 490,692 $ 522,267 Cost of revenue (459,012) (472,965) Gross profit 31,680 49,302 Selling, general and administrative expenses (33,662) (36,080) Equity in income of unconsolidated joint ventures 730 1,400 Income (loss) from operations (1,252) 14,622 Interest expense (17,691) (18,050) Other income, net 18,282 15,428 Income (loss) before income taxes and noncontrolling interest (661) 12,000 Income tax benefit (expense) (4) (1,182) Net income (loss) (665) 10,818 Less: Net income attributable to noncontrolling interests (4) (909) Net income (loss) attributable to EnergySolutions $ (669) $ 9,909 Net income (loss) attributable to EnergySolutions per share: Basic $ (0.01) $ 0.11 Diluted $ (0.01) $ 0.11 Number of shares used in per share calculations: Basic 89,065,585 88,709,078 Diluted 89,065,585 88,738,993 CONDENSED CONSOLIDATED STATEMENTS OF OPERATIONS (UNAUDITED) (dollars in thousands, except per share amounts) |
|
|
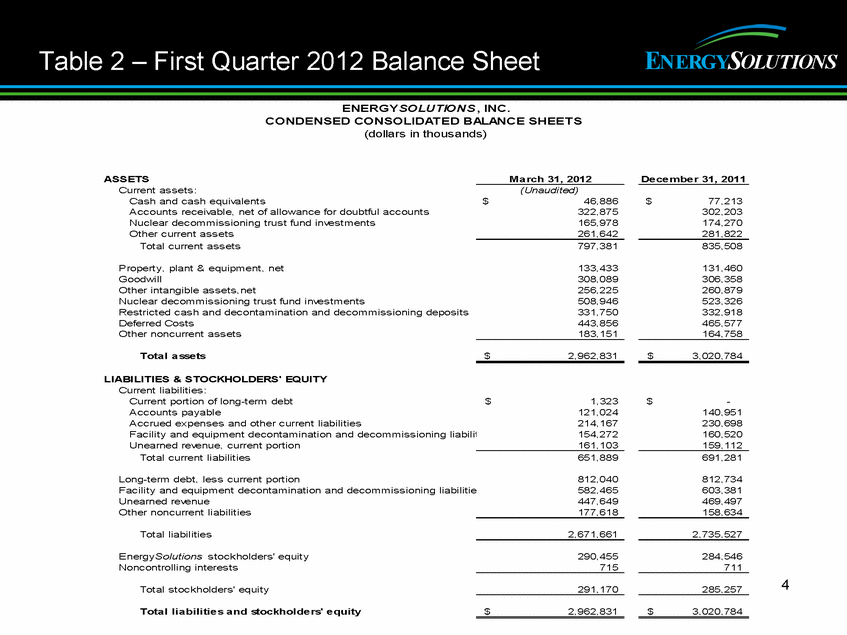
Table 2 – First Quarter 2012 Balance Sheet 4 ASSETS March 31, 2012 December 31, 2011 Current assets: (Unaudited) Cash and cash equivalents $ 46,886 $ 77,213 Accounts receivable, net of allowance for doubtful accounts 322,875 302,203 Nuclear decommissioning trust fund investments 165,978 174,270 Other current assets 261,642 281,822 Total current assets 797,381 835,508 Property, plant & equipment, net 133,433 131,460 Goodwill 308,089 306,358 Other intangible assets, net 256,225 260,879 Nuclear decommissioning trust fund investments 508,946 523,326 Restricted cash and decontamination and decommissioning deposits 331,750 332,918 Deferred Costs 443,856 465,577 Other noncurrent assets 183,151 164,758 Total assets $ 2,962,831 $ 3,020,784 LIABILITIES & STOCKHOLDERS' EQUITY Current liabilities: Current portion of long-term debt $ 1,323 $ - Accounts payable 121,024 140,951 Accrued expenses and other current liabilities 214,167 230,698 Facility and equipment decontamination and decommissioning liabilities 154,272 160,520 Unearned revenue, current portion 161,103 159,112 Total current liabilities 651,889 691,281 Long-term debt, less current portion 812,040 812,734 Facility and equipment decontamination and decommissioning liabilities 582,465 603,381 Unearned revenue 447,649 469,497 Other noncurrent liabilities 177,618 158,634 Total liabilities 2,671,661 2,735,527 EnergySolutions stockholders' equity 290,455 284,546 Noncontrolling interests 715 711 Total stockholders' equity 291,170 285,257 Total liabilities and stockholders' equity $ 2,962,831 $ 3,020,784 ENERGYSOLUTIONS, INC. CONDENSED CONSOLIDATED BALANCE SHEETS (dollars in thousands) |
|
|
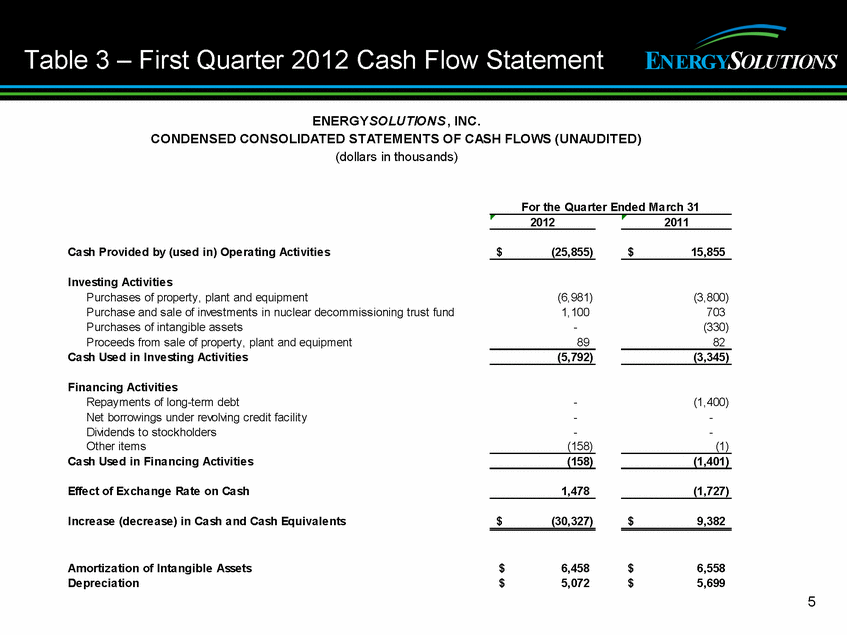
Table 3 – First Quarter 2012 Cash Flow Statement 5 For the Quarter Ended March 31 2012 2011 Cash Provided by (used in) Operating Activities $ (25,855) $ 15,855 Investing Activities Purchases of property, plant and equipment (6,981) (3,800) Purchase and sale of investments in nuclear decommissioning trust fund 1,100 703 Purchases of intangible assets - (330) Proceeds from sale of property, plant and equipment 89 82 Cash Used in Investing Activities (5,792) (3,345) Financing Activities Repayments of long-term debt - (1,400) Net borrowings under revolving credit facility - - Dividends to stockholders - - Other items (158) (1) Cash Used in Financing Activities (158) (1,401) Effect of Exchange Rate on Cash 1,478 (1,727) Increase (decrease) in Cash and Cash Equivalents $ (30,327) $ 9,382 Amortization of Intangible Assets $ 6,458 $ 6,558 Depreciation $ 5,072 $ 5,699 ENERGYSOLUTIONS, INC. CONDENSED CONSOLIDATED STATEMENTS OF CASH FLOWS (UNAUDITED) (dollars in thousands)
|
|
|
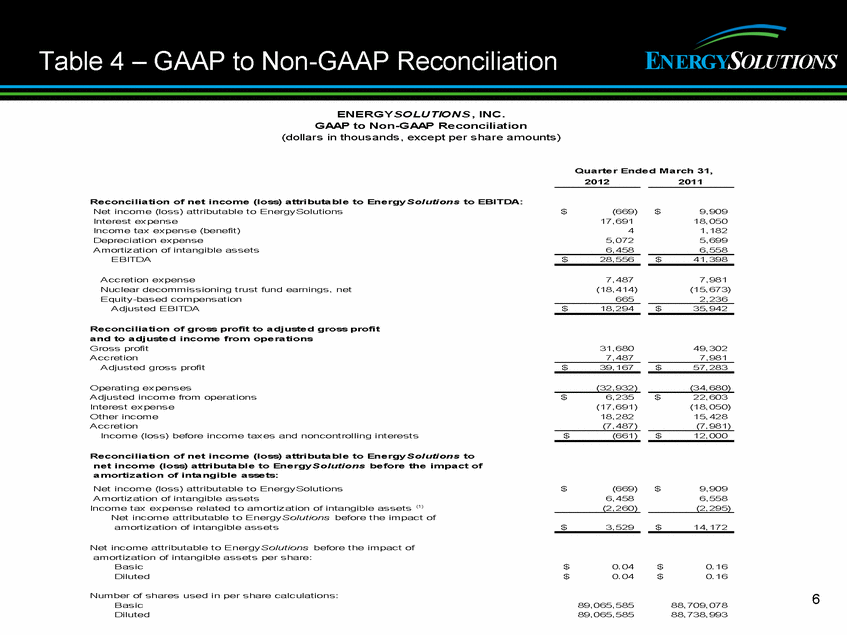
Table 4 – GAAP to Non-GAAP Reconciliation 6 Quarter Ended March 31, 2012 2011 Reconciliation of net income (loss) attributable to EnergySolutions to EBITDA: Net income (loss) attributable to EnergySolutions $ (669) $ 9,909 Interest expense 17,691 18,050 Income tax expense (benefit) 41,182 Depreciation expense 5,072 5,699 Amortization of intangible assets 6,458 6,558 EBITDA $ 28,556 $ 41,398 Accretion expense 7,487 7,981 Nuclear decommissioning trust fund earnings, net (18,414) (15,673) Equity-based compensation 665 2,236 Adjusted EBITDA $ 18,294 $ 35,942 Reconciliation of gross profit to adjusted gross profit and to adjusted income from operations Gross profit 3 1,680 49,302 Accretion 7,487 7,981 Adjusted gross profit $ 39,167 $ 57,283 Operating expenses (32,932) (34,680) Adjusted income from operations $ 6,235 $ 22,603 Interest expense (17,691) (18,050) Other income 18,282 15,428 Accretion (7,487) (7,981) Income (loss) before income taxes and noncontrolling interests $ (661) $ 12,000 Reconciliation of net income (loss) attributable to EnergySolutions to net income (loss) attributable to EnergySolutions before the impact of amortization of intangible assets: Net income (loss) attributable to EnergySolutions $ (669) $ 9,909 Amortization of intangible assets 6,458 6,558 Income tax expense related to amortization of intangible assets (1) (2,260) (2,295) Net income attributable to EnergySolutions before the impact of amortization of intangible assets $ 3,529 $ 14,172 Net income attributable to EnergySolutions before the impact of amortization of intangible assets per share: Basic $ 0.04 $ 0.16 Diluted $ 0.04 $ 0.16 Number of shares used in per share calculations: Basic 89,065,585 88,709,078 Diluted 89,065,585 88,738,993 ENERGYSOLUTIONS, INC. GAAP TO Non-GAAP Reconciliation (dollars in thousands, except per share amounts) |
|
|
Table 4 - Continued 7 The Company defines EBITDA as net income (loss) attributable to EnergySolutions plus interest expense (including the effects of interest rate derivative agreements), income taxes, depreciation, impairment charges and amortization. The Company defines Adjusted EBITDA as EBITDA plus non-cash equity compensation expense and, non-cash accretion expense, plus or minus nuclear decommissioning trust fund gains or losses net of management fees. Beginning in 2011, we have included the changes in ARO cost estimates for the Zion Project as an adjustment to EBITDA to remove certain effects of ARO accounting from this measure. We have also included the corresponding Zion project ARO cost estimate changes for 2010 for presentation purposes. The Company uses EBITDA and Adjusted EBITDA as key indicators of its operating performance and for planning and forecasting future business operations. EBITDA and Adjusted EBITDA, as presented in this release, are supplemental measures of the Company's performance that are not required by, or presented in accordance with, generally accepted accounting principles in the United States ("GAAP"). They are not measures of the Company's financial performance under GAAP and should not be considered as alternatives to net income or any other performance measures derived in accordance with GAAP or as alternatives to cash flow from operating activities as measures of the Company's liquidity. The Company's measurement of EBITDA and Adjusted EBITDA may not be comparable to similarly titled measures of other companies. The Company has included information concerning EBITDA and Adjusted EBITDA in this release because they are used by management to measure operating performance and because the Company believes that such information is often used by certain investors as measures of a company’s historical performance and for modeling. EBITDA and Adjusted EBITDA have limitations as analytical tools, and investors should not consider them in isolation, or as a substitute for analysis of the Company's operating results or cash flows as reported under GAAP. Some of these limitations are: They do not reflect the Company's cash flows, cash expenditures, or future requirements for capital expenditures or contractual commitments; They do not reflect changes in, or cash requirements for, the Company's working capital needs; They do not reflect the significant interest expense or the cash requirements necessary to service interest or principal payments on the Company's debt; Although depreciation is a non-cash charge, the assets being depreciated will often have to be replaced in the future, and EBITDA and Adjusted EBITDA do not reflect any cash requirements for such replacements; They are not adjusted for all non-cash income or expense items that are reflected in the Company's statements of cash flows; and Other companies in the Company's industry may calculate these measures differently than the Company does, limiting their usefulness as comparative measures. Because of these limitations, EBITDA and Adjusted EBITDA should not be considered as measures of discretionary cash available to the Company to invest in the growth of its business. The Company compensates for these limitations by relying primarily on its GAAP results and using EBITDA and Adjusted EBITDA only for supplemental purposes. The Company defines Adjusted Gross Profit as gross profit plus accretion expense. The Company defines Adjusted Income from Operations as Adjusted Gross Profit less operating expenses. The Company uses Adjusted Gross Profit and Adjusted Income from Operations as indicators of its operating performance and for planning and forecasting future business operations. Adjusted Gross Profit and Adjusted Income from Operations, as presented in this release, are supplemental measures of the Company's performance that are not required by, or presented in accordance with, GAAP. They are not measures of the Company's financial performance under GAAP and should not be considered as alternatives to gross profit or any other performance measures derived in accordance with GAAP. The Company defines net income attributable to EnergySolutions before the impact of amortization of intangible assets as net income attributable to EnergySolutions plus amortization expense of intangible assets, net of the related income tax expense. These non-GAAP measures may be useful to investors seeking to compare the Company's operating performance on a consistent basis from period to period that, when viewed with its GAAP results and the above reconciliation, management believes provides a more complete understanding of factors and trends affecting the Company's business than GAAP measures alone. These measures should not be considered as substitutes for net income attributable to EnergySolutions, as determined in accordance with GAAP, and you should not consider them in isolation or as a substitute for analyzing the Company's results as reported under GAAP. |

|
|
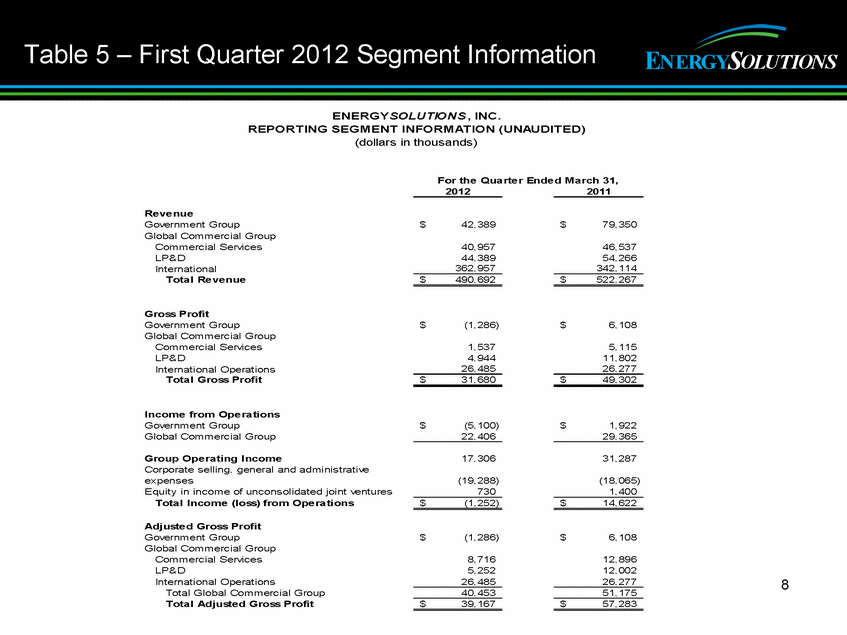
Table 5 – First Quarter 2012 Segment Information 8 For the Quarter Ended March 31, 2012 2011 Revenue Government Group $ 42,389 $ 79,350 Global Commercial Group Commercial Services 40,957 46,537 LP&D 44,389 54,266 International 362,957 342,114 Total Revenue $ 490,692 $ 522,267 Gross Profit Government Group $ (1,286) $ 6,108 Global Commercial Group Commercial Services 1,537 5,115 LP&D 4,944 11,802 International Operations 26,485 26,277 Total Gross Profit $ 31,680 $ 49,302 Income from Operations Government Group $ (5,100) $ 1,922 Global Commercial Group 22,406 29,365 Group Operating Income 17,306 31,287 Corporate selling, general and administrative expenses (19,288) (18,065) Equity in income of unconsolidated joint ventures 730 1,400 Total Income (loss) from Operations $ (1,252) $ 14,622 Adjusted Gross Profit Government Group $ (1,286) $ 6,108 Global Commercial Group Commercial Services 8,716 12,896 LP&D 5,252 12,002 International Operations 26,485 26,277 Total Global Commercial Group 40,453 51,175 Total Adjusted Gross Profit $ 39,167 $ 57,283 ENERGYSOLUTIONS, INC. REPORTING SEGMENT INFORMATION (UNAUDITED) (dollars in thousands) |
|
|
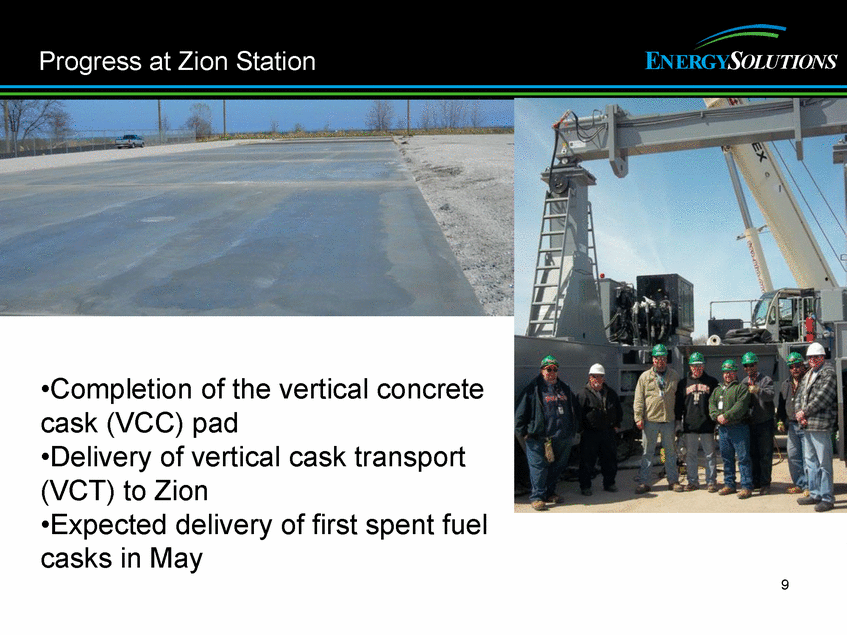
Progress at Zion Station •Completion of the vertical concrete cask (VCC) pad •Delivery of vertical cask transport (VCT) to Zion •Expected delivery of first spent fuel casks in May 9 |
|
|
ENERGYSOLUTIONS |
