Attached files
| file | filename |
|---|---|
| 8-K - FORM 8-K - Apollo Residential Mortgage, Inc. | d352194d8k.htm |
| EX-99.1 - EARNINGS RELEASE - Apollo Residential Mortgage, Inc. | d352194dex991.htm |
Exhibit 99.2
APOLLO
Residential Mortgage, Inc.
Supplemental Financial Information Presentation
Q1 2012
May 9, 2012
Information is as of March 31, 2012 except as otherwise noted.
It should not be assumed that investments made in the future will be profitable or will equal the performance of investments in this document.
Apollo Residential Mortgage, Inc.
2012 First Quarter Earnings Call
APPOLLO
APOLLO RESIDENTIAL MORTGAGE, INC. (“AMTG”)
May 9, 2012
Michael A. Commaroto
Chief Executive Officer
Stuart Rothstein
Chief Financial Officer
Keith Rosenbloom
Agency Portfolio Manager
Paul Mangione
Non-Agency Portfolio Manager
Teresa Covello
Controller of the Manager
Hilary Ginsberg
Investor Relations Manager
| 2 |
|
APPOLLO
APOLLO RESIDENTIAL MORTGAGE, INC. (“AMTG”)
Forward Looking Statements
We make forward-looking statements in this presentation and other filings we make with the SEC within the meaning of Section 27A of the Securities Act of 1933, as amended, and Section 21E of the Securities Exchange Act of 1934, as amended, and such statements are intended to be covered by the safe harbor provided by the same. Forward-looking statements are subject to substantial risks and uncertainties, many of which are difficult to predict and are generally beyond our control. These forward-looking statements include information about possible or assumed future results of our business, financial condition, liquidity, results of operations, plans and objectives, including information about our ability to generate attractive returns while attempting to mitigate risk. When used in this release, the words “believe,” “expect,” “anticipate,” “estimate,” “plan,” “continue,” “intend,” “should,” “may” or similar expressions, are intended to identify forward-looking statements. Statements regarding the following subjects, among others, may be forward-looking: the return on equity; the yield on investments; the ability to borrow to finance assets; and risks associated with investing in real estate assets, including changes in business conditions and the general economy.
The forward-looking statements are based on our beliefs, assumptions and expectations of our future performance, taking into account all information currently available to us. Forward-looking statements are not predictions of future events. These beliefs, assumptions and expectations can change as a result of many possible events or factors, not all of which are known to us. Some of these factors are described in the Company’s Annual Report on Form 10-K for the year ended December 31, 2011 and other filings with the Securities and Exchange Commission. If a change occurs, our business, financial condition, liquidity and results of operations may vary materially from those expressed in our forward-looking statements. Any forward-looking statement speaks only as of the date on which it is made. New risks and uncertainties arise over time, and it is not possible for us to predict those events or how they may affect us. Except as required by law, we are not obligated to, and do not intend to, update or revise any forward-looking statements, whether as a result of new information, future events or otherwise.
This presentation may contain statistics and other data that in some cases has been obtained from or compiled from information made available by third-party service providers.
| 3 |
|
APPOLLO
APOLLO RESIDENTIAL MORTGAGE, INC. (“AMTG”)
Discussion Topics
1. AMTG Q1 Results
2. Supplemental Financials
| 4 |
|
APPOLLO
APOLLO RESIDENTIAL MORTGAGE, INC. (“AMTG”)
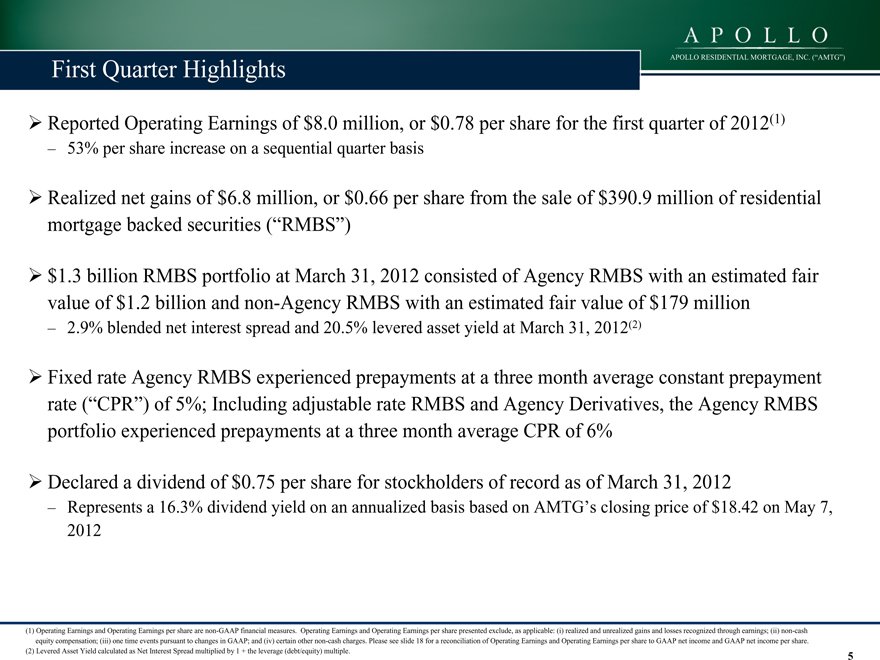
First Quarter Highlights
?Reported Operating Earnings of $8.0 million, or $0.78 per share for the first quarter of 2012(1)
– 53% per share increase on a sequential quarter basis
?Realized net gains of $6.8 million, or $0.66 per share from the sale of $390.9 million of residential mortgage backed securities (“RMBS”)
?$1.3 billion RMBS portfolio at March 31, 2012 consisted of Agency RMBS with an estimated fair value of $1.2 billion and non-Agency RMBS with an estimated fair value of $179 million
– 2.9% blended net interest spread and 20.5% levered asset yield at March 31, 2012(2)
?Fixed rate Agency RMBS experienced prepayments at a three month average constant prepayment rate (“CPR”) of 5%; Including adjustable rate RMBS and Agency Derivatives, the Agency RMBS portfolio experienced prepayments at a three month average CPR of 6%
?Declared a dividend of $0.75 per share for stockholders of record as of March 31, 2012
– Represents a 16.3% dividend yield on an annualized basis based on AMTG’s closing price of $18.42 on May 7, 2012
(1) Operating Earnings and Operating Earnings per share are non-GAAP financial measures. Operating Earnings and Operating Earnings per share presented exclude, as applicable: (i) realized and unrealized gains and losses recognized through earnings; (ii) non-cash equity compensation; (iii) one time events pursuant to changes in GAAP; and (iv) certain other non-cash charges. Please see slide 18 for a reconciliation of Operating Earnings and Operating Earnings per share to GAAP net income and GAAP net income per share. (2) Levered Asset Yield calculated as Net Interest Spread multiplied by 1 + the leverage (debt/equity) multiple.
| 5 |
|
APPOLLO
APOLLO RESIDENTIAL MORTGAGE, INC. (“AMTG”)
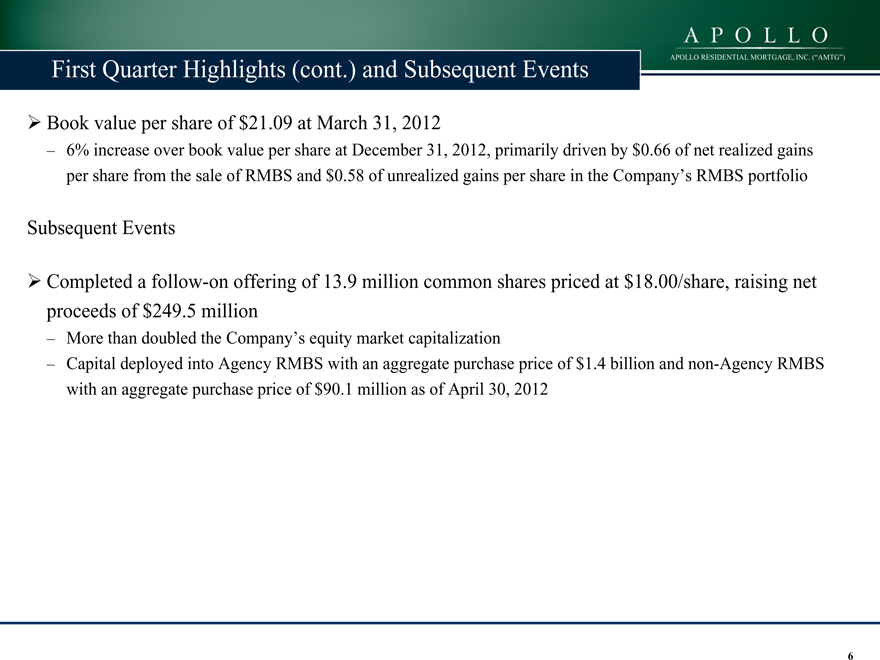
First Quarter Highlights (cont.) and Subsequent Events
?Book value per share of $21.09 at March 31, 2012
– 6% increase over book value per share at December 31, 2012, primarily driven by $0.66 of net realized gains per share from the sale of RMBS and $0.58 of unrealized gains per share in the Company’s RMBS portfolio
Subsequent Events
?Completed a follow-on offering of 13.9 million common shares priced at $18.00/share, raising net proceeds of $249.5 million
– More than doubled the Company’s equity market capitalization
– Capital deployed into Agency RMBS with an aggregate purchase price of $1.4 billion and non-Agency RMBS with an aggregate purchase price of $90.1 million as of April 30, 2012
| 6 |
|
APPOLLO
APOLLO RESIDENTIAL MORTGAGE, INC. (“AMTG”)
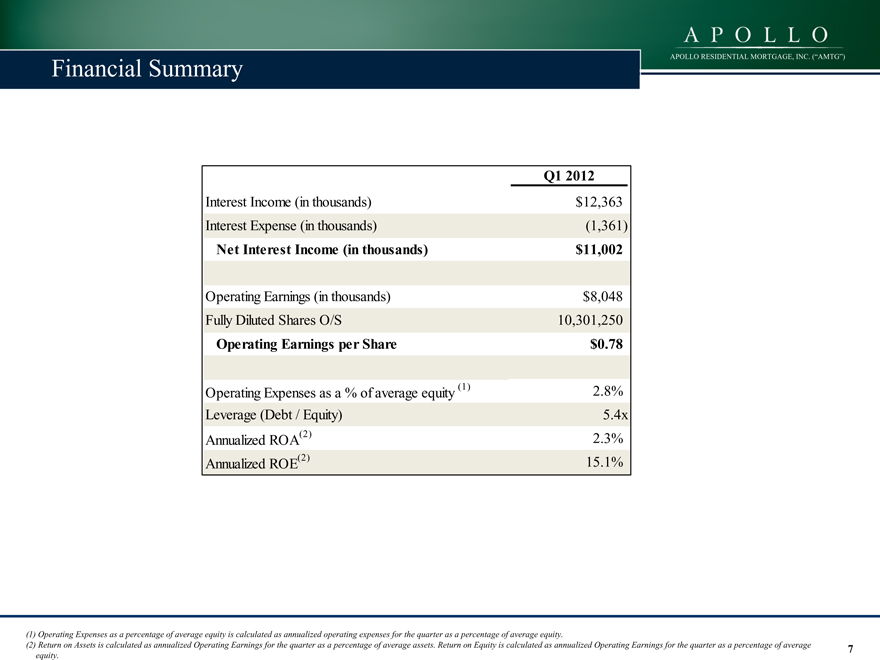
Financial Summary
Q1 2012
Interest Income (in thousands) $12,363 Interest Expense (in thousands) (1,361)
Net Interest Income (in thousands) $11,002
Operating Earnings (in thousands) $8,048 Fully Diluted Shares O/S 10,301,250
Operating Earnings per Share $0.78
Operating Expenses as a % of average equity (1) 2.8% Leverage (Debt / Equity) 5.4x Annualized ROA(2) 2.3% Annualized ROE(2) 15.1%
(1) Operating Expenses as a percentage of average equity is calculated as annualized operating expenses for the quarter as a percentage of average equity.
(2) Return on Assets is calculated as annualized Operating Earnings for the quarter as a percentage of average assets. Return on Equity is calculated as annualized Operating Earnings for the quarter as a percentage of average equity.
| 7 |
|
APPOLLO
APOLLO RESIDENTIAL MORTGAGE, INC. (“AMTG”)
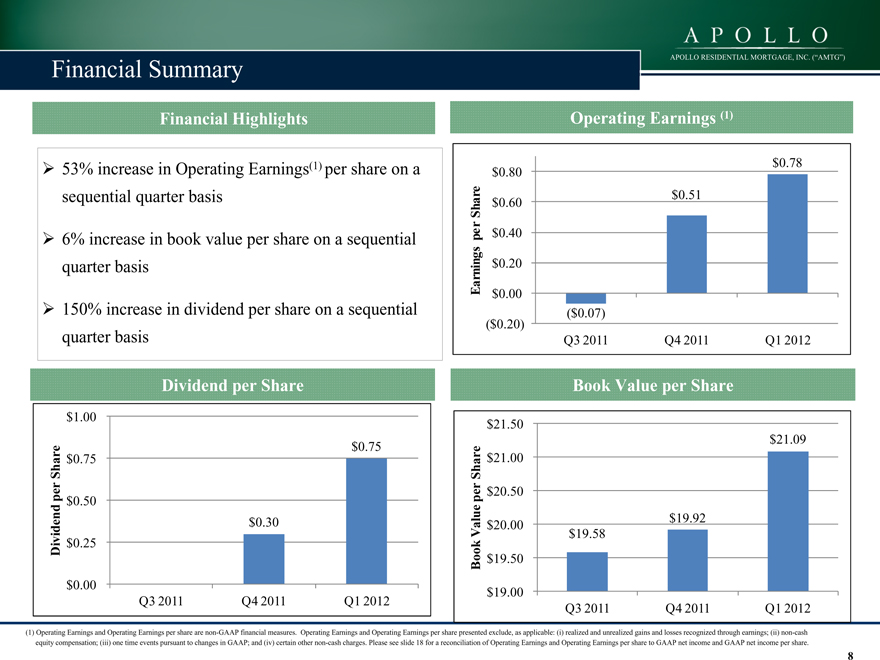
Financial Summary
Financial Highlights
Operating Earnings (1)
?53% increase in Operating Earnings(1) per share on a sequential quarter basis
?6% increase in book value per share on a sequential quarter basis
?150% increase in dividend per share on a sequential quarter basis
$0.80 Share $0.60 per $0.40 Earnings $0.20 $0.00
($0.20) Q3 2011 Q4 2011 Q1 2012
$0.51 $0.78
Dividend per Share
$1.00
Share $0.75 per $0.50
Dividend $0.25 $0.00
$0.75
$0.30
Q3 2011 Q4 2011 Q1 2012
Book Value per Share
$21.50 Share $21.00 per $20.50 Value $20.00 Book $19.50 $19.00
$21.09 $19.92 $19.58
Q3 2011 Q4 2011 Q1 2012
(1) Operating Earnings and Operating Earnings per share are non-GAAP financial measures. Operating Earnings and Operating Earnings per share presented exclude, as applicable: (i) realized and unrealized gains and losses recognized through earnings; (ii) non-cash equity compensation; (iii) one time events pursuant to changes in GAAP; and (iv) certain other non-cash charges. Please see slide 18 for a reconciliation of Operating Earnings and Operating Earnings per share to GAAP net income and GAAP net income per share.
| 8 |
|
APOLLO RESIDENTIAL MORTGAGE, INC. (“AMTG”)
APPOLLO
APOLLO RESIDENTIAL MORTGAGE, INC. (“AMTG”)
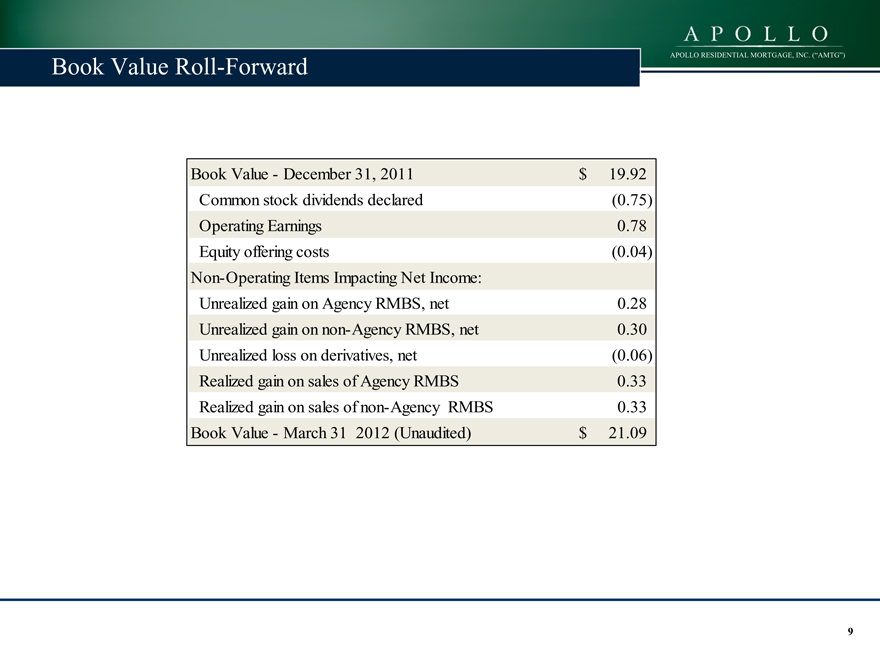
Book Value Roll-Forward
Book Value—December 31, 2011 $ 19.92 Common stock dividends declared (0.75) Operating Earnings 0.78 Equity offering costs (0.04) Non-Operating Items Impacting Net Income: Unrealized gain on Agency RMBS, net 0.28 Unrealized gain on non-Agency RMBS, net 0.30 Unrealized loss on derivatives, net (0.06) Realized gain on sales of Agency RMBS 0.33 Realized gain on sales of non-Agency RMBS 0.33 Book Value—March 31 2012 (Unaudited) $ 21.09
9
APPOLLO
APOLLO RESIDENTIAL MORTGAGE, INC. (“AMTG”)
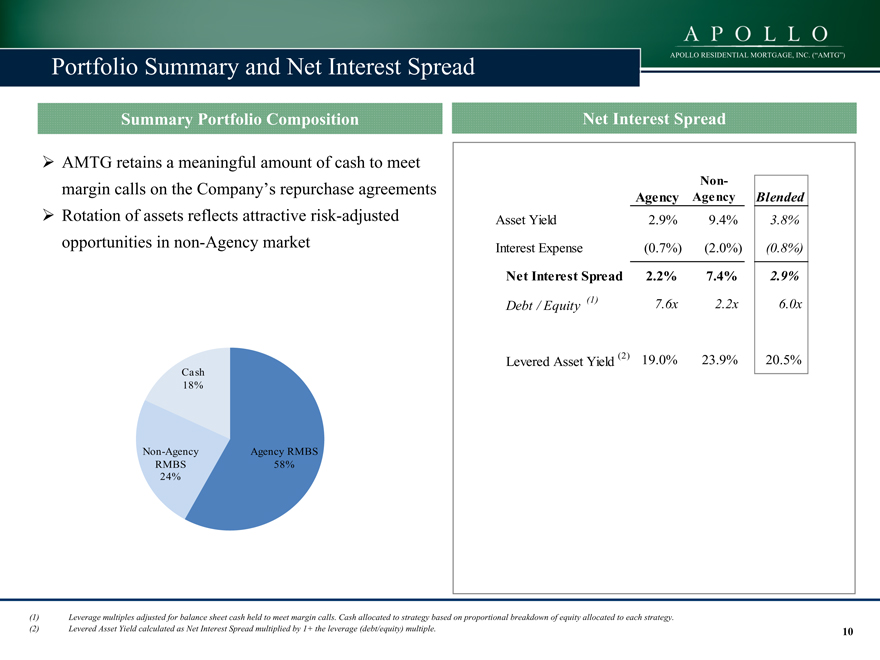
Portfolio Summary and Net Interest Spread
Summary Portfolio Composition
?AMTG retains a meaningful amount of cash to meet margin calls on the Company’s repurchase agreements
?Rotation of assets reflects attractive risk-adjusted opportunities in non-Agency market
Cash 18%
Non-Agency Agency RMBS RMBS 58% 24%
Net Interest Spread
Non-
Agency Agency Blended
Asset Yield 2.9% 9.4% 3.8%
Interest Expense (0.7%) (2.0%) (0.8%)
Net Interest Spread 2.2% 7.4% 2.9%
Debt / Equity (1) 7.6x 2.2x 6.0x
Levered Asset Yield (2) 19.0% 23.9% 20.5%
(1) Leverage multiples adjusted for balance sheet cash held to meet margin calls. Cash allocated to strategy based on proportional breakdown of equity allocated to each strategy. (2) Levered Asset Yield calculated as Net Interest Spread multiplied by 1+ the leverage (debt/equity) multiple.
10
APOllO
APOLLO RESIDENTIAL MORTGAGE, INC. (“AMTG”)
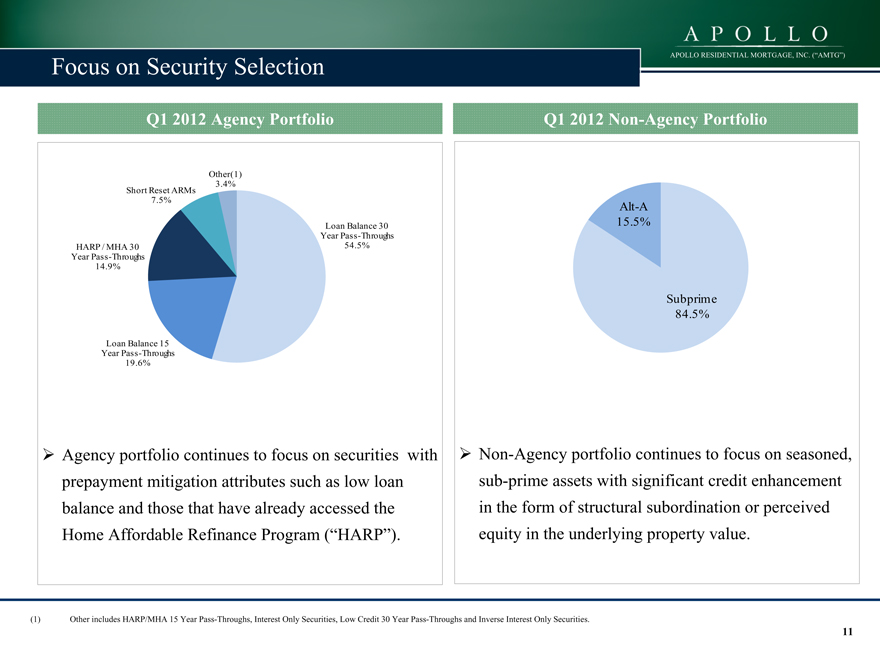
Focus on Security Selection
Q1 2012 Agency Portfolio
Other(1) 3.4%
Short Reset ARMs 7.5%
HARP / MHA 30 Year Pass-Throughs 14.9%
Loan Balance 15 Year Pass-Throughs 19.6%
Loan Balance 30 Year Pass-Throughs 54.5%
Agency portfolio continues to focus on securities with prepayment mitigation attributes such as low loan balance and those that have already accessed the Home Affordable Refinance Program (“HARP”).
Q1 2012 Non-Agency Portfolio
Alt-A 15.5%
Subprime 84.5%
Non-Agency portfolio continues to focus on seasoned, sub-prime assets with significant credit enhancement in the form of structural subordination or perceived equity in the underlying property value.
(1) Other includes HARP/MHA 15 Year Pass-Throughs, Interest Only Securities, Low Credit 30 Year Pass-Throughs and Inverse Interest Only Securities.
11
APOLLO
APOLLO RESIDENTIAL MORTGAGE, INC. (“AMTG”)
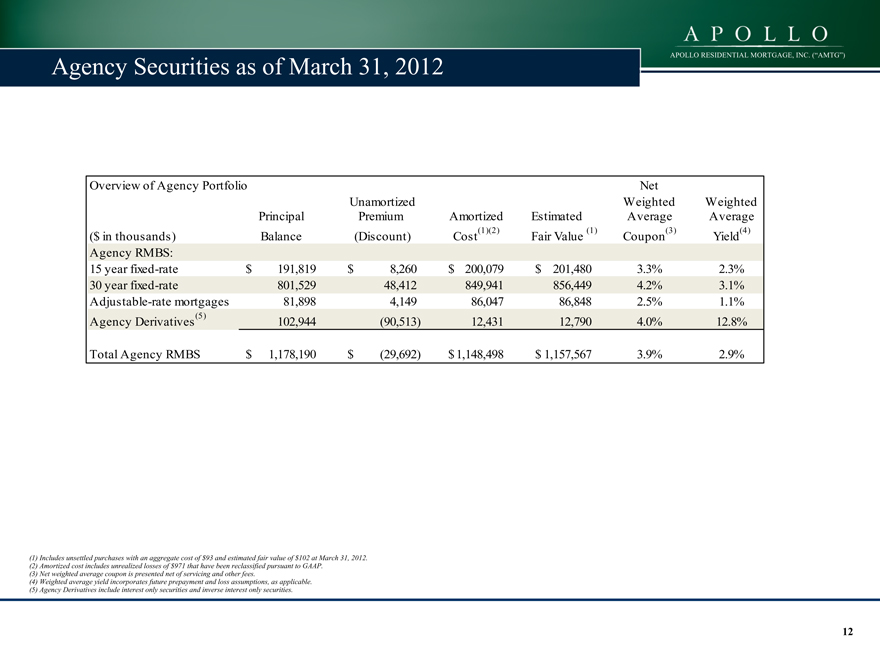
Agency Securities as of March 31, 2012
Overview of Agency Portfolio Net
Unamortized Weighted Weighted
Principal Premium Amortized Estimated Average Average
($ in thousands) Balance (Discount) Cost(1)(2) Fair Value (1) Coupon(3) Yield(4)
Agency RMBS:
15 year fixed-rate $ 191,819 $ 8,260 $ 200,079 $ 201,480 3.3% 2.3%
30 year fixed-rate 801,529 48,412 849,941 856,449 4.2% 3.1%
Adjustable-rate mortgages 81,898 4,149 86,047 86,848 2.5% 1.1%
Agency Derivatives (5) 102,944 (90,513) 12,431 12,790 4.0% 12.8%
Total Agency RMBS $ 1,178,190 $ (29,692) $ 1,148,498 $ 1,157,567 3.9% 2.9%
(1) Includes unsettled purchases with an aggregate cost of $93 and estimated fair value of $102 at March 31, 2012. (2) Amortized cost includes unrealized losses of $971 that have been reclassified pursuant to GAAP.
| (3) |
|
Net weighted average coupon is presented net of servicing and other fees. |
(4) Weighted average yield incorporates future prepayment and loss assumptions, as applicable. (5) Agency Derivatives include interest only securities and inverse interest only securities.
12
APOLLO
APOLLO RESIDENTIAL MORTGAGE, INC. (“AMTG”)
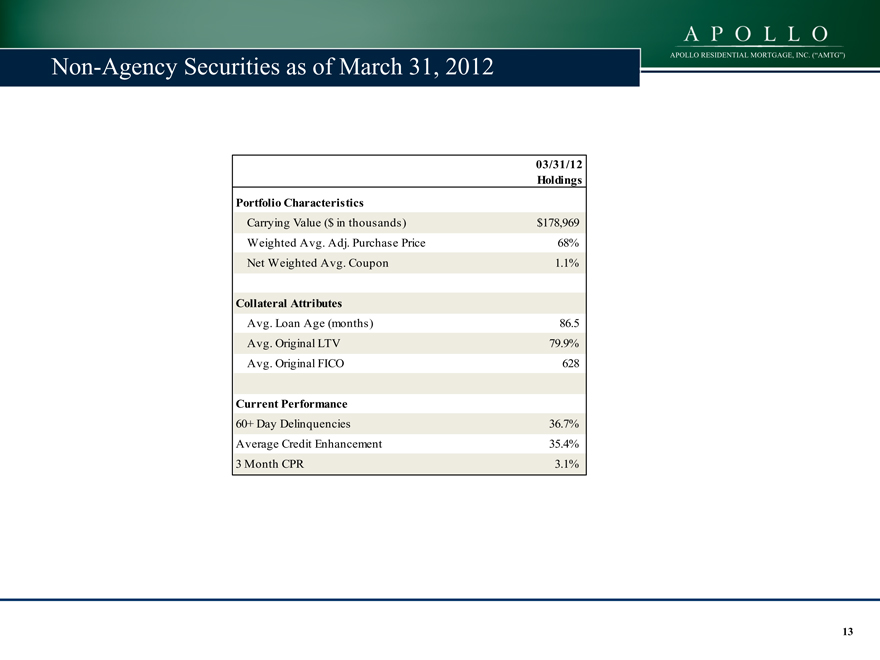
Non-Agency Securities as of March 31, 2012
03/31/12
Holdings
Portfolio Characteristics
Carrying Value ($ in thousands) $178,969
Weighted Avg. Adj. Purchase Price 68%
Net Weighted Avg. Coupon 1.1%
Collateral Attributes
Avg. Loan Age (months) 86.5
Avg. Original LTV 79.9%
Avg. Original FICO 628
Current Performance
60+ Day Delinquencies 36.7%
Average Credit Enhancement 35.4%
| 3 |
|
Month CPR 3.1% |
13
APOLLO
APOLLO RESIDENTIAL MORTGAGE, INC. (“AMTG”)
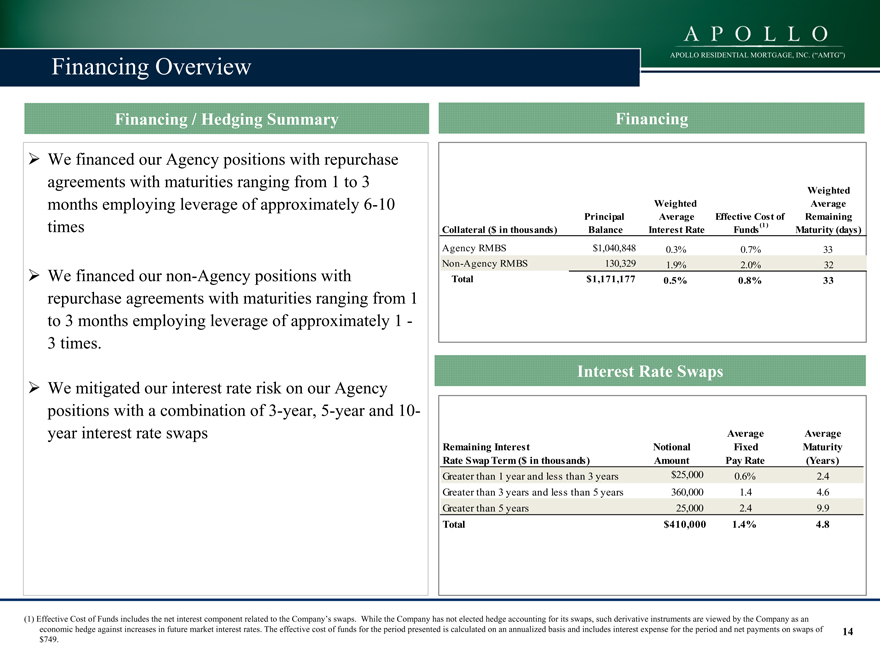
Financing Overview
Financing / Hedging Summary
We financed our Agency positions with repurchase agreements with maturities ranging from 1 to 3 months employing leverage of approximately 6-10 times
We financed our non-Agency positions with repurchase agreements with maturities ranging from 1 to 3 months employing leverage of approximately 1 -3 times.
We mitigated our interest rate risk on our Agency positions with a combination of 3-year, 5-year and 10-year interest rate swaps
Financing
Weighted
Weighted Average
Principal Average Effective Cost of Remaining
Collateral ($ in thousands) Balance Interest Rate Funds (1) Maturity (days)
Agency RMBS $1,040,848 0.3% 0.7% 33
Non-Agency RMBS 130,329 1.9% 2.0% 32
Total $1,171,177 0.5% 0.8% 33
Interest Rate Swaps
(1) Effective Cost of Funds includes the net interest component related to the Company’s swaps. While the Company has not elected hedge accounting for its swaps, such derivative instruments are viewed by the Company as an economic hedge against increases in future market interest rates. The effective cost of funds for the period presented is calculated on an annualized basis and includes interest expense for the period and net payments on swaps of $749.
14
APOLLO
APOLLO RESIDENTIAL MORTGAGE, INC. (“AMTG”)
Discussion Topics
1. AMTG Q1 Results
2. Supplemental Financials
15
APOLLO
APOLLO RESIDENTIAL MORTGAGE, INC. (“AMTG”)
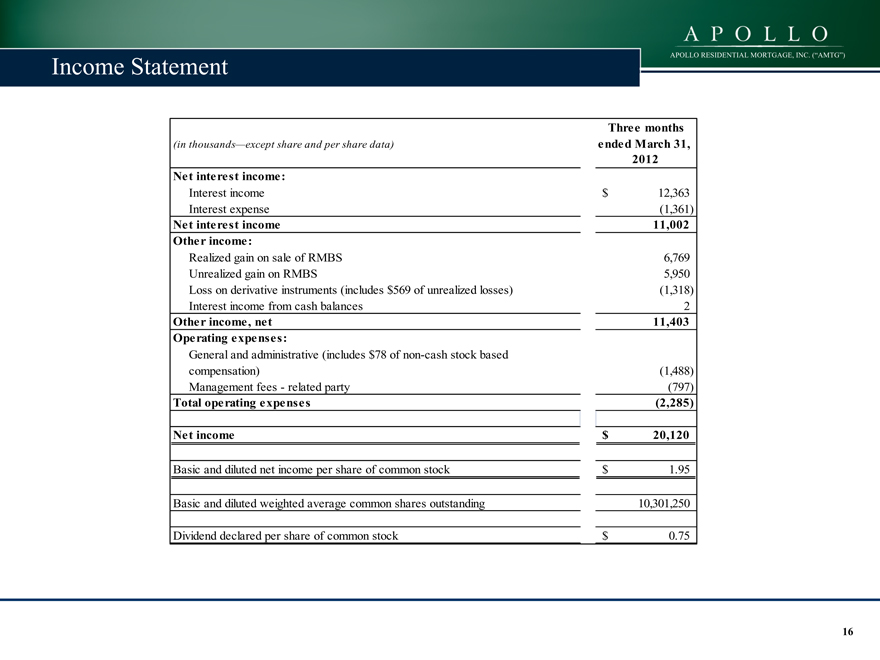
Income Statement
Three months
(in thousands—except share and per share data) ended March 31,
2012
Net interest income:
Interest income $ 12,363
Interest expense (1,361)
Net interest income 11,002
Other income:
Realized gain on sale of RMBS 6,769
Unrealized gain on RMBS 5,950
Loss on derivative instruments (includes $569 of unrealized losses) (1,318)
Interest income from cash balances 2
Other income, net 11,403
Operating expenses:
General and administrative (includes $78 of non-cash stock based
compensation) (1,488)
Management fees—related party (797)
Total operating expenses (2,285)
Net income $ 20,120
Basic and diluted net income per share of common stock $ 1.95
Basic and diluted weighted average common shares outstanding 10,301,250
Dividend declared per share of common stock $ 0.75
16
APOLLO
APOLLO RESIDENTIAL MORTGAGE, INC. (“AMTG”)
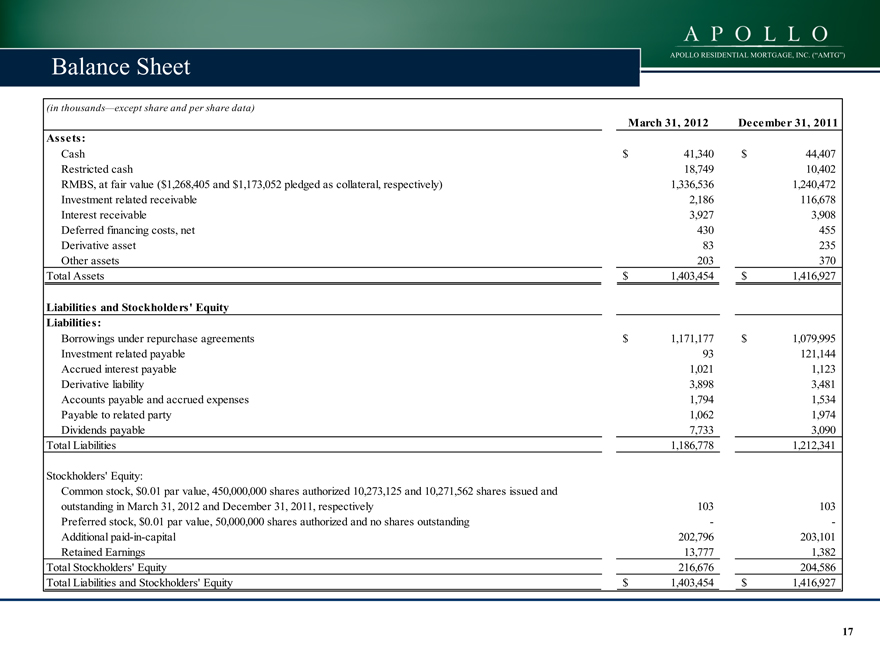
Balance Sheet
(in thousands—except share and per share data)
March 31, 2012 December 31, 2011
Assets:
Cash $ 41,340 $ 44,407
Restricted cash 18,749 10,402
RMBS, at fair value ($1,268,405 and $1,173,052 pledged as collateral, respectively) 1,336,536 1,240,472
Investment related receivable 2,186 116,678
Interest receivable 3,927 3,908
Deferred financing costs, net 430 455
Derivative asset 83 235
Other assets 203 370
Total Assets $ 1,403,454 $ 1,416,927
Liabilities and Stockholders’ Equity
Liabilities:
Borrowings under repurchase agreements $ 1,171,177 $ 1,079,995
Investment related payable 93 121,144
Accrued interest payable 1,021 1,123
Derivative liability 3,898 3,481
Accounts payable and accrued expenses 1,794 1,534
Payable to related party 1,062 1,974
Dividends payable 7,733 3,090
Total Liabilities 1,186,778 1,212,341
Stockholders’ Equity:
Common stock, $0.01 par value, 450,000,000 shares authorized 10,273,125 and 10,271,562 shares issued and
outstanding in March 31, 2012 and December 31, 2011, respectively 103 103
Preferred stock, $0.01 par value, 50,000,000 shares authorized and no shares outstanding — -
Additional paid-in-capital 202,796 203,101
Retained Earnings 13,777 1,382
Total Stockholders’ Equity 216,676 204,586
Total Liabilities and Stockholders’ Equity $ 1,403,454 $ 1,416,927
17
APOLLO
APOLLO RESIDENTIAL MORTGAGE, INC. (“AMTG”)
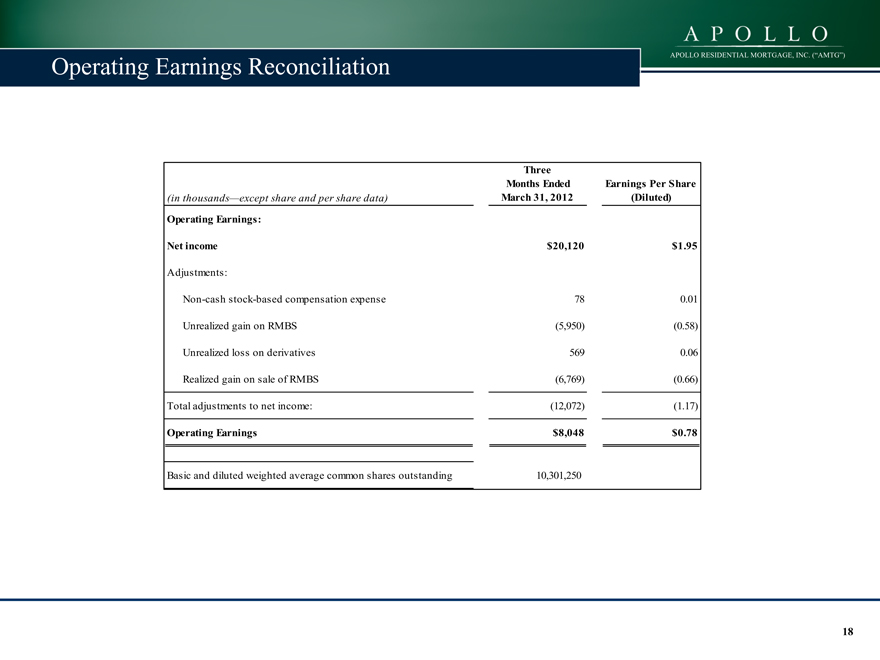
Operating Earnings Reconciliation
Three
Months Ended Earnings Per Share
(in thousands—except share and per share data) March 31, 2012 (Diluted)
Operating Earnings:
Net income $20,120 $1.95
Adjustments:
Non-cash stock-based compensation expense 78 0.01
Unrealized gain on RMBS (5,950) (0.58)
Unrealized loss on derivatives 569 0.06
Realized gain on sale of RMBS (6,769) (0.66)
Total adjustments to net income: (12,072) (1.17)
Operating Earnings $8,048 $0.78
Basic and diluted weighted average common shares outstanding 10,301,250
18
APOLLO
APOLLO RESIDENTIAL MORTGAGE, INC. (“AMTG”)
APOLLO
Apollo Residential Mortgage, Inc.
Contact Information
Hilary Ginsberg
Investor Relations Manager 212-822-0767
19