Attached files
| file | filename |
|---|---|
| 8-K - CURRENT REPORT - Wendy's Co | d348118d8k.htm |
 First Quarter
2012 Earnings
Conference Call
May 8, 2012
©2012 Oldemark LLC
Exhibit 99.1 |
 JOHN
BARKER
CHIEF COMMUNICATIONS OFFICER |
 Today’s Agenda
The Wendy’s Company
Financial Update
Steve Hare
CEO Overview
Emil Brolick
Q&A |
 The Wendy’s Company
Forward-Looking Statements and
Non-GAAP Financial Measures
This presentation, and certain information that management may discuss in connection
with this presentation, contains certain statements that are not historical
facts, including information concerning possible or assumed future results
of
our
operations.
Those
statements
constitute
“forward-looking
statements”
within
the
meaning
of
the
Private
Securities
Litigation Reform Act of 1995 (The “Reform Act”). For all forward-looking
statements, we claim the protection of the safe harbor for forward-looking
statements contained in the Reform Act. Many important factors could affect our
future results and could cause those results to differ materially from those
expressed in or implied by our forward-looking statements. Such factors, all
of which are difficult or impossible to predict accurately, and many of
which
are
beyond
our
control,
include
but
are
not
limited
to
those
identified
under
the
caption
“Forward-Looking
Statements”
in
our
news
release
issued
on
May
8,
2012
and
in
the
“Special
Note
Regarding
Forward-Looking
Statements
and
Projections”
and
“Risk
Factors”
sections of our most recent Form 10-K / Form 10-Qs.
In addition, this presentation and certain information management may discuss in
connection with this presentation reference non- GAAP financial measures,
such as adjusted earnings before interest, taxes, depreciation and amortization, or adjusted EBITDA,
and adjusted earnings per share. Adjusted EBITDA and adjusted earnings per share
exclude certain expenses, net of certain benefits. Reconciliations of
non-GAAP financial measures to the most directly comparable GAAP financial measures are provided
in the Appendix to this presentation, and are included in our news release issued on
May 8, 2012 and posted on www.aboutwendys.com.
The Wendy’s Company |
 STEVE
HARE
CHIEF FINANCIAL OFFICER |
 The Wendy’s Company
Q1 2012 Financial Summary
Fourth consecutive quarter of positive SSS
Q1 2012 system SSS of 0.8% lower than expected
Lost momentum from strong +5.1% SSS in 4Q 2011
Margin negatively impacted by product mix and commodities
Revising Adjusted EBITDA from continuing operations outlook to
$320 to $335 million
Investing in business to drive future growth
|
 Q1 2012 Financial Highlights
Q1 2012 N.A. Same-
Store Sales
Company-owned +0.8%
Franchise
Systemwide
Company Restaurant
Margin
Q1 2012 11.8%
Q1 2011 13.4%
(160) bps
Key Margin
Variance
Commodities
(220) bps
January
February
March
+0.7%
+0.7% |
 The Wendy’s Company
Q1 2012 Financial Highlights
* See reconciliation of Adjusted EBITDA (earnings before interest, taxes,
depreciation and amortization), Adjusted Income and Adjusted Earnings
per Share from continuing operations attributable to The Wendy’s Company in the appendix.
($ in Millions except per share amounts)
Q1 2012
Q1 2011
Better/
(Worse)
Sales
519.9
$
509.3
$
10.6
$
Franchise revenues
73.3
73.2
0.1
Total revenues
593.2
$
582.5
$
10.7
$
Adjusted EBITDA*
63.9
$
73.7
$
(9.8)
$
Income from continuing operations
attributable to The Wendy's Company
12.4
$
$ (0.3)
12.7
$
Reported EPS
0.03
$
$ 0.00
0.03
$
Adjusted income from continuing operations
attributable to The Wendy's Company*
3.3
$
9.3
$
(6.0)
$
Adjusted EPS*
0.01
$
0.02
$
(0.01)
$ |
 Income from Continuing Operations and Special Items
* See reconciliation of Adjusted Income and Adjusted Earnings Per Share
from Continuing Operations in the appendix. The Wendy’s
Company Reconciliation of Adjusted Income and Adjusted Earnings per Share from
Continuing Operations to Income (Loss) and Earnings per Share from Continuing
Operations Attributable to The Wendy's Company (Unaudited)
(In thousands, except per share amounts)
Adjusted income and adjusted earnings per share from continuing operations
Plus (less):
Gain on sale of investment, net
Impairment of long-lived assets
Facilities relocation and other transition costs
Transaction related costs
Arby's indirect corporate overhead in general and administrative
(G&A)
SSG purchasing cooperative expense reversal in G&A
Total Adjustments
Income (loss) from continuing operations and earnings per share
Net income attributable to noncontrolling interests
Income (loss) and earnings per share from continuing operations attributable to The
Wendy's Company per share
per share
3,347
$
0.01
$
9,300
$
0.02
$
17,978
0.05
-
-
(2,783)
(0.01)
(4,873)
(0.01)
(3,429)
(0.01)
-
-
(379)
(0.00)
(1,187)
(0.00)
-
-
(4,970)
(0.01)
-
-
1,434
0.00
11,387
0.03
(9,596)
(0.02)
14,734
0.04
(296)
(0.00)
(2,384)
(0.01)
-
-
12,350
$
0.03
$
(296)
$
(0.00)
$
2012
2011
First Quarter |
 The Wendy’s Company
Q1 2012 Cash Flow
($ in Millions)
Q1 2012
Net Income
14.7
$
Less: Adjustments
(29.8)
Cash flow used in operations
(15.1)
Capital expenditures
(47.0)
Restaurant acquisitions
(2.6)
Proceeds from sale of investment
24.4
Dividends paid
(7.8)
Other financing / investing activities
(2.3)
Net cash decrease before debt payments
(50.4)
Repayments of long-term debt
(6.4)
Net decrease in cash after debt payments
(56.8)
Beginning cash balance
475.2
Ending cash balance
418.4
$ |
  Q1 2012 Consolidated Debt
* See reconciliation of Adjusted EBITDA (earnings before interest, taxes,
depreciation and amortization) in the appendix ($ in Millions)
Senior Debt
1,328.2
$
Capital Leases and Other Debt
24.2
Total Debt
1,352.4
Less: Cash and Cash Equivalents
418.4
Net Debt
934.0
$
TTM Adjusted EBITDA*
321.2
$
Total Debt / TTM Adjusted EBITDA*
4.2x
Net Debt / TTM Adjusted EBITDA*
2.9x
April 1, 2012
The Wendy’s Company |
 The Wendy’s Company
Refinancing: Transaction Summary
Wendy’s International, Inc. raising $1.125 billion of new secured
term loans
and $200 million of revolving Credit Facility
Improves covenant flexibility, extends maturity and increases
liquidity Annual interest savings of $25 million
Transaction proceeds will be used*:
To redeem or repurchase Wendy’s Restaurants’
existing 10% Senior Notes due 2016
To refinance the Company’s existing credit facilities
For
general
corporate
purposes,
including
the
funding
of
related
transaction
fees
and
expenses
Timing
May 15: Settlement of tender
July 16: Expected completion of the call
* Subject to market conditions and other factors, Wendy’s
Restaurants currently intends to redeem on July 16 any Senior Notes that remain outstanding following consummation of the tender offer. |
 2012 and Long-Term Outlook
2012 outlook for Adjusted EBITDA from Continuing
Operations lowered to a range of $320 to $335 million
Reaffirming long-term average annual Adjusted EBITDA
growth rate in the high-single-digit to low-double-digit
range beginning in 2013
The Wendy’s Company |
 2012 Revised Outlook
Sales momentum from October 2011 launch of Dave’s Hot ‘N
Juicy Cheeseburger line did not carry over into Q1 2012
The “W”
Cheeseburger diluted marketing message and cannibalized positive
momentum from Dave’s Hot ‘N’
Juicy
Q1 marketing calendar did not drive sales
Intense competitive couponing and discounting
Wendy’s marketing messages were less effective in driving
transactions The Wendy’s Company |
 2012 Revised Outlook
Unfavorable product mix resulted in negative impact on margin
The “W”
Cheeseburger was mispriced at $2.99
More beef on the “W”
(4.5 ounces) than on Dave’s Hot ‘N’
Juicy (4 ounces)
Caused trade-down from premium rather than trade-up from
value Raising the “W”
a la carte price from $2.99 to $3.19 prior to March promotion did not
achieve desired results
Consumers changed buying behavior
Managed check by buying fewer or different items to maintain or reduce
spending Resulted in less leverage on fixed costs
The Wendy’s Company |
 The Wendy’s Company |
 Wendy’s Long-Term Strategic Growth Components
2013 & Beyond
High-single to
low-double digit
Adjusted
EBITDA
growth rate
Int’l
Franchise
Acquisitions/
Sales
Financial Mgmt.
Breakfast / 24 HR
New Restaurant Development
Image Activation
North American Business Improvement
The Wendy’s Company |
 EMIL
BROLICK
PRESIDENT & CHIEF EXECUTIVE OFFICER |
 The Wendy’s Company
1
st
Quarter Below Expectations
Refining marketing messages
Dynamic consumer & market environment
Restaurant execution improving
Big brand image building
2012: Transition year |
 The Wendy’s Company
We Remain Confident in
Our Strategies
“A Cut Above”
brand positioning
“Recipe to Win”
Growth platforms to produce shareholder value
Financial resources
Building people capabilities
Iron-willed determination |
 “A CUT ABOVE” |
 The Wendy’s Company
A CUT ABOVE
Why it will work
The Wendy’s Company
The Wendy’s Company
Reimaging the Restaurants
Reimaging the People
Reimaging the Experience
Reimaging the Food
Reimaging the Brand Communications |
 The Wendy’s Company
 |
 The Wendy’s Company
Wendy’s Advertising Awareness Levels Have Spiked to Highest
Levels in Over 2 Years
Jan ‘09
Jul ‘09
Jan ‘10
Jul ‘10
Jan ‘11
Jul ‘11
Feb ‘12
TV Advertising (Aided) |
 Source: Millward Brown. Data based on Q3 2011, Q4 2011, Q1 2012.
Since the Launch of Dave’s Hot ‘N Juicy Cheeseburgers,
Wendy’s has Made Gains in Hamburger Attributes
Great Tasting Hamburgers
Use Fresh, Never Frozen Beef
Q3 ‘11
Q4 ‘11
Q1 ‘12
Competitor B
Competitor A
Competitor B
Competitor A
The Wendy’s Company |
 The Wendy’s Company
P
P
RICE
RICE
P
P
RODUCT
RODUCT
P
P
ROMOTION
ROMOTION
P
P
LACE
LACE
P
P
ERFORMANCE
ERFORMANCE
P
P
EOPLE
EOPLE
RECIPE TO WIN |
 PRICE:
Price/Value Imbalance
Company Stores
In 2011, Single transitioned to include cheese in standard build.
2011 pricing reflects blended cheese/no cheese price, prior years show pricing
for Single no cheese. $4.09
$2.49
$3.49
$1.69
$0.99
$0.99
Annual Price Trends
Annual Price Trends
The Wendy’s Company
+$1.50
-
$0.70
Gap
+$3.10
-
$2.50
Gap
+$3.10
-
$2.50
Gap |
 The Wendy’s Company
P
Right Price …
Right Size …
Right Quality …
Moving to a tighter 99-cent value menu
EVERYDAY VALUE MENU
JR. CHEESEBURGER
99
?
CRISPY CHICKEN SANDWICH
99
?
5-PC. SPICY CHICKEN NUGGETS
99
?
VALUE NATURAL-CUT FRIES
99
?
VALUE SOFT DRINK
99
?
SMALL FROSTY
99
?
The Wendy’s Company
RICE
Testing products / prices at “value”
tiers
above 99 cents |
 IMAGE
ACTIVATION •
•Customer reaction extremely positive
•
P
The Wendy’s Company
Ten 2011 prototypes exceeding sales
expectations
LACE
Elevates customer experience with
innovative interior and exterior designs |
 IMAGE ACTIVATION PERFORMANCE
Consumer Insights on Restaurant Design
Consumer Insights on Restaurant Design
All Interiors are a “WOW”
customer experience
Welcoming, Positive Ambiance: Fireplaces, Lounge Seating, Booths,
TVs Separation Between Order Placement and Pick Up
New Queue and Front Counter are Differentiators, Not Typical QSR
The Wendy’s Company |
 The Wendy’s Company
IMAGE ACTIVATION PROGRESS
•
2012
•
50 reimages
•
20 new builds
•
Testing with select franchisees
•
2013
•
Plan to accelerate with tiered
investment approach
•
Developing financing sources for
franchisees |
 Deliver “A Cut Above”
customer experience
Provide a Fast Casual experience at traditional QSR price
The Wendy’s Company
P
EOPLE
Improving Reliability and Predictability |
 Executive Leadership:
Hired Craig Bahner, Chief Marketing Officer
Hired Scott Weisberg, Chief People Officer
Promoted John Peters, SVP of Operations
The Wendy’s Company
P
EOPLE |
 The Wendy’s Company
PERFORMANCE
Sparkle Operators Evaluation (SOE) scores at all-time highs
“A”
Restaurants
“F”
Restaurants
SOE Score
2.1%
3.6%
6.3%
13.3%
16.2%
25.1%
29.3%
17.4%
1.0%
0.3%
0.5%
0.4%
75.3%
79%
82%
85%
85%
86%
66%
70%
74%
78%
82%
86%
0%
10%
20%
30%
40%
2007
2008
2009
2010
2011
Q1 '12
A
F
SOE |
 The Wendy’s Company
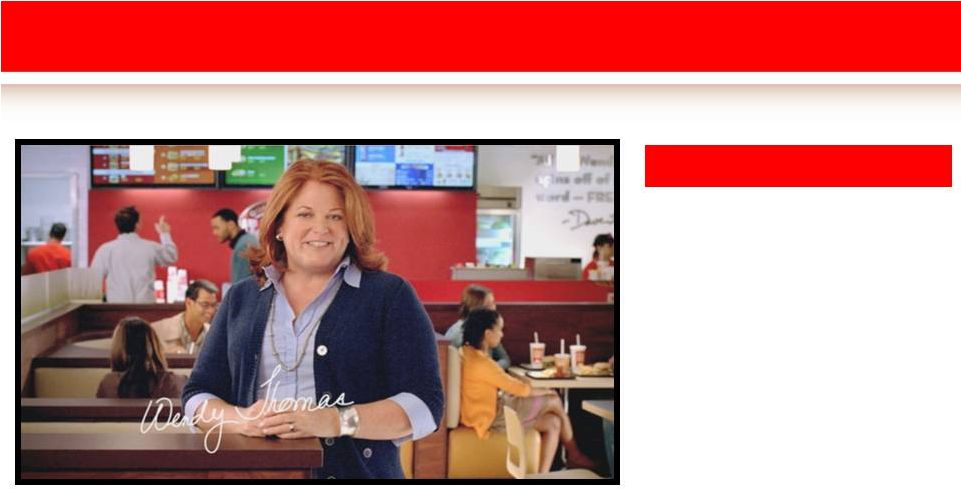
PROMOTION: Advertising
New advertising campaign and strategy:
Began April 2
Features two consumer champions:
Consumer advocate
Wendy Thomas
Smartly challenges consumer food choices and promotes the
benefits of choosing Wendy’s |
 The Wendy’s Company
PROMOTION: Advertising
Product / Promotion
•
Contemporizes brand
•
Sets expectations for the Wendy’s
experience
•
76% positive sentiment in social
media; 18,000+ new campaign
conversations; mentioned every 132
seconds.
Advocate for consumers
“Now, That’s Better” |
 The Wendy’s Company
PROMOTION: Advertising
Brand Promise
•
Demonstrates brand values:
Quality, Fresh preparation,
Honest Food
•
Sets expectation for
Wendy’s quality
Brand heritage and
ambassador: Wendy Thomas |
 P
RODUCT
Spicy Chicken Guacamole Club |
 The Wendy’s Company
PRODUCT: Strengthen The
Core Hamburgers:
Promotional LTO
Heritage Products:
Baked
Potato, Frosty and Chili
Salads:
Seasonal favorite |
 The Wendy’s Company
P
RODUCT
Direct Mail Coupons |
 The Wendy’s Company
Brand Access and Asset Utilization
Breakfast is most rapidly growing
QSR daypart past five years & next
five years
Breakfast is 22% of QSR traffic,
17% of QSR sales
Puts Wendy’s in position to serve
24 hours |
 The Wendy’s Company
Breakfast Menu Strategy
Premium ingredients and authentic preparation
Distinctive
Artisan Egg Sandwich
Mornin’
Melt Panini
Biscuit Sandwiches
Coffee Credibility
Red Head Roasters
Orange Juice
Soft Drinks
Differentiation
Home-Style Potatoes
Steel-Cut Oatmeal
Fruit Cup
Everyday Affordability
Sausage & Egg Burrito
Oatmeal Bar
Sausage Biscuit
Signature
Sandwiches
Beverages/Coffee
Sides
Value |
 The Wendy’s Company
Breakfast Next Steps
Focused on improving breakfast sales and profitability
Expand to Northeastern U.S. market in summer 2012
Adding breakfast to certain reimaged and new restaurants
Evaluating optimal expansion strategy |
 INTERNATIONAL
OPPORTUNITY |
 The Wendy’s Company
International Update
Development Update
Total (open / commitments) ~ 1,000 restaurants
Buenos Aires, Argentina
Opened 4 restaurants in Q1, increasing total restaurant
count to 354
Added 37 new restaurant commitments increasing total
commitments to 636
Signed development agreement with Wissol Group for
Georgia & Republic of Azerbaijan for 25 restaurants
|
 The Wendy’s Company
International Update
Following Recipe to Win: 6 P’s
Refining menu architecture to drive
“A Cut Above”
positioning
Launching Dave’s Hot ‘N Juicy in
many markets in May and June
Translating and activating
“Now That’s Better”
campaign
Premium Porcini Mushroom
Chicken Sandwich in Japan |
 The Wendy’s Company
Wendy’s Long-Term Strategic Growth Components
Int’l
New Restaurant Development
Image Activation
2013 & Beyond
High-single to
low-double digit
Adjusted
EBITDA
growth rate
Franchise
Acquisitions/
Sales
Financial Mgmt.
Breakfast / 24 HR
North American Business Improvement |
 The Wendy’s Company
Summary
We know what we want to be…“A Cut Above”
We know how to get there…“The Recipe to Win”
We have the growth platforms to produce shareholder value
We have the financial resources
We are building the people capability
We have great franchise partners
We have iron-willed determination |
 JOHN
BARKER
CHIEF COMMUNICATIONS OFFICER |
 The Wendy’s Company
May 23:
Morgan Stanley Retail Conference
May 24:
The Wendy’s Company Annual Meeting
June 28:
Investor Day in Dublin, OH
August 9:
2Q Earnings Release
Upcoming Investor Calendar |
 The Wendy’s Company
JUNE INVESTOR DAY
•
Management Presentations
•
Image Activation restaurant tours
•
Formal invitations will be e-mailed
Thursday, June 28 in Dublin, OH
The Wendy’s Company
Restaurant Support Center
June 28, 2012
8:00 am –
4:00 pm |
 ©2012 Oldemark LLC
The Wendy’s Company |
 Appendix |
 Reconciliation
of
Adjusted
EBITDA
from
Continuing
Operations
to
Net
Income
(Loss)
Attributable
to
The
Wendy’s
Company
(Unaudited)
2012
2011
Adjusted EBITDA from continuing operations
63,881
$
73,725
$
(Less) plus:
Depreciation and amortization
(32,311)
(30,314)
Impairment of long-lived assets
(4,511)
(7,897)
Facilities relocation and other transition costs
(5,531)
-
Transaction related costs
(612)
(1,884)
Arby's
indirect
corporate
overhead
in
general
and
administrative
(G&A)
-
(7,888)
SSG purchasing cooperative expense reversal in G&A
-
2,275
Operating profit
20,916
28,017
Interest expense
(28,235)
(29,442)
Gain on sale of investment, net
27,407
-
Other income, net
1,524
253
Income
(loss)
from
continuing
operations
before
income
taxes
and
noncontrolling
interests
21,612
(1,172)
(Provision for) benefit from income taxes
(6,878)
876
Income (loss) from continuing operations
14,734
(296)
Loss from discontinued operations, net of income taxes
-
(1,113)
Net income (loss)
14,734
(1,409)
Net income attributable to noncontrolling interests
(2,384)
-
Net income (loss) attributable to The Wendy's Company
12,350
$
(1,409)
$
First Quarter
(In thousands)
The Wendy’s Company |
 Reconciliation of Adjusted Income from Continuing Operations and
Adjusted
Earnings per Share to Income (Loss) from Continuing Operations and Earnings
per Share Attributable to The Wendy’s Company
(Unaudited)
(In thousands, except per share amounts)
per share
per share
Adjusted income and adjusted earnings per share from continuing operations
3,347
$
0.01
$
9,300
$
0.02
$
Plus (less):
Gain on sale of investment, net
17,978
0.05
-
-
Impairment of long-lived assets
(2,783)
(0.01)
(4,873)
(0.01)
Facilities relocation and other transition costs
(3,429)
(0.01)
-
-
Transaction related costs
(379)
(0.00)
(1,187)
(0.00)
Arby's
indirect
corporate
overhead
in
general
and
administrative
(G&A)
-
-
(4,970)
(0.01)
SSG purchasing cooperative expense reversal in G&A
-
-
1,434
0.00
Total Adjustments
11,387
0.03
(9,596)
(0.02)
Income (loss) from continuing operations and earnings per share
14,734
0.04
(296)
(0.00)
Net income attributable to noncontrolling interests
(2,384)
(0.01)
-
-
Income
(loss)
and
earnings
per
share
from
continuing
operations
attributable
to
The
Wendy's
Company
12,350
$
0.03
$
(296)
$
(0.00)
$
2012
2011
First Quarter
The Wendy’s Company |