Attached files
| file | filename |
|---|---|
| 8-K - 8-K - NEVADA POWER CO | d348214d8k.htm |
| EX-99.1 - EX-99.1 - NEVADA POWER CO | d348214dex991.htm |
Exhibit 99.2
First Quarter 2012 Financial Results
May 8, 2012
Safe Harbor Statement
This presentation may contain forward-looking statements within the meaning of the Private Securities Litigation Reform Act of 1995 regarding the future performance of NV Energy, Inc. and its subsidiaries, Nevada Power Company and Sierra Pacific Power Company both d/b/a NV Energy. Forward-looking statements include earnings guidance and estimates or forecasts of operating and financial metrics. These statements reflect current expectations of future conditions and events and as such are subject to a variety of risks, uncertainties and assumptions that could cause actual results to differ materially from current expectations. These risks, uncertainties and assumptions include, but are not limited to, NV Energy Inc.’s ability to maintain access to the capital markets, NV Energy Inc.’s ability to receive dividends from its subsidiaries, the financial performance of NV Energy Inc.’s subsidiaries, particularly Nevada Power Company and Sierra Pacific Power Company both d/b/a NV Energy, and the discretion of NV Energy Inc.’s Board of Directors with respect to the payment of future dividends based on its periodic review of factors that ordinarily affect dividend policy, such as current and prospective financial condition, earnings and liquidity, prospective business conditions, regulatory factors, and dividend restrictions in NV Energy Inc.’s and its subsidiaries’ financing agreements. For Nevada Power Company and Sierra Pacific Power Company both d/b/a NV Energy, these risks and uncertainties include, but are not limited to, future economic conditions both nationally and regionally, changes in the rate of industrial, commercial and residential growth in their service territories, their ability to procure sufficient renewable energy sources in each compliance year to satisfy the Nevada Renewable Energy Portfolio Standard, changes in environmental laws and regulations, construction risks, including but not limited to those associated with the ON Line project, their ability to maintain access to the capital markets for general corporate purposes and to finance construction projects, employee workforce factors, unseasonable weather, drought, wildfire and other natural phenomena, explosions, fires, accidents, mechanical breakdowns that may occur while operating and maintaining an electric and natural gas system, their ability to purchase sufficient fuel, natural gas and power to meet their power demands and natural gas demands for Sierra Pacific Power Company d/b/a NV Energy, financial market conditions, and unfavorable rulings in their pending and future regulatory filings. Further risks, uncertainties and assumptions that may cause actual results to differ from current expectations pertain to weather conditions, customer and sales growth, plant outages, operations and maintenance expense, depreciation and allowance for funds used during construction, interest rates and expense, cash flow and regulatory matters. Additional cautionary statements regarding other risk factors that could have an effect on the future performance of NV Energy, Inc., Nevada Power Company and Sierra Pacific Power Company both d/b/a NV Energy are contained in their Annual Reports on Form 10-K for the year ended December 31, 2011, and quarterly reports on Form 10-Q for the period ended March 31, 2012, each filed with the Securities and Exchange Commission. NV Energy Inc., Nevada Power Company and Sierra Pacific Power Company both d/b/a NV Energy undertake no obligation to release publicly the result of any revisions to these forward-looking statements that may be made to reflect events or circumstances after the date hereof or to reflect the occurrence of unanticipated events.
IR Contacts
Max Kuniansky Britta Carlson
Executive, Investor Relations Manager, Investor and Shareholder Relations
(702) 402-5627 (702) 402-5624
mkuniansky@nvenergy.com bcarlson@nvenergy.com
2
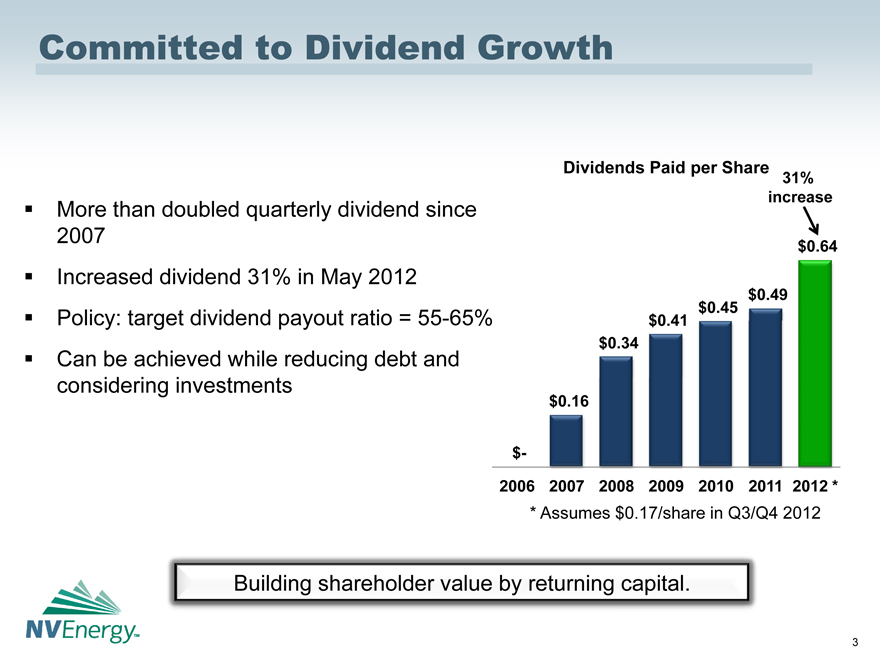
Committed to Dividend Growth
More than doubled quarterly dividend since 2007
Increased dividend 31% in May 2012
Policy: target dividend payout ratio = 55-65% Can be achieved while reducing debt and considering investments
Dividends Paid per Share
$-
$0.16
$0.34
$0.41
$0.45
$0.49
$0.64
increase
31%
2006 2007 2008 2009 2010 2011 2012 *
* Assumes $0.17/share in Q3/Q4 2012
Building shareholder value by returning capital.
3
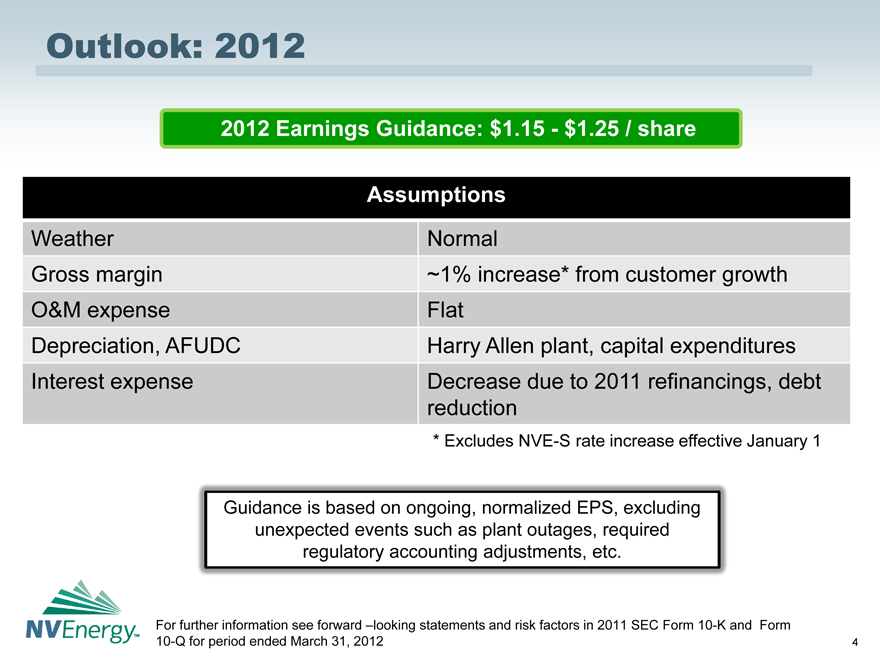
Outlook: 2012
2012 Earnings Guidance: $1.15 - $1.25 / share
Assumptions
Weather Normal
Gross margin ~1% increase* from customer growth
O&M expense Flat
Depreciation, AFUDC Harry Allen plant, capital expenditures
Interest expense Decrease due to 2011 refinancings, debt
reduction
* Excludes NVE-S rate increase effective January 1
Guidance is based on ongoing, normalized EPS, excluding unexpected events such as plant outages, required regulatory accounting adjustments, etc.
For further information see forward –looking statements and risk factors in 2011 SEC Form 10-K and Form
10-Q for period ended March 31, 2012
4
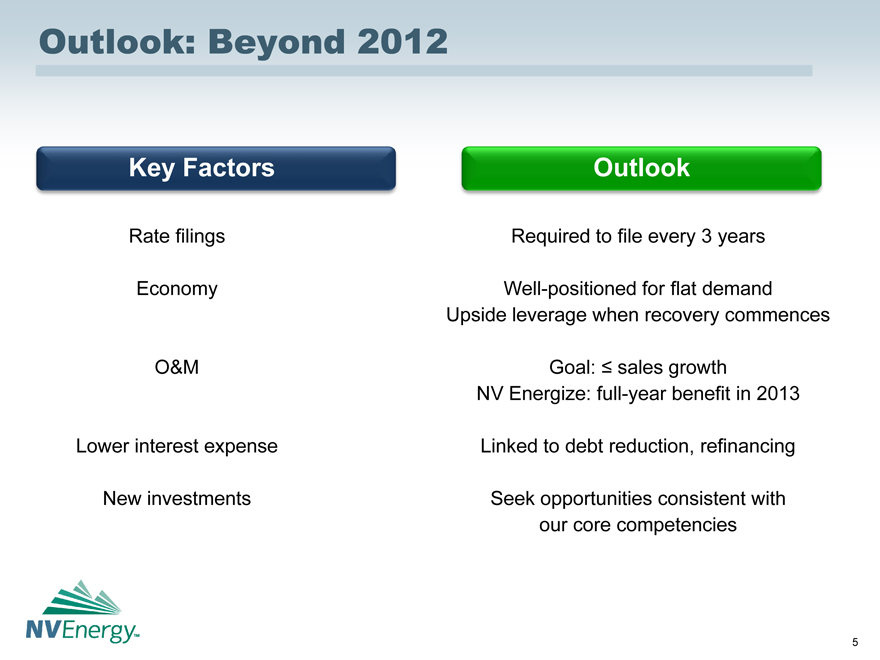
Outlook: Beyond 2012
Key Factors
Rate filings
Economy
O&M
Lower interest expense
New investments
Outlook
Required to file every 3 years
Well-positioned for flat demand Upside leverage when recovery commences
Goal: £ sales growth NV Energize: full-year benefit in 2013
Linked to debt reduction, refinancing
Seek opportunities consistent with our core competencies
5
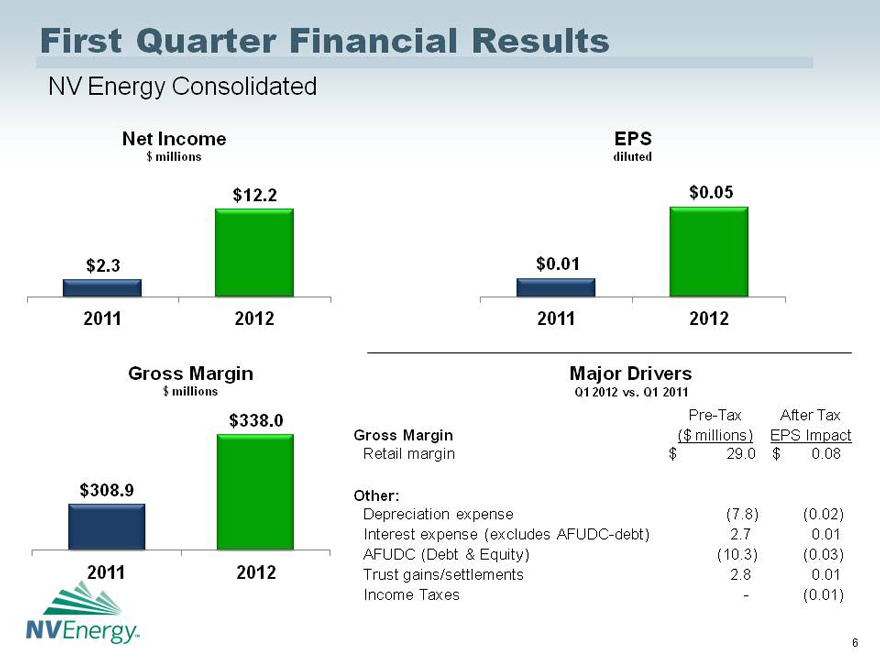
First Quarter Financial Results
NV Energy Consolidated
Net Income EPS
$ millions diluted
$2.3 2011
$12.2
2012
$0.01
2011
$0.05
2012
Gross Margin
$ millions
$308.9
2011
$338.0
2012
Major Drivers
Q1 2012 vs. Q1 2011
Pre-Tax After Tax
Gross Margin ($ millions) EPS Impact
Retail margin $ 29.0 $ 0.08
Other:
Depreciation expense (7.8) (0.02)
Interest expense (excludes AFUDC-debt) 2.7 0.01
AFUDC (Debt & Equity) (10.3) (0.03)
Trust gains/settlements 2.8 0.01
Income Taxes — (0.01)
| 6 |
|
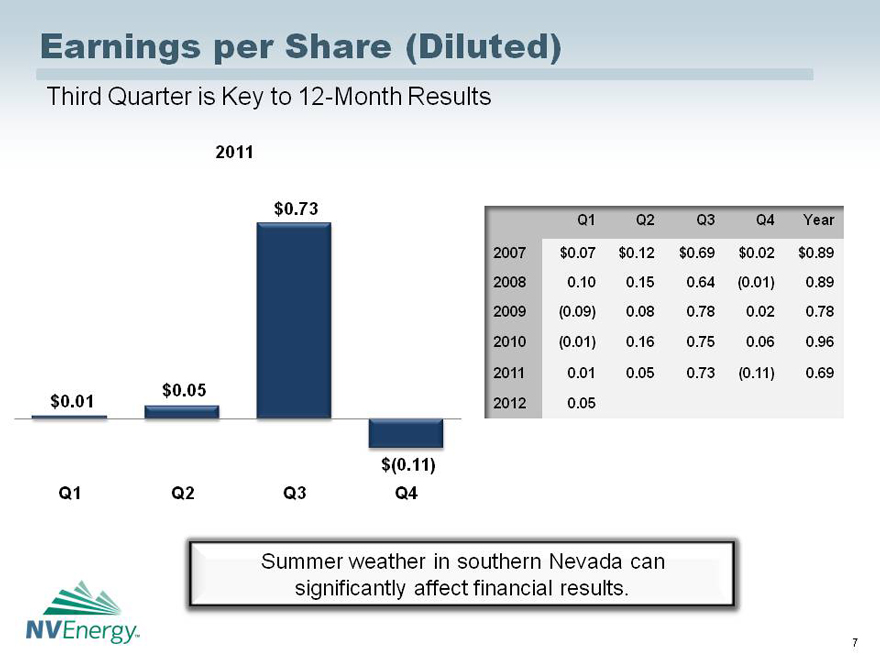
Earnings per Share (Diluted)
Third Quarter is Key to 12-Month Results
2011
$0.01
Q1
$0.05
Q2
$0.73
Q3
$(0.11) Q4
Q1 Q2 Q3 Q4 Year
2007 $0.07 $0.12 $0.69 $0.02 $0.89 2008 0.10 0.15 0.64 (0.01) 0.89 2009 (0.09) 0.08 0.78 0.02 0.78
2010 (0.01) 0.16 0.75 0.06 0.96
2011 0.01 0.05 0.73 (0.11) 0.69 2012 0.05
Summer weather in southern Nevada can significantly affect financial results.
| 7 |
|
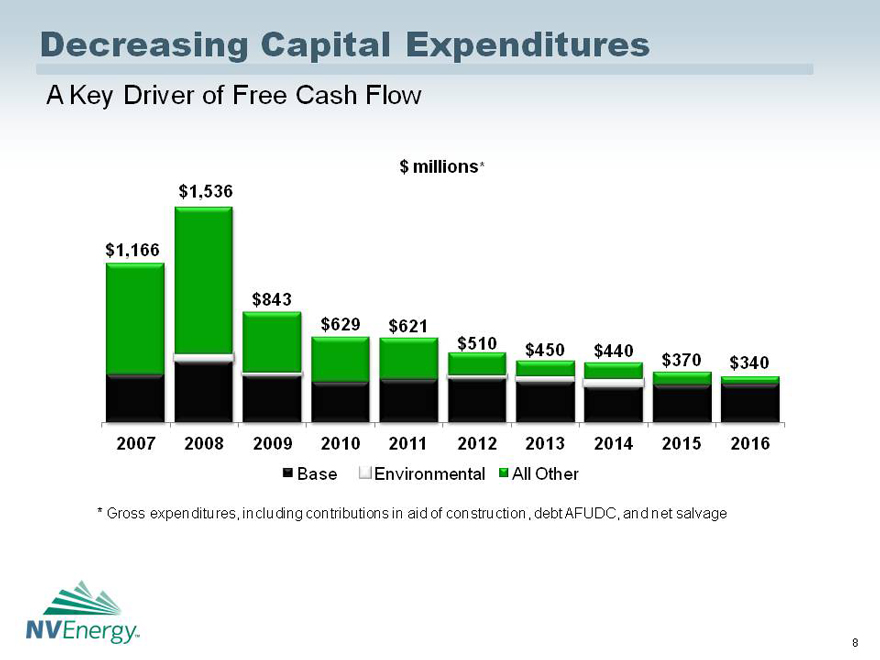
Decreasing Capital Expenditures
A Key Driver of Free Cash Flow
$ millions*
$1,166
2007
$1,536
2008
$843
2009
$629
2010
$621
2011
$510
2012
$450
2013
$440
2014
$370
2015
$340
2016
Base Environmental All Other
| * |
|
Gross expenditures, including contributions in aid of construction, debt AFUDC, and net salvage |
| 8 |
|
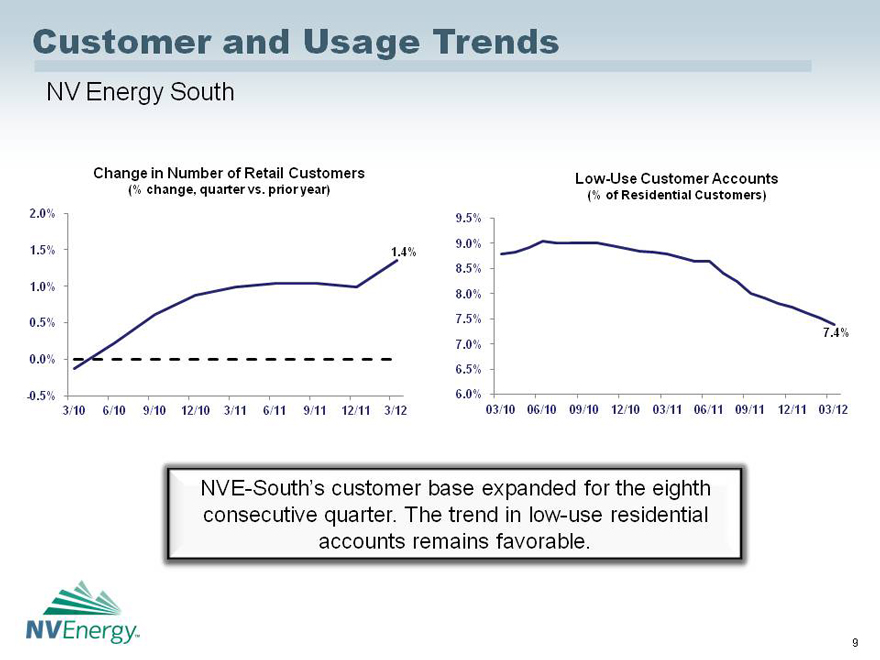
Customer and Usage Trends
NV Energy South
Change in Number of Retail Customers (% change, quarter vs. prior year)
2.0% 1.5% 1.0% 0.5% 0.0% -0.5%
3/10 6/10 9/10 12/10 3/11 6/11 9/11 12/11 3/12
1.4%
Low-Use Customer Accounts (% of Residential Customers)
9.5% 9.0% 8.5% 8.0% 7.5% 7.0% 6.5% 6.0%
03/10 06/10 09/10 12/10 03/11 06/11 09/11 12/11 03/12
7.4%
NVE-South’s customer base expanded for the eighth consecutive quarter. The trend in low-use residential accounts remains favorable.
9
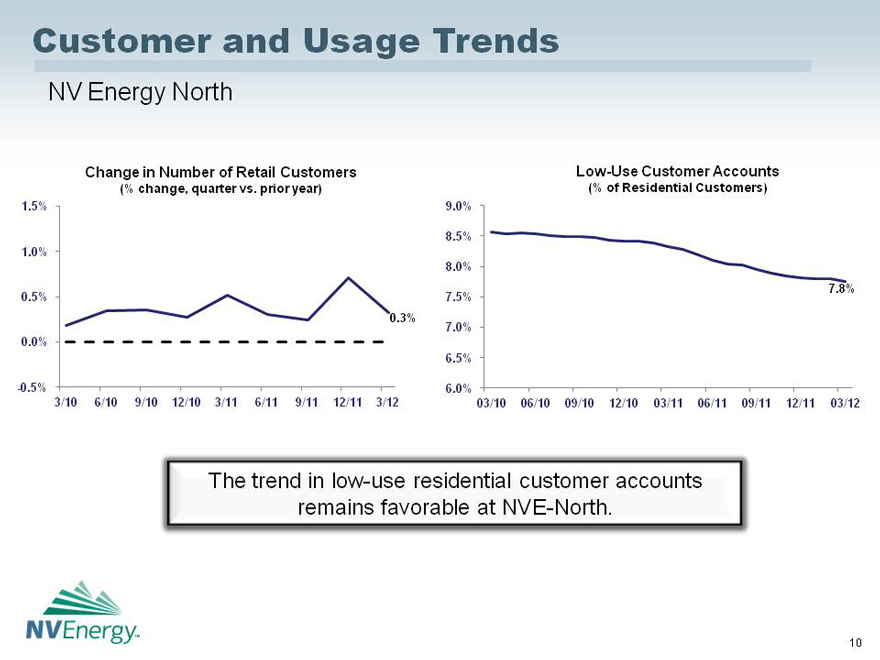
Customer and Usage Trends
NV Energy North
Change in Number of Retail Customers (% change, quarter vs. prior year)
1.5% 1.0% 0.5% 0.0% -0.5%
3/10 6/10 9/10 12/10 3/11 6/11 9/11 12/11 3/12
0.3%
Low-Use Customer Accounts (% of Residential Customers)
9.0% 8.5% 8.0% 7.5% 7.0% 6.5% 6.0%
03/10 06/10 09/10 12/10 03/11 06/11 09/11 12/11 03/12
7.8%
The trend in low-use residential customer accounts remains favorable at NVE-North.
10