Ignite Restaurant Group, Inc. - FORM S-1/A - May 8, 2012
Attached files
Table of Contents
As filed with the Securities and Exchange Commission on May 8, 2012
No. 333-175878
UNITED STATES
SECURITIES AND EXCHANGE COMMISSION
Washington, D.C. 20549
AMENDMENT NO. 7
TO
FORM S-1
REGISTRATION STATEMENT
UNDER
THE SECURITIES ACT OF 1933
IGNITE RESTAURANT GROUP, INC.
(Exact name of registrant as specified in its charter)
|
|
|
|
|
Delaware
(State or other jurisdiction of
incorporation or organization) |
|
5812
(Primary Standard Industrial
Classification Code Number) |
|
94-3421359
(I.R.S. Employer Identification No.) |
9900 Westpark Drive, Suite 300
Houston, Texas 77063
(713) 366-7500
(Address, including zip code, and telephone number, including area code, of registrant's principal executive
offices)
Raymond A. Blanchette, III
President and Chief Executive Officer
Ignite Restaurant Group, Inc.
9900 Westpark Drive, Suite 300
Houston, Texas 77063
(713) 366-7500
(Name, address, including zip code, and telephone number, including area code, of agent for service)
|
|
|
| With copies to: |
Christian O. Nagler
Jason K. Zachary
Kirkland & Ellis LLP
601 Lexington Avenue
New York, New York 10022
(212) 446-4800 |
|
Keith M. Townsend
King & Spalding LLP
1180 Peachtree Street, N.E.
Atlanta, Georgia 30309
(404) 572-4600 |
Approximate date of commencement of proposed sale to the public:
As soon as practicable after this Registration Statement becomes effective.
If any of the securities being registered on this Form are to be offered on a delayed or continuous basis pursuant to Rule 415 under the Securities Act of
1933, check the following box: o
If this Form is filed to register additional securities for an offering pursuant to Rule 462(b) under the Securities Act, please check the following box and
list the Securities Act registration statement number of the earlier effective registration statement for the same offering. o
If this Form is a post-effective amendment filed pursuant to Rule 462(c) under the Securities Act, check the following box and list the
Securities act registration statement number of the earlier effective registration statement for the same offering. o
If this Form is a post-effective amendment filed pursuant to Rule 462(d) under the Securities Act, check the following box and list the
Securities Act registration statement number of the earlier effective registration statement for the same offering. o
Indicate by check mark whether the registrant is a large accelerated filer, an accelerated filer, a non-accelerated filer, or a smaller reporting
company. See the definitions of "large accelerated filer," "accelerated filer" and "smaller reporting company" in Rule 12b-2 of the Exchange Act. (Check one):
|
|
|
|
|
|
|
| Large accelerated filer o |
|
Accelerated filer o |
|
Non-accelerated filer ý
(Do not check if a
smaller reporting company) |
|
Smaller reporting company o |
CALCULATION OF REGISTRATION FEE
|
|
|
|
|
|
|
|
|
|
|
|
|
|
|
|
|
|
| |
Title of Each Class of Securities
to be Registered
|
|
Amount to be
Registered(1)
|
|
Estimated Maximum
Offering Price
Per Share(2)
|
|
Estimated Maximum
Aggregate Offering
Price(2)(3)
|
|
Amount of Registration Fee(3)(4)
|
| |
Common Stock, $0.01 par value per share |
|
6,634,615 |
|
$14.00 |
|
$92,884,610 |
|
$10,644.58 |
|
- (1)
- Includes 865,384 additional shares of common stock that the underwriters have the option to purchase.
- (2)
- Estimated
solely for the purpose of calculating the registration fee pursuant to Rule 457(a) under the Securities Act of 1933, as amended.
- (3)
- Includes
the offering price of any additional shares of common stock that the underwriters have the option to purchase.
- (4)
- Previously
paid.
The registrant hereby amends this Registration Statement on such date or dates as may be necessary to delay its effective
date until the registrant shall file a further amendment which specifically states that this Registration Statement shall thereafter become effective in accordance with Section 8(a) of the
Securities Act of 1933 or until this Registration Statement shall become effective on such date as the Commission, acting pursuant to said Section 8(a), may determine.
Table of Contents
The information in this preliminary prospectus is not complete and may be changed. These securities may not
be sold until the registration statement filed with the Securities and Exchange Commission is effective. This preliminary prospectus is not an offer to sell nor does it seek an offer to buy these
securities in any jurisdiction where the offer or sale is not permitted.
SUBJECT TO COMPLETION, DATED MAY 8, 2012
PROSPECTUS
5,769,231 Shares

Ignite Restaurant Group, Inc.
Common Stock
This is an initial public offering of shares of common stock of Ignite Restaurant Group, Inc. We are offering 5,572,703 shares of our
common stock, and the selling stockholder identified in this prospectus is offering an additional 196,528 shares of common stock. We will not receive any of the proceeds from the sale of the
shares being sold by the selling stockholder in this offering.
Prior
to this offering, there has been no public market for our common stock. The initial public offering price per share of the common stock is expected to be between $12.00 and $14.00.
We intend to apply to list our common stock on The NASDAQ Global Select Market under the symbol "IRG."
The
underwriters have an option to purchase a maximum of 865,384 additional shares from us. The underwriters can exercise this option at any time within 30 days from the date of
this prospectus.
We
are an "emerging growth company" under applicable Securities and Exchange Commission rules and will be subject to reduced public company reporting requirements.
Investing in our common stock involves risks. See "Risk Factors" beginning on page 16.
|
|
|
|
|
|
|
|
|
|
|
Price to
Public |
|
Underwriting
Discounts and
Commissions |
|
Proceeds,
before expenses
to us |
|
Proceeds,
before expenses
to the selling
stockholder |
Per share |
|
$ |
|
$ |
|
$ |
|
$ |
Total |
|
$ |
|
$ |
|
$ |
|
$ |
Delivery
of the shares of common stock will be made on or about , 2012.
Neither
the Securities and Exchange Commission nor any state securities commission has approved or disapproved of these securities or determined if this prospectus is truthful or
complete. Any representation to the contrary is a criminal offense.
|
|
|
|
|
| Credit Suisse |
|
Baird |
|
Piper Jaffray |
KeyBanc Capital Markets |
|
Lazard Capital Markets |
|
Raymond James |
The date of this prospectus is , 2012.
Table of Contents
Table of Contents
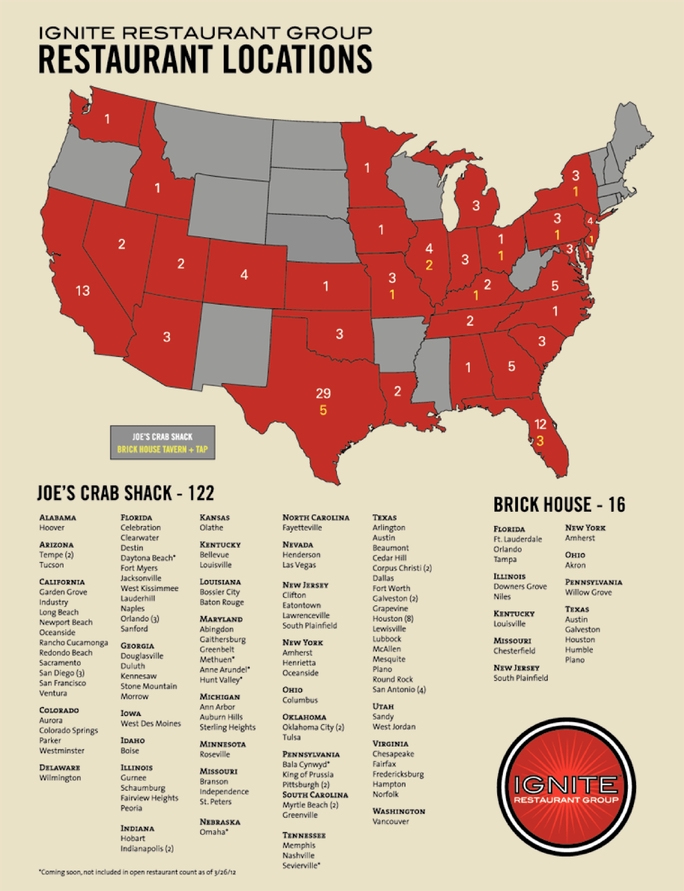
Table of Contents
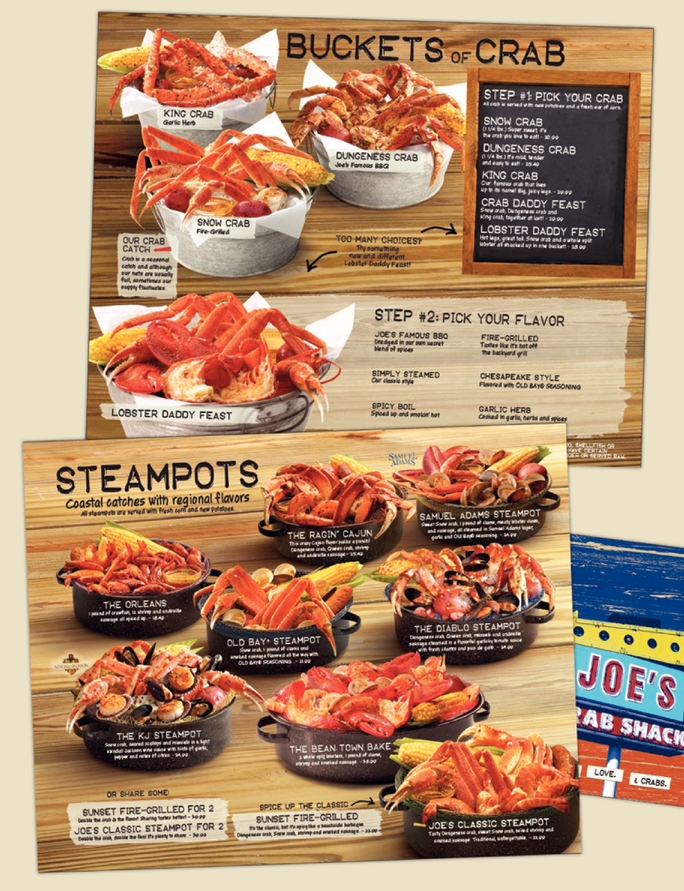
TABLE OF CONTENTS
You should rely only on the information contained in this prospectus or in any free-writing prospectus we may specifically
authorize to be delivered or made available
to you. We have not, the selling stockholder has not and the underwriters have not authorized anyone to provide you with additional or different information. We and the selling stockholder are
offering to sell, and seeking offers to buy, shares of our common stock only in jurisdictions where such offers and sales are permitted. The information in this prospectus or any
free-writing prospectus is accurate only as of its date, regardless of its time of delivery or the time of any sale of shares of our common stock. Our business, financial condition,
results of operations and prospects may have changed since that date.
Until , 2012
(25 days after the date of this prospectus), all dealers that effect transactions in these securities,
whether or not participating in this offering, may be required to deliver a prospectus. This delivery requirement is in addition to the dealers' obligation to deliver a prospectus when acting as an
underwriter and with respect to their unsold allotments or subscriptions.
i
Table of Contents
MARKET DATA AND FORECASTS
Unless otherwise indicated, information in this prospectus concerning economic conditions, our industry, our markets and our
competitive position is based on a variety of sources, including information from independent industry analysts and publications such as KNAPP-TRACK™ and Technomic, Inc., as well as our
own estimates and research. KNAPP-TRACK™ is a monthly sales and guest count tracking service for the chain dinner house/theme restaurant market in the United States. Each monthly
KNAPP-TRACK™ report aggregates the change in comparable restaurant sales and guest counts compared to the same month in the preceding year from the competitive set of participants in the
chain dinner house/theme restaurant market and provides an average to which we can compare our results. The competitive set of participants for each KNAPP-TRACK™ report is comprised of
approximately 50 casual dining restaurant brands and typically includes restaurants such as Applebee's, T.G.I. Friday's, Outback Steakhouse and Red Lobster. We and other restaurants benchmark
our performance against the data included in the monthly KNAPP-TRACK™ report. Technomic, Inc. is a leading restaurant industry consulting and researching firm.
Our
estimates are derived from publicly available information released by third-party sources, as well as data from our internal research, and are based on such data and our knowledge of
our industry, which we believe to be reasonable. None of the independent industry publications used in this prospectus
were prepared on our behalf, and none of the sources cited in this prospectus have consented to the inclusion of any data from its reports, nor have we sought consent from any of them.
TRADEMARKS AND TRADENAMES
This prospectus includes our trademarks, such as Joe's Crab Shack® and the design, our stylized logos set forth on the
cover and back pages of this prospectus and Brick House Tavern+Tap® and the design, which are protected under applicable intellectual property laws and are the property of
Ignite Restaurant Group, Inc. or its subsidiaries. Solely for convenience, trademarks, service marks and tradenames referred to in this prospectus may appear without the ®,
TM or SM symbols, but such references are not intended to indicate, in any way, that we will not assert, to the fullest extent under applicable law, our rights or the right
of the applicable licensor to these trademarks, service marks and tradenames. This prospectus may also contain trademarks, service marks, tradenames and copyrights of other companies, which are the
property of their respective owners.
ABOUT THIS PROSPECTUS
Except where the context otherwise requires or where otherwise indicated, the terms "Ignite," "we," "us," "our," "our company" and "our
business" refer to Ignite Restaurant Group, Inc. and its consolidated subsidiaries. The term "Joe's" refers to Joe's Crab Shack and "Brick House" refers to Brick House Tavern+Tap. The term
"crab house" refers to a restaurant at which the featured entrees are predominantly crab. The term "Queen Crab" refers to Opilio crab that meets our size specification for designation as Queen Crab.
The
term "selling stockholder" refers to JCS Holdings, LLC, our parent company. Immediately after completion of this public offering, JCS Holdings, LLC will distribute
substantially all of the shares of our common stock then held by it and/or the cash proceeds received in this public offering to the holders of its Series A preferred units and its common units
in accordance with the provisions then in effect of the Fourth Amended and Restated Limited Liability Company Agreement of JCS Holdings, LLC. JCS Holdings, LLC will thereafter continue
to hold shares equal to less than one percent of our outstanding common stock for the benefit of certain of our officers and directors who will continue to hold unvested common units in
JCS Holdings, LLC upon consummation of this offering. See "Prospectus Summary—Company History and Information" for more information on the liquidation
ii
Table of Contents
and
distribution of JCS Holdings, LLC and "Principal and Selling Stockholder" for more information on our beneficial ownership following the distribution.
Throughout
this prospectus, we provide a number of key performance indicators used by management and typically used by our competitors in the restaurant industry. These key performance
indicators are discussed in more detail in the section entitled "Management's Discussion and Analysis of Financial Condition and Results of Operations—Key Performance Indicators." In this
prospectus we also reference Adjusted EBITDA and restaurant-level profit margin, which are both non-GAAP financial measures. See "Prospectus Summary—Summary Historical
Consolidated Financial and Operating Data" for a discussion of Adjusted EBITDA and restaurant-level profit margin, as well as a reconciliation of those measures to the most directly comparable
financial measure required by, or presented in accordance with, generally accepted accounting principles in the United States, or U.S. GAAP.
Our
fiscal year ends on the Monday closest to December 31 of each year. Our most recent fiscal year ended on January 2, 2012. Fiscal years 2011 and 2009 were
52-week years, while fiscal year 2010 was a 53-week year. The first three quarters of our fiscal year consist of 12 weeks and our fourth quarter consists of
16 weeks for 52-week fiscal years and 17 weeks for 53-week fiscal years.
iii
Table of Contents
PROSPECTUS SUMMARY
This summary highlights information contained elsewhere in this prospectus. This summary does not contain all
of the information that you should consider in making your investment decision. You should read the following summary together with the entire prospectus, including the more detailed information
regarding our company, the common stock being sold in this offering and our consolidated financial statements and the related notes appearing elsewhere in this prospectus. You should also carefully
consider, among other things, the matters discussed in the sections entitled "Risk Factors" and "Management's Discussion and Analysis of Financial Condition and Results of Operations" in this
prospectus before deciding to invest in our common stock. Some of the statements in this prospectus constitute forward-looking statements. For more information, see "Forward-Looking Statements."
Our Company
Ignite Restaurant Group, Inc. operates two restaurant businesses, Joe's Crab Shack and Brick House Tavern+Tap. Each of our
restaurant businesses offers a
variety of high-quality food in a distinctive, casual, high-energy atmosphere. Joe's Crab Shack and Brick House Tavern+Tap operate in a diverse set of markets
across the United States.
Our
comparable restaurant sales have increased for 15 consecutive fiscal quarters and outperformed the KNAPP-TRACK™ report of casual dining restaurants, which is an average
of approximately 50 casual dining restaurant brands, over the same period of time. We have grown our comparable restaurant sales by 25% on a cumulative basis over the last four years, which has
outperformed the KNAPP-TRACK growth rate of (8%) by nearly 3,300 basis points on a cumulative basis over the same period of time. During the twelve weeks ended March 26, 2012, our comparable
restaurant sales increased by 5.3% over the comparable period in our prior fiscal year.
Our
current management team was put in place in fiscal year 2007. This team developed and implemented many of the initiatives and strategies which serve as the foundation for what our
company is today. The impact of these strategies began to be take effect in fiscal year 2008. From the fiscal year ended December 29, 2008 through the fiscal year ended January 2, 2012,
total revenues and Adjusted EBITDA (a non-GAAP financial measure) have improved at compounded annual growth rates of 14.0% and 29.5%, respectively. Over the same period, our total revenues increased
from $273.4 million to $405.2 million, net income increased from a net loss of $3.2 million to net income of $11.3 million and Adjusted EBITDA increased from
$20.3 million to $44.1 million. We opened 24 new restaurants, rebuilt one restaurant, closed eight restaurants and converted four Joe's Crab Shack restaurants to Brick House restaurants,
which resulted in a net total of 16 new restaurants over the same period of time. For the twelve weeks ended March 26, 2012, we opened three new restaurants.
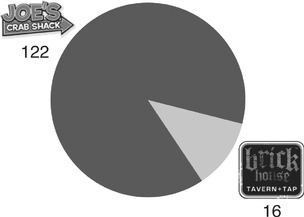
As
of March 26, 2012, we owned and operated 138 restaurants in 31 states.
1
Table of Contents
Joe's Crab Shack
Joe's Crab Shack, founded in 1991, is an established, national chain of casual seafood restaurants. Joe's serves a variety of
high-quality seafood items, with an emphasis on crab. Joe's is a high-energy, family-friendly restaurant that encourages guests to "roll up your sleeves and crack into some
crab."
Joe's
Crab Shack is America's only national crab house. Crab is deliberately placed center stage as a defining item to the Joe's experience. Joe's Steampot and Crab in a Bucket offerings
allow guests to choose between four varieties of crabs (Queen, Snow, Dungeness and King) and Maine lobster. Our Steampots are overflowing with generous portions of crab, other seafood, red potatoes, a
fresh ear of corn and sausage, combined with a complementary set of savory seasonings. Our Crab in a Bucket entrées allow guests to pair their favorite crab selection with several
distinctive preparations ranging from BBQ to Chesapeake Style or Garlic Herb. Joe's also leverages its crab-forward menu with other craveable crab items, including
Made-From-Scratch Crab Cakes, Crab Nachos and Crazy-Good Crab Dip. In addition to our core crab-focused menu, Joe's also offers a broad range of
entrées featuring a variety of seafood, including the Get Stuffed Snapper, Surf 'N Turf Burger and Shrimp Trio, as well as a wide range of traditional seafood
entrées like the Fisherman's Platter. Joe's also offers several "out of water" options such as Pan Fried Cheesy Chicken and Ribeye Steak.
Many
Joe's Crab Shack restaurants are located on waterfront property, and most locations offer outdoor patio seating and a children's playground. Joe's Crab Shack restaurants perform
well in targeted markets with high population density and a propensity for seafood, as well as "destination" markets with national and regional tourist attractions, both of which are key
characteristics of our new site selection strategy. Joe's Crab Shack restaurants are largely free-standing and average 8,000 square feet with over 200 seats.
We
continuously seek to innovate our menu offerings. For example, we have dramatically shifted the menu mix at Joe's to focus on entrées featuring crab over the last four
fiscal years. As a result of this strategy, the percentage of entrées at Joe's featuring crab increased from approximately 20% to 45% of total food revenues over the last four fiscal
years. We believe this mix shift has contributed to increases in guest satisfaction, comparable restaurant sales and restaurant-level profit. For the fiscal year ended January 2, 2012, our
average check was $23.07, lunch and dinner represented 27% and 73% of revenue, respectively, and our revenues were comprised of 84% food, 13% alcohol and 3% retail merchandise.
Brick House Tavern+Tap
Brick House Tavern+Tap, founded in 2008, is a casual restaurant business that provides guests a differentiated "gastro pub"
experience by offering a distinctive blend of menu items in a polished setting. Brick House seeks to strike a balance between providing guests with an elevated experience while also appealing to
"every-man, every-day." In 2011, Brick House was listed as the #1 "up and comer" full-service, varied-menu restaurant business by Technomic, a leading
restaurant industry consulting and research firm.
Brick
House offers guests a broad selection of high-quality, chef-inspired, contemporary tavern food and other American fare. Menu items include handcrafted
appetizers such as Deviled Eggs, Meat and Cheese Board, Meatloaf Sliders and Fried Stuffed Olives. In addition, Brick House's Brick Burgers, including the Gun Show Burger and the Red Chili Burger,
offer guests a distinct take on the traditional burger. Brick House further enhances its burger offerings through its most popular burger, The Kobe, which is hand-formed from
high-quality American Wagyu beef. Guests can also choose from a broad selection of homemade entrées such as Drunken Chops, BBQ Baby Backs and Chicken & Waffles, which
are among our most popular items. A Daily Special menu features classic tavern food with a twist including Prosciutto Wrapped Meatloaf, Steak Frites and Chicken Pot Pie. A New Brick Pizza section
offers a Kobe Brick Pizza and Philly Cheese Steak Pizza. In addition, we consider Brick House
2
Table of Contents
to
be a "Temple to Beer," with a diverse beverage selection highlighted by over 70 varieties of beer, including local microbrews and distinctive imports, a
tap-at-your-table Beer Bong and a hand-pulled Cask Beer Engine. All Brick House restaurants have a full bar that supports a variety of liquor drinks,
wine and beer cocktails like the Shandy and Bee Sting, as well as specialty cocktails like the Dark & Stormy, Moscow Mule and the Zombie.
The
interior design of Brick House Tavern+Tap consists of diverse seating and gathering areas where guests can select multiple ways to enjoy their experience. In addition to
a traditional dining room and bar area, Brick House also offers large communal tables and a section of leather recliners positioned in front of large HD TVs, where guests receive their own TV tray for
dining. Each restaurant has a state-of-the-art entertainment package and provides guests with a clear line of sight to at least two HD TVs from every seat, making
Brick House restaurants an ideal gathering place for sports enthusiasts. Outdoor seating is also available on the patio or around an open fire pit at nearly all locations. Both food and beverages are
served by personable and engaging service staff.
For
fiscal year ended January 2, 2012, the daypart mix at Brick House Tavern+Tap was 20% lunch, 25% afternoon, 38% dinner and 17% late night and our revenues were
comprised of 53% food and 47% alcohol. Our entrées ranged in price from $8.00 to $20.00.
Our Business Strengths
We are focused on developing brands that have category leading and defendable positions within the casual dining segment. As a result,
our core business strengths include the following:
Highly Differentiated Restaurant Brands. Our restaurants strive to provide a unique guest experience in a
"come-as-you-are," upbeat and inviting restaurant environment. Both Joe's Crab Shack and Brick House Tavern+Tap are distinctively positioned restaurant
brands, designed to have unique guest appeal. Joe's Crab Shack is a leading casual seafood brand that offers more than just a meal—a visit to Joe's is an event for the whole family, a
night out. We provide a memorable, shareable "crab-cracking experience" where guests can roll up their sleeves and "break out of their shell" in a vacation-themed environment that offers
an escape from the everyday. Brick House Tavern+Tap offers a comfortable, trend-forward yet timeless setting where guests can gather and share their passion for elevated, chef-inspired
comfort food, while enjoying their favorite local, national or imported brand of beer and cheering for their favorite team. Each brand features food offerings and an atmosphere that attracts a diverse
group of guests.
Authentic and Unique Menu Offerings. We offer high-quality, authentic seafood at Joe's Crab Shack and trend-forward,
chef-inspired, contemporary tavern food and other American fare at Brick House Tavern+Tap. Signature dishes at both brands feature craveable flavor profiles. Food menus are
complemented by an assortment of beverages and distinctive cocktails, including Joe's Shark Bite and Brick House's tap-at-your-table Beer Bongs. Our culinary and
beverage teams develop recipes and menu offerings for both Joe's and Brick House to ensure that all items feature distinctive twists on classic items, as well as items exclusive to each brand.
Memorable Guest Service. Our servers are friendly, attentive and responsive to the needs of our guests. In addition, our servers strive
to provide
guests an unforgettable dining experience. Joe's staff creates a fun-loving atmosphere through high-energy special occasion celebrations, while the staff at Brick House is focused on
providing hospitable and personal service to guests. We achieve this
through experienced restaurant management teams that implement training programs specific to the menu and culture of each brand. We believe our distinctive guest service models provide an additional
layer of brand differentiation.
Attractive Unit Economics. We have successfully increased our restaurant average unit volumes at a compounded annual growth rate of
8.1%, from
$2.4 million in fiscal year 2008 to $3.0 million in fiscal
3
Table of Contents
year
2011. Over the same period of time, we have increased our restaurant-level profit margin (a non-GAAP financial measure) by 340 basis points from 12.6% to 16.0%. We are targeting
average unit volumes and restaurant-level profit margins for new locations to exceed system-wide fiscal year 2011 levels.
Experienced Management Team. Our experienced team of industry veterans has an average of 20 years of experience with restaurant
companies such
as T.G.I. Friday's, Darden, Applebee's, Yum! Brands, Landry's and Sbarro. Our management team is led by Raymond A. Blanchette, III, our President and Chief Executive Officer, who joined
us in 2007. Mr. Blanchette was a former President for Pick Up Stix and Executive Director of International Business at T.G.I. Friday's, both are brands operated by Carlson Restaurants
Worldwide. Within twelve months of his arrival, Mr. Blanchette transformed our leadership team by recruiting five highly experienced restaurant executives. Despite a difficult economic
environment, we have achieved 15 consecutive fiscal quarters of comparable restaurant sales growth, expanded our geographic footprint and improved our financial performance. From fiscal year 2008 to
fiscal year 2011, we increased net income from a net loss of $3.2 million to net income of $11.3 million and increased Adjusted EBITDA from $20.3 million to $44.1 million.
The experience of our management team has allowed us to transform Joe's Crab Shack into a market leader while simultaneously developing and launching Brick House Tavern+Tap.
Our Strategy
Our strategies include the following:
Disciplined New Restaurant Growth. We believe there are meaningful opportunities to grow the number of restaurants of both Joe's Crab
Shack and Brick
House Tavern+Tap. We seek to
maximize free cash flow for reinvestment into new restaurants at attractive returns. For both brands, we target new restaurant cash-on-cash returns, which we define as
restaurant-level profit per store divided by total build-out cost (excluding capitalized interest) and pre-opening costs, to exceed 25%.
- •
- Joe's Crab Shack. We target steady state new restaurant
average unit volumes of approximately $3.9 million for Joe's Crab Shack. Joe's has a narrowly defined new restaurant development strategy that predominantly targets (i) specific
geographies with high population density and a propensity for seafood and (ii) locations in close proximity to regional and national tourist attractions. Twenty one of our twenty five top
performing Joe's Crab Shack restaurants meet one or both of these criteria and generated average unit volumes of $4.7 million in fiscal year 2011. In fiscal year 2010, we developed a new
restaurant prototype for Joe's Crab Shack, which has given Joe's a polished look and feel while maintaining the authentic crab shack ambiance. As of March 26, 2012, we have successfully opened
12 new restaurants using this new prototype and development strategy.
- •
- Brick House Tavern+Tap. We target steady state
new restaurant average unit volumes of approximately $3.2 million for Brick House Tavern+Tap. We believe Brick House has significant growth potential and intend to focus future
development in the top 50 designated market areas across the country. We initially opened a limited number of Brick House restaurants across a broad range of geographies with the intent of optimizing
the brand prior to a continued build out. We are currently in the process of integrating key insights into our future new restaurant rollout plans.
For
fiscal year 2012, we target opening 11 new restaurants, the vast majority of which will be new Joe's Crab Shack restaurants. We expect that our new restaurant growth will continue to
be substantially weighted towards new Joe's Crab Shack restaurants for the foreseeable future.
4
Table of Contents
Comparable Restaurant Sales Growth. We believe the following strategies have contributed to our successful growth and will allow us to
generate
comparable restaurant sales growth in the future:
- •
- Continuous Menu Innovation. We believe menu innovation is
a critical factor in building guest loyalty and frequency. Both Joe's Crab Shack and Brick House Tavern+Tap have signature food and beverage offerings and a tradition of consistent menu
innovation. New menu items are typically introduced at both brands twice a year and we test new menu items in restaurants across several diverse geographies before they are introduced into the broader
base of restaurants. We have successfully introduced new and innovative items at both brands with such additions as Queen Crab, Skillet Paella and Mason Jars at Joe's Crab Shack and Brick Pizza, Meat
and Cheese Board, Fried Stuffed Olives and Chicken & Waffles at Brick House Tavern+Tap. We plan to continue our tradition of menu innovation in the future.
- •
- Marketing our Restaurant Brands. We believe that our
marketing strategies will continue to increase brand awareness while driving new guest trial and repeat guest visits. In June 2007, we changed our marketing strategy for Joe's Crab Shack by developing
a long-term marketing plan supported by quantitative analysis that is designed to increase comparable restaurant sales and guest count, as well as build the brand for the future. We also
moved to a national cable platform, which provides television advertising reach to the Joe's Crab Shack restaurants that were previously outside of the spot/local television markets and previews the
Joe's Crab Shack brand in new development markets. These national marketing efforts are complemented by a combination of local marketing programs and social media. Brick House Tavern+Tap
is primarily marketed through local marketing, digital media and social media outlets. We also promote both brands using other in-restaurant sales initiatives, which are typically focused
on products and are not price point promotions.
- •
- Driving Guest Satisfaction. We believe our focus on menu
innovation and guest service has contributed to Joe's Crab Shack's overall guest satisfaction score improving by over 1,300 basis points since we began measuring guest satisfaction through a third
party vendor in August 2008. At Joe's Crab Shack, we use this third party research consisting of feedback from more than 40,000 guests, to develop operational initiatives, which we expect will
continue to deliver high levels of guest satisfaction. We implemented a similar program at Brick House Tavern+Tap during the fourth quarter of fiscal year 2011. We believe improving guest
satisfaction will continue to build loyalty and lead to increased sales from our guests.
Leverage our Scale to Enhance our Profitability. We believe we have a scalable infrastructure and can continue to expand our margins as
we execute
our strategy. While both brands have independent field operations, we use our shared services platform to handle many of the administrative functions for both brands. This leverageable structure
should further our ability to enhance our profitability as we grow.
Our Principal Stockholder
Following completion of this offering, J.H. Whitney VI, L.P., or "J.H. Whitney VI," an affiliate of
J.H. Whitney Capital Partners, LLC, or "J.H. Whitney," will own approximately 70% of our outstanding common stock, or approximately 68% if the underwriters' option to purchase additional
shares is fully exercised. As a result, J.H. Whitney VI will be able to have a significant effect relating to votes over fundamental and significant corporate matters and transactions.
See "Risk Factors—Risks Related to This Offering and Ownership of Our Common Stock."
J.H. Whitney
is a Connecticut-based private equity firm whose affiliated investment funds have current investments and remaining committed capital totaling $1.4 billion.
J.H. Whitney focuses on investing in small and middle market companies with strong growth prospects in a number of industries.
5
Table of Contents
Company History and Information
The first Joe's Crab Shack was opened in Houston, Texas in 1991. Landry's Restaurants, Inc., or "Landry's," acquired Joe's Crab Shack
in 1994. On October 13, 2006, in connection with the purchase by JCS Holdings, LLC, an entity controlled by J.H. Whitney VI, of 120 Joe's Crab Shack restaurants from
Landry's, which we refer to as the "Landry Acquisition," we changed our name to Joe's Crab Shack Holdings, Inc. In 2008, we developed our second brand, Brick House Tavern+Tap. With the
addition of the Brick House brand, on July 7, 2009, we changed our name to Ignite Restaurant Group, Inc.
In
connection with, and immediately prior to the completion of this public offering, Ignite Restaurant Group, Inc. will effect a 19,178.226-for-1 stock
split of our common stock. The stock split will result in 19,178,226 shares of common stock outstanding immediately after the stock split, all of which will be held by JCS Holdings, LLC,
our parent company. Immediately after completion of this public offering, JCS Holdings, LLC will distribute substantially all of the shares of our common stock then held by it and/or the cash
proceeds received in this public offering to the holders of its Series A preferred units and its common units in accordance with the provisions then in effect of the Fourth Amended and Restated
Limited Liability Company Agreement of JCS Holdings, LLC, which we refer to as the Parent LLC Agreement. JCS Holdings, LLC will thereafter
continue to hold shares equal to less than one percent of our outstanding common stock for the benefit of certain of our officers and directors who will continue to hold unvested common units in
JCS Holdings, LLC upon consummation of this offering.
Immediately
following completion of this public offering and the distribution described above shares of our common stock will be owned by (i) the entities and persons who purchase
our common stock pursuant to this initial public offering and (ii) the entities and persons that owned or who were eligible to receive Series A preferred units and/or vested and unvested
common units of JCS Holdings, LLC, which include J.H. Whitney VI and certain of our current and former officers, directors and employees.
Our
principal executive office is located at 9900 Westpark Drive, Suite 300, Houston, Texas 77063. Our telephone number is (713) 366-7500, and our website
addresses are www.igniterestaurants.com, www.joescrabshack.com and www.brickhousetavernandtap.com. The
information contained on our websites are not deemed to be, and you should not consider such information to be, part
of this prospectus.
Risk Factors
Investing in shares of our common stock involves a high degree of risk. You should consider the information under the caption "Risk
Factors" beginning on page 16 of this prospectus in deciding whether to purchase the common stock in this offering. Risks relating to our business include, among
others:
- •
- our ability to successfully maintain increases in our comparable restaurant sales, average weekly sales and average unit
volumes;
- •
- our ability to successfully execute our growth strategy and open new restaurants that are profitable;
- •
- macroeconomic conditions;
- •
- our ability to compete with many other restaurants;
- •
- changes in food and supply costs, including the cost of crab;
- •
- our ability to expand Brick House;
6
Table of Contents
- •
- concerns regarding food safety and food-borne illness;
- •
- changes in consumer preferences; and
- •
- our ability to develop and maintain our restaurant brands.
Conflicts of Interest
KeyBank National Association, an affiliate of KeyBanc Capital Markets Inc., one of the underwriters in this offering, is
expected to receive more than 5% of the net proceeds of this offering in connection with the prepayment of a portion of our senior secured credit facility. See "Use of Proceeds." Accordingly, this
offering is being made in compliance with the requirements of Financial Industry Regulatory Authority, or "FINRA," Rule 5121. As required by FINRA Rule 5121, KeyBanc Capital
Markets Inc. will not confirm sales to any account over which it
exercises discretionary authority without the specific written approval of the accountholder. In addition, KeyBank National Association will receive a fee of approximately $25,000 for its portion of
the restructuring fee related to the amendment of our senior secured credit facility. See "Underwriting—Conflicts of Interest."
7
Table of Contents
The Offering
|
|
|
| Common stock offered by us |
|
5,572,703 shares |
Common stock offered by the selling stockholder |
|
196,528 shares |
Common stock outstanding immediately after this offering |
|
24,750,929 shares or 25,616,313 shares, if the underwriters exercise their option to purchase additional shares from us. |
Use of proceeds |
|
We estimate that the proceeds to us from this offering, after deducting estimated underwriting discounts and commissions and offering expenses payable by us, will be approximately $65.3 million,
assuming the shares offered by us are sold for $13.00 per share, the midpoint of the price range set forth on the cover page of this prospectus. |
|
|
We intend to use the net proceeds from the sale of common stock by us in this offering, together with cash on hand, (i) to prepay a portion of our senior secured credit facility, (ii) to pay
J.H. Whitney a fee in connection with the termination of the management agreement, and (iii) for other general corporate purposes. For additional information, see "Use of Proceeds" and "Certain Relationships and Related Party
Transactions." |
|
|
We will not receive any of the proceeds from the sale of shares of common stock by the selling stockholder. |
Principal stockholder |
|
Upon completion of this offering, J.H. Whitney VI will own a controlling interest in us. We currently intend to avail ourselves of the "controlled company" exemption under the corporate
governance rules of The NASDAQ Stock Market. |
Dividend policy |
|
We currently expect to retain all available funds and any future earnings to fund the development and growth of our business and to repay indebtedness; therefore, we do not anticipate paying any cash
dividends in the foreseeable future. Our ability to pay dividends on our common stock is limited by our existing credit agreements and may be further restricted by the terms of any of our future debt or preferred securities. For additional
information, see "Dividend Policy." |
Proposed symbol for trading on The NASDAQ Global Select Market |
|
"IRG" |
8
Table of Contents
Unless
otherwise indicated, all information in this prospectus relating to the number of shares of common stock to be outstanding immediately after this
offering:
- •
- assumes the effectiveness of our amended and restated certificate of incorporation and amended and restated
by-laws, which we will adopt prior to the completion of this offering;
- •
- gives effect to the stock split;
- •
- excludes 1,980,074 shares of our common stock reserved for future grants under our new equity compensation plan we
intend to adopt in connection with this offering; and
- •
- assumes (i) no exercise by the underwriters of their option to purchase up to 865,384 additional shares from us and
(ii) an initial public offering price of $13.00 per share, the midpoint of the price range set forth on the cover page of this prospectus.
9
Table of Contents
SUMMARY HISTORICAL CONSOLIDATED FINANCIAL AND OPERATING DATA
The following table provides a summary of our historical and unaudited pro forma consolidated financial and operating data for the
periods and as of the dates indicated. The summary historical consolidated financial and operating data presented below for the fiscal years ended December 28, 2009, January 3, 2011, and
January 2, 2012 and selected balance sheet data presented below as of January 2, 2012 have been derived from our audited consolidated financial statements included elsewhere in this
prospectus. The historical consolidated financial data for the twelve weeks ended March 28, 2011 and March 26, 2012 and the selected balance sheet data as of March 26, 2012 have
been derived from our unaudited condensed consolidated financial statements included elsewhere in this prospectus. The unaudited condensed consolidated financial statements have been prepared on the
same basis as our audited consolidated financial statements and, in the opinion of our management, reflect all adjustments, consisting of normal recurring adjustments, necessary for a fair
presentation of these data. The results for any interim period are not necessarily indicative of the results that may be expected for a full fiscal year. The unaudited pro forma consolidated financial
data for the year ended January 2, 2012 and as of and for the twelve weeks ended March 26, 2012 have been derived from our historical financial statements for such periods, which are
included elsewhere in this prospectus, after giving effect to the transactions specified under "Unaudited Pro Forma Condensed Consolidated Financial Statements."
Our
fiscal year ends on the Monday nearest to December 31 of each year. Fiscal years 2009 and 2011 were 52-week years ended on December 28, 2009 and
January 2, 2012, respectively, while fiscal year 2010 was a 53-week year ended on January 3, 2011. The first three quarters of our fiscal year consist of 12 weeks and our fourth
quarter consists of 16 weeks for 52-week fiscal years and 17 weeks for 53-week fiscal years.
The
historical results presented below are not necessarily indicative of the results to be expected for any future period. This information should be read in conjunction with "Risk
Factors," "Selected Historical Consolidated Financial and Operating Data," "Unaudited Pro Forma Condensed Consolidated Financial Statements," "Management's Discussion and Analysis of Financial
Condition and Results of Operations," and our audited consolidated financial statements and our unaudited condensed consolidated financial statements and each of their related notes included elsewhere
in this prospectus.
10
Table of Contents
|
|
|
|
|
|
|
|
|
|
|
|
|
|
|
|
|
|
|
|
|
|
|
|
|
|
|
Twelve Weeks Ended |
|
|
|
Fiscal Year |
|
|
|
March 28,
2011 |
|
March 26,
2012 |
|
|
|
2009 |
|
2010 |
|
2011 |
|
|
|
(in thousands)
|
|
Revenues |
|
$ |
307,801 |
|
$ |
351,327 |
|
$ |
405,243 |
|
$ |
87,431 |
|
$ |
103,430 |
|
Costs and expenses |
|
|
|
|
|
|
|
|
|
|
|
|
|
|
|
|
| |
Restaurant operating costs |
|
|
|
|
|
|
|
|
|
|
|
|
|
|
|
|
| |
|
Cost of sales |
|
|
89,845 |
|
|
103,981 |
|
|
127,607 |
|
|
27,519 |
|
|
32,915 |
|
| |
|
Labor and benefits |
|
|
87,920 |
|
|
98,162 |
|
|
111,721 |
|
|
24,450 |
|
|
28,047 |
|
| |
|
Occupancy expenses |
|
|
25,243 |
|
|
27,440 |
|
|
30,244 |
|
|
6,510 |
|
|
7,281 |
|
| |
|
Other operating expenses |
|
|
58,140 |
|
|
63,963 |
|
|
71,696 |
|
|
15,077 |
|
|
18,206 |
|
| |
General and administrative |
|
|
18,765 |
|
|
20,634 |
|
|
23,340 |
|
|
5,517 |
|
|
6,386 |
|
| |
Depreciation and amortization |
|
|
12,733 |
|
|
13,445 |
|
|
16,063 |
|
|
3,349 |
|
|
3,938 |
|
| |
Pre-opening costs |
|
|
1,323 |
|
|
3,844 |
|
|
3,989 |
|
|
805 |
|
|
1,242 |
|
| |
Restaurant impairments and closures |
|
|
15 |
|
|
909 |
|
|
333 |
|
|
28 |
|
|
49 |
|
| |
Loss (gain) on disposal of property and equipment |
|
|
1,017 |
|
|
2,797 |
|
|
821 |
|
|
(4 |
) |
|
— |
|
| |
|
|
|
|
|
|
|
|
|
|
|
| |
|
Total costs and expenses |
|
|
295,001 |
|
|
335,175 |
|
|
385,814 |
|
|
83,251 |
|
|
98,064 |
|
| |
|
|
|
|
|
|
|
|
|
|
|
Income from operations |
|
|
12,800 |
|
|
16,152 |
|
|
19,429 |
|
|
4,180 |
|
|
5,366 |
|
Interest expense, net |
|
|
(3,867 |
) |
|
(3,831 |
) |
|
(9,215 |
) |
|
(2,558 |
) |
|
(1,997 |
) |
Gain on insurance settlements |
|
|
1,192 |
|
|
944 |
|
|
1,126 |
|
|
— |
|
|
— |
|
| |
|
|
|
|
|
|
|
|
|
|
|
Income before income taxes |
|
|
10,125 |
|
|
13,265 |
|
|
11,340 |
|
|
1,622 |
|
|
3,369 |
|
Income tax expense |
|
|
255 |
|
|
1,417 |
|
|
87 |
|
|
464 |
|
|
878 |
|
| |
|
|
|
|
|
|
|
|
|
|
|
Net income |
|
$ |
9,870 |
|
$ |
11,848 |
|
$ |
11,253 |
|
$ |
1,158 |
|
$ |
2,491 |
|
| |
|
|
|
|
|
|
|
|
|
|
|
|
|
Fiscal Year Ended |
|
Twelve Weeks Ended |
|
|
|
December 28,
2009 |
|
January 3,
2011 |
|
January 2,
2012 |
|
March 28,
2011 |
|
March 26,
2012 |
|
|
|
(dollars in thousands, except per share data)
|
|
Pro Forma Statement of Operations Data(1): |
|
|
|
|
|
|
|
|
|
|
|
|
|
|
|
|
Pro forma net income |
|
|
|
|
|
|
|
$ |
13,913 |
|
|
|
|
$ |
3,013 |
|
Pro forma net income per share: |
|
|
|
|
|
|
|
|
|
|
|
|
|
|
|
|
| |
Basic and diluted |
|
|
|
|
|
|
|
$ |
0.61 |
|
|
|
|
$ |
0.13 |
|
Pro forma weighted average shares outstanding: |
|
|
|
|
|
|
|
|
|
|
|
|
|
|
|
|
| |
Basic and diluted |
|
|
|
|
|
|
|
|
22,870,760 |
|
|
|
|
|
22,870,760 |
|
Selected Other Data: |
|
|
|
|
|
|
|
|
|
|
|
|
|
|
|
|
Restaurants open at end of period |
|
|
119 |
|
|
126 |
|
|
135 |
|
|
129 |
|
|
138 |
|
Change in comparable restaurant sales(2) |
|
|
9.5 |
% |
|
4.9 |
% |
|
6.9 |
% |
|
9.4 |
% |
|
5.3 |
% |
Average weekly sales |
|
$ |
51 |
|
$ |
54 |
|
$ |
59 |
|
$ |
57 |
|
$ |
63 |
|
Average unit volumes |
|
$ |
2,599 |
|
$ |
2,810 |
|
$ |
2,970 |
|
$ |
673 |
|
$ |
714 |
|
Restaurant-level profit margin(3) |
|
|
15.5 |
% |
|
16.7 |
% |
|
16.0 |
% |
|
16.1 |
% |
|
16.6 |
% |
EBITDA(4) |
|
$ |
26,725 |
|
$ |
30,541 |
|
$ |
36,618 |
|
$ |
7,529 |
|
$ |
9,304 |
|
Adjusted EBITDA(4) |
|
$ |
30,276 |
|
$ |
39,910 |
|
$ |
44,105 |
|
$ |
9,111 |
|
$ |
11,116 |
|
Adjusted EBITDA margin(5) |
|
|
9.8 |
% |
|
11.4 |
% |
|
10.9 |
% |
|
10.4 |
% |
|
10.7 |
% |
Capital expenditures |
|
$ |
18,348 |
|
$ |
33,333 |
|
$ |
40,102 |
|
$ |
8,301 |
|
$ |
6,737 |
|
11
Table of Contents
|
|
|
|
|
|
|
|
|
|
|
|
|
|
|
March 26, 2012 |
|
|
|
January 2,
2012 |
|
Actual |
|
Pro Forma
(6)(7) |
|
|
|
(in thousands)
|
|
Selected Balance Sheet Data: |
|
|
|
|
|
|
|
|
|
|
Cash and cash equivalents |
|
$ |
3,725 |
|
$ |
7,736 |
|
$ |
31,178 |
|
Working capital (deficit) |
|
|
(16,135 |
) |
|
(22,396 |
) |
|
5,757 |
|
Total assets |
|
|
180,207 |
|
|
193,076 |
|
|
214,291 |
|
Total debt |
|
|
117,757 |
|
|
117,000 |
|
|
76,431 |
|
Total stockholder's equity |
|
$ |
21,593 |
|
$ |
24,093 |
|
$ |
87,588 |
|
- (1)
- Derived
from our unaudited pro forma condensed consolidated statements of operations for the fiscal year ended January 2, 2012 and the twelve weeks
ended March 26, 2012, which are included elsewhere in this prospectus. See "Unaudited Pro Forma Condensed Consolidated Financial Statements."
- (2)
- Our
comparable restaurant base includes restaurants open for at least 104 weeks, or approximately 24 months. Change in comparable restaurant
sales represents the change in period-over-period sales for the comparable restaurant base.
- (3)
- Restaurant-level
profit margin represents revenues (x) less (i) licensing revenue not attributable to core restaurant operations,
(ii) cost of sales, (iii) labor and benefits, (iv) occupancy expenses, and (v) other operating expenses (y) plus deferred rent (as described in footnote 4(a)
below). Restaurant-level profit is a supplemental measure of operating performance of our restaurants that does not represent and should not be considered as an alternative to net income or revenues
as determined by U.S. generally accepted accounting principles, or U.S. GAAP, and our calculation thereof may not be comparable to that reported by other companies. Restaurant-level profit has
limitations as an analytical tool, and you should not consider it in isolation, or as a substitute for analysis of our results as reported under U.S. GAAP. Management believes restaurant-level
profit is an important component of financial results because it is a widely used metric within the restaurant industry to evaluate restaurant-level productivity, efficiency and performance.
Management uses restaurant-level profit as a key metric to evaluate our financial performance compared with our competitors, to evaluate the profitability of incremental sales and to evaluate our
performance across periods.
|
|
|
|
|
|
|
|
|
|
|
|
|
|
|
|
|
|
|
| |
|
|
Fiscal Year Ended |
|
Twelve Weeks Ended |
|
| |
|
|
December 28,
2009 |
|
January 3,
2011 |
|
January 2,
2012 |
|
March 28,
2011 |
|
March 26,
2012 |
|
| |
|
|
(dollars in thousands)
|
|
| |
Revenues |
|
$ |
307,801 |
|
$ |
351,327 |
|
$ |
405,243 |
|
$ |
87,431 |
|
$ |
103,430 |
|
| |
Less: Licensing and other revenues |
|
|
(89 |
) |
|
(373 |
) |
|
(584 |
) |
|
(108 |
) |
|
(65 |
) |
| |
|
|
|
|
|
|
|
|
|
|
|
|
| |
Restaurant sales(A) |
|
$ |
307,712 |
|
$ |
350,954 |
|
$ |
404,659 |
|
$ |
87,323 |
|
$ |
103,365 |
|
| |
|
|
|
|
|
|
|
|
|
|
|
|
| |
Restaurant operating costs |
|
|
|
|
|
|
|
|
|
|
|
|
|
|
|
|
| |
|
Cost of sales |
|
|
89,845 |
|
|
103,981 |
|
|
127,607 |
|
|
27,519 |
|
|
32,915 |
|
| |
|
Labor and benefits |
|
|
87,920 |
|
|
98,162 |
|
|
111,721 |
|
|
24,450 |
|
|
28,047 |
|
| |
|
Occupancy expenses |
|
|
25,243 |
|
|
27,440 |
|
|
30,244 |
|
|
6,510 |
|
|
7,281 |
|
| |
|
Other operating expenses |
|
|
58,140 |
|
|
63,963 |
|
|
71,696 |
|
|
15,077 |
|
|
18,206 |
|
| |
|
Deferred rent |
|
|
(1,162 |
) |
|
(1,322 |
) |
|
(1,342 |
) |
|
(296 |
) |
|
(196 |
) |
| |
|
|
|
|
|
|
|
|
|
|
|
|
| |
Restaurant-level profit(B) |
|
$ |
47,726 |
|
$ |
58,730 |
|
$ |
64,733 |
|
$ |
14,063 |
|
$ |
17,112 |
|
| |
|
|
|
|
|
|
|
|
|
|
|
|
| |
Restaurant-level profit margin(B÷A) |
|
|
15.5 |
% |
|
16.7 |
% |
|
16.0 |
% |
|
16.1 |
% |
|
16.6 |
% |
- (4)
- EBITDA
represents earnings before interest, taxes, depreciation and amortization. Adjusted EBITDA further adjusts EBITDA to reflect the additions and
eliminations described in the table below. EBITDA and Adjusted EBITDA are supplemental measures of operating performance that do not represent and should not be considered as alternatives to net
income or cash flow from operations, as determined by U.S. GAAP, and our calculation thereof may not be comparable to that reported by other companies. EBITDA and Adjusted
12
Table of Contents
EBITDA
have limitations as analytical tools, and you should not consider them in isolation, or as a substitute for analysis of our results as reported under U.S. GAAP. Some of the limitations
are:
- •
- EBITDA and Adjusted EBITDA do not reflect our cash expenditures, or future
requirements for capital expenditures or contractual commitments;
- •
- EBITDA and Adjusted EBITDA do not reflect changes in, or cash requirements for, our
working capital needs;
- •
- EBITDA and Adjusted EBITDA do not reflect the significant interest expense, or the
cash requirements necessary to service interest or principal payments on our debt;
- •
- EBITDA and Adjusted EBITDA do not reflect our tax expense or the cash requirements
to pay our taxes;
- •
- although depreciation and amortization are non-cash charges, the assets
being depreciated and amortized will often have to be replaced in the future, EBITDA and Adjusted EBITDA do not reflect any cash requirements for such replacements; and
- •
- other companies in the restaurant industry may calculate EBITDA and Adjusted EBITDA
differently than we do, limiting their usefulness as comparative measures.
- Because
of these limitations, EBITDA and Adjusted EBITDA should not be considered as measures of discretionary cash available to us to invest in
the growth of our business. We compensate for these limitations by relying primarily on our U.S. GAAP results and using EBITDA and Adjusted EBITDA only supplementally. We further believe that
our presentation of these U.S. GAAP and non-GAAP financial measurements provide information that is useful to analysts and investors because they are important indicators of the
strength of our operations and the performance of our core business.
- As
noted in the table below, Adjusted EBITDA includes adjustments for restaurant impairments and closures, gains and losses on disposal of
property and equipment, gains on insurance settlements and pre-opening costs, among other items. It is reasonable to expect that these items will occur in future periods. However, we believe these
adjustments are appropriate because the amounts recognized can vary significantly from period to period, do not directly relate to the ongoing operations of our restaurants and complicate comparisons
of our internal operating results and operating results of other restaurant companies over time. In addition, Adjusted EBITDA includes adjustments for other items that we do not expect to regularly
record following this offering, such as sponsor management fees. Each of the normal recurring adjustments and other adjustments described in this paragraph and in the reconciliation table below help
management with a measure of our core operating performance over time by removing items that are not related to day-to-day restaurant-level operations.
- Management
and our principal stockholder use EBITDA and Adjusted EBITDA:
- •
- as a measurement of operating performance because they assist us in comparing the
operating performance of our restaurants on a consistent basis, as both remove the impact of items not directly resulting from our core operations;
- •
- for planning purposes, including the preparation of our internal annual operating
budget and financial projections;
- •
- to evaluate the performance and effectiveness of our operational strategies;
- •
- to evaluate our capacity to fund capital expenditures and expand our business; and
- •
- to calculate incentive compensation payments for our employees, including assessing
performance under our annual incentive compensation plan.
- In
addition, this measurement is used by investors as a supplemental measure to evaluate the overall operating performance of companies in our
industry. Management believes that investors' understanding of our performance is enhanced by including this non-GAAP financial measure as a reasonable basis for comparing our ongoing
results of operations. Many investors are interested in understanding the performance of our business by comparing our results from ongoing operations from one period to the next and would
13
Table of Contents
ordinarily
add back events that are not part of normal day-to-day operations of our business. By providing this non-GAAP financial measure, together with
reconciliations, we believe we are enhancing investors' understanding of our business and our results of operations, as well as assisting investors in evaluating how well we are executing strategic
initiatives.
- We
also present Adjusted EBITDA because it is a measure which is used in calculating financial ratios in material debt covenants in our senior
secured credit facility. Some of the adjustments included in Adjusted EBITDA are subject to certain limitations under our credit facility for purposes of calculating our debt covenants. For the fiscal
quarter ended March 26, 2012, we are required to maintain a fixed charge coverage ratio (ratio of free cash flow to fixed charges) of 1.40:1 and an effective leverage ratio (ratio of adjusted
debt to Adjusted EBITDA plus cash rent expense) of less than 5.40:1. As of March 26, 2012, we are in compliance with these covenants. As of March 26, 2012, we had $117.0 million
of outstanding borrowings under the term loan and the ability to borrow up to an additional $23.2 million under the revolving credit facility. Failure to comply with our material debt covenants
could cause an acceleration of outstanding amounts under the term loan and restrict us from borrowing amounts under the revolving credit facility to fund our future liquidity requirements. We believe
that inclusion of supplementary adjustments to EBITDA applied in presenting Adjusted EBITDA is appropriate to provide additional information to investors about how the covenants in those agreements
operate. The material covenants in our senior secured credit facility are discussed further in "Management's Discussion and Analysis of Financial Condition and Results of
Operations—Liquidity and Capital Resources."
- Adjusted
EBITDA is calculated as follows:
|
|
|
|
|
|
|
|
|
|
|
|
|
|
|
|
|
|
| |
|
|
Fiscal Year Ended |
|
Twelve Weeks Ended |
|
| |
|
|
December 28,
2009 |
|
January 3,
2011 |
|
January 2,
2012 |
|
March 28,
2011 |
|
March 26,
2012 |
|
| |
|
|
(in thousands)
|
|
| |
Net income |
|
$ |
9,870 |
|
$ |
11,848 |
|
$ |
11,253 |
|
$ |
1,158 |
|
$ |
2,491 |
|
| |
Income tax expense |
|
|
255 |
|
|
1,417 |
|
|
87 |
|
|
464 |
|
|
878 |
|
| |
Interest expense, net |
|
|
3,867 |
|
|
3,831 |
|
|
9,215 |
|
|
2,558 |
|
|
1,997 |
|
| |
Depreciation and amortization |
|
|
12,733 |
|
|
13,445 |
|
|
16,063 |
|
|
3,349 |
|
|
3,938 |
|
| |
|
|
|
|
|
|
|
|
|
|
|
|
| |
EBITDA |
|
$ |
26,725 |
|
$ |
30,541 |
|
$ |
36,618 |
|
$ |
7,529 |
|
$ |
9,304 |
|
| |
|
|
|
|
|
|
|
|
|
|
|
|
| |
Adjustments: |
|
|
|
|
|
|
|
|
|
|
|
|
|
|
|
|
| |
Deferred rent(a) |
|
|
1,162 |
|
|
1,322 |
|
|
1,342 |
|
|
296 |
|
|
196 |
|
| |
Restaurant impairments and closures(b) |
|
|
15 |
|
|
909 |
|
|
333 |
|
|
28 |
|
|
49 |
|
| |
Loss on disposal of property and equipment(c) |
|
|
1,017 |
|
|
2,797 |
|
|
821 |
|
|
(4 |
) |
|
— |
|
| |
Sponsor management fees(d) |
|
|
1,120 |
|
|
1,139 |
|
|
1,188 |
|
|
272 |
|
|
272 |
|
| |
Gain on insurance settlements(e) |
|
|
(1,192 |
) |
|
(944 |
) |
|
(1,126 |
) |
|
— |
|
|
— |
|
| |
Pre-opening costs(f) |
|
|
1,323 |
|
|
3,844 |
|
|
3,989 |
|
|
805 |
|
|
1,242 |
|
| |
Other expenses(g) |
|
|
106 |
|
|
302 |
|
|
940 |
|
|
185 |
|
|
53 |
|
| |
|
|
|
|
|
|
|
|
|
|
|
|
| |
Adjusted EBITDA |
|
$ |
30,276 |
|
$ |
39,910 |
|
$ |
44,105 |
|
$ |
9,111 |
|
$ |
11,116 |
|
| |
|
|
|
|
|
|
|
|
|
|
|
|
- (a)
- Deferred
rent represents the non-cash rent expense calculated as the difference in U.S. GAAP rent expense in any year and amounts payable
in cash under the leases during the year. In measuring our operational performance, we focus on our cash rent payments. See Note 2 to our audited consolidated financial statements for
additional details.
- (b)
- Impairment
charges were recorded in connection with the determination that the carrying value of certain of our restaurants exceeded their estimated fair
value. Also consists of expenses incurred following the closure of restaurants. See Notes 2 and 3 to our audited consolidated financial statements for additional details.
- (c)
- Loss
(gain) on disposal of property and equipment represents the net book value of property and equipment less proceeds received, if applicable, on assets
abandoned or sold.
14
Table of Contents
- (d)
- Sponsor
management fees consist of fees and expenses paid to J.H. Whitney under the management services agreement, and compensation and expenses paid
to certain members of the management committee of our parent company, JCS Holdings, LLC. We will terminate this agreement in connection with the completion of this offering. See "Certain
Relationships and Related Party Transactions."
- (e)
- Gain
on insurance settlements consists of proceeds in excess of the net book value of assets lost and related costs from property insurance claims at
restaurants temporarily closed due to hurricane damage, flooding and/or foundational issues.
- (f)
- Pre-opening
costs include expenses directly associated with the opening of new restaurants and are incurred prior to the opening of a new
restaurant. See Note 2 to our audited consolidated financial statements for additional details.
- (g)
- Other
expenses consists of costs related to abandoned new restaurant developments, fees payable to the agent under historic credit facilities, certain
transitional general and administrative expenses, and expenses related to the modification of a sale-leaseback transaction.
- (5)
- Adjusted
EBITDA margin is defined as the ratio of Adjusted EBITDA to total revenues. We present Adjusted EBITDA margin because it is used by management as a
performance measurement of Adjusted EBITDA generated from total revenues. See footnote 4 above for a discussion of Adjusted EBITDA as a non-GAAP measure and a reconciliation of net
income to EBITDA and Adjusted EBITDA.
- (6)
- The
data included in the pro forma column in the selected balance sheet data table above has been derived from our unaudited pro forma condensed
consolidated balance sheet, which is included elsewhere in this prospectus. See "Unaudited Pro Forma Condensed Consolidated Financial Statements."
- (7)
- A
$1.00 increase (decrease) in the assumed initial public offering price of $13.00 per share, the midpoint of the price range set forth on the cover page of
this prospectus, would increase (decrease) each of cash and cash equivalents, total assets and total stockholders' equity by approximately $5.2 million, assuming that the number of shares
offered by us, as set forth on the cover page of this prospectus, remains the same and after deducting estimated underwriting discounts and commissions and estimated offering expenses payable by us.
Similarly, if we change the number of shares offered by us, the net proceeds we receive will increase or decrease by the increase or decrease in the number of shares sold, multiplied by the offering
price per share, less the incremental estimated underwriting discounts and commissions and estimated offering expenses payable by us.
15
Table of Contents
RISK FACTORS
Investing in our common stock involves a high degree of risk. Before you purchase our common stock, you should
carefully consider the risks described below and the other information contained in this prospectus, including our consolidated financial statements and accompanying notes. If any of the following
risks actually occurs, our business, financial condition, results of operation or cash flows could be materially adversely affected. In any such case, the trading price of our common stock could
decline, and you could lose all or part of your investment.
Risks Related to Our Business
You should not rely on past increases in our comparable restaurant sales or our average unit volumes as an indication of our future results of operations because they may
fluctuate significantly.
A number of factors have historically affected, and will continue to affect, our comparable restaurant sales and average unit volumes,
including, among other factors:
- •
- our ability to execute our business strategy effectively;
- •
- unusually strong initial sales performance by new restaurants;
- •
- competition;
- •
- consumer trends and confidence;
- •
- introduction of new menu items; and
- •
- regional and national macroeconomic conditions.
Our
comparable restaurant sales and average unit volumes may not increase at rates achieved over the past several fiscal years. Changes in our comparable restaurant sales and average
unit volumes could cause the price of our common stock to fluctuate substantially.
If we fail to execute our growth strategy, which largely depends on our ability to open new restaurants that are profitable, our business could suffer.
One of the key means of achieving our growth strategies will be through opening new restaurants and operating those restaurants on a
profitable basis. We expect this to be the case for the foreseeable future. For fiscal year 2012, we target opening 11 new restaurants, the vast majority of which will be new Joe's Crab Shack
restaurants, and expect that our new restaurant growth will continue to be substantially weighted towards new Joe's Crab Shack restaurants for the foreseeable future. Because of the economic downturn,
there are fewer new developments, such as shopping centers, being constructed, which reduces the supply of new restaurant locations. As a result, competition for prime locations is intense and the
prices commanded for such locations have remained high. There is no guarantee that a sufficient number of locations will be available in desirable areas or on terms that are acceptable to us in order
to achieve our growth plan. Delays or failures in opening new restaurants, or achieving lower than expected sales in new restaurants, could materially adversely affect our growth strategy. Once we
have identified suitable restaurant sites, our ability to open new restaurants successfully and on the development schedule we anticipate will also depend on numerous other factors, some of which are
beyond our control, including, among other items, the following:
- •
- our ability to secure suitable new restaurant sites;
- •
- consumer acceptance of our new restaurants;
- •
- our ability to control construction and development costs of new restaurants;
- •
- our ability to negotiate suitable lease terms;
16
Table of Contents
- •
- our ability to secure required governmental approvals and permits in a timely manner and any changes in local, state or
federal laws and regulations that adversely affect our costs or ability to open new restaurants;
- •
- the cost and availability of capital to fund construction costs and pre-opening expenses; and
- •
- limitations under our current and future credit facilities.
Although
we target specified new restaurant average unit volumes, cash on cash returns and capital investment for both Joe's and Brick House, new restaurants may not meet these targets.
Any restaurant we open may not be profitable or achieve operating results similar to those of our existing restaurants. We may not be able to respond on a timely basis to all of the changing demands
that our planned expansion will impose on management and on our existing infrastructure, or be able to hire or retain the necessary management and operating personnel. Our existing restaurant
management systems, financial and management controls and information systems may not be adequate to support our planned expansion. Our ability to manage our growth effectively will require us to
continue to enhance these systems, procedures and controls and to locate, hire, train and retain management and operating personnel.
There
is also the potential that some of our new restaurants will be located near areas where we have existing restaurants, thereby reducing the revenues of such existing restaurants.
Macroeconomic conditions could adversely affect our ability to increase the sales and profits of existing restaurants or to open new restaurants.
The United States may continue to suffer from depressed economic activity. Recessionary economic cycles, higher fuel and other energy
costs, lower housing values, low consumer confidence, inflation, increases in commodity prices, higher interest rates, higher levels of unemployment, higher consumer debt levels, higher tax rates and
other changes in tax laws or other economic factors that may affect discretionary consumer spending could adversely affect our revenues and profit margins and make opening new restaurants more
difficult. Our guests may have lower disposable income and reduce the frequency with which they dine out. This could result in reduced guest traffic, reduced average checks or limitations on the
prices we can charge for our menu items, any of which could reduce our sales and profit margins. In addition, many of our Joe's Crab Shack restaurants are located in areas that we consider tourist or
vacation destinations. Therefore, in those locations, we depend in large part on vacation travelers to frequent our Joe's Crab Shack restaurants, and such destinations typically experience a reduction
in visitors during economic downturns, thereby reducing the potential guests that could visit our restaurants. Also, businesses in the shopping vicinity in
which some of our restaurants are located may experience difficulty as a result of macroeconomic trends or cease to operate, which could, in turn, further negatively affect guest traffic at our
restaurants. All of these factors could have a material adverse impact on our results of operations and growth strategy.
Our success depends on our ability to compete with many other restaurants.
The restaurant industry is intensely competitive, and we compete with many well-established restaurant companies on the
basis of taste of our menu items, price of products offered, guest service, atmosphere, location and overall guest experience. Our competitors include a large and diverse group of restaurant chains
and individual restaurants that range from independent local operators that have opened restaurants in various markets to well-capitalized national restaurant companies. Our Joe's Crab
Shack restaurants compete against other casual seafood restaurants, including both national and regional chains and local seafood restaurants, as well as against casual dining restaurants that provide
a different type of food. Our Brick House Tavern+Tap restaurants compete against casual restaurants in the bar and grill segment and restaurants in the casual dining segment.
17
Table of Contents
Some
of our competitors have substantially greater financial and other resources than we do, which may allow them to react to changes in the restaurant industry better than we can. Other
competitors are local restaurants that in some cases have a loyal guest base and strong brand recognition within a particular market. As our competitors expand their operations or as new competitors
enter the industry, we expect competition to intensify. Should our competitors increase their spending on advertising and promotions, we could experience a loss of guest traffic to our competitors.
Also, if our advertising and promotions become less effective than those of our competitors, we could experience a material adverse effect on our results of operations. We also compete with other
restaurant chains and other retail businesses for quality site locations, management and hourly employees.
Changes in food and supply costs, including the cost of crab, could adversely affect our results of operations.
Our profitability depends in part on our ability to anticipate and react to changes in food and supply costs. Operating margins for our
restaurants are subject to changes in the price and availability of food commodities, including crab, shrimp, lobster and other seafood. In fiscal year 2011, Queen Crab, Snow Crab, Dungeness Crab,
King Crab, lobster and shrimp accounted for approximately 49% of our total food purchases. Any increase in food prices, particularly for these food
items, could adversely affect our operating results. We have experienced increases in crab pricing. We believe that the cost of crab will remain high through 2012 before moderating towards mean
historical prices. In addition, we are susceptible to increases in food costs as a result of factors beyond our control, such as weather conditions (including hurricanes), oil spills, fisherman
strikes, food safety concerns, costs of distribution, product recalls and government regulations. Furthermore, the introduction of or changes to tariffs on seafood, such as imported crab and shrimp or
other food products, could increase our costs and possibly impact the supply of those products. We cannot predict whether we will be able to anticipate and react to changing food costs by adjusting
our purchasing practices and menu items and prices, and a failure to do so could adversely affect our operating results. In addition, because our menu items are moderately priced, we may not seek to
or be able to pass along price increases to our guests. If we adjust pricing there is no assurance that we will realize the full benefit of any adjustment due to changes in our guests' menu item
selections and guest traffic.
Brick House is a newer and still evolving brand and our plans to expand Brick House may not be successful.
While Joe's and Brick House are subject to the risks and uncertainties described herein, there is an enhanced level of risk and
uncertainty related to the expansion of Brick House, our newer brand. While Brick House has grown to 16 locations since its founding in 2008, it is still evolving and has not yet proven its
long-term growth potential. For example, only five Brick House restaurants have been open for more than eight full fiscal quarters, qualifying them for inclusion in our comparable
restaurant base.
Initially,
we opened Brick House restaurants across a broad range of geographies with the intent of optimizing the brand prior to a continued build out. During the past three fiscal
years, we have converted two Joe's Crab Shack restaurants to Brick House restaurants, and we are currently in the process of converting one Brick House restaurant to a Joe's Crab Shack restaurant. We
are currently in the process of integrating key insights into our new restaurant rollout plans. There can be no assurance that the enhancements we intend to implement as part of the brand optimization
process will be successful or that additional new restaurant growth will occur. Brick House will be subject to the risks and uncertainties that accompany any emerging restaurant brand. If Brick House
fails to expand and/or continue generating profits, our operating results could suffer.
Guests
at all of our existing Brick House restaurants were initially served by an all-female service staff. As part of our brand optimization process, during the fourth
quarter of 2011, we converted to a more traditional service model utilizing both male and female servers at all of our existing Brick House restaurant locations and intend to use a more traditional
service model at any new Brick House restaurant locations. The conversion to a more traditional service model was made in combination with
18
Table of Contents
other
modifications to the style and experience of our Brick House restaurants, including menu modifications and changes to appeal to a broader guest base. It is too soon to predict whether these
changes will have a positive or negative impact on guest traffic. If guests and potential guests react unfavorably to our conversion to a more traditional service model and other modifications, our
results of operations could be adversely affected.
Food safety and food-borne illness concerns may have an adverse effect on our business.
Food safety is a top priority, and we dedicate substantial resources to ensure that our guests enjoy safe, quality food products.
However, food-borne illnesses, such as salmonella, E. coli, hepatitis A, trichinosis or "mad cow disease," and food safety issues have occurred in the food industry in the past, and could
occur in the future. In addition, publicity regarding certain illnesses and contaminations related to seafood, including high levels of mercury or other carcinogens, oil contaminations, vibrio
vulnificus and the Norwalk virus could affect consumer preferences and the consumption of seafood. Any report or publicity linking us to instances of food-borne illness or other food
safety issues, including food tampering or contamination, could adversely affect our brands and reputation as well as our revenues and profits. Even instances of food-borne illness, food
tampering or food contamination occurring solely at restaurants of our competitors could result in negative publicity about the food service industry or seafood restaurants generally and adversely
impact our sales.
Furthermore,
our reliance on third-party food suppliers and distributors increases the risk that food-borne illness incidents could be caused by factors outside of our
control and that multiple locations would be affected rather than a single restaurant. Although we inspect food products when they are delivered to us, we cannot assure that all food items are
properly maintained during transport throughout the supply chain and that our employees will identify all products that may be spoiled and should not be used in our restaurants. New illnesses
resistant to any precautions may develop in the future, or diseases with long incubation periods could arise, such as "mad cow disease," which could give rise to claims or allegations on a retroactive
basis. In addition, our industry has long been subject to the threat of food tampering by suppliers, employees or guests, such as the addition of foreign objects in the food that we sell. Reports,
whether or not true, of injuries caused by food tampering have in the past severely injured the reputations and brands of restaurant chains in the quick service restaurant segment and could affect us
in the future as well. If our guests become ill from food-borne illnesses, we could also be forced to temporarily close some restaurants. Furthermore, any instances of food contamination,
whether or not at our restaurants, could subject us or our suppliers to a food recall pursuant to the recently enacted the Food and Drug Administration Food Safety Modernization Act.
Changes in consumer preferences could harm our performance.
Consumer preferences often change rapidly and without warning, moving from one trend to another among many product or retail concepts.
We also depend on trends regarding away-from-home dining. Consumer preferences towards away-from-home dining or certain food products might shift as a
result
of, among other things, health concerns or dietary trends related to cholesterol, carbohydrate, fat and salt content of certain food items, including crab or other seafood items, in favor of foods
that are perceived as more healthy. Our menu is currently comprised of crab and other menu items and a change in consumer preferences away from these offerings would have a material adverse effect on
our business. Negative publicity over the health aspects of such food items may adversely affect demand for our menu items and could result in lower guest traffic, sales and results of operations.
If we fail to continue to develop and maintain our restaurant brands, our business could suffer.
We believe that maintaining and developing our restaurant brands are critical to our success and our growth strategy, and that the
importance of brand recognition is significant as a result of competitors offering products similar to our products. We have made significant marketing expenditures
19
Table of Contents
to
create and maintain brand loyalty as well as to increase awareness of our brands. If our brand-building strategy is unsuccessful, these expenses may never be recovered, and we may be unable to
increase our future sales or implement our business strategy.
Any
incident that erodes consumer affinity for our brands could significantly reduce their respective values and damage our business. If guests perceive or experience a reduction in food
quality, service or ambiance, or in any way believe we failed to deliver a consistently positive experience, our brand value could suffer and our business may be adversely affected.
In
addition, in connection with our acquisition by JCS Holdings, LLC, we granted a license to Landry's that allows Landry's to use certain of our intellectual property, including
the Joe's Crab Shack name, to operate two Joe's Crab Shack restaurants. Although Landry's is required to adhere to certain minimum quality standards under the license, including with respect to menu,
promotional materials and the specification and preparation of food and beverage items, we do not have operational control over the two restaurants. As a result, such Joe's Crab Shack restaurants
owned and operated by Landry's may not be operated in a manner consistent with the standards we uphold at our restaurants. If such restaurants do not maintain operational standards consistent with the
standards we demand of our restaurants, the image and brand reputation of Joe's Crab Shack may suffer and our business may be materially affected.
The impact of new restaurant openings could result in fluctuations in our financial performance.
As discussed above, for fiscal year 2012, we target opening 11 new restaurants, the vast majority of which will be new Joe's Crab Shack
restaurants. We expect that our new restaurant growth will continue to be substantially weighted towards new Joe's Crab Shack restaurants for the foreseeable future. New restaurants typically
experience an adjustment period before sales levels and operating margins normalize. When our new restaurants open, they typically encounter startup costs, but also significant guest traffic and,
therefore, high sales in their initial months. However, over time, these new restaurants may experience a decrease in guest traffic and sales compared to their opening months. Accordingly, sales
achieved by new restaurants may not be indicative of future operating results. Also, due to the foregoing factors, results for any one fiscal quarter are not necessarily indicative of results to be
expected for any other fiscal quarter or for a full fiscal year.
We rely heavily on certain vendors, suppliers and distributors, which could adversely affect our business.
Our ability to maintain consistent price and quality throughout our restaurants depends in part upon our ability to acquire specified
food products and supplies in sufficient quantities, especially with respect to shellfish such as crab. While our seafood offerings are generally caught from government regulated fisheries, crab and
other fish are caught in the wild, which could cause volatility in supply. In some cases, we may have only one supplier or a limited number of suppliers for a particular food product. We cannot make
assurances regarding the continued supply of our food items since we do not have control over the businesses of our suppliers. Furthermore, such food items are perishable, and we cannot assure that
such items will be delivered by such third parties in appropriate condition for sale in our restaurants. In addition, we rely on one primary distributor to deliver products to our restaurants. If any
of these vendors, our other suppliers or our distributor is unable to fulfill their obligations, or if we are unable to find replacement providers in the event of a supply or service disruption, we
could encounter supply shortages and incur higher costs to secure adequate supplies, which would materially harm our business.
In
addition, we use various third-party vendors to provide, support and maintain most of our management information systems. We also outsource certain accounting, payroll and human
resources functions to business process service providers. Such third-party vendors may not be able to handle the volume of activity or perform the quality of service necessary for our operations. The
failure of such vendors to fulfill their support and maintenance obligations or service obligations could disrupt our
20
Table of Contents
operations.
Furthermore, the outsourcing of certain of our business processes could negatively impact our internal control processes.
Approximately 45% of our restaurants are located in California, Texas and Florida and, as a result, we are sensitive to economic and other trends and developments in those
States.
As of March 26, 2012, 62 of our 138 restaurants were spread across California (13), Texas (34) and Florida (15). As a
result, we are particularly susceptible to adverse trends and economic conditions in those States, including their labor markets. In addition, given our geographic concentration in these States,
negative publicity regarding any of our restaurants in these States could have a material adverse effect on our business and operations, as could other occurrences in these regions such as local
competitive changes, changes in consumer preferences, local strikes, new or revised laws or regulations, energy shortages or increases in energy prices, droughts, hurricanes, fires, floods or other
natural disasters.
In
addition, many of our restaurants in Florida and California are located in areas that we consider tourist or vacation destinations. Therefore, we depend in large part on vacation
travelers to frequent our restaurants in these locations. Any change in consumer preferences away from Florida and California as their choice of destination could have a material adverse effect on our
business and results of operation.
Allergy concerns relating to crab and other shellfish items could affect consumer preferences and could negatively impact our results of operations.
Many of our food items contain crab or other shellfish items. In recent years, there has been negative publicity concerning, shellfish
and other food allergies. This negative publicity, as well as any other negative publicity concerning food products we serve, may adversely impact demand for our food and could result in a decrease in
guest traffic to our restaurants. Owing to the severe nature of certain shellfish allergies, shellfish have recently been identified by the U.S. Food and Drug Administration as a significant allergen.
The introduction of seafood and shellfish labeling regulations to the restaurant industry could cause us to modify the operations or atmosphere of our restaurants, which could adversely affect our
business and brand differentiation.
Health concerns arising from outbreaks of viruses may have a material adverse effect on our business.
The United States and other countries have experienced, and may experience in the future, outbreaks of viruses, such as H1N1, avian
influenza, SARS and various other forms of influenza. To the extent that a virus is transmitted by human-to-human contact, our employees or guests could become infected, or
could choose to, or be advised to avoid gathering in public places and avoid eating in restaurant establishments, which could adversely affect our business.
Information technology system failures or breaches of our network security could interrupt our operations and adversely affect our business.
We rely on our computer systems and network infrastructure across our operations, including point-of-sale
processing at our restaurants. Our operations depend upon our ability to protect our computer equipment and systems against damage from physical theft, fire, power loss, telecommunications failure or
other catastrophic events, as well as from internal and external security breaches, viruses, worms and other disruptive problems. Any damage or failure of our computer systems or network
infrastructure that causes an interruption in our operations could have a material adverse effect on our business and subject us to litigation or actions by regulatory authorities. While we utilize
our personnel, as well as a variety of hardware and software, to monitor our systems, controls, firewalls and encryption and intend to maintain and upgrade our security technology and operational
21
Table of Contents
procedures
to prevent damage, breaches or other disruptive problems, there can be no assurance that these security measures will be successful.
We may incur costs resulting from breaches of security of confidential guest information related to our electronic processing of credit and debit card transactions.
The majority of our restaurant sales are by credit or debit cards. Other retailers have experienced security breaches in which credit
and debit card information has been stolen. Although we use secure private networks to transmit confidential information, third parties may have the technology or know-how to breach the
security of the guest information transmitted in connection with credit and debit card sales, and our security measures and those of technology vendors may not effectively prohibit others from
obtaining improper access to this information. If a person is able to circumvent these security measures, he or she could destroy or steal valuable information or disrupt our operations. We may in the
future become subject to claims for purportedly fraudulent transactions arising out of the actual or alleged theft of credit or debit card information, and we may also be subject to lawsuits or other
proceedings relating to these types of incidents. Any such claim or proceeding could cause us to incur significant unplanned expenses, which could have an adverse impact on our financial condition,
results of operations and cash flows. Further, adverse publicity resulting from these allegations could significantly harm our reputation and may have a material adverse effect on us and our
restaurants.
We depend upon our executive officers and may not be able to retain or replace these individuals or recruit additional personnel, which could harm our business.
We believe that we have benefited substantially from the leadership and experience of our executive officers, including our President
and Chief Executive Officer, Raymond A. Blanchette, III, and our Senior Vice President and Chief Financial Officer, Jeffrey L. Rager. The loss of the services of any of our executive
officers could have a material adverse effect on our business and prospects, as we may not be able to find suitable individuals to replace such personnel on a timely basis. In addition, any such
departure could be viewed in a negative light by investors and analysts, which could cause our common stock price to decline. As our business expands, our future success will depend greatly on our
continued ability to attract and retain highly skilled and qualified executive-level personnel. Our inability to attract and retain qualified executive officers in the future could impair our growth
and harm our business.
We are dependent on attracting and retaining qualified employees while also controlling labor costs.
We are dependent upon the availability of qualified restaurant personnel. Our future performance will depend on our ability to attract,
motivate and retain our chief operating officers, regional vice presidents, directors of operations and restaurant-level managers. Competition for these employees is intense. The loss of the services
of members of our restaurant management team or the inability to attract additional qualified personnel as needed could materially harm our business.
In
addition, availability of staff varies widely from restaurant to restaurant. In fiscal year 2011, our turnover for restaurant managers at Joe's Crab Shack was 25% and 48% at Brick
House. In fiscal year 2011, our hourly restaurant employee turnover at our comparable restaurants was 107%. If restaurant management and staff turnover trends increase, we could suffer higher direct
costs associated with recruiting, training and retaining replacement personnel. Moreover, we could suffer from significant indirect costs, including restaurant disruptions due to management changeover
and potential delays in new restaurant openings or adverse guest reactions to inadequate guest service levels due to staff shortages. Competition for qualified employees may exert upward pressure on
wages paid to attract such personnel, resulting in higher labor costs, together with greater recruitment and training expense.
22
Table of Contents
We
must comply with the Fair Labor Standards Act and various federal and state laws governing employment matters, such as minimum wage, tip credit allowance, overtime pay practices,
child labor laws and other working conditions and citizenship requirements. Federal, state and municipal laws may
also require us to provide new or increased levels of employee benefits to our employees, many of whom are not currently eligible for such benefits. Many of our employees are hourly workers whose
wages are likely to be affected by an increase in the federal or state minimum wage or changes to the tip credit allowance. Proposals have been made, and continue to be made, at federal and state
levels to increase minimum wage levels, including changes to the tip credit allowance. An increase in the minimum wage or a change in the tip credit allowance may require an increase or create
pressure to increase the pay scale for our employees. In addition, while we take certain measures to operate our restaurants in strict compliance with federal immigration regulations and the
requirements of certain states, some of our employees, especially given the location of many of our restaurants, may fail to meet federal work authorization or residency requirements, which could
result in disruptions in our work force, sanctions against us and adverse publicity. A shortage in the labor pool or other general inflationary pressures or changes could also increase our labor
costs. A shortage in the labor pool could also cause our restaurants to be required to operate with reduced staff, which could negatively impact our ability to provide adequate service levels to our
guests.
Among
the federal laws with which we must comply is the National Labor Relations Act that applies to the election by employees to be represented by a labor organization for purposes of
collective bargaining over wages, hours, working conditions and terms and conditions of employment. Currently, none of our employees are represented by labor organizations for these purposes. However,
potential union representation and collectively bargaining agreements may result in increased labor costs that can have an impact on competitiveness. Labor disputes, as well, may precipitate strikes
and picketing that may have an impact on business, including guest patronage and supplier deliveries.
Our existing senior secured credit facilities contain financial covenants, negative covenants and other restrictions and failure to comply with these requirements could
cause the related indebtedness to become due and payable and limit our ability to incur additional debt.
The lenders' obligation to extend credit under our existing senior secured credit facilities depends upon our maintaining certain
financial covenants. In particular, our senior secured credit facilities require us to maintain a minimum consolidated fixed charge coverage ratio, a maximum consolidated leverage ratio, and limit our
capital expenditures to specified levels. Failure to maintain these ratios and comply with capital expenditure limitations could result in an acceleration of outstanding amounts under the term loan
and restrict us from borrowing amounts under the revolving credit facility to fund our future liquidity requirements. In addition, our credit facilities contain certain negative covenants, which,
among other things, limit our ability to:
- •
- incur additional indebtedness;
- •
- enter into new leases;
- •
- pay dividends and make other restrictive payments beyond specified levels;
- •
- create or permit liens;
- •
- dispose of certain assets;
- •
- make certain investments;
- •
- engage in certain transactions with affiliates; and
- •
- consolidate, merge or transfer all or substantially all of our assets.
23
Table of Contents
Our
ability to make scheduled payments and comply with financial covenants will depend on our operating and financial performance, which in turn, is subject to prevailing economic
conditions and to other financial, business and other factors beyond our control described herein.
We may need additional capital in the future, and it may not be available on acceptable terms.
The development of our business may require significant additional capital in the future to fund our operations and growth, among other
activities. We have historically relied
upon cash generated by our operations to fund our expansion. In the future, we intend to rely on funds from operations and, if necessary, our senior secured credit facility. We may also need to access
the debt and equity capital markets. There can be no assurance, however, that these sources of financing will be available on acceptable terms, or at all. Our ability to obtain additional financing
will be subject to a number of factors, including market conditions, our operating performance, investor sentiment and our ability to incur additional debt in compliance with agreements governing our
then-outstanding debt. These factors may make the timing, amount, terms or conditions of additional financings unattractive to us. If we are unable to generate sufficient funds from
operations or raise additional capital, our growth could be impeded.
Assuming
that the amount of net proceeds that we receive from this offering is $65.3 million and after giving effect to our intended use of proceeds as described in "Use of
Proceeds," as of March 26, 2012, we would have had approximately $78.2 million of total indebtedness outstanding, consisting of (i) a $76.4 million term loan facility due
on March 24, 2016 and (ii) $1.8 million outstanding in letters of credit. We have no outstanding borrowings under our $25.0 million revolving credit facility, which matures
on March 24, 2016. Our obligations and the guarantees under the senior secured credit facility are secured by all of our assets. We may not be able to refinance our indebtedness prior to or at
its maturity on acceptable terms or at all.
Legal complaints or litigation may hurt us.
Occasionally, restaurant guests and/or employees file complaints or lawsuits against us alleging that we are responsible for some
illness or injury they suffered at or after a visit to our restaurants, or that we have problems with food quality or operations. We are also subject to a variety of other claims arising in the
ordinary course of our business, including personal injury claims, contract claims and claims alleging violations of federal and state law regarding workplace and employment matters, discrimination
and similar matters. We could also become subject to class action lawsuits related to these matters in the future. In recent years, a number of restaurant companies have been subject to lawsuits,
including class action lawsuits, alleging violations of federal and state law regarding workplace conditions, employment and similar matters. A number of these industry lawsuits have resulted in the
payment of substantial damages by defendants. The restaurant industry has also been subject to a growing number of claims that the menus and actions of restaurant chains have led to the obesity of
certain of their guests.
Regardless,
however, of whether any claim brought against us in the future is valid or whether we are liable, such a claim would be expensive to defend and may divert time, money and
other valuable resources away from our operations and, thereby, hurt our business.
We
are subject to state and local "dram shop" statutes, which may subject us to uninsured liabilities. These statutes generally allow a person injured by an intoxicated person to recover
damages from an establishment that wrongfully served alcoholic beverages to the intoxicated person. In the past, after allegedly consuming alcoholic beverages at our restaurants, there have been
isolated instances where certain individuals have been killed or injured or have killed or injured third parties. Because a plaintiff may seek punitive damages, which may not be fully covered by
insurance, this type of action could have an adverse impact on our financial condition and results of operations. A judgment in such an action significantly in excess of our insurance coverage could
adversely affect our financial condition,
24
Table of Contents
results
of operations or cash flows. Further, adverse publicity resulting from any such allegations may adversely affect us and our restaurants taken as a whole.
Failure to obtain and maintain required licenses and permits or to comply with alcoholic beverage or food control regulations could lead to the loss of our liquor and food
service licenses and, thereby, harm our business.
The restaurant industry is subject to various federal, state and local government regulations, including those relating to the sale of
food and alcoholic beverages. Such regulations are subject to change from time to time. The failure to obtain and maintain these licenses, permits and approvals could adversely affect our operating
results. Typically, licenses must be renewed annually and may be revoked, suspended or denied renewal for cause at any time if governmental authorities determine that our conduct violates applicable
regulations. Difficulties or failure to maintain or obtain the required licenses and approvals could adversely affect our existing restaurants and delay or result in our decision to cancel the opening
of new restaurants, which would adversely affect our business.
In
fiscal year 2011, approximately 13% of Joe's Crab Shack revenues and 47% of Brick House Tavern+Tap revenues were attributable to the sale of alcoholic beverages, and our
alcoholic beverage sales may increase in the future. Alcoholic beverage control regulations require each of our restaurants to apply to a state authority and, in certain locations, county or municipal
authorities for a license or permit to sell alcoholic beverages on-premises and to provide service for extended hours and on Sundays. Alcoholic beverage control regulations relate to
numerous aspects of daily operations of our restaurants, including minimum age of patrons and employees, hours of operation, advertising, trade practices, wholesale purchasing, other relationships
with alcohol manufacturers, wholesalers and distributors, inventory control and handling, storage and dispensing of alcoholic beverages. In the past, we have been subject to fines for violations of
alcoholic beverage control regulations. Any future failure to comply with these regulations and obtain or retain liquor licenses could adversely affect our results of operations and overall financial
condition.
We are subject to many federal, state and local laws with which compliance is both costly and complex.
The restaurant industry is subject to extensive federal, state and local laws and regulations, including the recently enacted
comprehensive health care reform legislation and those relating to building and zoning requirements and those relating to the preparation and sale of food. The development and operation of restaurants
depend to a significant extent on the selection and acquisition of suitable sites, which are subject to zoning, land use, environmental, traffic and other regulations and requirements. We are also
subject to licensing and regulation by state and local authorities relating to health, sanitation, safety and fire standards and liquor licenses, federal and state laws governing our relationships
with employees (including the Fair Labor Standards Act of 1938, the Immigration Reform and Control Act of 1986 and applicable requirements concerning the minimum wage, overtime, family leave, tip
credits, working conditions, safety standards, immigration status, unemployment tax rates, workers' compensation rates and state and local payroll taxes), federal and state laws which prohibit
discrimination and other laws regulating the design and operation of facilities, such as the Americans With Disabilities Act of 1990, or the ADA.
In
March 2010, the United States federal government enacted comprehensive health care reform legislation which, among other things, includes guaranteed coverage requirements, eliminates
pre-existing condition exclusions and annual and lifetime maximum limits, restricts the extent to which policies can be rescinded and imposes new and significant taxes on health insurers
and health care benefits. The legislation imposes implementation effective dates that began in 2010 and extend through 2020, and many of the changes require additional guidance from government
agencies or federal regulations. To date, we have not experienced material costs related to such legislation. However, due to the phased-in nature of the implementation and the lack of
interpretive guidance, it is difficult to determine at this time what impact the health care reform legislation will have on our financial results.
25
Table of Contents
Possible
adverse effects could include increased costs, exposure to expanded liability and requirements for us to revise the ways in which we provide healthcare and other benefits to our employees.
The
impact of current laws and regulations, the effect of future changes in laws or regulations that impose additional requirements and the consequences of litigation relating to current
or future laws and regulations, or our inability to respond effectively to significant regulatory or public policy issues, could increase our compliance and other costs of doing business and therefore
have an adverse effect on our results of operations. Failure to comply with the laws and regulatory requirements of federal, state and local authorities could result in, among other things, revocation
of required licenses, administrative enforcement actions, fines and civil and criminal liability. In addition, certain laws, including the ADA, could require us to expend significant funds to make
modifications to our restaurants if we failed to comply with applicable standards. Compliance with all of these laws and regulations can be costly and can increase our exposure to litigation or
governmental investigations or proceedings.
From the fourth quarter of 2008 to the fourth quarter of 2011, Brick House employed an all-female service staff, which could subject our business to litigation.
Brick House guests were historically served by an all-female service staff. We converted to a more traditional service
model utilizing male and female servers during the fourth quarter of fiscal year 2011 in combination with other modifications to the style and experience of our Brick House restaurants to appeal to a
broader guest base. Although Title VII of the Civil Rights Act of 1964 would typically prohibit the employment of a female only service staff, we relied on an established exception to
Title VII, known as the "bona fide occupational qualification" defense or "BFOQ" defense. The BFOQ defense permits the hiring of a female only service staff when it is reasonably necessary to
the normal operation of the business. We believe that Brick House qualified for this defense throughout the period when we served our guests through an all-female service staff. However,
in the past, courts have narrowly interpreted the BFOQ defense and there is no guarantee that we would be found to have qualified for the BFOQ defense if the matter was adjudicated. If a plaintiff
brought a claim for discrimination under Title VII for actions during prior periods, our results of operations could be adversely affected.
New information or attitudes regarding diet and health could result in additional menu labeling laws and changes in regulations and consumer eating habits that could
adversely affect our results of operations.
Regulations and consumer eating habits may continue to change as a result of new information and attitudes regarding diet and health.
These changes may include regulations that impact the ingredients and nutritional content of our menu items. The federal government as well as a number of states (including California), counties and
cities have enacted menu labeling laws requiring multi-unit restaurant operators to make certain nutritional information available to guests (including caloric, sugar, sodium and fat
content) or have enacted legislation prohibiting the sales of certain types of ingredients in restaurants. The success of our restaurant operations depends, in part, upon our ability to effectively
respond to changes in consumer health and disclosure regulations and to adapt our menu offerings to fit the dietary needs and eating habits of our guests without sacrificing flavor. If consumer health
regulations or consumer eating habits change significantly, we may be required to modify or discontinue certain menu items. To the extent we are unable to respond with appropriate changes to our menu
offerings, it could materially affect guest traffic and our results of operations. Furthermore, a change in our menu could result in a decrease in guest traffic.
We have recorded impairment charges in past periods and may record additional impairment charges in future periods.
We periodically evaluate possible impairment at the individual restaurant-level, and record an impairment loss whenever we determine
impairment factors are present. We also periodically evaluate
26
Table of Contents
the
criteria we use as an indication of restaurant impairment. We consider a history of restaurant operating losses to be a primary indicator of potential impairment for individual restaurant
locations. A lack of improvement at restaurants we are monitoring, or deteriorating results at other restaurants, could result in additional impairment charges.
Our current insurance may not provide adequate levels of coverage against claims.
We currently maintain insurance customary for businesses of our size and type. However, there are types of losses we may incur that
cannot be insured against or that we believe are not economically reasonable to insure. Such losses could have a material adverse effect on our business and results of operations. In addition, we
self-insure a significant portion of expected losses under our workers' compensation, general liability and property insurance programs. Unanticipated changes in the actuarial assumptions
and management estimates underlying our reserves for these losses could result in materially different amounts of expense under these programs, which could have a material adverse effect on our
financial condition, results of operations and liquidity.
Our failure or inability to enforce our trademarks or other proprietary rights could adversely affect our competitive position or the value of our brand.
Our registered trademarks and service marks include Joe's Crab Shack and the design, our stylized logos set forth on the cover and back
pages of this prospectus and Brick House Tavern+Tap and the design, which are protected under applicable intellectual property laws. We believe that our trademarks and other proprietary
rights are important to our success and our competitive position, and, therefore, we devote resources to the protection of our trademarks and proprietary rights. The protective actions that we take,
however, may not be enough to prevent unauthorized use or imitation by others, which could harm our image, brand or competitive position. If we commence litigation to enforce our rights, we will incur
significant legal fees.
We
cannot assure you that third parties will not claim infringement by us of their proprietary rights in the future. Any such claim, whether or not it has merit, could be
time-consuming and distracting for executive management, result in costly litigation, cause changes to existing menu items or delays in introducing new menu items, or require us to enter
into royalty or licensing agreements. As a result, any such claim could have a material adverse effect on our business, results of operations and financial condition.
Our quarterly operating results may fluctuate significantly and could fall below the expectations of securities analysts and investors due to seasonality and other factors,
some of which are beyond our control, resulting in a decline in our stock price.
Our quarterly operating results may fluctuate significantly because of several factors, including:
- •
- the timing of new restaurant openings and related expense;
- •
- restaurant operating costs for our newly-opened restaurants, which are often materially greater during the first several
months of operation than thereafter;
- •
- labor availability and costs for hourly and management personnel;
- •
- profitability of our restaurants, especially in new markets;
- •
- changes in interest rates;
- •
- increases and decreases in average unit volumes and comparable restaurant sales;
- •
- impairment of long-lived assets and any loss on restaurant closures;
- •
- macroeconomic conditions, both nationally and locally;
27
Table of Contents
- •
- negative publicity relating to the consumption of seafood or other products we serve;
- •
- changes in consumer preferences and competitive conditions;
- •
- expansion to new markets;
- •
- increases in infrastructure costs; and
- •
- fluctuations in commodity prices.
Our
business is also subject to seasonal fluctuations. Our revenues are typically highest in the summer months (June, July and August) and lowest in the winter months (November, December
and January) especially with respect to Joe's Crab Shack restaurants. As a result, our quarterly and annual operating results and comparable restaurant sales may fluctuate significantly as a result of
seasonality and the factors discussed above. Accordingly, results for any one fiscal quarter are not necessarily indicative of results to be expected for any other fiscal quarter or for any fiscal
year and comparable restaurant sales
for any particular future period may decrease. In the future, operating results may fall below the expectations of securities analysts and investors. In that event, the price of our common stock would
likely decrease.
Significant adverse weather conditions and other disasters could negatively impact our results of operations.
Adverse weather conditions and acts of god, such as regional winter storms, fires, floods, hurricanes, tropical storms and earthquakes,
and other disasters, such as oil spills and nuclear meltdowns, could negatively impact our results of operations. In particular, a number of our restaurants are located in states which are
particularly susceptible to hurricanes, tropical storms, flooding and earthquakes.
Any strategic transactions or initiatives that we consider in the future may have unanticipated consequences that could harm our business and our financial condition.
From time to time, we evaluate potential mergers, acquisitions of restaurants joint ventures or other strategic initiatives to acquire
or develop additional restaurant brands. To successfully execute any acquisition or development strategy, we will need to identify suitable acquisition or development candidates, negotiate acceptable
acquisition or development terms and obtain appropriate financing. Any acquisition or future development that we pursue, whether or not successfully completed, may involve risks,
including:
- •
- material adverse effects on our operating results, particularly in the fiscal quarters immediately following the
acquisition or development as the restaurants are integrated into our operations;
- •
- risks associated with entering into new domestic markets or conducting operations where we have no or limited prior
experience, including international markets;
- •
- risks inherent in accurately assessing the value, future growth potential, strengths, weaknesses, contingent and other
liabilities and potential profitability of acquisition candidates and newly developed restaurant brands, and our ability to achieve projected economic and operating synergies;
- •
- negative impacts on the reputation of our current brands; and
- •
- the diversion of management's attention from other business concerns.
We will incur increased costs as a result of operating as a public company, and our management will be required to devote substantial time to comply with the requirements
applicable to public companies.
Prior to this offering, we have not been subject to the reporting requirements of the Securities Exchange Act of 1934, or the Exchange
Act, or the other rules and regulations of the Securities
28
Table of Contents
Exchange
Commission, or the SEC, or any securities exchange relating to public companies. We are working with our legal and financial advisors and independent accountants to identify those areas in
which changes should be made to our financial and management control systems to manage our growth and our obligations as a public company. These areas include corporate governance, corporate control,
internal audit, disclosure controls and procedures and financial reporting and accounting systems. We have made, and will continue to make, changes in these and other areas. However, the expenses that
we will be required to incur in order to adequately prepare for being a public company could be material. Ongoing compliance with the various reporting and other requirements applicable to public
companies will also require considerable time and attention of management, particularly after we are no longer an "emerging growth company." We cannot predict or estimate the amount of the additional
costs we may incur, the timing of such costs or the degree of impact that our management's attention to these matters will have on our business. In addition, the changes we make may not be sufficient
to allow us to satisfy our obligations as a public company on a timely basis.
In
addition, we expect these rules and regulations to make it more difficult and more expensive for us to obtain director and officer liability insurance, and we may be required to
accept reduced policy limits and coverage or incur substantial additional costs to maintain the same or similar coverage. These rules and regulations could also make it more difficult for us to
attract and retain qualified persons to serve on our board of directors, our board committees or as executive officers.
Congress enacted the Jumpstart Our Business Startups Act of 2012, or the "JOBS Act," on April 5, 2012. Pursuant to the provisions of the JOBS Act, we qualify as an "emerging
growth company."
Section 102 of the JOBS Act provides that an "emerging growth company" can take advantage of the extended transition period provided in Section 7(a)(2)(B) of the Securities Act for
complying with new or revised accounting standards. However, we are choosing to "opt out" of such extended transition period, and as a result, we will comply with new or revised accounting standards
on the relevant dates on which adoption of such standards is required for non-emerging growth companies. Our decision to opt out of the extended transition period is irrevocable.
For
as long as we remain an "emerging growth company" as defined in the JOBS Act, we may take advantage of certain exemptions from various reporting requirements that are applicable to
other public companies that are not "emerging growth companies" including, but not limited to, not being required to comply with the auditor attestation requirements of Section 404 of the
Sarbanes-Oxley Act, reduced disclosure obligations regarding executive compensation in our periodic reports and proxy statements, and exemptions from the requirements of holding a nonbinding advisory
vote on executive compensation and shareholder approval of any golden parachute payments not previously approved. We may take advantage of these reporting exemptions until we are no longer an
"emerging growth company."
We
anticipate that will remain an "emerging growth company" until the earlier of the end of the fiscal year during which we have total annual gross revenues of $1.0 billion or
more and the end of the fiscal year following the fifth anniversary of the completion of this public offering.
We are an "emerging growth company" and we cannot be certain if the reduced disclosure requirements applicable to emerging growth companies will make our common stock less
attractive to investors.
We are an "emerging growth company," as defined in the JOBS Act, and we may take advantage of certain temporary exemptions from various
reporting requirements that are applicable to other public companies that are not "emerging growth companies" including, but not limited to, not being required to comply with the auditor attestation
requirements of section 404 of the Sarbanes-Oxley Act, reduced disclosure obligations regarding executive compensation in our periodic reports and proxy statements, and exemptions from the
requirements of holding a nonbinding advisory vote on executive compensation and shareholder approval of any golden parachute payments not previously approved. We cannot predict if investors will find
our common stock less attractive if we will rely on these
29
Table of Contents
exemptions.
If some investors find our common stock less attractive as a result, there may be a less active trading market for our common stock and our stock price may be more volatile.
Risks Related to This Offering and Ownership of Our Common Stock
Concentration of ownership by J.H. Whitney VI may prevent new investors from influencing significant corporate decisions.
Upon consummation of this offering, J.H. Whitney VI will own, in the aggregate, approximately 70% of our outstanding
common stock. See "Principal and Selling Stockholder" for more information on our beneficial ownership. As a result, J.H. Whitney VI will be able to exercise control over all matters
requiring stockholder approval, including the election of directors, amendment of our amended and restated certificate of incorporation and approval of significant corporate transactions and will have
significant control over our management and policies. We currently expect that, following this offering, two of the six members of our board of directors will be principals of J.H. Whitney.
J.H. Whitney VI can take actions that have the effect of delaying or preventing a change in control of us or discouraging others from making tender offers for our shares, which could
prevent stockholders from receiving a premium for their shares. These actions may be taken even if other stockholders oppose them. The concentration of voting power with J.H. Whitney VI
may have an adverse effect on the price of our common stock. The interests of J.H. Whitney VI may not be consistent with your interests as a stockholder. After the lock-up
period expires, J.H. Whitney VI will be able to transfer control of us to a third-party by transferring their common stock, which would not require the approval of our board of directors
or our other stockholders.
Our
amended and restated certificate of incorporation will provide that the doctrine of corporate opportunity will not apply against J.H. Whitney, or any of our directors who are
employees of or affiliated with J.H. Whitney, in a manner that would prohibit them from investing or participating in competing businesses. To the extent J.H. Whitney affiliated funds
invest in such other businesses, they may have differing interests than our other stockholders. For example, J.H. Whitney affiliated funds may choose to own other restaurant brands through
other investments, which may compete with our brands.
We will be a "controlled company" within the meaning of The NASDAQ Stock Market rules, and, as a result, we will rely on exemptions from certain corporate governance
requirements that provide protection to stockholders of other companies.
Upon completion of this offering, J.H. Whitney VI will own more than 50% of the total voting power of our common stock
and we will be a "controlled company" under The NASDAQ Stock Market corporate governance listing standards. As a controlled company, we will be exempt under The NASDAQ Stock Market listing standards
from the obligation to comply with certain
of The NASDAQ Stock Market corporate governance requirements, including the requirements:
- •
- that a majority of our board of directors consist of independent directors, as defined under the rules of The NASDAQ Stock
Market;
- •
- that we have a corporate governance and nominating committee that is composed entirely of independent directors with a
written charter addressing the committee's purpose and responsibilities; and
- •
- that we have a compensation committee that is composed entirely of independent directors with a written charter addressing
the committee's purpose and responsibilities.
There may not be a viable public market for our common stock.
Prior to this offering, there has been no public market for our common stock. The initial public offering price for our common stock
will be determined through negotiations between us and the
30
Table of Contents
representative
of the underwriters and may not be indicative of the market price of our common stock after this offering. If you purchase shares of our common stock, you may not be able to resell
those shares at or above the initial public offering price. We cannot predict the extent to which investor interest in our company will lead to the development of an active trading market on The
NASDAQ Global Select Market or otherwise or how liquid that market might become. An active public market for our common stock may not develop or be sustained after the offering. If an active public
market does not develop or is not sustained, it may be difficult for you to sell your shares of common stock at a price that is attractive to you, or at all.
Our stock price may be volatile or may decline regardless of our operating performance, and you may not be able to resell your shares at or above the initial public offering
price.
After this offering, the market price for our common stock is likely to be volatile, in part because our shares have not been traded
publicly. In addition, the market price of our common stock may fluctuate significantly in response to a number of factors, most of which we cannot control, including those described under
"—Risks Related to Our Business" and the following:
- •
- potential fluctuation in our annual or quarterly operating results due to seasonality and other factors;
- •
- changes in capital market conditions that could affect valuations of restaurant companies in general or our goodwill in
particular or other adverse economic conditions;
- •
- changes in financial estimates by any securities analysts who follow our common stock, our failure to meet these estimates
or failure of those analysts to initiate or maintain coverage of our common stock;
- •
- downgrades by any securities analysts who follow our common stock;
- •
- future sales of our common stock by our officers, directors and significant stockholders;
- •
- global economic, legal and regulatory factors unrelated to our performance;
- •
- investors' perceptions of our prospects;
- •
- announcements by us or our competitors of significant contracts, acquisitions, joint ventures or capital commitments; and
- •
- investor perceptions of the investment opportunity associated with our common stock relative to other investment
alternatives.
In
addition, the stock markets, and in particular The NASDAQ Global Select Market, have experienced extreme price and volume fluctuations that have affected and continue to affect the
market prices of equity securities of many food service companies. In the past, stockholders have instituted securities class action litigation following periods of market volatility. If we were
involved in securities litigation, we could incur substantial costs and our resources and the attention of management could be diverted from our business.
Future sales of our common stock, or the perception in the public markets that these sales may occur, may depress our stock price.
Sales of substantial amounts of our common stock in the public market after this offering, or the perception that these sales could
occur, could adversely affect the price of our common stock and could impair our ability to raise capital through the sale of additional shares. Upon completion of this offering, we will have
24,750,929 shares of common stock outstanding. The shares of common stock offered in this offering will be freely tradable without restriction under the Securities Act of 1933, which we refer
to as the Securities Act, except for any shares of our common stock that may be held or acquired by our directors, executive officers and other affiliates, as that term is defined in the Securities
31
Table of Contents
Act,
which will be restricted securities under the Securities Act. Restricted securities may not be sold in the public market unless the sale is registered under the Securities Act or an exemption
from registration is available.
After
this offering, J.H. Whitney VI will have the right, subject to certain conditions, to require us to file registration statements registering additional shares of
common stock, and J.H. Whitney VI and members of management will have the right to require us to include shares of common stock in registration statements that we may file for ourselves
or J.H. Whitney VI. In order to exercise these registration rights, the holder must be permitted to sell shares of its common stock under applicable lock-up restrictions
described below. Subject to compliance with applicable
lock-up restrictions and restrictions under the registration rights agreement (both of which may be waived), shares of common stock sold under these registration statements can be freely
sold in the public market. In the event such registration rights are exercised and a large number of shares of common stock are sold in the public market, such sales could reduce the trading price of
our common stock. These sales also could impede our ability to raise future capital. See "Shares Eligible for Future Sale—Registration Rights Agreement". In addition, we will incur certain
expenses in connection with the registration and sale of such shares.
We,
each of our officers and directors and the selling stockholder have agreed, subject to certain exceptions, with the underwriters not to dispose of or hedge any of the shares of
common stock or securities convertible into or exchangeable for shares of common stock during the period from the date of this prospectus continuing through the date 180 days after the date of
this prospectus, except, in our case, for the issuance of common stock upon exercise of options under existing option plans. Credit Suisse Securities (USA) LLC may, in its sole discretion, release any
of these shares from these restrictions at any time without notice. See "Underwriting."
All
of our shares of common stock outstanding as of the date of this prospectus may be sold in the public market by existing stockholders 180 days after the date of this
prospectus, subject to applicable volume and other limitations imposed under federal securities laws. See "Shares Eligible for Future Sale" for a more detailed description of the restrictions on
selling shares of our common stock after this offering.
In
the future, we may also issue our securities in connection with investments or acquisitions. The amount of shares of our common stock issued in connection with an investment or
acquisition could constitute a material portion of our then-outstanding shares of our common stock.
Anti-takeover
provisions in our charter documents and Delaware law might discourage or delay acquisition attempts for us that you might consider favorable.
Our
amended and restated certificate of incorporation and amended and restated bylaws will contain provisions that may make the acquisition of our company more difficult without the
approval of our board of directors. These provisions:
- •
- establish a classified board of directors for a period of time after the consummation of the public offering, so that not
all members of our board of directors are elected at one time;
- •
- authorize the issuance of undesignated preferred stock, the terms of which may be established and the shares of which may
be issued without stockholder approval, and which may include super voting, special approval, dividend, or other rights or preferences superior to the rights of the holders of common stock;
- •
- prohibit stockholder action by written consent, requiring all stockholder actions be taken at a meeting of our
stockholders, once J.H. Whitney VI owns less than 50% of our outstanding voting stock;
- •
- provide that the board of directors is expressly authorized to make, alter, or repeal our amended and restated bylaws; and
32
Table of Contents
- •
- establish advance notice requirements for nominations for elections to our board of directors or for proposing matters
that can be acted upon by stockholders at stockholder meetings.
These
anti-takeover provisions and other provisions under Delaware law could discourage, delay or prevent a transaction involving a change in control of our company, even if
doing so would benefit our stockholders. These provisions could also discourage proxy contests and make it more difficult for you and other stockholders to elect directors of your choosing and to
cause us to take other corporate actions you desire.
If you purchase shares of common stock sold in this offering, you will incur immediate and substantial dilution.
If you purchase shares of common stock in this offering, you will incur immediate and substantial dilution in the amount of $9.55 per
share assuming an initial public offering price of $13.00 per share, the midpoint of the price range set forth on the cover page of this prospectus, because such price is substantially higher than the
pro forma net tangible book value per share of our outstanding common stock. This dilution is due in large part to the fact that our earlier
investors paid substantially less than the initial public offering price when they purchased their shares. In addition, you may also experience additional dilution upon future equity issuances or the
exercise of stock options to purchase common stock granted to our employees, consultants and directors under our stock option and equity incentive plans. See "Dilution."
If securities or industry analysts do not publish research or publish inaccurate or unfavorable research about our business, our stock price and trading volume could
decline.
The trading market for our common stock will depend in part on the research and reports that securities or industry analysts publish
about us or our business. We do not currently have and may never obtain research coverage by securities and industry analysts. If no securities or industry analysts commence coverage of our company,
the trading price for our common stock would be negatively impacted. If we obtain securities or industry analyst coverage and if one or more of the analysts who covers us downgrades our common stock
or publishes inaccurate or unfavorable research about our business, our stock price would likely decline. If one or more of these analysts ceases coverage of us or fails to publish reports on us
regularly, demand for our common stock could decrease, which could cause our stock price and trading volume to decline.
We do not expect to pay any cash dividends for the foreseeable future.
The continued operation and expansion of our business will require substantial funding. Accordingly, we do not anticipate that we will
pay any cash dividends on shares of our common stock for the foreseeable future. Any determination to pay dividends in the future will be at the discretion of our board of directors and will depend
upon results of operations, financial condition, contractual restrictions, including our senior secured credit facility and other indebtedness we may incur, restrictions imposed by applicable law and
other factors our board of directors deems relevant. Accordingly, if you purchase shares in this offering, realization of a gain on your investment will depend on the appreciation of the price of our
common stock, which may never occur. Investors seeking cash dividends in the foreseeable future should not purchase our common stock.
33
Table of Contents
FORWARD-LOOKING STATEMENTS
This prospectus contains statements about future events and expectations that constitute forward-looking statements. Forward-looking
statements are based on our beliefs, assumptions and expectations of our future financial and operating performance and growth plans, taking into account the information currently available to us.
These statements are not statements of historical fact. Forward-looking statements involve risks and uncertainties that may cause our actual results to differ materially from the expectations of
future results we express or imply in any forward-looking statements and you should not place undue reliance on such statements. Factors that could contribute to these differences include, but are not
limited to, the following:
- •
- our ability to successfully maintain increases in our comparable restaurant sales, average weekly sales and average unit
volumes;
- •
- our ability to successfully execute our growth strategy and open new restaurants that are profitable;
- •
- macroeconomic conditions;
- •
- our ability to compete with many other restaurants;
- •
- changes in food and supply costs, including the cost of crab;
- •
- our ability to expand Brick House;
- •
- concerns regarding food safety and food-borne illness;
- •
- changes in consumer preferences;
- •
- our ability to develop and maintain our restaurant brands;
- •
- the impact of new restaurant openings on our financial performance;
- •
- our reliance on vendors, suppliers and distributors;
- •
- our geographic concentration in California, Texas and Florida;
- •
- changes in consumer preferences caused by health and allergy concerns and government regulation relating to crab and other
shellfish items;
- •
- health concerns arising from outbreaks of viruses;
- •
- the reliability of our information technology systems and network security;
- •
- costs resulting from breaches of security of confidential guest information;
- •
- the continued service of our executive officers;
- •
- our ability to attract and retain qualified employees while also controlling labor costs;
- •
- our ability to incur additional debt and other restrictions under the terms of our existing senior secured credit
facilities;
- •
- our ability to generate or raise capital in the future;
- •
- legal complaints or litigation;
- •
- our ability to obtain and maintain required licenses and permits or to comply with alcoholic beverage or food control
regulations;
- •
- the cost of compliance with federal, state and local laws;
- •
- adverse litigation relating to Brick House's historic policy of an all-female service staff;
34
Table of Contents
- •
- the impact of additional menu labeling laws;
- •
- impairment charges;
- •
- our ability to maintain insurance that provides adequate levels of coverage against claims;
- •
- our ability to protect our intellectual property;
- •
- potential fluctuations in our annual or quarterly operating results due to seasonality and other factors;
- •
- the impact of significant adverse weather conditions and other disasters;
- •
- any potential strategic transactions or initiatives;
- •
- the costs and time requirements as a result of operating as a public company;
- •
- the concentration of ownership among our existing executive officers, directors and principal stockholders;
- •
- "controlled company" exemptions under The NASDAQ Stock Market listing standards;
- •
- the development and sustainability of an active trading market for our common stock;
- •
- the volatility of our stock price;
- •
- future sales of our common stock, or the perception in the public markets that sales may occur;
- •
- future dilution of our common stock;
- •
- inaccurate or unfavorable research about our business published by any securities or industry analysts who follow our
common stock or the lack of analysts covering us; and
- •
- the payment of dividends.
Words
such as "anticipates," "believes," "continues," "estimates," "expects," "goal," "objectives," "intends," "may," "opportunity," "plans," "potential," "near-term,"
"long-term," "projections," "assumptions," "projects," "guidance," "forecasts," "outlook," "target," "trends," "should," "could," "would," "will" and similar expressions are intended to
identify such forward-looking statements. We qualify any forward-looking statements entirely by these cautionary factors. Other risks, uncertainties and factors, including those discussed under "Risk
Factors," could cause our actual results to differ materially from those projected in any forward-looking statements we make. We assume no obligation to update or revise these forward-looking
statements for any reason, or to update the reasons actual results could differ materially from those anticipated in these forward-looking statements, even if new information becomes available in the
future.
35
Table of Contents
USE OF PROCEEDS
We estimate based upon an assumed initial public offering price of $13.00 per share, the midpoint of the price range set forth on the
cover page of this prospectus, we will receive proceeds from the offering of approximately $65.3 million, after deducting estimated underwriting discounts and commissions and offering expenses
payable by us. We will not receive any proceeds from the sale of shares of our common stock by the selling stockholder.
We
intend to use the net proceeds from this offering together with cash on hand:
- •
- to prepay an aggregate amount of $40.6 million of our existing senior secured credit facility;
- •
- to pay J.H. Whitney a fee in an aggregate amount of $1.0 million in connection with the termination of the
management agreement; and
- •
- for other general corporate purposes.
In
March 2011, we used borrowings under our senior secured credit facility to discharge all indebtedness under our prior senior secured credit facility, pay a termination fee in
connection with our interest rate swap agreement and pay a dividend indirectly to J.H. Whitney VI through JCS Holdings, LLC, our parent company. As of March 26, 2012, we
had $117.0 million of borrowings outstanding under our senior secured credit facility, which matures in March 2016. The weighted-average interest rate (including margin) under our senior
secured credit facility was 6.25% at March 26, 2012. KeyBank National Association, an affiliate of one of the underwriters, will receive a portion of the proceeds from this offering.
Accordingly, this offering is being made in compliance with FINRA Rule 5121. See "Underwriting—Conflicts of Interest."
A
$1.00 increase or decrease in the assumed initial public offering price of $13.00 per share, the midpoint of the range set forth on the cover page of this prospectus, would increase or
decrease the proceeds (after deducting estimated underwriting discounts and commissions and offering expenses payable by us) we receive from this offering by approximately $5.2 million,
assuming the number of shares offered by us, as set forth on the cover page of this prospectus, remains the same.
Pending
use of the net proceeds from this offering described above, we may invest the net proceeds in short- and intermediate-term interest-bearing obligations,
investment-grade instruments, certificates of deposit or direct or guaranteed obligations of the United States government.
By
establishing a public market for our common stock, this offering is also intended to facilitate our future access to public markets.
36
Table of Contents
DIVIDEND POLICY
On March 24, 2011, we paid a cash dividend in the aggregate amount of $80.0 million indirectly to J.H. Whitney VI
through JCS Holdings, LLC, our parent company. The cash dividend was paid as a return of capital to J.H. Whitney VI for its 2006 investment in us. At no other time have we paid
any dividends on our common stock since our incorporation. We currently intend to retain all available funds and any future earnings to fund the development and growth of our business and to repay
indebtedness, and therefore we do not anticipate paying any cash dividends in the foreseeable future. Additionally, our ability to pay dividends on our common stock is limited by restrictions on the
ability of our subsidiaries and us to pay dividends or make distributions to us under the terms of the agreements governing our indebtedness. Any future determination to pay dividends will be at the
discretion of our board of directors, subject to compliance with covenants in current and future agreements governing our indebtedness, and will depend upon our results of operations, financial
condition, capital requirements and other factors that our board of directors deems relevant.
37
Table of Contents
CAPITALIZATION
The following table sets forth our cash and cash equivalents and our capitalization as of March 26, 2012
on:
- •
- an actual basis;
- •
- on a pro forma basis to give effect to (i) a 19,178.226-for-1 stock split of our common stock, (ii) the sale
of 5,572,703 shares of our common stock in this offering by us at an assumed initial public offering price of $13.00 per share, the midpoint of the price range set forth on the cover of this
prospectus, after deducting estimated underwriting discounts and commissions and offering expenses payable by us, and (iii) the application of the net proceeds from this offering to us as
described under "Use of Proceeds."
You
should read the following table in conjunction with the sections entitled "Use of Proceeds," "Selected Historical Consolidated Financial and Operating Data," "Unaudited Pro Forma
Condensed Consolidated Financial Statements," "Management's Discussion and Analysis of Financial Condition and Results of Operations" and our consolidated financial statements and related notes
included elsewhere in this prospectus.
|
|
|
|
|
|
|
|
|
|
|
|
|
As of March 26, 2012 |
|
|
|
(unaudited)
|
|
|
|
Actual |
|
Pro Forma(1) |
|
|
|
(in thousands)
|
|
| |
Cash and cash equivalents |
|
$ |
7,736 |
|
$ |
31,178 |
|
| |
|
|
|
|
|
Long-term debt, including current portion: |
|
|
|
|
|
|
|
| |
Senior secured credit facility(2) |
|
$ |
117,000 |
|
$ |
76,431 |
|
| |
|
|
|
|
|
Stockholder's equity: |
|
|
|
|
|
|
|
| |
Common stock, $1.00 par value, 1,000 shares authorized, 1,000 shares issued and outstanding (actual); $0.01 par value,
500,000,000 authorized (pro forma); 24,750,929 shares issued and outstanding (pro forma) |
|
|
1 |
|
|
248 |
|
| |
Additional paid-in capital |
|
|
11,729 |
|
|
76,227 |
|
| |
Accumulated earnings |
|
|
12,363 |
|
|
11,113 |
|
| |
|
|
|
|
|
| |
|
Total stockholder's equity |
|
|
24,093 |
|
|
87,588 |
|
| |
|
|
|
|
|
| |
|
|
Total capitalization |
|
$ |
141,093 |
|
$ |
164,019 |
|
| |
|
|
|
|
|
- (1)
- A
$1.00 increase or decrease in the assumed initial public offering price of $13.00 per share, the midpoint of the price range set forth on the cover page
of this prospectus, would increase or decrease the amount of additional paid-in capital, total stockholders' equity and total capitalization by approximately $5.2 million, assuming
the number of shares offered by us, as set forth on the cover page of this prospectus, remains the same and after deducting underwriting discounts and commissions and estimated offering expenses
payable by us.
- (2)
- Our
senior secured credit facility consists of (i) a $120.0 million term loan facility due on March 24, 2016 and (ii) a
$25.0 million revolving credit facility due on March 24, 2016. As of March 26, 2012, we had no outstanding borrowings under our revolving credit facility. We intend to use a
portion of the net proceeds from this offering to prepay $40.6 million of our existing senior secured credit facility.
The
table above:
- •
- excludes, as of March 26, 2012, an aggregate of 1,980,074 shares of common stock reserved for issuance under
our equity compensation plan, which we plan to adopt in connection with this offering; and
- •
- assumes no exercise by the underwriters of their option to purchase up to an additional 865,384 shares from us.
38
Table of Contents
DILUTION
Dilution represents the difference between the amount per share paid by investors in this offering and the pro forma net tangible book
value per share of our common stock immediately after this offering. The net tangible book value per share represents our total tangible assets less our total liabilities, divided by the number of
shares of common stock outstanding. Our net tangible book value as of March 26, 2012 was $21.4 million, or $1.12 per share of common stock after giving effect to the stock split
and the termination of the management agreement but before giving effect to this offering.
After
giving effect to the sale of the 5,572,703 shares of common stock offered by us in this offering at a price of $13.00 per share, the midpoint of the price range set forth on
the cover page of this prospectus, after deducting estimated underwriting discounts and commissions and offering expenses payable by us, and the application of the net proceeds from this offering to
us as described under "Use of Proceeds," our pro forma net tangible book value as of March 26, 2012 would have been approximately $85.5 million, or $3.45 per share of common stock. This
represents an immediate increase in net tangible book value to our existing stockholders of $2.33 per share and an immediate dilution to new investors in this offering of $9.55 per share.
The
following table illustrates this per share dilution in net tangible book value to new investors.
|
|
|
|
|
|
|
|
|
Assumed initial public offering price per share |
|
|
|
|
$ |
13.00 |
|
| |
Net tangible book value per share as of March 26, 2012 |
|
$ |
1.12 |
|
|
|
|
| |
Increase per share attributable to new investors |
|
|
2.33 |
|
|
|
|
| |
|
|
|
|
|
|
Pro forma net tangible book value per share after this offering |
|
|
|
|
|
3.45 |
|
| |
|
|
|
|
|
|
Dilution per share to new investors |
|
|
|
|
$ |
9.55 |
|
| |
|
|
|
|
|
|
A
$1.00 increase (or decrease) in the assumed initial public offering price of $13.00 per share, the midpoint of the price range set forth on the cover page of this prospectus, would
increase (or decrease) our pro forma as adjusted net tangible book value by $5.2 million, or $0.23 per share, assuming the number of shares offered by us remains the same and after deducting
the estimated underwriting discounts and commissions and estimated offering expenses payable by us. The information discussed above is illustrative only and will adjust based on the actual initial
public offering price and other terms of this offering determined at pricing.
The
following table summarizes as of March 26, 2012, on an as adjusted basis, the number of shares of common stock purchased from us, the total consideration paid and the average
price per share paid by the existing stockholders (including J.H. Whitney VI and the equity grant recipients) and to be paid by new investors, based upon an assumed initial public
offering price of $13.00 per share, the midpoint of the price range set forth on the cover page of this prospectus, and before deducting estimated underwriting discounts and commissions and offering
expenses payable by us:
|
|
|
|
|
|
|
|
|
|
|
|
|
|
|
|
|
|
|
|
Shares Purchased |
|
Total Consideration |
|
|
|
|
|
Average Price
Per Share |
|
|
|
Number |
|
Percent |
|
Amount |
|
Percent |
|
Existing stockholders |
|
|
19,178,226 |
|
|
77.5 |
% |
$ |
23,483,288 |
|
|
24.5 |
% |
$ |
1.22 |
(1) |
New investors |
|
|
5,572,703 |
|
|
22.5 |
|
|
72,445,139 |
|
|
75.5 |
|
|
13.00 |
|
| |
|
|
|
|
|
|
|
|
|
|
|
|
| |
Total |
|
|
24,750,929 |
|
|
100 |
% |
$ |
95,928,427 |
|
|
100 |
% |
|
|
|
| |
|
|
|
|
|
|
|
|
|
|
|
|
- (1)
- Assuming
the termination of the management agreement had occurred on March 26, 2012, this represents our net book value which is calculated by
subtracting total liabilities from total assets as of March 26, 2012 divided by the number of shares owned by JCS Holdings, LLC after giving effect to the stock split.
39
Table of Contents
A
$1.00 increase (or decrease) in the assumed initial public offering price of $13.00 per share, the midpoint of the price range set forth on the cover page of this prospectus, would
increase (or decrease) the total consideration paid by new investors and the total average price per share by approximately $5.6 million and $1.00, respectively, assuming the number of shares
offered, as set forth on the cover page of this prospectus, remains the same.
Except
as otherwise indicated, the discussion and tables above assume no exercise of the underwriters' option to purchase additional shares. If the underwriters' option to purchase
additional shares is exercised in full, our existing stockholders would own approximately 74.9% and our new investors would own approximately 25.1% of the total number of shares of our common stock
outstanding after this offering.
The
discussion and tables above also exclude an aggregate of 1,980,074 shares of common stock reserved for issuance under our equity incentive plan that we intend to adopt in
connection with this offering.
40
Table of Contents
SELECTED HISTORICAL CONSOLIDATED FINANCIAL AND OPERATING DATA
The following table provides a summary of our historical and unaudited pro forma consolidated financial and operating data for the
periods and as of the dates indicated. We derived the statement of operations data presented below for the fiscal years ended December 28, 2009, January 3, 2011 and January 2,
2012 and selected balance sheet data presented below as of January 3, 2011 and January 2, 2012 from our audited consolidated financial statements included elsewhere in this prospectus.
The selected statement of operations data for the fiscal years ended December 31, 2007 and December 29, 2008 and the selected balance sheet data as of December 31, 2007,
December 29, 2008 and December 28, 2009 have been derived from audited consolidated financial statements not included in this prospectus. We derived the statement of operations data for
the twelve weeks ended March 28, 2011 and March 26, 2012 and the selected balance sheet data as of March 26, 2012 from our unaudited condensed consolidated financial statements included
elsewhere in this prospectus. The unaudited condensed consolidated financial statements have been prepared on the same basis as our audited consolidated financial statements and, in the opinion of our
management, reflect all adjustments, consisting of normal recurring adjustments, necessary for a fair presentation of these data. The results for any interim period are not necessarily indicative of
the results that may be expected for a full fiscal year. The unaudited pro forma consolidated financial data for the year ended January 2, 2012 and as of and for the twelve weeks ended
March 26, 2012 have been derived from our historical financial statements for such periods, which are included elsewhere in this prospectus, after giving effect to the transactions specified
under "Unaudited Pro Forma Condensed Consolidated Financial Statements."
Our
fiscal year ends on the Monday nearest to December 31 of each year. Fiscal years 2007, 2008, 2009 and 2011 were 52-week years ended on December 31, 2007,
December 29, 2008, December 28, 2009 and January 2, 2012, respectively, while fiscal year 2010 was a 53-week year ended on January 3, 2011. The first three
quarters of our fiscal year consist of 12 weeks and our fourth quarter consists of 16 weeks for 52-week fiscal years and 17 weeks for 53-week fiscal years.
The
historical results presented below are not necessarily indicative of the results to be expected for any future period. This information should be read in conjunction with "Risk
Factors," "Unaudited Pro Forma Condensed Consolidated Financial Statements," "Management's Discussion and Analysis of Financial Condition and Results of Operations," and our audited consolidated
financial statements and our unaudited condensed consolidated financial statements and each of their related notes included elsewhere in this prospectus.
41
Table of Contents
|
|
|
|
|
|
|
|
|
|
|
|
|
|
|
|
|
|
|
|
|
|
|
|
|
|
Fiscal Year Ended |
|
Twelve Weeks Ended |
|
|
|
December 31,
2007 |
|
December 29,
2008 |
|
December 28,
2009 |
|
January 3,
2011 |
|
January 2,
2012 |
|
March 28,
2011 |
|
March 26,
2012 |
|
|
|
(dollars in thousands, except per share data)
|
|
Statement of Operations Data: |
|
|
|
|
|
|
|
|
|
|
|
|
|
|
|
|
|
|
|
|
|
|
Revenues |
|
$ |
273,461 |
|
$ |
273,359 |
|
$ |
307,801 |
|
$ |
351,327 |
|
$ |
405,243 |
|
$ |
87,431 |
|
$ |
103,430 |
|
Restaurant operating costs |
|
|
|
|
|
|
|
|
|
|
|
|
|
|
|
|
|
|
|
|
|
|
| |
Cost of sales |
|
|
75,711 |
|
|
80,573 |
|
|
89,845 |
|
|
103,981 |
|
|
127,607 |
|
|
27,519 |
|
|
32,915 |
|
| |
Labor and benefits |
|
|
87,290 |
|
|
80,604 |
|
|
87,920 |
|
|
98,162 |
|
|
111,721 |
|
|
24,450 |
|
|
28,047 |
|
| |
Occupancy expenses |
|
|
14,970 |
|
|
21,610 |
|
|
25,243 |
|
|
27,440 |
|
|
30,244 |
|
|
6,510 |
|
|
7,281 |
|
| |
Other operating expenses |
|
|
59,516 |
|
|
57,210 |
|
|
58,140 |
|
|
63,963 |
|
|
71,696 |
|
|
15,077 |
|
|
18,206 |
|
General and administrative |
|
|
15,163 |
|
|
15,383 |
|
|
18,765 |
|
|
20,634 |
|
|
23,340 |
|
|
5,517 |
|
|
6,386 |
|
Depreciation and amortization |
|
|
14,018 |
|
|
13,898 |
|
|
12,733 |
|
|
13,445 |
|
|
16,063 |
|
|
3,349 |
|
|
3,938 |
|
Pre-opening costs |
|
|
25 |
|
|
779 |
|
|
1,323 |
|
|
3,844 |
|
|
3,989 |
|
|
805 |
|
|
1,242 |
|
Restaurant impairments and closures |
|
|
148 |
|
|
680 |
|
|
15 |
|
|
909 |
|
|
333 |
|
|
28 |
|
|
49 |
|
Loss on disposal of property and equipment |
|
|
— |
|
|
84 |
|
|
1,017 |
|
|
2,797 |
|
|
821 |
|
|
(4 |
) |
|
— |
|
| |
|
|
|
|
|
|
|
|
|
|
|
|
|
|
|
| |
Total costs and expenses |
|
|
266,841 |
|
|
270,821 |
|
|
295,001 |
|
|
335,175 |
|
|
385,814 |
|
|
83,251 |
|
|
98,064 |
|
| |
|
|
|
|
|
|
|
|
|
|
|
|
|
|
|
Income from operations |
|
|
6,620 |
|
|
2,538 |
|
|
12,800 |
|
|
16,152 |
|
|
19,429 |
|
|
4,180 |
|
|
5,366 |
|
Interest expense, net |
|
|
(10,510 |
) |
|
(5,659 |
) |
|
(3,867 |
) |
|
(3,831 |
) |
|
(9,215 |
) |
|
(2,558 |
) |
|
(1,997 |
) |
Gain on insurance settlements |
|
|
— |
|
|
— |
|
|
1,192 |
|
|
944 |
|
|
1,126 |
|
|
— |
|
|
— |
|
| |
|
|
|
|
|
|
|
|
|
|
|
|
|
|
|
(Loss) income before income taxes |
|
|
(3,890 |
) |
|
(3,121 |
) |
|
10,125 |
|
|
13,265 |
|
|
11,340 |
|
|
1,622 |
|
|
3,369 |
|
Income tax expense |
|
|
107 |
|
|
90 |
|
|
255 |
|
|
1,417 |
|
|
87 |
|
|
464 |
|
|
878 |
|
| |
|
|
|
|
|
|
|
|
|
|
|
|
|
|
|
Net (loss) income |
|
$ |
(3,997 |
) |
$ |
(3,211 |
) |
$ |
9,870 |
|
$ |
11,848 |
|
$ |
11,253 |
|
$ |
1,158 |
|
$ |
2,491 |
|
| |
|
|
|
|
|
|
|
|
|
|
|
|
|
|
|
Per Share Data: |
|
|
|
|
|
|
|
|
|
|
|
|
|
|
|
|
|
|
|
|
|
|
Net (loss) income per share: |
|
|
|
|
|
|
|
|
|
|
|
|
|
|
|
|
|
|
|
|
|
|
| |
Basic and diluted |
|
$ |
(3,997.00 |
) |
$ |
(3,211.00 |
) |
$ |
9,870.00 |
|
$ |
11,848.00 |
|
$ |
11,253.00 |
|
$ |
1,158.00 |
|
$ |
2,491.00 |
|
Weighted average shares outstanding: |
|
|
|
|
|
|
|
|
|
|
|
|
|
|
|
|
|
|
|
|
|
|
| |
Basic and diluted |
|
|
1,000 |
|
|
1,000 |
|
|
1,000 |
|
|
1,000 |
|
|
1,000 |
|
|
1,000 |
|
|
1,000 |
|
Pro Forma Statement of Operations Data(1): |
|
|
|
|
|
|
|
|
|
|
|
|
|
|
|
|
|
|
|
|
|
|
Pro forma net income |
|
|
|
|
|
|
|
|
|
|
$ |
13,913 |
|
|
|
|
|
|
|
$ |
3,013 |
|
Pro forma net income per share: |
|
|
|
|
|
|
|
|
|
|
|
|
|
|
|
|
|
|
|
|
|
|
| |
Basic and diluted |
|
|
|
|
|
|
|
|
|
|
$ |
0.61 |
|
|
|
|
|
|
|
$ |
0.13 |
|
Pro forma weighted average shares outstanding: |
|
|
|
|
|
|
|
|
|
|
|
|
|
|
|
|
|
|
|
|
|
|
| |
Basic and diluted |
|
|
|
|
|
|
|
|
|
|
|
22,870,760 |
|
|
|
|
|
|
|
|
22,870,760 |
|
Selected Other Data: |
|
|
|
|
|
|
|
|
|
|
|
|
|
|
|
|
|
|
|
|
|
|
Restaurants open at end of period |
|
|
119 |
|
|
116 |
|
|
119 |
|
|
126 |
|
|
135 |
|
|
129 |
|
|
138 |
|
Change in comparable restaurant sales(2) |
|
|
(10.2 |
)% |
|
1.9 |
% |
|
9.5 |
% |
|
4.9 |
% |
|
6.9 |
% |
|
9.4 |
% |
|
5.3 |
% |
Average weekly sales |
|
$ |
44 |
|
$ |
45 |
|
$ |
51 |
|
$ |
54 |
|
$ |
59 |
|
$ |
57 |
|
$ |
63 |
|
Average unit volumes |
|
$ |
2,294 |
|
$ |
2,354 |
|
$ |
2,599 |
|
$ |
2,810 |
|
$ |
2,970 |
|
$ |
673 |
|
$ |
714 |
|
Restaurant-level profit margin(3) |
|
|
13.0 |
% |
|
12.6 |
% |
|
15.5 |
% |
|
16.7 |
% |
|
16.0 |
% |
|
16.1 |
% |
|
16.6 |
% |
EBITDA(4) |
|
$ |
20,638 |
|
$ |
16,436 |
|
$ |
26,725 |
|
$ |
30,541 |
|
$ |
36,618 |
|
$ |
7,529 |
|
$ |
9,304 |
|
Adjusted EBITDA(4) |
|
$ |
23,325 |
|
$ |
20,314 |
|
$ |
30,276 |
|
$ |
39,910 |
|
$ |
44,105 |
|
$ |
9,111 |
|
$ |
11,116 |
|
Adjusted EBITDA margin(5) |
|
|
8.5 |
% |
|
7.4 |
% |
|
9.8 |
% |
|
11.4 |
% |
|
10.9 |
% |
|
10.4 |
% |
|
10.7 |
% |
Capital expenditures |
|
$ |
6,073 |
|
$ |
7,576 |
|
$ |
18,348 |
|
$ |
33,333 |
|
$ |
40,102 |
|
$ |
8,301 |
|
$ |
6,737 |
|
42
Table of Contents
|
|
|
|
|
|
|
|
|
|
|
|
|
|
|
|
|
|
|
|
|
|
December 31,
2007 |
|
December 29,
2008 |
|
December 28,
2009 |
|
January 3,
2011 |
|
January 2,
2012 |
|
March 26,
2012 |
|
|
|
(in thousands)
|
|
Selected Balance Sheet Data: |
|
|
|
|
|
|
|
|
|
|
|
|
|
|
|
|
|
|
|
Cash and cash equivalents |
|
$ |
5,257 |
|
$ |
5,110 |
|
$ |
4,976 |
|
$ |
12,572 |
|
$ |
3,725 |
|
$ |
7,736 |
|
Working capital (deficit) |
|
|
(13,781 |
) |
|
(2,739 |
) |
|
3,837 |
|
|
(2,029 |
) |
|
(16,135 |
) |
|
(22,396 |
) |
Total assets(6) |
|
|
206,587 |
|
|
126,318 |
|
|
130,854 |
|
|
157,163 |
|
|
180,207 |
|
|
193,076 |
|
Total debt |
|
|
114,722 |
|
|
35,381 |
|
|
34,988 |
|
|
34,833 |
|
|
117,757 |
|
|
117,000 |
|
Total stockholder's equity |
|
$ |
67,069 |
|
$ |
67,678 |
|
$ |
77,696 |
|
$ |
89,998 |
|
$ |
21,593 |
|
$ |
24,093 |
|
- (1)
- Derived
from our unaudited pro forma condensed consolidated statement of operations for the fiscal year ended January 2, 2012, which are included
elsewhere in this prospectus. See "Unaudited Pro Forma Condensed Consolidated Financial Statements."
- (2)
- Our
comparable restaurant base includes restaurants open for at least 104 weeks, or approximately 24 months. Change in comparable restaurant
sales represents the change in period-over-period sales for the comparable restaurant base.
- (3)
- Restaurant-level
profit margin represents revenues (x) less (i) licensing revenue not attributable to core restaurant operations, (ii) cost of
sales, (iii) labor and benefits, (iv) occupancy expenses, and (v) other operating expenses (y) plus non-cash rent, as defined in 4(a) below. Restaurant-level profit is
a supplemental measure of operating performance of our restaurants that does not represent and should not be considered as an alternative to net income or revenues as determined by U.S. generally
accepted accounting principles, or U.S. GAAP, and our calculation thereof may not be comparable to that reported by other companies. Restaurant-level profit has limitations as an analytical
tool, and you should not consider it in isolation, or as a substitute for analysis of our results as reported under U.S. GAAP. Management believes restaurant-level profit is an important
component of financial results because it is a widely used metric within the restaurant industry to evaluate restaurant-level productivity, efficiency and performance. Management uses restaurant-level
profit as a key metric to evaluate our financial performance compared with our competitors, to evaluate the profitability of incremental sales and to evaluate our performance across periods.
|
|
|
|
|
|
|
|
|
|
|
|
|
|
|
|
|
|
|
|
|
|
|
|
|
| |
|
|
Fiscal Year Ended |
|
Twelve Weeks Ended |
|
| |
|
|
December 31,
2007 |
|
December 29,
2008 |
|
December 28,
2009 |
|
January 3,
2011 |
|
January 2
2012 |
|
March 28,
2011 |
|
March 26,
2012 |
|
| |
|
|
(dollars in thousands)
|
|
| |
Revenues |
|
$ |
273,461 |
|
$ |
273,359 |
|
$ |
307,801 |
|
$ |
351,327 |
|
$ |
405,243 |
|
$ |
87,431 |
|
$ |
103,430 |
|
| |
Less: Licensing and other revenues |
|
|
(94 |
) |
|
(64 |
) |
|
(89 |
) |
|
(373 |
) |
|
(584 |
) |
|
(108 |
) |
|
(65 |
) |
| |
|
|
|
|
|
|
|
|
|
|
|
|
|
|
|
|
| |
Restaurant sales(A) |
|
$ |
273,367 |
|
$ |
273,295 |
|
$ |
307,712 |
|
$ |
350,954 |
|
$ |
404,659 |
|
$ |
87,323 |
|
$ |
103,365 |
|
| |
|
|
|
|
|
|
|
|
|
|
|
|
|
|
|
|
| |
Restaurant operating costs |
|
|
|
|
|
|
|
|
|
|
|
|
|
|
|
|
|
|
|
|
|
|
| |
|
Cost of sales |
|
|
75,711 |
|
|
80,573 |
|
|
89,845 |
|
|
103,981 |
|
|
127,607 |
|
|
27,519 |
|
|
32,915 |
|
| |
|
Labor and benefits |
|
|
87,290 |
|
|
80,604 |
|
|
87,920 |
|
|
98,162 |
|
|
111,721 |
|
|
24,450 |
|
|
28,047 |
|
| |
|
Occupancy expenses |
|
|
14,970 |
|
|
21,610 |
|
|
25,243 |
|
|
27,440 |
|
|
30,244 |
|
|
6,510 |
|
|
7,281 |
|
| |
|
Other operating expenses |
|
|
59,516 |
|
|
57,210 |
|
|
58,140 |
|
|
63,963 |
|
|
71,696 |
|
|
15,077 |
|
|
18,206 |
|
| |
|
Deferred rent |
|
|
(300 |
) |
|
(1,017 |
) |
|
(1,162 |
) |
|
(1,322 |
) |
|
(1,342 |
) |
|
(296 |
) |
|
(196 |
) |
| |
|
|
|
|
|
|
|
|
|
|
|
|
|
|
|
|
| |
Restaurant-level profit(B) |
|
$ |
36,180 |
|
$ |
34,315 |
|
$ |
47,726 |
|
$ |
58,730 |
|
$ |
64,733 |
|
$ |
14,063 |
|
$ |
17,112 |
|
| |
|
|
|
|
|
|
|
|
|
|
|
|
|
|
|
|
| |
Restaurant-level profit margin(B÷A) |
|
|
13.2 |
% |
|
12.6 |
% |
|
15.5 |
% |
|
16.7 |
% |
|
16.0 |
% |
|
16.1 |
% |
|
16.6 |
% |
- (4)
- EBITDA
represents earnings before interest, taxes, depreciation and amortization. Adjusted EBITDA further adjusts EBITDA to reflect the additions and
eliminations described in the table below. EBITDA and Adjusted EBITDA are supplemental measures of operating performance that do not represent and should not be considered as alternatives to net
income or cash flow from operations, as determined by U.S. GAAP, and our calculation thereof may not be comparable to that reported by other companies. EBITDA and Adjusted EBITDA have
limitations as analytical tools, and you should not consider them in isolation, or as a substitute for analysis of our results as reported under U.S. GAAP. Some of the limitations
are:
- •
- EBITDA and Adjusted EBITDA do not reflect our cash expenditures, or future
requirements for capital expenditures or contractual commitments;
- •
- EBITDA and Adjusted EBITDA do not reflect changes in, or cash requirements for, our
working capital needs;
43
Table of Contents
- •
- EBITDA and Adjusted EBITDA do not reflect the significant interest expense, or the
cash requirements necessary to service interest or principal payments on our debt;
- •
- EBITDA and Adjusted EBITDA do not reflect our tax expense or the cash requirements
to pay our taxes;
- •
- although depreciation and amortization are non-cash charges, the assets
being depreciated and amortized will often have to be replaced in the future, EBITDA and Adjusted EBITDA do not reflect any cash requirements for such replacements; and
- •
- other companies in the restaurant industry may calculate EBITDA and Adjusted EBITDA
differently than we do, limiting their usefulness as comparative measures.
- Because
of these limitations, EBITDA and Adjusted EBITDA should not be considered as measures of discretionary cash available to us to invest in
the growth of our business. We compensate for these limitations by relying primarily on our U.S. GAAP results and using EBITDA and Adjusted EBITDA only supplementally. We further believe that
our presentation of these U.S. GAAP and non-GAAP financial measurements provide information that is useful to analysts and investors because they are important indicators of the
strength of our operations and the performance of our core business.
- As
noted in the table below, Adjusted EBITDA includes adjustments for restaurant impairments and closures, gains and losses on disposal of
property and equipment, gains on insurance settlements and pre-opening costs, among other items. It is reasonable to expect that these items will occur in future periods. However, we believe these
adjustments are appropriate because the amounts recognized can vary significantly from period to period, do not directly relate to the ongoing operations of our restaurants and complicate comparisons
of our internal operating results and operating results of other restaurant companies over time. In addition, Adjusted EBITDA includes adjustments for other items that we do not expect to regularly
record following this offering, such as sponsor management fees. Each of the normal recurring adjustments and other adjustments described in this paragraph and in the reconciliation table below help
management with a measure of our core operating performance over time by removing items that are not related to day-to-day restaurant-level operations.
- Management
and our principal stockholder use EBITDA and Adjusted EBITDA:
- •
- as a measurement of operating performance because they assist us in comparing the
operating performance of our restaurants on a consistent basis, as both remove the impact of items not directly resulting from our core operations;
- •
- for planning purposes, including the preparation of our internal annual operating
budget and financial projections;
- •
- to evaluate the performance and effectiveness of our operational strategies;
- •
- to evaluate our capacity to fund capital expenditures and expand our business; and
- •
- to calculate incentive compensation payments for our employees, including assessing
performance under our annual incentive compensation plan.
- In
addition, this measurement is used by investors as a supplemental measure to evaluate the overall operating performance of companies in our
industry. Management believes that investors' understanding of our performance is enhanced by including this non-GAAP financial measure as a reasonable basis for comparing our ongoing
results of operations. Many investors are interested in understanding the performance of our business by comparing our results from ongoing operations from one period to the next and would ordinarily
add back events that are not part of normal day-to-day operations of our business. By providing this non-GAAP financial measure, together with reconciliations, we
believe we are enhancing investors' understanding of our business and our results of operations, as well as assisting investors in evaluating how well we are executing strategic initiatives.
- We
also present Adjusted EBITDA because it is a measure which is used in calculating financial ratios in material debt covenants in our senior
secured credit facility. Some of the adjustments included in Adjusted EBITDA are subject to certain limitations under our credit facility for purposes of calculating our debt covenants. For the fiscal
quarter ended March 26, 2012, we are required to maintain a fixed charge coverage ratio (ratio of free cash flow to fixed charges) of 1.40:1 and an effective leverage ratio (ratio of adjusted
debt to Adjusted EBITDA plus cash rent expense) of less than 5.40:1. As of March 26, 2012, we are in compliance with these covenants. As of March 26, 2012, we had $117.0 million
of outstanding borrowings under the term loan and the ability to borrow up to an additional $23.2 million under the revolving credit facility. Failure to comply with our material debt covenants
could cause an acceleration of outstanding amounts under the term loan and restrict us from borrowing amounts under the revolving credit facility to fund our future liquidity requirements. We believe
that inclusion of supplementary
44
Table of Contents
adjustments
to EBITDA applied in presenting Adjusted EBITDA is appropriate to provide additional information to investors about how the covenants in those agreements operate. The material covenants in
our senior secured credit facility are discussed further in "Management's Discussion and Analysis of Financial Condition and Results of Operations—Liquidity and Capital Resources."
- Adjusted
EBITDA is calculated as follows:
|
|
|
|
|
|
|
|
|
|
|
|
|
|
|
|
|
|
|
|
|
|
|
|
| |
|
|
Fiscal Year Ended |
|
Twelve Weeks Ended |
|
| |
|
|
December 31,
2007 |
|
December 29,
2008 |
|
December 28,
2009 |
|
January 3,
2011 |
|
Janaury 2,
2012 |
|
March 28,
2011 |
|
March 26,
2012 |
|
| |
|
|
(in thousands)
|
|
| |
Net (loss) income |
|
$ |
(3,997 |
) |
$ |
(3,211 |
) |
$ |
9,870 |
|
$ |
11,848 |
|
$ |
11,253 |
|
$ |
1,158 |
|
$ |
2,491 |
|
| |
Income tax expense (benefit) |
|
|
107 |
|
|
90 |
|
|
255 |
|
|
1,417 |
|
|
87 |
|
|
464 |
|
|
878 |
|
| |
Interest expense, net |
|
|
10,510 |
|
|
5,659 |
|
|
3,867 |
|
|
3,831 |
|
|
9,215 |
|
|
2,558 |
|
|
1,997 |
|
| |
Depreciation and amortization |
|
|
14,018 |
|
|
13,898 |
|
|
12,733 |
|
|
13,445 |
|
|
16,063 |
|
|
3,349 |
|
|
3,938 |
|
| |
|
|
|
|
|
|
|
|
|
|
|
|
|
|
|
|
| |
EBITDA |
|
$ |
20,638 |
|
$ |
16,436 |
|
$ |
26,725 |
|
$ |
30,541 |
|
$ |
36,618 |
|
$ |
7,529 |
|
$ |
9,304 |
|
| |
|
|
|
|
|
|
|
|
|
|
|
|
|
|
|
|
| |
Adjustments: |
|
|
|
|
|
|
|
|
|
|
|
|
|
|
|
|
|
|
|
|
|
|
| |
Deferred rent(a) |
|
|
300 |
|
|
1,017 |
|
|
1,162 |
|
|
1,322 |
|
|
1,342 |
|
|
296 |
|
|
196 |
|
| |
Restaurant impairments and closures(b) |
|
|
148 |
|
|
680 |
|
|
15 |
|
|
909 |
|
|
333 |
|
|
28 |
|
|
49 |
|
| |
Loss on disposal of property and equipment(c) |
|
|
— |
|
|
84 |
|
|
1,017 |
|
|
2,797 |
|
|
821 |
|
|
(4 |
) |
|
— |
|
| |
Sponsor management fees(d) |
|
|
529 |
|
|
1,112 |
|
|
1,120 |
|
|
1,139 |
|
|
1,188 |
|
|
272 |
|
|
272 |
|
| |
Gain on insurance settlements(e) |
|
|
— |
|
|
— |
|
|
(1,192 |
) |
|
(944 |
) |
|
(1,126 |
) |
|
— |
|
|
— |
|
| |
Pre-opening costs(f) |
|
|
25 |
|
|
779 |
|
|
1,323 |
|
|
3,844 |
|
|
3,989 |
|
|
805 |
|
|
1,242 |
|
| |
Other expenses(g) |
|
|
1,685 |
|
|
206 |
|
|
106 |
|
|
302 |
|
|
940 |
|
|
185 |
|
|
53 |
|
| |
|
|
|
|
|
|
|
|
|
|
|
|
|
|
|
|
| |
Adjusted EBITDA |
|
$ |
23,325 |
|
$ |
20,314 |
|
$ |
30,276 |
|
$ |
39,910 |
|
$ |
44,105 |
|
$ |
9,111 |
|
$ |
11,116 |
|
| |
|
|
|
|
|
|
|
|
|
|
|
|
|
|
|
|
- (a)
- Deferred
rent represents the non-cash rent expense calculated as the difference in U.S. GAAP rent expense in any year and amounts payable
in cash under the leases during the year. In measuring our operational performance, we focus on our cash rent payments. See Note 2 to our audited consolidated financial statements for
additional details.
- (b)
- Impairment
charges were recorded in connection with the determination that the carrying value of certain of our restaurants exceeded their estimated fair
value. Also consists of expenses incurred following the closure of restaurants. See Notes 2 and 3 to our audited consolidated financial statements for additional details.
- (c)
- Loss
(gain) on disposal of property and equipment represents the net book value of property and equipment less proceeds received, if applicable, on assets
abandoned or sold.
- (d)
- Sponsor
management fees consist of fees and expenses paid to J.H. Whitney under the management services agreement, and compensation and expenses paid
to certain members of the management committee of our parent company, JCS Holdings, LLC. We will terminate this agreement in connection with the completion of this offering. See "Certain
Relationships and Related Party Transactions."
- (e)
- Gain
on insurance settlements consists of proceeds in excess of the net book value of assets lost and related costs from property insurance claims at
restaurants temporarily closed due to hurricane damage, flooding and/or foundational issues.
- (f)
- Pre-opening
costs include expenses directly associated with the opening of new restaurants and are incurred prior to the opening of a new
restaurant. See Note 2 to our audited consolidated financial statements for additional details.
- (g)
- Other
expenses consists of costs related to abandoned new restaurant developments, fees payable to the agent under historic credit facilities, certain
transitional general and administrative expenses, and expenses related to the modification of a sale-leaseback transaction.
- (5)
- Adjusted
EBITDA margin is defined as the ratio of Adjusted EBITDA to total revenues. We present Adjusted EBITDA margin because it is used by management as a
performance measurement of Adjusted EBITDA generated from total revenues. See footnote 4 above for a discussion of Adjusted EBITDA as a non-GAAP measurement and a reconciliation of
net income to EBITDA and Adjusted EBITDA.
- (6)
- In
March 2007, property and improvements for 29 restaurants were sold in a sale-leaseback financing transaction accounted for as capital leases. In
April 2008, all these leases were modified and were subsequently treated as operating leases. At that time $79.0 million in property and improvement and $78.2 million in capital lease
obligations were removed from the consolidated balance sheet.
45
Table of Contents
UNAUDITED PRO FORMA CONDENSED CONSOLIDATED FINANCIAL STATEMENTS
The unaudited pro forma condensed consolidated financial statements as of and for the twelve weeks ended March 26, 2012, and for
the fiscal year ended January 2, 2012 have been derived from our historical consolidated financial statements included elsewhere in this prospectus.
The
unaudited pro forma condensed consolidated balance sheet as of March 26, 2012 gives effect to (i) the termination of our management agreement with J.H. Whitney
in connection with this public offering, (ii) the 19,178.226-for-1 stock split of our common stock to take effect immediately prior to the completion of this public offering and (iii) the
issuance of common stock in this public offering and the application of the net proceeds therefrom as described in "Use of Proceeds," as if each had occurred on March 26, 2012. No adjustments
have been made related to the refinancing of our senior credit facility described below, as these transactions are already reflected in the March 26, 2012 unaudited condensed consolidated
balance sheet.
The
unaudited pro forma condensed consolidated statements of operations for the fiscal year ended January 2, 2012 and the twelve weeks ended March 26, 2012 give effect to
(i) the termination of our management agreement with J.H. Whitney in connection with this public offering, (ii) the 19,178.226-for-1 stock split of our common stock to take effect
immediately prior to the completion of this public offering and (iii) the issuance of common stock in this public offering and the application of the net proceeds therefrom as described in "Use
of Proceeds," as if each had occurred on the first day of fiscal year 2011. The unaudited pro forma condensed consolidated statement of operations for the fiscal year ended January 2, 2012 also
gives effect to adjustments for the March 2011 refinancing of our senior secured credit facility, which proceeds were used to repay the prior credit facility and pay an $80.0 million dividend
to our parent company, as if it occurred on the first day of fiscal year 2011.
The
unaudited pro forma condensed consolidated financial statements are presented for informational purposes only and do not purport to represent our actual financial condition or
results of operations if such transactions had been completed as of the dates or for the periods indicated above or that may be achieved as of any future date or for any future period. The unaudited
pro forma condensed consolidated financial statements should be read in conjunction with the accompanying notes, "Management's Discussion and Analysis of Financial Condition and Results of
Operations," and our historical consolidated financial statements and accompanying notes included elsewhere in this prospectus.
46
Table of Contents
Unaudited Pro Forma Condensed Consolidated Balance Sheet
March 26, 2012
(in thousands)
|
|
|
|
|
|
|
|
|
|
|
|
|
|
|
|
|
|
|
|
|
Historical
As Reported
March 26, 2012 |
|
Termination of
Management
Agreement |
|
Pro Forma for
Other
Transactions March 26, 2012 |
|
Adjustments
Related to
Offering |
|
Pro Forma
March 26, 2012 |
|
ASSETS |
|
|
|
|
|
|
|
|
|
|
|
|
|
|
|
|
Current assets |
|
|
|
|
|
|
|
|
|
|
|
|
|
|
|
|
| |
Cash and cash equivalents |
|
$ |
7,736 |
|
|
(1,000 |
)(1) |
$ |
6,736 |
|
|
72,445 |
(5) |
$ |
31,178 |
|
|
|
|
|
|
|
|
|
|
|
|
|
(7,131 |
)(6) |
|
|
|
|
|
|
|
|
|
|
|
|
|
|
|
(40,569 |
)(7) |
|
|
|
|
|
|
|
|
|
|
|
|
|
|
|
(303 |
)(10) |
|
|
|
| |
Accounts receivable |
|
|
6,948 |
|
|
|
|
|
6,948 |
|
|
|
|
|
6,948 |
|
| |
Inventories |
|
|
5,251 |
|
|
|
|
|
5,251 |
|
|
|
|
|
5,251 |
|
| |
Deferred tax assets |
|
|
1,053 |
|
|
|
|
|
1,053 |
|
|
|
|
|
1,053 |
|
| |
Prepaid rent and other current assets |
|
|
4,774 |
|
|
|
|
|
4,774 |
|
|
|
|
|
4,774 |
|
| |
|
|
|
|
|
|
|
|
|
|
|
| |
|
Total current assets |
|
|
25,762 |
|
|
(1,000 |
) |
|
24,762 |
|
|
24,442 |
|
|
49,204 |
|
Property and equipment, net |
|
|
157,067 |
|
|
|
|
|
157,067 |
|
|
|
|
|
157,067 |
|
Intangible assets, net |
|
|
2,096 |
|
|
|
|
|
2,096 |
|
|
|
|
|
2,096 |
|
Deferred charges, net |
|
|
4,364 |
|
|
|
|
|
4,364 |
|
|
(1,050 |
)(8) |
|
3,617 |
|
|
|
|
|
|
|
|
|
|
|
|
|
303 |
(10) |
|
|
|
Deferred tax assets |
|
|
664 |
|
|
|
|
|
664 |
|
|
|
|
|
664 |
|
Other assets |
|
|
3,123 |
|
|
|
|
|
3,123 |
|
|
(1,480 |
)(6) |
|
1,643 |
|
| |
|
|
|
|
|
|
|
|
|
|
|
| |
|
Total assets |
|
$ |
193,076 |
|
$ |
(1,000 |
) |
$ |
192,076 |
|
$ |
22,215 |
|
$ |
214,291 |
|
| |
|
|
|
|
|
|
|
|
|
|
|
LIABILITIES AND STOCKHOLDER'S EQUITY |
|
|
|
|
|
|
|
|
|
|
|
|
|
|
|
|
Current liabilities |
|
|
|
|
|
|
|
|
|
|
|
|
|
|
|
|
| |
Accounts payable |
|
$ |
21,887 |
|
|
|
|
$ |
21,887 |
|
|
(911 |
)(6) |
$ |
20,976 |
|
| |
Accrued liabilities |
|
|
23,271 |
|
|
(390 |
)(2) |
|
22,881 |
|
|
(410 |
)(9) |
|
22,471 |
|
| |
Current portion of debt obligations |
|
|
3,000 |
|
|
|
|
|
3,000 |
|
|
(3,000 |
)(7) |
|
— |
|
| |
|
|
|
|
|
|
|
|
|
|
|
| |
|
Total current liabilities |
|
|
48,158 |
|
|
(390 |
) |
|
47,768 |
|
|
(4,321 |
) |
|
43,447 |
|
Long-term debt obligations |
|
|
114,000 |
|
|
|
|
|
114,000 |
|
|
(37,569 |
)(7) |
|
76,431 |
|
Deferred rent |
|
|
6,006 |
|
|
|
|
|
6,006 |
|
|
|
|
|
6,006 |
|
Other long-term liabilities |
|
|
819 |
|
|
|
|
|
819 |
|
|
|
|
|
819 |
|
| |
|
|
|
|
|
|
|
|
|
|
|
| |
|
Total liabilities |
|
|
168,983 |
|
|
(390 |
) |
|
168,593 |
|
|
(41,890 |
) |
|
126,703 |
|
| |
|
|
|
|
|
|
|
|
|
|
|
Stockholder's equity |
|
|
|
|
|
|
|
|
|
|
|
|
|
|
|
|
| |
Common stock |
|
|
1 |
|
|
|
|
|
1 |
|
|
191 |
(4) |
|
248 |
|
|
|
|
|
|
|
|
|
|
|
|
|
56 |
(5) |
|
|
|
| |
Additional paid-in capital |
|
|
11,729 |
|
|
|
|
|
11,729 |
|
|
(191 |
)(4) |
|
76,227 |
|
|
|
|
|
|
|
|
|
|
|
|
|
72,389 |
(5) |
|
|
|
|
|
|
|
|
|
|
|
|
|
|
|
(7,700 |
)(6) |
|
|
|
| |
Accumulated earnings |
|
|
12,363 |
|
|
(610 |
)(3) |
|
11,753 |
|
|
(1,050 |
)(8) |
|
11,113 |
|
|
|
|
|
|
|
|
|
|
|
|
|
410 |
(9) |
|
|
|
| |
|
|
|
|
|
|
|
|
|
|
|
| |
|
Total stockholder's equity |
|
|
24,093 |
|
|
(610 |
) |
|
23,483 |
|
|
64,105 |
|
|
87,588 |
|
| |
|
|
|
|
|
|
|
|
|
|
|
| |
|
Total liabilities and stockholder's equity |
|
$ |
193,076 |
|
$ |
(1,000 |
) |
$ |
192,076 |
|
$ |
22,215 |
|
$ |
214,291 |
|
| |
|
|
|
|
|
|
|
|
|
|
|
Termination of Management Agreement
- (1)
- To
reflect cash that will be paid to terminate the management agreement between our parent, JCS Holdings, LLC, and J.H. Whitney of
approximately $1.0 million in connection with this public offering.
47
Table of Contents
- (2)
- To
adjust income taxes payable to reflect a tax benefit of $0.4 million related to the payment of the termination fees for the management agreement
with J.H. Whitney, calculated at an estimated statutory tax rate of 39%.
- (3)
- To
reflect the expense for the $1.0 million termination fee related to the management agreement with J.H. Whitney, net of a tax benefit of
$0.4 million calculated using an estimated statutory tax rate of 39%.
Adjustments Related to Offering
- (4)
- To
reflect a 19,178.226-for-1 stock split and reduction of par value of our common stock from $1.00 per share to $0.01 per share to take effect immediately
prior to the completion of this public offering.
- (5)
- To
reflect cash proceeds from the issuance of 5,572,703 shares related to this offering assuming an initial public offering price of $13.00 per
share, the midpoint of the range of potential offering price per share. We will not receive any proceeds from the sale of 196,528 shares sold by the selling stockholder.
- (6)
- To
reflect underwriting discounts, commissions and other expenses related to this offering. As of March 26, 2012, we had approximately
$1.5 million of these costs capitalized in other assets of which $0.9 million are unpaid and included in accounts payable.
- (7)
- To
reflect the prepayment of $40.6 million of our term loan as required by the amendment to our senior secured credit facility as discussed in
Note 6 of the unaudited condensed consolidated financial statements included elsewhere in this prospectus.
- (8)
- To
reflect the writeoff of a portion of the unamortized debt issuance costs in connection with the prepayment of debt.
- (9)
- To
adjust income taxes payable to reflect the recording of a tax benefit related to the writeoff of unamortized debt issuance costs, as mentioned in
note 7 above, calculated at an estimated statutory tax rate of 39%.
- (10)
- To
reflect capitalized debt issuance costs associated with the amendment of our senior secured credit facility, as discussed in Note 6 of the
unaudited condensed consolidated financial statements included elsewhere in this prospectus.
48
Table of Contents
Unaudited Pro Forma Condensed Consolidated Statements of Operations
Fiscal Year Ended January 2, 2012
(dollars in thousands, except per share amounts)
|
|
|
|
|
|
|
|
|
|
|
|
|
|
|
|
|
|
|
|
|
|
|
|
|
|
Adjustments for Other Transactions |
|
|
|
|
|
|
|
|
|
Historical
As Reported
Fiscal Year
Ended
January 2,
2012 |
|
Debt
Refinancing |
|
Termination of
Management
Agreement |
|
Pro Forma
for Other
Transactions
Fiscal Year
Ended
January 2,
2012 |
|
Adjustments
Related to
Offering |
|
Pro Forma
Fiscal Year
Ended
January 2,
2012 |
|
Revenues |
|
$ |
405,243 |
|
|
|
|
|
|
|
$ |
405,243 |
|
|
|
|
$ |
405,243 |
|
Cost and expenses |
|
|
|
|
|
|
|
|
|
|
|
|
|
|
|
|
|
|
|
| |
Restaurant operating costs |
|
|
|
|
|
|
|
|
|
|
|
|
|
|
|
|
|
|
|
| |
|
Cost of sales |
|
|
127,607 |
|
|
|
|
|
|
|
|
127,607 |
|
|
|
|
|
127,607 |
|
| |
|
Labor and benefits |
|
|
111,721 |
|
|
|
|
|
|
|
|
111,721 |
|
|
|
|
|
111,721 |
|
| |
|
Occupancy expenses |
|
|
30,244 |
|
|
|
|
|
|
|
|
30,244 |
|
|
|
|
|
30,244 |
|
| |
|
Other operating expenses |
|
|
71,696 |
|
|
|
|
|
|
|
|
71,696 |
|
|
|
|
|
71,696 |
|
| |
General and administrative |
|
|
23,340 |
|
|
|
|
|
(1,000 |
)(3) |
|
22,340 |
|
|
|
|
|
22,340 |
|
| |
Depreciation and amortization |
|
|
16,063 |
|
|
|
|
|
|
|
|
16,063 |
|
|
|
|
|
16,063 |
|
| |
Pre-opening costs |
|
|
3,989 |
|
|
|
|
|
|
|
|
3,989 |
|
|
|
|
|
3,989 |
|
| |
Restaurant impairments and closures |
|
|
333 |
|
|
|
|
|
|
|
|
333 |
|
|
|
|
|
333 |
|
| |
Loss on disposal of property and equipment |
|
|
821 |
|
|
|
|
|
|
|
|
821 |
|
|
|
|
|
821 |
|
| |
|
|
|
|
|
|
|
|
|
|
|
|
|
| |
|
Total costs and expenses |
|
|
385,814 |
|
|
— |
|
|
(1,000 |
) |
|
384,814 |
|
|
— |
|
|
384,814 |
|
| |
|
|
|
|
|
|
|
|
|
|
|
|
|
Income from operations |
|
|
19,429 |
|
|
— |
|
|
1,000 |
|
|
20,429 |
|
|
— |
|
|
20,429 |
|
Interest expense, net |
|
|
(9,215 |
) |
|
584 |
(1) |
|
|
|
|
(8,631 |
) |
|
2,776 |
(4) |
|
(5,855 |
) |
Gain on insurance settlements |
|
|
1,126 |
|
|
|
|
|
|
|
|
1,126 |
|
|
|
|
|
1,126 |
|
| |
|
|
|
|
|
|
|
|
|
|
|
|
|
Income before income taxes |
|
|
11,340 |
|
|
584 |
|
|
1,000 |
|
|
12,924 |
|
|
2,776 |
|
|
15,700 |
|
Income tax expense |
|
|
87 |
|
|
228 |
(2) |
|
390 |
(2) |
|
705 |
|
|
1,082 |
(2) |
|
1,787 |
|
| |
|
|
|
|
|
|
|
|
|
|
|
|
|
Net income |
|
$ |
11,253 |
|
$ |
356 |
|
$ |
610 |
|
$ |
12,219 |
|
$ |
1,694 |
|
$ |
13,913 |
|
| |
|
|
|
|
|
|
|
|
|
|
|
|
|
Net income per share: |
|
|
|
|
|
|
|
|
|
|
|
|
|
|
|
|
|
|
|
| |
Basic and diluted |
|
$ |
11,253.00 |
|
|
|
|
|
|
|
|
|
|
|
|
|
$ |
0.61 |
(5) |
Weighted average shares outstanding: |
|
|
|
|
|
|
|
|
|
|
|
|
|
|
|
|
|
|
|
| |
Basic and diluted |
|
|
1,000 |
|
|
|
|
|
|
|
|
|
|
|
|
|
|
22,870,760 |
(5) |
Debt Refinancing
- (1)
- The
adjustments related to the debt refinancing reflect the impact on interest expense as if the March 2011 transactions had occurred on the first day of
fiscal year 2011 and carried forward through January 2, 2012. Proceeds of $120.0 million from the new senior credit facility were used to repay the prior credit facility and pay an
$80.0 million dividend to our parent company. Pro forma adjustments were as follows (in thousands):
|
|
|
|
|
|
Increase in interest expense for new credit facility |
|
$ |
1,665 |
|
Elimination of historical interest expense on prior credit facility and interest rate swap |
|
|
(571 |
) |
Elimination of historical expense for the termination of the interest rate swap |
|
|
(427 |
) |
Elimination of historical writeoff of unamortized debt issuance costs on prior credit facility |
|
|
(1,378 |
) |
Elimination of historical amortization on debt issuance costs on prior credit facility |
|
|
(126 |
) |
Increase in amortization on debt issuance costs on new credit facility |
|
|
253 |
|
| |
|
|
|
| |
Net pro forma adjustment to interest expense |
|
$ |
(584 |
) |
| |
|
|
|
- The
assumed interest rate on the interest expense of the new senior secured credit facility is 6.25% (LIBOR floor of 1.5% plus 4.75%), our
weighted average interest rate in fiscal year 2011. The debt issuance costs related to the new senior secured credit facility are assumed to be amortized over the term of the debt agreement using the
effective interest rate method.
- (2)
- To
reflect the tax effect of the pro forma adjustments at an estimated statutory rate of 39%.
49
Table of Contents
Termination of Management Agreement
- (3)
- To reflect a reduction of $1.0 million of annual management fees paid to J.H. Whitney. The management
agreement will terminate upon completion of the offering. We expect to incur a nonrecurring expense of approximately $1.0 million within general and administrative expenses and a corresponding
tax benefit of $0.4 million related to the termination of the management agreement. As they are nonrecurring, the termination fee and related tax effects are not included in the pro forma
condensed consolidated statement of operations.
Adjustments Related to the Offering
- (4)
- Had the offering occurred on the first day of fiscal year 2011, we would have used $40.6 million of the
proceeds to prepay a portion of our term loan as required by the amendment to our senior secured credit facility, as discussed in Note 6 of the unaudited condensed consolidated financial
statements included elsewhere in this prospectus. The adjustments related to the offering reflect the reduction of interest expense resulting from this pro forma prepayment and are as follows (in
thousands):
|
|
|
|
|
|
Reduction in interest expense from lower balance outstanding |
|
$ |
2,543 |
|
Reduction in amortization of debt issuance costs due to prepayment amount |
|
|
233 |
|
| |
|
|
|
| |
Net pro forma adjustment to interest expense |
|
$ |
2,776 |
|
| |
|
|
|
- (5)
- Reflects
adjustments to outstanding common stock as if the initial public offering was completed at the beginning of fiscal year 2011. Immediately after the
completion of this public offering, JCS Holdings, LLC, our parent company, will distribute substantially all of the shares of our common stock then held by it and/or the cash proceeds received
in this public offering to the holders of its Series A preferred units and its vested common units. JCS Holdings, LLC will thereafter continue to hold shares equal to less than one
percent of our outstanding common stock for the benefit of certain of our officers and directors who will continue to hold unvested common units in JCS Holdings, LLC upon consummation of this
offering.
Basic
net income per share is computed on the basis of the weighted average number of common shares that were outstanding during the period. The pro forma basic and diluted net income per share
calculations include 3,692,534 shares to be sold in the public offering as the proceeds received from the sale of these shares will be used to prepay a portion of our term loan and pay fees and
expenses related to the offering. The remaining 1,880,169 shares to be sold in the public offering are not included in the pro forma basic and diluted net income per share calculations as the
proceeds received from the sale of these shares will be used for general corporate purposes. The following table sets forth the computation of pro forma basic and diluted net income per share based on
an offering price of $13.00 per share, the midpoint of the price range set forth on the cover page of this prospectus (in thousands, except per share amount):
|
|
|
|
|
|
Pro forma net income |
|
$ |
13,913 |
|
Pro forma weighted average number of shares—basic and diluted: |
|
|
|
|
| |
Weighted average number of existing shares |
|
|
19,178 |
|
| |
Shares issued in this offering |
|
|
3,693 |
|
| |
|
|
|
| |
Pro forma weighted average number of common shares |
|
|
22,871 |
|
| |
|
|
|
Pro forma net income per share—basic and diluted |
|
$ |
0.61 |
|
50
Table of Contents
Unaudited Pro Forma Condensed Consolidated Statements of Operations
For the Twelve Weeks Ended March 26, 2012
(dollars in thousands, except per share amounts)
|
|
|
|
|
|
|
|
|
|
|
|
|
|
|
|
|
|
|
|
|
Historical
As Reported
Twelve Weeks
Ended
March 26,
2012 |
|
Termination of
Management
Agreement |
|
Pro Forma
for Other
Transactions
Twelve Weeks
Ended
March 26,
2012 |
|
Adjustments
Related to
Offering |
|
Pro Forma
Twelve Weeks
Ended
March 26,
2012 |
|
Revenues |
|
$ |
103,430 |
|
|
|
|
$ |
103,430 |
|
|
|
|
$ |
103,430 |
|
Cost and expenses |
|
|
|
|
|
|
|
|
|
|
|
|
|
|
|
|
| |
Restaurant operating costs |
|
|
|
|
|
|
|
|
|
|
|
|
|
|
|
|
| |
|
Cost of sales |
|
|
32,915 |
|
|
|
|
|
32,915 |
|
|
|
|
|
32,915 |
|
| |
|
Labor and benefits |
|
|
28,047 |
|
|
|
|
|
28,047 |
|
|
|
|
|
28,047 |
|
| |
|
Occupancy expenses |
|
|
7,281 |
|
|
|
|
|
7,281 |
|
|
|
|
|
7,281 |
|
| |
|
Other operating expenses |
|
|
18,206 |
|
|
|
|
|
18,206 |
|
|
|
|
|
18,206 |
|
| |
General and administrative |
|
|
6,386 |
|
|
(244 |
)(1) |
|
6,142 |
|
|
|
|
|
6,142 |
|
| |
Depreciation and amortization |
|
|
3,938 |
|
|
|
|
|
3,938 |
|
|
|
|
|
3,938 |
|
| |
Pre-opening costs |
|
|
1,242 |
|
|
|
|
|
1,242 |
|
|
|
|
|
1,242 |
|
| |
Restaurant impairments and closures |
|
|
49 |
|
|
|
|
|
49 |
|
|
|
|
|
49 |
|
| |
|
|
|
|
|
|
|
|
|
|
|
| |
|
Total costs and expenses |
|
|
98,064 |
|
|
(244 |
) |
|
97,820 |
|
|
— |
|
|
97,820 |
|
| |
|
|
|
|
|
|
|
|
|
|
|
Income from operations |
|
|
5,366 |
|
|
244 |
|
|
5,610 |
|
|
— |
|
|
5,610 |
|
Interest expense, net |
|
|
(1,997 |
) |
|
|
|
|
(1,997 |
) |
|
611 |
(3) |
|
(1,386 |
) |
| |
|
|
|
|
|
|
|
|
|
|
|
Income before income taxes |
|
|
3,369 |
|
|
244 |
|
|
3,613 |
|
|
611 |
|
|
4,224 |
|
Income tax expense |
|
|
878 |
|
|
95 |
(2) |
|
973 |
|
|
238 |
(2) |
|
1,211 |
|
| |
|
|
|
|
|
|
|
|
|
|
|
Net income |
|
$ |
2,491 |
|
$ |
149 |
|
$ |
2,640 |
|
$ |
373 |
|
$ |
3,013 |
|
| |
|
|
|
|
|
|
|
|
|
|
|
Net income per share: |
|
|
|
|
|
|
|
|
|
|
|
|
|
|
|
|
| |
Basic and diluted |
|
$ |
2,491.00 |
|
|
|
|
|
|
|
|
|
|
$ |
0.13 |
(4) |
Weighted average shares outstanding: |
|
|
|
|
|
|
|
|
|
|
|
|
|
|
|
|
| |
Basic and diluted |
|
|
1,000 |
|
|
|
|
|
|
|
|
|
|
|
22,870,760 |
(4) |
Termination of Management Agreement
- (1)
- To
reflect a reduction of $0.2 million of annual management fees paid to J.H. Whitney. The management agreement will terminate upon completion
of the offering. We expect to incur a nonrecurring expense of approximately $1.0 million within general and administrative expenses and a corresponding tax benefit of $0.4 million
related to the termination of the management agreement. As they are nonrecurring, the termination fee and related tax effects are not included in the pro forma condensed consolidated statement of
operations.
- (2)
- To
reflect the tax effect of the pro forma adjustments at an estimated statutory rate of 39%.
Adjustments Related to the Offering
- (3)
- Had the offering occurred on the first day of fiscal year 2011, we would have used $40.6 million of the
proceeds to prepay a portion of our term loan as required by the amendment to our senior secured credit facility, as discussed in Note 6 of the unaudited condensed consolidated financial
statements included elsewhere in this prospectus. The adjustments related to the offering reflect the reduction of interest expense resulting from this pro forma prepayment and are as follows (in
thousands):
|
|
|
|
|
|
Reduction in interest expense from lower balance outstanding |
|
$ |
561 |
|
Reduction in amortization of debt issuance costs due to prepayment amount |
|
|
50 |
|
| |
|
|
|
| |
Net pro forma adjustment to interest expense |
|
$ |
611 |
|
| |
|
|
|
- (4)
- Reflects
adjustments to outstanding common stock as if the initial public offering was completed at the beginning of fiscal year 2011. Immediately after the
completion of this public offering, JCS Holdings, LLC, our parent company, will distribute substantially all of the shares of our common stock then held by it and/or the cash proceeds received
in this public offering to the holders of its Series A preferred units and its vested common units. JCS Holdings, LLC will thereafter continue to
51
Table of Contents
hold
shares equal to less than one percent of our outstanding common stock for the benefit of certain of our officers and directors who will continue to hold unvested common units in
JCS Holdings, LLC upon consummation of this offering.
- Basic
net income per share is computed on the basis of the weighted average number of common shares that were outstanding during the period. The
pro forma basic and diluted net income per share calculations include 3,692,534 shares to be sold in the public offering as the proceeds received from the sale of these shares will be used to
prepay a portion of our term loan and pay fees and expenses related to the offering. The remaining 1,880,169 shares to be sold in the public offering are not included in the pro forma basic and
diluted net income per share calculations as the proceeds received from the sale of these shares will be used for general corporate purposes. The following table sets forth the computation of pro
forma basic and diluted net income per share based on an offering price of $13.00 per share, the midpoint of the price range set forth on the cover page of this prospectus (in thousands, except per
share amount):
|
|
|
|
|
|
Pro forma net income |
|
$ |
3,013 |
|
Pro forma weighted average number of shares—basic and diluted: |
|
|
|
|
| |
Weighted average number of existing shares |
|
|
19,178 |
|
| |
Shares issued in this offering |
|
|
3,693 |
|
| |
|
|
|
| |
Pro forma weighted average number of common shares |
|
|
22,871 |
|
| |
|
|
|
Pro forma net income per share—basic and diluted |
|
$ |
0.13 |
|
52
Table of Contents
MANAGEMENT'S DISCUSSION AND ANALYSIS OF FINANCIAL CONDITION AND
RESULTS OF OPERATIONS
You should read the following discussion together with "Selected Historical Consolidated Financial and
Operating Data," and the historical financial statements and related notes included elsewhere in this prospectus. The statements in this discussion regarding industry outlook, our
expectations regarding our future performance, liquidity and capital resources and other non-historical statements in this discussion are forward-looking statements. These forward-looking
statements are subject to numerous risks and uncertainties, including, but not limited to, the risks and uncertainties described in "Risk Factors" and "Forward-Looking Statements." Our actual results
may differ materially from those contained in or implied by any forward-looking statements.
Our fiscal year ends on the Monday nearest to December 31 of each year. Fiscal years 2011 and 2009 were 52-week years,
while fiscal year 2010 was a 53-week year. References to fiscal years 2011, 2010 and 2009 are references to fiscal years ended January 2, 2012, January 3, 2011 and December 28,
2009 respectively. The first three quarters of our fiscal year consist of 12 weeks and our fourth quarter consists of 16 weeks for 52-week fiscal years and 17 weeks
for 53-week fiscal years.
Overview
Ignite Restaurant Group, Inc. operates two restaurant businesses, Joe's Crab Shack and Brick House Tavern+Tap. Each of our
restaurant businesses offers a variety of high-quality food in a distinctive, casual, high-energy atmosphere. Joe's Crab Shack and Brick House Tavern+Tap operate in
a diverse set of markets across the United States. As of March 26, 2012, we owned and operated 122 Joe's Crab Shack and 16 Brick House restaurants in 31 states.
Joe's
Crab Shack is an established, national chain of casual seafood restaurants. Joe's serves a variety of high-quality seafood items, with an emphasis on crab. Joe's is a
high-energy, family-friendly restaurant that encourages guests to "roll up your sleeves and crack into some crab."
Brick
House Tavern+Tap is a casual restaurant business that provides guests a differentiated "gastro pub" experience by offering a distinctive blend of menu items in a
polished setting. Brick House seeks to strike a balance between providing guests with an elevated experience while also appealing to "every-man, every-day."
Since
our acquisition from Landry's Restaurants, Inc. in 2006, we have implemented several initiatives that we believe have favorably impacted our performance at Joe's Crab Shack. These
factors include improving our executive leadership team as well as management in our restaurants, expanding our marketing program from spot network to national cable advertising, innovating Joe's menu
to increase our sales of crab related items and improving operational execution and efficiency. As a result of these initiatives, we have experienced 15 consecutive fiscal quarters of positive
comparable restaurant sales growth and improved our financial results. We believe the initiatives undertaken at Joe's have also repositioned the brand as a market leading casual seafood restaurant.
While
executing these initiatives at Joe's, we also developed and successfully launched a new restaurant brand, Brick House Tavern+Tap. With the addition of the Brick House
brand, on July 7, 2009, we officially changed our name to Ignite Restaurant Group, Inc. The first two Brick House locations were opened in 2008 by converting former Joe's locations into Brick
House locations. Based on the results of these two locations, we began opening Brick House locations as new restaurants. Brick House has since grown to 16 restaurants operating in
9 states, but remains a relatively small part of our business when compared to our Joe's Crab Shack brand. As of March 26, 2012, only five Brick House restaurants were open for at least
104 weeks, qualifying them for inclusion in our comparable restaurant base. For fiscal year 2011 and for the twelve weeks ended March 26, 2012, revenues from our Brick House brand were
only 12% and 10%, respectively, of our total revenues. We expect that our
53
Table of Contents
new
restaurant growth will continue to be substantially weighted towards new Joe's Crab Shack restaurants for the foreseeable future, which will decrease the proportion of total revenues attributable
to Brick House Tavern+Tap. We are currently in the process of integrating key insights into our Brick House concept and new restaurant rollout plans. As part of this brand optimization
process, during the fourth quarter of 2011, we made certain modifications to the style and experience of our Brick House restaurants to appeal to a broader guest base, including menu modifications and
the change from an all-female service staff to a more traditional service model.
Outlook
We believe that a significant portion of the casual dining industry, particularly the traditional bar & grill segment, has
become undifferentiated and the competitive landscape presents a significant growth opportunity for distinctive casual dining restaurants. Similar to the way the bar & grill segment emerged as
an alternative to traditional family dining restaurants in the 1990's, we believe that distinctive casual dining restaurants like ours are now positioned to capture market share from conventional
bar & grill restaurants. We intend to continue to position our restaurants to capitalize on that trend by constantly refining our brands, elevating food and service, and offering an
aspirational experience to our guests. We expect that the casual dining segment will follow broader macroeconomic trends. However, over the past three fiscal years, we have substantially outperformed
the rest of the casual dining segment in same store sales performance. We expect the factors above will continue to position our restaurant businesses favorably against our casual dining competitors.
During
fiscal year 2011, we opened seven new Joe's Crab Shack restaurants and four new Brick House Tavern+Tap restaurants. We have opened three additional Joe's Crab Shack
restaurants during the twelve weeks ended March 26, 2012. In addition, we have closed one Joe's Crab Shack restaurant and are in the process of converting one Brick House restaurant to a Joe's
Crab Shack restaurant.
The
financial results provided herein reflect the fact that, to this date, we have been a private company and as such have not incurred costs typically found in publicly traded
companies. We expect that those costs will increase our general and administrative expenses annually, similarly to other companies who complete an initial public offering.
In
addition, we expect to recognize certain non-recurring costs as a result of our initial public offering, of which approximately $2.0 million consisting of a pro rata portion of
our sponsor management fees up to the date of the transaction, the termination of the management agreement, and bonuses and other professional fees associated with the transaction, will be reflected
in our general and administrative expenses for the twelve weeks ended June 18, 2012. Including an additional $0.4 million of non-recurring costs previously accrued, we expect to use
approximately $2.4 million of cash during the twelve weeks ended June 18, 2012 to pay for these costs and other non-offering expenses, which are in addition to the estimated underwriting
discounts, commissions, and offering expenses reflected in our pro forma cash and cash equivalents as of March 26, 2012 under "Capitalization."
Key Performance Indicators
In assessing the performance of our business, we consider a variety of performance and financial measures. The key measures for
determining how our business is performing are comparable restaurant sales growth, average weekly sales, restaurant operating weeks, average check, average unit volume and number of restaurant
openings.
Comparable restaurant sales growth reflects the change in year-over-year sales for the comparable restaurant
base. We define the comparable restaurant base to include those restaurants open for at least 104 weeks, or approximately 24 months. As of the fiscal years ended January 3, 2011
and
54
Table of Contents
January 2,
2012 and the twelve weeks ended March 26, 2012, there were 111, 114 and 118 restaurants, respectively, in our comparable restaurant base. Comparable restaurant sales growth
can be generated by an increase in guest counts and/or by increases in the average check amount resulting from a shift in menu mix and/or increase in price. This measure highlights performance of
existing restaurants as the impact of new restaurant openings is excluded.
As
a result of the 53-week fiscal year 2010, our fiscal year 2011 began one week later than our 2010 fiscal year. Due to the seasonality and holiday sensitivity of our sales,
this one week lag can have a significant impact on comparable restaurant sales. Consistent with common industry practice, we present comparable restaurant sales on a calendar-adjusted basis that
aligns current year sales weeks with comparable periods in the prior year, regardless of whether they belong to the same fiscal period or not. In order to provide useful information to investors, we
have provided the change in comparable restaurant sales on both a calendar-adjusted basis and a fiscal period basis. Comparable restaurant sales for fiscal year ended January 2, 2012 presented
on a calendar-adjusted basis compares the results for the period from January 4, 2011 through January 2, 2012 (weeks 1 through 52 of fiscal year 2011) to the results for the period from
January 5, 2010 through January 3, 2011 (weeks 2 through 53 of fiscal year 2010). We believe that comparable restaurant sales calculated on a calendar-adjusted basis is more indicative
of the health of our business. However, we also recognize that comparable restaurant sales calculated on a fiscal period basis is a useful measure when analyzing year-over-year
changes in our consolidated financial statements. Unless noted otherwise, all references to comparable restaurant sales for the fiscal year ended January 2, 2012 in this prospectus refer to
comparable restaurant sales calculated on a calendar-adjusted basis.
Average weekly sales is a key measure of individual restaurant economic performance of new and existing restaurants. Average weekly
sales reflects total sales of all restaurants divided by restaurant operating weeks, which is the aggregate number of weeks that restaurants are in operation over a specified period of time. This
measure is subject to seasonality for periods less than one year.
Restaurant operating weeks is the aggregate number of weeks that our restaurants are in operation over a specific period of time.
Average check is calculated for Joe's Crab Shack by dividing net sales by guest counts for a given time period. Management uses this
indicator to analyze the dollars spent in
our Joe's Crab Shack restaurants per guest. This measure aids management in identifying trends in guest preferences, as well as the effectiveness of menu price increases and other menu changes.
Guest
counts represent the estimated number of guests served in our Joe's Crab Shack restaurants. The count is estimated based on the number of entrées sold. Our estimates
may vary from actual guest counts due to the variability in the level of sharing of certain entrée items on our menu. Given the significant level of alcohol sales and appetizer sales at
Brick House, guest count is more difficult to quantify and therefore, we do not calculate average check as a key performance indicator for that brand.
Average unit volume represents the average sales for restaurants included in the comparable restaurant base for a given time period,
typically annually. Average unit volume reflects total sales for
55
Table of Contents
restaurants
in our comparable restaurant base divided by the number of restaurants in our comparable restaurant base. This measure is subject to seasonality for periods less than one year.
Number of restaurant openings reflects the number of restaurants opened or converted during a particular reporting period. Before we
open new restaurants or convert existing restaurants, we incur pre-opening costs, which are defined below. Typically, new restaurants open with an initial start-up period of
higher than normalized sales volumes, which subsequently decrease to stabilized levels. While sales volumes are generally higher during the initial opening period, new restaurants typically experience
normal inefficiencies in the form of higher cost of sales, labor and other direct operating expenses for several months and as a result, restaurant operating margins are generally lower during the
start-up period of operation. The number and timing of restaurant openings has had, and is expected to continue to have, an impact on our results of operations.
Key Financial Definitions
Revenues primarily consist of food and beverage sales, net of promotional allowances, discounts and employee meals. Revenues are
influenced by new restaurant openings, comparable restaurant sales and total operating weeks.
Cost of sales consists primarily of food and beverage related costs. The components of cost of sales are variable in nature, change
with sales volume, are influenced by menu mix and are subject to increases or decreases based on fluctuations in commodity costs.
Labor and benefits include all restaurant-level management and hourly labor costs, including salaries, wages, benefits and performance
incentives, payroll taxes and other indirect labor costs.
Occupancy expenses include fixed and variable portions of rent, common area maintenance and property taxes.
Other operating expenses include all other restaurant-level operating costs, the major components of which are operating supplies,
utilities, repair and maintenance costs, marketing and advertising costs and credit card fees.
General and administrative expense is comprised of expenses associated with corporate and administrative functions that support the
development and operations of restaurants, including multi-unit management and Restaurant Support Center staff compensation and benefits, travel expenses, Restaurant Support Center costs,
stock compensation costs, legal and professional fees, costs related to abandoned new restaurant development sites and other related corporate costs.
56
Table of Contents
Depreciation and amortization includes the depreciation of fixed assets, capitalized leasehold improvements and amortization of
intangibles.
Pre-opening costs consist of costs incurred prior to opening a new restaurant and are made up primarily of manager
salaries, employee payroll and other costs related to training and preparing new restaurants for opening.
We review long-lived assets, such as property and equipment and intangibles, for impairment when events or circumstances
indicate the carrying value of the assets may not be recoverable and record an impairment charge when appropriate. Expenses incurred following the closure of restaurants are also included.
Loss on disposal of property and equipment represents the net book value of property and equipment less proceeds received, if
applicable, on assets abandoned or sold. These losses are related to normal disposals in the ordinary course of business, along with disposals related to restaurant closures and selected restaurant
remodeling activities.
Interest expense, net consists primarily of interest expense related to our debt and amortization of debt issuance costs net of
interest income.
Gain on insurance settlements represents proceeds received from natural disaster insurance claims in excess of the net book value of
assets lost and related costs.
57
Table of Contents
Results of Operations
The following table presents the consolidated statement of operations for the past three fiscal years and the twelve weeks ended
March 28, 2011 and March 26, 2012 expressed as a percentage of revenues.
|
|
|
|
|
|
|
|
|
|
|
|
|
|
|
|
|
|
|
|
|
|
|
|
|
|
|
Twelve Weeks Ended |
|
|
|
Fiscal Year* |
|
|
|
March 28,
2011 |
|
March 26,
2012 |
|
|
|
2009 |
|
2010 |
|
2011 |
|
Revenues |
|
|
100.0 |
% |
|
100.0 |
% |
|
100.0 |
% |
|
100.0 |
% |
|
100.0 |
% |
| |
Restaurant operating costs |
|
|
|
|
|
|
|
|
|
|
|
|
|
|
|
|
| |
|
Cost of sales |
|
|
29.2 |
|
|
29.6 |
|
|
31.5 |
|
|
31.5 |
|
|
31.8 |
|
| |
|
Labor and benefits |
|
|
28.6 |
|
|
27.9 |
|
|
27.6 |
|
|
28.0 |
|
|
27.1 |
|
| |
|
Occupancy expenses |
|
|
8.2 |
|
|
7.8 |
|
|
7.5 |
|
|
7.4 |
|
|
7.0 |
|
| |
|
Other operating expenses |
|
|
18.9 |
|
|
18.2 |
|
|
17.7 |
|
|
17.2 |
|
|
17.6 |
|
| |
General and administrative |
|
|
6.1 |
|
|
5.9 |
|
|
5.8 |
|
|
6.3 |
|
|
6.2 |
|
| |
Depreciation and amortization |
|
|
4.1 |
|
|
3.8 |
|
|
4.0 |
|
|
3.8 |
|
|
3.8 |
|
| |
Pre-opening costs |
|
|
0.4 |
|
|
1.1 |
|
|
1.0 |
|
|
0.9 |
|
|
1.2 |
|
| |
Restaurant impairments and closures |
|
|
0.0 |
|
|
0.3 |
|
|
0.1 |
|
|
0.0 |
|
|
0.0 |
|
| |
Loss on disposal of property and equipment |
|
|
0.3 |
|
|
0.8 |
|
|
0.2 |
|
|
(0.0 |
) |
|
0.0 |
|
| |
|
|
|
|
|
|
|
|
|
|
|
| |
|
Total costs and expenses |
|
|
95.8 |
% |
|
95.4 |
% |
|
95.2 |
% |
|
95.2 |
% |
|
94.8 |
% |
| |
|
|
|
|
|
|
|
|
|
|
|
Income from operations |
|
|
4.2 |
|
|
4.6 |
|
|
4.8 |
|
|
4.8 |
|
|
5.2 |
|
Interest expense, net |
|
|
(1.3 |
) |
|
(1.1 |
) |
|
(2.3 |
) |
|
(2.9 |
) |
|
(1.9 |
) |
Gain on insurance settlements |
|
|
0.4 |
|
|
0.3 |
|
|
0.3 |
|
|
0.0 |
|
|
0.0 |
|
| |
|
|
|
|
|
|
|
|
|
|
|
Income before income taxes |
|
|
3.3 |
% |
|
3.8 |
% |
|
2.8 |
% |
|
1.9 |
% |
|
3.3 |
% |
Income tax expense |
|
|
0.1 |
|
|
0.4 |
|
|
0.0 |
(1) |
|
0.5 |
|
|
0.8 |
|
| |
|
|
|
|
|
|
|
|
|
|
|
Net income |
|
|
3.2 |
% |
|
3.4 |
% |
|
2.8 |
% |
|
1.3 |
% |
|
2.4 |
% |
| |
|
|
|
|
|
|
|
|
|
|
|
- *
- The
percentages reflected have been subject to rounding adjustments. Accordingly, figures expressed as percentages when aggregated may not be the arithmetic
aggregation of the percentages that precede them.
- (1)
- Amount
is less than 0.1%.
The following table sets forth additional operating information that we use in assessing our performance as of the periods indicated:
|
|
|
|
|
|
|
|
|
|
|
|
|
|
|
|
|
|
|
|
|
|
|
|
|
|
Twelve Weeks Ended |
|
|
|
Fiscal Year |
|
|
|
March 28,
2011 |
|
March 26,
2012 |
|
|
|
2009 |
|
2010 |
|
2011 |
|
Selected Other Data (1)(2): |
|
|
|
|
|
|
|
|
|
|
|
|
|
|
|
|
Number of restaurants open (end of period): |
|
|
|
|
|
|
|
|
|
|
|
|
|
|
|
|
| |
Joe's Crab Shack |
|
|
114 |
|
|
113 |
|
|
119 |
|
|
113 |
|
|
122 |
|
| |
Brick House Tavern+Tap |
|
|
5 |
|
|
13 |
|
|
16 |
|
|
16 |
|
|
16 |
|
| |
|
|
|
|
|
|
|
|
|
|
|
| |
Total restaurants |
|
|
119 |
|
|
126 |
|
|
135 |
|
|
129 |
|
|
138 |
|
Average weekly sales (in thousands) |
|
$ |
51 |
|
$ |
54 |
|
$ |
59 |
|
$ |
57 |
|
$ |
63 |
|
Restaurant operating weeks |
|
|
6,060 |
|
|
6,499 |
|
|
6,871 |
|
|
1,534 |
|
|
1,638 |
|
Comparable Restaurant Data (1)(2): |
|
|
|
|
|
|
|
|
|
|
|
|
|
|
|
|
Comparable restaurant base (end of period) |
|
|
112 |
|
|
111 |
|
|
114 |
|
|
111 |
|
|
118 |
|
Average unit volume (in thousands) |
|
$ |
2,599 |
|
$ |
2,810 |
|
$ |
2,970 |
|
$ |
673 |
|
$ |
714 |
|
Change in comparable restaurant sales |
|
|
9.5 |
% |
|
4.9 |
% |
|
6.9 |
% |
|
9.4 |
% |
|
5.3 |
% |
Average check (Joe's only) |
|
$ |
20.80 |
|
$ |
22.00 |
|
$ |
23.07 |
|
$ |
23.10 |
|
$ |
23.79 |
|
- (1)
- Includes
both restaurant brands, unless otherwise noted.
- (2)
- See
the definitions of key performance indicators beginning on page 53.
58
Table of Contents
Twelve Weeks Ended March 26, 2012 Compared to Twelve Weeks Ended March 28, 2011
The following are highlights of our performance for the twelve weeks ended March 26, 2012 compared to the twelve weeks ended
March 28, 2011:
- •
- revenues increased 18.3% to $103.4 million;
- •
- comparable restaurant sales increased 5.3%;
- •
- three new restaurants were opened during the twelve weeks ended March 26, 2012, bringing our total number of
restaurants to 138 as of March 26, 2012, compared to three new restaurants opened during the twelve weeks ended March 28, 2011, bringing our total number of restaurants to 129 as of
March 28, 2011;
- •
- income from operations increased 28.4% to $5.4 million;
- •
- effective income tax rate decreased to 26.1% for the twelve weeks ended March 26, 2012 from 28.6% for the twelve
weeks ended March 28, 2011; and
- •
- net income increased 115.1% to $2.5 million.
The
following table sets forth information comparing the components of net income for the twelve weeks ended March 28, 2011 and March 26, 2012.
|
|
|
|
|
|
|
|
|
|
|
|
|
|
|
|
|
|
Twelve Weeks Ended |
|
|
|
|
|
|
|
March 28,
2011 |
|
March 26,
2012 |
|
Increase
(Decrease) |
|
Percent
Change |
|
|
|
(dollars in thousands)
|
|
Revenues |
|
$ |
87,431 |
|
$ |
103,430 |
|
$ |
15,999 |
|
|
18.3 |
% |
Cost and expenses |
|
|
|
|
|
|
|
|
|
|
|
|
|
| |
Restaurant operating costs |
|
|
|
|
|
|
|
|
|
|
|
|
|
| |
|
Cost of sales |
|
|
27,519 |
|
|
32,915 |
|
|
5,396 |
|
|
19.6 |
|
| |
|
Labor and benefits |
|
|
24,450 |
|
|
28,047 |
|
|
3,597 |
|
|
14.7 |
|
| |
|
Occupancy expenses |
|
|
6,510 |
|
|
7,281 |
|
|
771 |
|
|
11.8 |
|
| |
|
Other operating expenses |
|
|
15,077 |
|
|
18,206 |
|
|
3,129 |
|
|
20.8 |
|
| |
General and administrative |
|
|
5,517 |
|
|
6,386 |
|
|
869 |
|
|
15.8 |
|
| |
Depreciation and amortization |
|
|
3,349 |
|
|
3,938 |
|
|
589 |
|
|
17.6 |
|
| |
Pre-opening costs |
|
|
805 |
|
|
1,242 |
|
|
437 |
|
|
54.3 |
|
| |
Restaurant impairments and closures |
|
|
28 |
|
|
49 |
|
|
21 |
|
|
75.0 |
|
| |
Loss (gain) on disposal of property and equipment |
|
|
(4 |
) |
|
— |
|
|
4 |
|
|
(100.0 |
) |
| |
|
|
|
|
|
|
|
|
|
|
|
| |
|
Total costs and expenses |
|
|
83,251 |
|
|
98,064 |
|
|
14,813 |
|
|
17.8 |
% |
| |
|
|
|
|
|
|
|
|
|
|
|
Income from operations |
|
|
4,180 |
|
|
5,366 |
|
|
1,186 |
|
|
28.4 |
|
Interest expense, net |
|
|
(2,558 |
) |
|
(1,997 |
) |
|
561 |
|
|
(21.9 |
) |
| |
|
|
|
|
|
|
|
|
|
|
|
Income before income taxes |
|
|
1,622 |
|
|
3,369 |
|
|
1,747 |
|
|
107.7 |
% |
Income tax expense |
|
|
464 |
|
|
878 |
|
|
414 |
|
|
89.2 |
|
| |
|
|
|
|
|
|
|
|
|
|
|
Net income |
|
$ |
1,158 |
|
$ |
2,491 |
|
$ |
1,333 |
|
|
115.1 |
% |
| |
|
|
|
|
|
|
|
|
|
|
|
Other data: |
|
|
|
|
|
|
|
|
|
|
|
|
|
| |
Restaurant operating weeks |
|
|
1,534 |
|
|
1,638 |
|
|
104 |
|
|
6.8 |
% |
| |
Number of restaurants open (end of period) |
|
|
129 |
|
|
138 |
|
|
9 |
|
|
7.0 |
% |
59
Table of Contents
Revenues were $103.4 million during the twelve weeks ended March 26, 2012, an increase of $16.0 million, or 18.3%,
compared to revenues of $87.4 million during the twelve weeks ended March 28, 2011. Comparable restaurant sales contributed $4.1 million, or 4.7%, of the total revenue increase,
while non-comparable restaurants contributed $11.9, or 13.6%, of the total revenue increase. Comparable restaurant sales increased 5.3% as a result of 2.2% in pricing and 3.1% in guest
count and mix impacts.
Cost of sales increased by $5.4 million, or 19.6%, from $27.5 million during the twelve weeks ended March 28, 2011
to $32.9 million during the twelve weeks ended March 26, 2012 primarily due to increase in revenues. As a percentage of revenues, cost of sales increased to 31.8% from 31.5%. The
increase in cost of sales as a percentage of revenues was primarily driven by a higher cost of crab along with menu mix changes which were partially offset by pricing. While the menu mix shift
contributed to a higher cost of sales as a percentage of revenues, the shift yielded higher gross profit dollars.
Cost of labor and benefits increased by $3.6 million, or 14.7%, from $24.4 million during the twelve weeks ended
March 28, 2011 to $28.0 million during the twelve weeks ended March 26, 2012 primarily due to new restaurants. As a percentage of revenues, labor and benefits decreased from 28.0%
to 27.1% primarily due to leverage relative to comparable restaurant sales growth.
Occupancy expenses increased by $0.8 million, or 11.8%, from $6.5 million during the twelve weeks ended March 28,
2011 to $7.3 million during the twelve weeks ended March 26,
2012 primarily due to new restaurant openings and increase in contingent rent. As a percentage of revenues, occupancy expenses decreased from 7.4% to 7.0% due to improved leverage.
Other operating expenses increased by $3.1 million, or 20.8%, from $15.1 million during the twelve weeks ended
March 28, 2011 to $18.2 million during the twelve weeks ended March 26, 2012 mainly due to new restaurant openings. As a percentage of revenues, other operating expenses increased
from 17.2% to 17.6% mainly due to increases in marketing and advertising costs in line with the timing and ramp up of marketing campaigns, and workers compensation costs, partially offset by a
decrease in credit card fees caused by recent changes in legislation, and sales leverage.
General and administrative expenses increased by $0.9 million, or 15.8%, from $5.5 million during the twelve weeks ended
March 28, 2011 to $6.4 million during the twelve weeks ended March 26, 2012. As a percentage of revenues, general and administrative expenses decreased from 6.3% to 6.2% due to a
combination of sales leverage and reduced abandoned restaurant development costs partially offset by higher legal expenses and increased professional and consulting fees in support of our initial
public offering.
Depreciation and amortization expense increased by $0.6 million, or 17.6%, to $3.9 million for the twelve weeks ended
March 26, 2012 from $3.3 million for the twelve weeks ended March 28, 2011
60
Table of Contents
primarily
due to a higher depreciable base from newly opened restaurants. As a percentage of revenue, depreciation and amortization was flat from last year at 3.8%.
Pre-opening costs increased by $0.4 million, or 54.3%, to $1.2 million for the twelve weeks ended
March 26, 2012 from $0.8 million for the twelve weeks ended March 28, 2011 mainly due to more restaurants in the pipeline that are scheduled to open in the immediately succeeding
quarter that had already incurred expenses in the current quarter. Both twelve weeks ended March 28, 2011 and March 26, 2012 had three new restaurant openings.
Interest expense, net decreased by $0.6 million, or 21.9%, primarily due to the prior year write-off of debt
issuance costs related to the refinancing of our debt prior to the end of March 2011 and $0.4 million of expense related to the termination of our interest rate swap. This decrease was
partially offset by a $1.2 million increase in interest due to a higher average outstanding debt balance.
Income tax expense increased by $0.4 million, or 89.2%, from $0.5 million during the twelve weeks ended March 28,
2011 to $0.9 million during the twelve weeks ended March 26, 2012 mainly due to a higher income before income taxes. The effective income tax rate decreased from 28.6% to 26.1% primarily
due to an increase in federal tax credits related to FICA and Medicare tax paid on tips.
As a result of the foregoing, net income increased by $1.3 million, or 115.1%, to $2.5 million for the twelve weeks ended
March 26, 2012 from $1.2 million for the twelve weeks ended March 28, 2011.
Fiscal Year 2011 (52 Weeks) Compared to Fiscal Year 2010 (53 Weeks)
The following are highlights of our performance for fiscal year 2011 compared to fiscal year 2010:
- •
- revenues increased 15.3% to $405.2 million;
- •
- comparable restaurant sales increased 6.9% (7.2% increase on a fiscal period basis);
- •
- new restaurants, net of closures, increased by nine during fiscal year 2011, bringing our total number of restaurants to
135 compared to 126 restaurants for fiscal year 2010;
- •
- as a percentage of revenues, cost of sales increased to 31.5% from 29.6%, primarily due to the higher cost of crab and
other commodities. While menu mix shift contributed to the higher percentage, the shift yielded higher gross profit dollars;
- •
- income from operations increased 20.3% to $19.4 million;
- •
- interest expense, net increased $5.4 million, primarily due to the write-off of debt issuance costs, the early
termination of an interest rate swap agreement when we refinanced our debt, and the higher average balance of total debt outstanding during fiscal year 2011; and
- •
- net income decreased 5.0%, to $11.3 million.
61
Table of Contents
The following table sets forth information comparing the components of net income for fiscal year 2010 and fiscal year 2011.
|
|
|
|
|
|
|
|
|
|
|
|
|
|
|
|
|
|
Fiscal Year |
|
|
|
|
|
|
|
Increase
(Decrease) |
|
Percent
Change |
|
|
|
2010 |
|
2011 |
|
|
|
(dollars in thousands)
|
|
Revenues |
|
$ |
351,327 |
|
$ |
405,243 |
|
$ |
53,916 |
|
|
15.3 |
% |
| |
Restaurant operating costs |
|
|
|
|
|
|
|
|
|
|
|
|
|
| |
|
Cost of sales |
|
|
103,981 |
|
|
127,607 |
|
|
23,626 |
|
|
22.7 |
|
| |
|
Labor and benefits |
|
|
98,162 |
|
|
111,721 |
|
|
13,559 |
|
|
13.8 |
|
| |
|
Occupancy expenses |
|
|
27,440 |
|
|
30,244 |
|
|
2,804 |
|
|
10.2 |
|
| |
|
Other operating expenses |
|
|
63,963 |
|
|
71,696 |
|
|
7,733 |
|
|
12.1 |
|
| |
General and administrative |
|
|
20,634 |
|
|
23,340 |
|
|
2,706 |
|
|
13.1 |
|
| |
Depreciation and amortization |
|
|
13,445 |
|
|
16,063 |
|
|
2,618 |
|
|
19.5 |
|
| |
Pre-opening costs |
|
|
3,844 |
|
|
3,989 |
|
|
145 |
|
|
3.8 |
|
| |
Restaurant impairments and closures |
|
|
909 |
|
|
333 |
|
|
(576 |
) |
|
(63.4 |
) |
| |
Loss on disposal of property and equipment |
|
|
2,797 |
|
|
821 |
|
|
(1,976 |
) |
|
(70.6 |
) |
| |
|
|
|
|
|
|
|
|
|
| |
|
Total costs and expenses |
|
|
335,175 |
|
|
385,814 |
|
|
50,639 |
|
|
15.1 |
% |
| |
|
|
|
|
|
|
|
|
|
Income from operations |
|
|
16,152 |
|
|
19,429 |
|
|
3,277 |
|
|
20.3 |
|
Interest expense, net |
|
|
(3,831 |
) |
|
(9,215 |
) |
|
(5,384 |
) |
|
140.5 |
|
Gain on insurance settlements |
|
|
944 |
|
|
1,126 |
|
|
182 |
|
|
19.3 |
|
| |
|
|
|
|
|
|
|
|
|
Income before income taxes |
|
|
13,265 |
|
|
11,340 |
|
|
(1,925 |
) |
|
(14.5 |
)% |
Income tax expense (benefit) |
|
|
1,417 |
|
|
87 |
|
|
(1,330 |
) |
|
(93.9 |
) |
| |
|
|
|
|
|
|
|
|
|
Net income |
|
$ |
11,848 |
|
$ |
11,253 |
|
$ |
(595 |
) |
|
(5.0 |
)% |
| |
|
|
|
|
|
|
|
|
|
Other data: |
|
|
|
|
|
|
|
|
|
|
|
|
|
| |
Restaurant operating weeks |
|
|
6,499 |
|
|
6,871 |
|
|
372 |
|
|
5.7 |
% |
| |
Number of restaurants open (end of period) |
|
|
126 |
|
|
135 |
|
|
9 |
|
|
7.1 |
% |
Revenues were $405.2 million for fiscal year 2011, an increase of $53.9 million, or 15.3%, as compared to revenues of
$351.3 million for fiscal year 2010. The revenue increase was driven by an increase in comparable restaurant sales and sales from non-comparable restaurants. Comparable restaurant
sales and non-comparable restaurant sales contributed 4.9% and 10.4% of the total revenue increase, respectively. Comparable restaurant sales increased 6.9% for fiscal year 2011 compared
to an increase of 4.9% for fiscal year 2010.
Cost of sales increased $23.6 million, or 22.7%, to $127.6 million for fiscal year 2011, as compared to
$104.0 million for fiscal year 2010 due to the growth in revenues from new restaurants and existing restaurants. As a percentage of revenues, cost of sales increased to 31.5% for fiscal year
2011 from 29.6% for fiscal year 2010. The increase in cost of sales as a percentage of revenues was primarily driven by the higher cost of crab and certain other commodities along with menu mix
changes, which were partially offset by pricing and operating efficiency improvements. While the menu mix shift contributed to a higher cost of sales as a percentage of revenues, the shift yielded
higher gross profit dollars.
While
we provide our guests a large variety of menu items, crab and shrimp generally account for 43% of our total food purchases. We have experienced increases in crab pricing and
believe the cost will remain high through 2012 before moderating towards mean historical prices.
62
Table of Contents
Labor and benefits increased by $13.6 million, or 13.8%, to $111.7 million for fiscal year 2011 from $98.2 million
for fiscal year 2010, primarily due to new restaurant openings and higher sales from the comparable restaurant base. As a percentage of revenues, labor and benefits decreased to 27.6% for fiscal year
2011 from 27.9% for fiscal year 2010. The improvement was primarily due to better leveraging of restaurant management personnel and efficiencies gained from implementing a new labor scheduling
software system, partially offset by higher incentive payouts.
Occupancy expenses increased by $2.8 million, or 10.2%, to $30.2 million for fiscal year 2011 from $27.4 million
for fiscal year 2010, primarily due to new restaurant openings. As a percentage of revenues, occupancy expenses decreased to 7.5% for fiscal year 2011 from 7.8% for fiscal year 2010 primarily due to
improved leverage relative to comparable restaurant sales growth.
Other operating expenses increased by $7.7 million, or 12.1%, to $71.7 million for fiscal year 2011 from
$64.0 million for fiscal year 2010 primarily due to new restaurant openings. As a percentage of revenues, other operating expenses decreased to 17.7% for fiscal year 2011 from 18.2% for fiscal
year 2010, primarily due to improved leverage relative to comparable restaurant sales growth. As a percentage of revenue, restaurant supplies, repair and maintenance costs, utility costs, and
marketing and advertising costs all decreased as a result of the improved leverage and were the main drivers of the decrease in operating costs relative to revenues. As a percentage of revenues,
marketing and advertising costs were lower due to greater leverage with the growth in comparable restaurant sales and the increase in the number of Brick House restaurants, which have lower marketing
and advertising expenditures.
General and administrative expenses increased by $2.7 million, or 13.1%, to $23.3 million for fiscal year 2011 from
$20.6 million for fiscal year 2010 primarily driven by higher personnel costs from increased Restaurant Support Center headcount to manage and support the increase in new restaurants, higher
incentive expenses due to improved operating performance, and higher travel expenses due to restaurant development activity. As a percentage of revenues, general and administrative expenses decreased
slightly to 5.8% for fiscal year 2011 from 5.9% for fiscal year 2010.
Depreciation and amortization expense increased by $2.6 million, or 19.5%, to $16.1 million for fiscal year 2011 from
$13.4 million for fiscal year 2010 primarily due to a higher depreciable base from new restaurants opened. As a percentage of revenues, depreciation and amortization increased to 4.0% for
fiscal year 2011 from 3.8% for fiscal year 2010.
Pre-opening costs increased by $0.1 million, or 3.8%, to $4.0 million for fiscal year 2011 from
$3.8 million for fiscal year 2010. The increase was due to the timing of restaurant openings during 2011 and 2010. Eleven restaurants were opened during 2011 (including one conversion), and
eleven restaurants were opened during 2010 (including one rebuild of an existing restaurant).
63
Table of Contents
There were no impairments in fiscal year 2011. Year-over-year impairment expense for fiscal year 2011 decreased by $0.3 million.
Fiscal year 2011 restaurant closure expense of $0.3 million is a $0.3 million reduction on a year-over-year basis.
Loss on disposal of property and equipment decreased by $2.0 million to $0.8 million for fiscal year 2011 from
$2.8 million for fiscal year 2010. The loss in fiscal year 2011 was primarily due to a $0.6 million writeoff of property and equipment for a Brick House location to be converted to a
Joe's in 2012, a closure of one Joe's Crab Shack restaurant, and writeoffs for abandoned remodel projects. The loss in fiscal year 2010 was primarily due to the writeoff of property and equipment for
two Joe's Crab Shack restaurant locations; one was razed and rebuilt due to the condition of the facility, while the other underwent construction to re-brand it as a Brick House
restaurant.
Interest expense, net increased by $5.4 million to $9.2 million for fiscal year 2011 from $3.8 million for fiscal
year 2010 primarily due to the write-off of debt issuance costs related to the refinancing of our debt prior to the end of March 2011, the cost to terminate an interest rate swap agreement associated
with that debt and the higher average outstanding debt balance.
Gain on insurance settlements increased by $0.2 million due to an insurance claim for one restaurant that was severely flooded
and rebuilt in 2010 and an additional $1.1 million gain recognized in fiscal year 2011 related to a restaurant damaged by hurricane in late 2008.
Income tax expense decreased by $1.3 million from $1.4 million in fiscal year 2010 to $0.1 million in fiscal year
2011. The decrease is primarily due to the release of a $2.1 million deferred tax asset valuation allowance caused by our current and expected future taxable position. Our assessment of the
valuation allowance indicated that it is more likely than not that our deferred tax assets, which are primarily established for FICA credit carryforwards, would be realized, hence, the reversal of the
valuation allowance and the consequent reduction in income tax expense. Our effective tax rate decreased from 10.7% in fiscal year 2010 to 0.8% in fiscal year 2011 due mainly to FICA and Medicare tax
paid on tips allowable as federal tax credit.
As a result of the foregoing, net income decreased $0.6 million, or 5.0%, in fiscal year 2011 compared to fiscal year 2010.
Fiscal Year 2010 (53 Weeks) Compared to Fiscal Year 2009 (52 Weeks)
The following are highlights of our performance for fiscal year 2010 compared to fiscal year 2009:
- •
- revenues increased 14.1% to $351.3 million;
- •
- comparable restaurant sales increased 4.9%;
- •
- new restaurants, net of closures, increased by seven;
64
Table of Contents
- •
- as a percentage of revenues, labor decreased to 27.9% from 28.6%, primarily due to the efficiencies gained in hourly labor
from implementing a new labor scheduling software system and better leveraging of restaurant management through increases in comparable restaurant sales;
- •
- income from operations increased 26.2% to $16.2 million; and
- •
- net income increased 20.0%, to $11.8 million.
The
following table sets forth information comparing the components of net income for fiscal year 2009 and fiscal year 2010.
|
|
|
|
|
|
|
|
|
|
|
|
|
|
|
|
|
|
Fiscal Year |
|
|
|
|
|
|
|
Increase
(Decrease) |
|
Percent
Change |
|
|
|
2009 |
|
2010 |
|
|
|
(dollars in thousands)
|
|
Revenues |
|
$ |
307,801 |
|
$ |
351,327 |
|
$ |
43,526 |
|
|
14.1 |
% |
| |
Restaurant operating costs |
|
|
|
|
|
|
|
|
|
|
|
|
|
| |
|
Cost of sales |
|
|
89,845 |
|
|
103,981 |
|
|
14,136 |
|
|
15.7 |
|
| |
|
Labor and benefits |
|
|
87,920 |
|
|
98,162 |
|
|
10,242 |
|
|
11.6 |
|
| |
|
Occupancy expenses |
|
|
25,243 |
|
|
27,440 |
|
|
2,197 |
|
|
8.7 |
|
| |
|
Other operating expenses |
|
|
58,140 |
|
|
63,963 |
|
|
5,823 |
|
|
10.0 |
|
| |
General and administrative |
|
|
18,765 |
|
|
20,634 |
|
|
1,869 |
|
|
10.0 |
|
| |
Depreciation and amortization |
|
|
12,733 |
|
|
13,445 |
|
|
712 |
|
|
5.6 |
|
| |
Pre-opening costs |
|
|
1,323 |
|
|
3,844 |
|
|
2,521 |
|
|
190.6 |
|
| |
Restaurant impairments and closures |
|
|
15 |
|
|
909 |
|
|
894 |
|
|
5,960.0 |
|
| |
Loss on disposal of property and equipment |
|
|
1,017 |
|
|
2,797 |
|
|
1,780 |
|
|
175.0 |
|
| |
|
|
|
|
|
|
|
|
|
| |
|
Total costs and expenses |
|
|
295,001 |
|
|
335,175 |
|
|
40,174 |
|
|
13.6 |
% |
| |
|
|
|
|
|
|
|
|
|
Income from operations |
|
|
12,800 |
|
|
16,152 |
|
|
3,352 |
|
|
26.2 |
|
Interest expense, net |
|
|
(3,867 |
) |
|
(3,831 |
) |
|
36 |
|
|
(0.9 |
) |
Gain on insurance settlements |
|
|
1,192 |
|
|
944 |
|
|
(248 |
) |
|
(20.8 |
) |
| |
|
|
|
|
|
|
|
|
|
Income before income taxes |
|
|
10,125 |
|
|
13,265 |
|
|
3,140 |
|
|
31.0 |
% |
Income tax expense |
|
|
255 |
|
|
1,417 |
|
|
1,162 |
|
|
455.7 |
|
| |
|
|
|
|
|
|
|
|
|
Net income |
|
$ |
9,870 |
|
$ |
11,848 |
|
$ |
1,978 |
|
|
20.0 |
% |
| |
|
|
|
|
|
|
|
|
|
Other data: |
|
|
|
|
|
|
|
|
|
|
|
|
|
| |
Restaurant operating weeks |
|
|
6,060 |
|
|
6,499 |
|
|
439 |
|
|
7.2 |
% |
| |
Number of restaurants open (end of period) |
|
|
119 |
|
|
126 |
|
|
7 |
|
|
5.9 |
% |
Revenues were $351.3 million for fiscal year 2010, an increase of $43.5 million, or 14.1%, as compared to revenues of
$307.8 million for fiscal year 2009. The revenue increase was driven by sales from non-comparable restaurants and comparable restaurant sales and one additional operating week in
fiscal year 2010, contributing 7.7%, 4.6% and 1.9% of the total revenue increase, respectively. Year-over-year comparable restaurant sales increased 4.9% for fiscal year 2010.
Cost of sales increased $14.1 million, or 15.7%, to $104.0 million for fiscal year 2010, as compared to
$89.8 million for fiscal year 2009, primarily due to the growth in revenues from new restaurants and existing restaurants. As a percentage of revenues, cost of sales increased to 29.6% for
fiscal year 2010 from 29.2% for fiscal year 2009. The increase in cost of sales as a percentage of revenues was primarily driven by the impact from menu mix changes, which were partially offset by
pricing and operating efficiency improvements. While the menu mix shift contributed to a higher cost of sales as a percentage of revenues, the shift also yielded higher gross profit dollars.
65
Table of Contents
Labor and benefits increased by $10.2 million, or 11.6%, to $98.2 million for fiscal year 2010 from $87.9 million
for fiscal year 2009, primarily due to new restaurant openings and higher sales from the comparable restaurant base. As a percentage of revenues, labor and benefits
decreased to 27.9% for fiscal year 2010 from 28.6% for fiscal year 2009. The improvement was primarily due to efficiencies gained in hourly labor from implementing a new labor scheduling software
system and better leveraging of restaurant management personnel through increases in comparable restaurant sales.
Occupancy expenses increased by $2.2 million, or 8.7%, to $27.4 million for fiscal year 2010 from $25.2 million
for fiscal year 2009, primarily due to new restaurant openings. As a percentage of revenues, occupancy expenses decreased to 7.8% for fiscal year 2010 from 8.2% for fiscal year 2009, primarily due to
improved leverage relative to comparable restaurant sales growth.
Other operating expenses increased by $5.8 million, or 10.0%, to $64.0 million for fiscal year 2010 from
$58.1 million for fiscal year 2009 primarily due to new restaurant openings. As a percentage of revenues, other operating expenses decreased to 18.2% for fiscal year 2010 from 18.9% for fiscal
year 2009, primarily due to improved leverage relative to comparable restaurant sales growth. Lower marketing and advertising expenses as a percentage of revenues were the main drivers of the decrease
in other operating costs relative to revenues. As a percentage of revenues, marketing and advertising costs are lower due to greater leverage with the growth in comparable restaurant sales and the
increase in the number of Brick House restaurants, which have lower marketing and advertising expenditures.
General and administrative expenses increased by $1.9 million, or 10.0%, to $20.6 million for fiscal year 2010 from
$18.8 million for fiscal year 2009, primarily due to higher personnel costs from increased multi-unit manager and Restaurant Support Center headcount to manage and support the
increase in new restaurants, higher travel expenses due to restaurant development activity, partially offset by lower legal expenses due to improved experience in resolving specific claims against the
Company. As a percentage of revenues, general and administrative expenses decreased to 5.9% for fiscal year 2010 from 6.1% for fiscal year 2009, primarily due to improved leverage relative to the
growth in revenues.
Depreciation and amortization expense increased by $0.7 million, or 5.6%, to $13.4 million for fiscal year 2010 from
$12.7 million for fiscal year 2009, primarily due to a higher depreciable base from new restaurants opened. As a percentage of revenues, depreciation and amortization declined to 3.8% for
fiscal year 2010 from 4.1% for fiscal year 2009.
Pre-opening costs increased by $2.5 million, or 190.6%, to $3.8 million for fiscal year 2010 from
$1.3 million for fiscal year 2009. The increase was due to the number of restaurant openings. Eleven restaurants were opened in fiscal year 2010 (including one that reopened after being
rebuilt) compared to five restaurants opened in fiscal year 2009, one of which was a conversion.
66
Table of Contents
We performed a long-lived asset impairment analysis during fiscal year 2010 and determined that two restaurants had
carrying amounts in excess of their fair value. Impairment charges of $0.3 million were recorded as a result. No impairment charges were recorded in fiscal year 2009. Three restaurants were
also closed in fiscal year 2010 accounting for the additional $0.6 million in expense.
Loss on disposal of property and equipment increased by $1.8 million to $2.8 million for fiscal year 2010 from
$1.0 million for fiscal year 2009. The loss in fiscal year 2010 was primarily due to the writeoff of property and equipment for two Joe's Crab Shack restaurant locations; one was razed and
rebuilt due to the condition of the facility while the other underwent construction to re-brand it as a Brick House restaurant. The loss in fiscal year 2009 was due to the closure of two
restaurants and the writeoff of other assets no longer used in the business.
Interest expense, net decreased slightly to $3.8 million for fiscal year 2010, primarily due to capitalization of interest cost
offset by an extra week of interest on our outstanding debt from our bank credit facility.
The gain on insurance settlements of $0.9 million for fiscal year 2010 related to the settlement of an insurance claim for one
restaurant severely flooded and rebuilt in fiscal year 2010. The gain on insurance settlements of $1.2 million in fiscal year 2009 related to an insurance claim for hurricane damage to several
Texas restaurants incurred late in fiscal year 2008.
Income tax expense increased by $1.2 million to $1.4 million for fiscal year 2010 from $0.3 million for fiscal
year 2009. The effective tax rates were 10.7% and 2.5% for fiscal year 2010 and fiscal year 2009, respectively. The tax rate for fiscal year 2010, relative to pretax income of $13.3 million,
was impacted by significant permanent differences, primarily FICA & Medicare tax paid on tips allowable as a federal tax credit, and a $1.9 million partial release of the reserve against
deferred tax assets. The impact of these items is less profound in 2010 and results in a higher effective tax rate due to the increase in pretax income. The tax rate for fiscal year 2009, relative to
pretax income of $10.1 million, was also predominantly impacted by permanent differences and related federal tax credits.
Net
deferred tax assets consist primarily of temporary differences and net operating loss and credit carry-forwards. The valuation allowance was established primarily on FICA credit
carry-forwards that begin to expire in 2027, as we believed that it was more likely than not that these deferred tax assets would not be realized. We will analyze the need for this reserve
periodically. The tax benefits relating to any reversal of the valuation allowance will be recognized as a reduction of income tax expense.
As a result of the foregoing, net income increased 20.0%, or $2.0 million, to $11.8 million for fiscal year 2010 from
$9.9 million for fiscal year 2009.
Quarterly Results and Seasonality
The following table sets forth certain unaudited financial and operating data in each fiscal quarter during fiscal years 2010 and 2011.
The unaudited quarterly information includes all normal recurring
67
Table of Contents
adjustments
that we consider necessary for a fair presentation of the information shown. This information should be read in conjunction with the audited consolidated and unaudited condensed
consolidated financial statements and related notes thereto appearing elsewhere in this prospectus. There is a seasonal component to Joe's Crab Shack's business which typically peaks in the summer
months (June, July and August) and slows in the winter months (November, December, January). Because of the seasonality of our business, results for any fiscal quarter are not necessarily indicative
of the results that may be achieved for future fiscal quarters or for the full fiscal year. All quarterly periods presented below include 12 weeks, except for the fourth quarter of fiscal years
2009 and 2011, which included 16 weeks and the fourth quarter of fiscal year 2010, which included 17 weeks.
|
|
|
|
|
|
|
|
|
|
|
|
|
|
|
|
|
|
|
|
|
|
|
|
|
|
|
|
|
|
|
|
|
|
|
|
|
|
|
|
|
|
|
Fiscal Year 2009 |
|
Fiscal Year 2010 |
|
Fiscal Year 2011 |
|
Fiscal Year 2012 |
|
|
|
First
Quarter |
|
Second
Quarter |
|
Third
Quarter |
|
Fourth
Quarter |
|
First
Quarter |
|
Second
Quarter |
|
Third
Quarter |
|
Fourth
Quarter |
|
First
Quarter |
|
Second
Quarter |
|
Third
Quarter |
|
Fourth
Quarter |
|
First
Quarter |
|
Number of restaurants open at end of period |
|
|
116 |
|
|
115 |
|
|
117 |
|
|
119 |
|
|
122 |
|
|
123 |
|
|
123 |
|
|
126 |
|
|
129 |
|
|
133 |
|
|
135 |
|
|
135 |
|
|
138 |
|
Total revenues (in millions) |
|
$ |
65.8 |
|
$ |
78.5 |
|
$ |
90.3 |
|
$ |
73.2 |
|
$ |
71.9 |
|
$ |
88.5 |
|
$ |
102.6 |
|
$ |
88.3 |
|
$ |
87.4 |
|
$ |
103.2 |
|
$ |
113.2 |
|
$ |
101.4 |
|
$ |
103.4 |
|
Change in total comparable restaurant sales |
|
|
8.4 |
% |
|
13.3 |
% |
|
11.1 |
% |
|
4.3 |
% |
|
5.1 |
% |
|
3.4 |
% |
|
4.9 |
% |
|
6.5 |
% |
|
9.4 |
% |
|
6.0 |
% |
|
5.5 |
% |
|
7.3 |
% |
|
5.3 |
% |
| |
|
|
|
|
|
|
|
|
|
|
|
|
|
|
|
|
|
|
|
|
|
|
|
|
|
|
|
Average weekly sales (in thousands) |
|
$ |
47 |
|
$ |
57 |
|
$ |
65 |
|
$ |
39 |
|
$ |
50 |
|
$ |
60 |
|
$ |
69 |
|
$ |
42 |
|
$ |
57 |
|
$ |
66 |
|
$ |
70 |
|
$ |
47 |
|
$ |
63 |
|
Average unit volumes (in thousands) |
|
$ |
555 |
|
$ |
674 |
|
$ |
775 |
|
$ |
589 |
|
$ |
585 |
|
$ |
695 |
|
$ |
822 |
|
$ |
682 |
|
$ |
673 |
|
$ |
774 |
|
$ |
831 |
|
$ |
700 |
|
$ |
714 |
|
Liquidity and Capital Resources
Our primary sources of liquidity and capital resources have been cash provided from operating activities, cash and cash equivalents,
and the senior secured credit facility. Our primary requirements for liquidity and capital are new restaurant development, working capital and general corporate needs. Our operations have not required
significant working capital and, like many restaurant companies, we have been able to operate, and will continue to operate with negative working capital. Our requirement for working capital is not
significant since our restaurant guests pay for their food and beverage purchases in cash or payment cards (credit or debit) at the time of sale. Thus, we are able to sell many of our inventory items
before we have to pay our suppliers for such items. Our restaurants do not require significant inventories or receivables.
We
believe that these sources of liquidity and capital will be sufficient to finance our continued operations and expansion plans for at least the next twelve months.
The
following table shows summary cash flows information for fiscal years 2009, 2010 and 2011, and the twelve weeks ended March 28, 2011 and March 26, 2012:
|
|
|
|
|
|
|
|
|
|
|
|
|
|
|
|
|
|
|
|
|
|
|
|
|
|
|
Twelve Weeks Ended |
|
|
|
Fiscal Years |
|
|
|
March 28,
2011 |
|
March 26,
2012 |
|
|
|
2009 |
|
2010 |
|
2011 |
|
|
|
(in thousands)
|
|
Net cash provided by (used in): |
|
|
|
|
|
|
|
|
|
|
|
|
|
|
|
|
| |
Operating activities |
|
$ |
14,953 |
|
$ |
38,237 |
|
$ |
32,717 |
|
$ |
9,897 |
|
$ |
10,380 |
|
| |
Investing activities |
|
|
(14,745 |
) |
|
(30,486 |
) |
|
(39,817 |
) |
|
(8,297 |
) |
|
(5,612 |
) |
| |
Financing activities |
|
|
(342 |
) |
|
(155 |
) |
|
(1,747 |
) |
|
647 |
|
|
(757 |
) |
| |
|
|
|
|
|
|
|
|
|
|
|
| |
|
Net (decrease) increase in cash and cash equivalents |
|
$ |
(134 |
) |
$ |
7,596 |
|
$ |
(8,847 |
) |
$ |
2,247 |
|
$ |
4,011 |
|
| |
|
|
|
|
|
|
|
|
|
|
|
68
Table of Contents
Net cash provided by operating activities increased from $9.9 million for the twelve weeks ended March 28, 2011 to
$10.4 million for the twelve weeks ended March 26, 2012 primarily due to the increase in sales and restaurant-level profit partially offset by an increase in costs associated with our
initial public offering.
Net
cash provided by operating activities was $32.7 million for fiscal year 2011 compared to $38.2 million for fiscal year 2010. The decrease was primarily due to an
increase in cash paid for interest in fiscal year 2011 related to increased borrowings under our new senior secured credit facility, settlement of the interest rate swap agreement, and an increase in
cash paid for taxes due to our increased profitability and prior utilization of historic net operating losses.
Net
cash provided by operating activities was $38.2 million in fiscal year 2010 compared to $15.0 million in fiscal year 2009. The increase in fiscal year 2010 was
primarily the result of increased sales, partially offset by timing of vendor payments.
Net cash used in investing activities decreased from $8.3 million for the twelve weeks ended March 28, 2011 to
$5.6 million for the twelve weeks ended March 26, 2012. The decrease in the use of cash was primarily due to lower cash paid on capital expenditures and the receipt of insurance proceeds
for restaurants damaged by hurricane in 2008.
Capital
expenditures for fiscal years 2009, 2010 and 2011 were $18.3 million, $33.3 million and $40.1 million, respectively. In each year, development of new
locations accounted for most of the expenditures. Year-over-year variances in capital expenditures are due to the number and timing of new or updated locations under construction. We estimate that
total capital expenditures for fiscal year 2012 will be approximately $37.0 to $42.0 million, with 11 new restaurant openings planned.
Net cash used in financing activities was $0.8 million for the twelve weeks ended March 26, 2012 compared to net cash
provided by financing activities of $0.6 million for the twelve weeks ended March 28, 2011. The difference was caused by the net proceeds from the refinancing of our senior credit
facility, debt issuance costs paid, and the dividend paid to our parent company all during the twelve weeks ended March 28, 2011, offset by higher principal payments for the new senior credit
facility.
Net
cash used in financing activities was $0.3 million, $0.2 million, and $1.7 million during fiscal years 2009, 2010, and 2011, respectively. The increase in net
cash used was primarily due to the net effect of refinancing our senior credit facility in March 2011 a dividend payment of $80.0 million, and a scheduled $2.3 million principal
repayment. We made mandatory principal repayments on our previous senior secured term loan facility totaling $0.1 million for each of fiscal years 2009 and 2010. We had no outstanding balance
on our revolving credit facility as of January 2, 2012.
In November 2006, we entered into a $125.0 million credit agreement that consisted of a $100.0 million first-lien bank
credit facility due November 2012 and a $25.0 million second-lien term loan due May 2013. The first-lien bank credit facility was comprised of a $90.0 million term loan and
a $10.0 million revolving credit facility. The interest rate of the first-lien term loan was set at LIBOR plus 3.75% or the bank's base rate plus 2.75%. The second-lien term loan bore interest
at the lower of LIBOR plus 7.5% or the bank's base rate plus 6.5%. The first-lien term loan required quarterly principal payments of $25,510 plus accrued interest through September 2012. The
first-lien bank credit
69
Table of Contents
facility
and the second-lien term loan were repaid in full and terminated as part of the refinancing in March 2011 discussed below.
In
March 2011, we entered into a $145.0 million senior secured credit facility with General Electric Capital Corporation and a syndicate of financial institutions. The senior
secured credit facility, as amended, consists of (a) a five-year $120.0 million term loan and (b) a five-year $25.0 million revolving credit
facility, which includes a letter of credit
sub-facility of up to $6.0 million and a swing line facility of up to $5.0 million. We used the proceeds from the term loan to repay in full $34.8 million under our
prior credit facility, make an $80.0 million distribution to J.H. Whitney VI indirectly through JCS Holdings, LLC, our parent company, and terminate the interest rate swap
contract on our prior credit facility. As of March 26, 2012, we had $117.0 million of outstanding borrowings under our senior secured credit facility and $1.8 million outstanding
in letters of credit.
Our
senior secured credit facility requires us to maintain a certain effective leverage ratio, as defined in the credit agreement, as of the last day of each fiscal quarter. For the
fiscal quarter ending September 12, 2011, the effective leverage ratio may not be more than 5.50:1; for the fiscal quarter ending March 26, 2012, the effective leverage ratio may not be
more than 5.40:1; for the fiscal quarter ending June 18, 2012, the effective leverage ratio may not be more than 5.25:1; for the fiscal quarters ending September 10, 2012,
December 31, 2012, March 25, 2013 and June 17, 2013, the effective leverage ratio may not be more than 5.00:1; for the fiscal quarters ending September 9, 2013,
December 30, 2013, March 24, 2014 and June 16, 2014, the effective leverage ratio may not be more than 4.75:1; and for the fiscal quarter ending September 8, 2014 and the
last day of each fiscal quarter thereafter, the effective leverage ratio may not be more than 4.50:1.
Our
senior secured credit facility also requires us to maintain a certain fixed charge coverage ratio as of the last day of each fiscal quarter. For the fiscal quarters ending
September 9, 2011 through June 18, 2012, the fixed charge coverage ratio may not be less than 1.40:1; for the fiscal quarters ending September 10, 2012 through September 9,
2013, the fixed charge coverage ratio may not be less than 1.45:1; and for the fiscal quarter ending December 30, 2013 and thereafter, the fixed charge coverage ratio may not be less than
1.40:1.
Finally,
our senior secured credit facility limits the amount of consolidated capital expenditures, excluding maintenance capital expenditures, we may incur in any fiscal year, provided
that we may carry over into the next fiscal year, the lesser of (i) 75% of the unused amount of consolidated capital expenditures for any fiscal year and (ii) $10.0 million. For
fiscal year ending December 31, 2012, the capital expenditure limit is $34.0 million; for fiscal year ending December 30, 2013, the capital expenditure limit is
$33.0 million; for fiscal year ending December 29, 2014, the capital expenditure limit is $33.25 million; and for fiscal year ending December 28, 2015 and each fiscal year
thereafter, the capital expenditure limit is $33.5 million.
We
were in compliance with these covenants as of March 26, 2012. Failure to comply with these covenants in the future could cause an acceleration of outstanding amounts under the
term loan and restrict us from borrowing under the revolving credit facility to fund our liquidity requirements. Our effective leverage ratio and fixed rate ratio are each calculated based on Adjusted
EBITDA, as presented in this prospectus. In connection with this offering we intend to refinance or obtain an amendment to the senior secured credit facility to permit this offering, to allow us to
use the proceeds from this offering in the manner described in "Use of Proceeds" and for certain related matters.
On April 23, 2012, we entered into an amendment to our senior secured credit agreement that will become effective on the date we receive proceeds from an initial public offering.
The amendment requires us to prepay a portion of the term loan with proceeds from the initial public offering in an amount equal to the greater of (a) $35.0 million and (b) the
lesser of (1) 56% of the gross cash proceeds of the initial public offering and (2) $42.5 million. The prepayment will first be applied to the next six regularly scheduled
quarterly term loan principal payments and then will reduce the remaining
70
Table of Contents
principal payments on a pro rata basis. The amendment includes other revisions to the credit agreement, the most significant of which are modifications to our financial covenants that increase the
amount that we can spend annually on growth related capital expenditures, lower the principal component of the fixed charge ratio calculation proportionally to the pay down, and reduce our effective
leverage ratio by 25 basis points for substantially all remaining quarterly periods. The amendment also eliminates the annual mandatory prepayment requirement related to excess cash flow.
We believe that becoming a public company may provide additional sources of liquidity because we will have better access to public
markets in order to raise additional capital. In addition, we believe that current conditions in the capital markets provide us with an attractive opportunity for an initial public offering.
Off-Balance Sheet Arrangements
Except for restaurant operating leases, we have no material off-balance sheet arrangements.
Contractual Obligations
The following table sets forth our contractual obligations and commercial commitments as of January 2, 2012:
|
|
|
|
|
|
|
|
|
|
|
|
|
|
|
|
|
|
|
|
Payments Due by Period in Years |
|
|
|
Total |
|
Less than
1 year |
|
1-3 years |
|
3-5 years |
|
More than
5 years |
|
|
|
(in thousands)
|
|
Senior credit facility(a) |
|
$ |
117,750 |
|
$ |
3,000 |
|
$ |
13,500 |
|
$ |
101,250 |
|
$ |
— |
|
Operating leases(b) |
|
|
261,961 |
|
|
22,761 |
|
|
44,170 |
|
|
42,131 |
|
|
152,899 |
|
Interest payments(a) |
|
|
28,219 |
|
|
7,269 |
|
|
13,644 |
|
|
7,306 |
|
|
— |
|
Capital leases |
|
|
7 |
|
|
7 |
|
|
— |
|
|
— |
|
|
— |
|
Uncertain tax positions(c) |
|
|
— |
|
|
— |
|
|
— |
|
|
— |
|
|
— |
|
| |
|
|
|
|
|
|
|
|
|
|
|
| |
Total |
|
$ |
407,937 |
|
$ |
33,037 |
|
$ |
71,314 |
|
$ |
150,687 |
|
$ |
152,899 |
|
| |
|
|
|
|
|
|
|
|
|
|
|
- (a)
- We
refinanced our senior secured credit facility in March 2011 (see discussion above). As of January 2, 2012, we have $117.8 million
outstanding under the refinanced facility due March 24, 2016, which bears interest at 6.25%. As a result of this refinancing:
- •
- scheduled principal payments in the new senior secured credit facility are scheduled to be $3.0 million in fiscal
year 2012, $5.25 million in fiscal year 2013, $8.25 million in fiscal year 2014, $11.25 million in fiscal year 2015, and $90.0 million thereafter; and
- •
- assuming no change in the interest rate in effect at January 2, 2012, the scheduled cash interest payments would be
$7.3 million in fiscal year 2012, $7.1 million in fiscal year 2013, $6.7 million in fiscal year 2014, $6.1 million in fiscal year 2015 and $1.4 million thereafter.
On
April 23, 2012, we entered into an amendment to our senior secured credit agreement that will become effective on the date we receive proceeds from an initial public offering. The amendment
requires us to prepay a portion of the term loan with proceeds from the initial public offering in an amount equal to the greater of (a) $35.0 million and (b) the lesser of
(1) 56% of the gross cash proceeds of the initial public offering and (2) $42.5 million.
- (b)
- Includes
base lease terms and certain optional renewal periods that are included in the lease term in accordance with accounting guidance related to leases.
71
Table of Contents
- (c)
- We
have $0.5 million of uncertain tax positions recorded in other long-term liabilities. It is not reasonably possible to predict at this time when
(or if) any of these assessments will be settled.
We are parties to certain indemnifications to third parties in the ordinary course of business. The probability of incurring an actual
liability under such indemnifications is sufficiently remote so that no liability has been recorded.
Segment Reporting
We own and operate the Joe's Crab Shack and Brick House Tavern+Tap restaurant brands in the United States. All of our
restaurants compete in the full-service casual dining industry, providing in-restaurant, full service, casual dining, food away from home to our guests. Our brands also possess similar
production methods, distribution methods, and economic characteristics, resulting in similar long-term expected financial performance characteristics. We believe we meet the criteria for
aggregating our restaurant operations into a single reporting segment.
Impact of Inflation
Our profitability is dependent, among other things, on our ability to anticipate and react to changes in the costs of key operating
resources, including food and beverages, labor, energy and other services. Substantial increases in costs and expenses could impact our operating results to the extent such increases cannot be passed
along to our guests. Apart from the commodity effects discussed above, in general, we have been able to substantially offset restaurant and operating cost increases resulting from inflation by
altering our menu items, increasing menu prices, making productivity improvements or other adjustments. However, certain areas of costs, notably labor and utilities, can be significantly volatile or
subject to significant changes due to changes in laws or regulations, such as the minimum wage laws. There can be no assurance that we will continue to generate increases in comparable restaurant
sales in amounts sufficient to offset inflationary or other cost pressures.
Recent Accounting Pronouncements
In May 2011, the FASB issued Accounting Standards Update ("ASU") No. 2011-04, Fair Value
Measurement (Topic 820): Amendments to Achieve Common Fair Value Measurement and Disclosure Requirements in US GAAP and IFRS, which clarifies Topic 820 and
provides guidance on changes to certain principles or requirements for measuring fair value. The amendment is effective during interim and annual periods beginning after December 15, 2011. We
adopted ASU 2011-04 as of January 3, 2012, which did not have a significant impact on our consolidated financial statements.
In
June 2011, the FASB issued ASU No. 2011-05, Comprehensive Income (Topic 220): Presentation of Comprehensive
Income, which eliminates the option to present components of other comprehensive income as part of the statement of changes in stockholders' equity and other reclassifications
presented in the financial statements. The update is effective for fiscal years and interim periods beginning after December 15, 2011. Certain provisions of ASU 2011-05 have
been amended by ASU No. 2011-12, Comprehensive Income (Topic 220): Deferral of the Effective Date for Amendments to the Presentation of
Reclassifications of Items Out of Accumulated Other Comprehensive Income in Accounting Standards Update No. 2011-05, to effectively defer only those changes
in ASU 2011-05 that relate to the presentation of reclassification adjustments out of accumulated other comprehensive income. We adopted ASU 2011-05 as of January 3,
2012 by including a separate statement of comprehensive income for the twelve weeks ended March 28, 2011 and March 26, 2012. We do not believe that adoption of ASU 2011-12 will
have a significant impact on our consolidated financial statements.
72
Table of Contents
New and Revised Financial Accounting Standards
We qualify as an "emerging growth company" pursuant to the provisions of the JOBS Act, enacted on April 5, 2012.
Section 102 of the JOBS Act provides that an "emerging growth company" can take advantage of the extended transition period provided in Section 7(a)(2)(B) of the Securities Act for
complying with new or revised accounting standards. However, we are choosing to "opt out" of such extended transition period, and as a result, we will comply with new or revised accounting standards
on the relevant dates on which adoption of such standards is required for non-emerging growth companies. Our decision to opt out of the extended transition period is irrevocable.
Critical Accounting Policies
We prepare our consolidated financial statements in conformity with U.S. GAAP. The preparation of these financial statements
requires us to make estimates and assumptions that affect the reported amounts of assets and liabilities and disclosure of contingent assets and liabilities at the date of the financial statements,
and the reported amounts of revenues and expenses during the reporting period. Actual results could differ from those estimates. Critical accounting policies are those that management believes are
both most important to the portrayal of our financial condition and operating results, and require management's most difficult, subjective or complex judgments, often as a result of the need to make
estimates about the effect of matters that are inherently uncertain. We base our estimates on historical experience, outside advice from parties believed to be experts in such matters, and on various
other assumptions that are believed to be reasonable under the circumstances, the results of which form the basis for making judgments about the carrying value of assets and liabilities that are not
readily apparent from other sources. Judgments and uncertainties affecting the application of those policies may result in materially different amounts being reported under different conditions or
using different assumptions. Our significant accounting policies can be found in Note 2 to our consolidated financial statements. We consider the following policies to be the most critical in
understanding the judgments that are involved in preparing our consolidated financial statements.
We evaluate the recoverability of the carrying amount of long-lived assets, which include property and equipment and
intangible assets with definite useful lives, whenever events or changes in circumstances indicate that the carrying value may not be fully recoverable. Our review for impairment of these
long-lived assets takes into account estimates of future undiscounted cash flows. Factors considered include, but are not limited to, significant underperformance relative to historical or
projected future operating results, significant changes in the manner of use of the acquired assets or the strategy for the overall business, and significant negative industry or economic trends. Our
asset group for impairment testing is comprised of the assets and liabilities of each of our individual restaurants, since this is the lowest level of identifiable cash flows. An impairment loss is
recognized if the future undiscounted cash flows associated with the assets are less than their carrying value. Impairment losses are measured as the amount by which the carrying values of the assets
exceed their fair values. For assets held for sale or disposal, we measure fair value using quoted market prices or an estimation of net realizable value.
From
time to time, we have decided to close or dispose of restaurants. Typically, such decisions are made based on operating performance or strategic considerations and must be made
before the actual costs or proceeds of disposition are known, and management must make estimates of these outcomes. Such outcomes could include the sale of a leasehold, mitigating costs through a
tenant or subtenant, or
negotiating a buyout of a remaining lease term. In these instances, management evaluates possible outcomes, frequently using outside real estate and legal advice, and records provisions for the effect
of such outcomes. The accuracy of such provisions can vary materially from original estimates, and management regularly monitors the adequacy of the provisions until final disposition occurs.
73
Table of Contents
We currently lease all of our restaurant locations under leases classified as operating leases. Minimum base rent for our operating
leases, which generally have escalating rentals over the term of the lease, is recorded on a straight-line basis over the lease term. As such, an equal amount of rent expense is attributed
to each period during the term of the lease regardless of when actual payments occur. Lease terms begin on the inception date and include option periods only where such renewals are imminent and
assured. The difference between rent expense and actual cash payments is classified as deferred rent in the consolidated balance sheets.
Some
of our leases provide for contingent rent, which is determined as a percentage of sales in excess of specified minimum sales levels. We recognize contingent rent expense prior to
the achievement of the specified sales target that triggers the contingent rent, provided achievement of the sales target is considered probable.
We maintain large deductibles on workers' compensation, general liability, property, and business interruption insurance coverage.
These policies have been structured to limit our per-occurrence exposure. We record a liability for workers' compensation and general liability for all unresolved claims based on actuarial
information provided by our insurance brokers and insurers, combined with management judgments regarding economic conditions, including future medical and indemnity costs, the frequency and severity
of claims and claim development history, case jurisdiction, applicable legislation and settlement practices. Changes in any of these factors in the future may produce materially different amounts of
expense than otherwise would be reported under these insurance programs.
We are subject to U.S. federal income tax and income taxes imposed in the state and local jurisdictions where we operate restaurants.
Deferred income taxes are provided on temporary differences between financial statement and income tax reporting. Temporary differences are differences between the amounts of assets and liabilities
reported for financial statement purposes and their tax bases. Deferred tax assets are recognized for temporary differences that will be deductible in future years' tax returns and for operating loss
and tax credit carryforwards. Deferred tax assets are reduced by a valuation allowance if it is deemed more likely than not that some or all of the deferred tax assets will not be realized. In
assessing the realizability of deferred tax assets, we consider whether it is more likely than not that some portion or all of the deferred tax assets will not be realized. The ultimate realization of
deferred tax assets is dependent upon the generation of future taxable income during the periods in which those temporary differences become deductible. We consider the scheduled reversal of deferred
tax liabilities, projected future taxable income, and tax planning strategies in making this assessment. Deferred tax liabilities are recognized for temporary differences that will be taxable in
future years' tax returns.
We
file income tax returns in the U.S. federal jurisdiction and various state and local jurisdictions. We are subject to U.S. federal income tax examinations by tax authorities for the
fiscal year ended January 3, 2011 and forward. We believe that an adequate provision has been made for any adjustments that may result from tax examinations. Although the outcome of tax audits
is uncertain, we have concluded that we do have uncertain tax positions as defined in ASC No. 740, Income Taxes that need to be recognized in our financial statements associated with state
income taxes which amounted to $469,000 at January 2, 2012 and reflected a reduction of $45,000 for 2011. If any issues addressed in our tax audits are not resolved to our expectations, any
interest and/or penalties would be classified as income tax expense in our consolidated statements of operations. During 2011, we completed a federal
74
Table of Contents
income
tax audit for tax years 2008 and 2009, without material adjustments, as well as an income tax audit by the State of Alabama, also without material adjustments. We have no other tax audits
either open or scheduled at this time.
Certain key members of management and independent directors have been granted common units of JCS Holdings, LLC, our parent
company, under unit grant agreements. Because our parent company's membership interests have no active market, we estimated the fair value
of each common unit granted on the date of grant based on a variety of considerations and assumptions, including but not limited to a third-party valuation. The valuation study used the market and
income approaches with an appropriate discount factor for the common unit's lack of marketability. Common units granted prior to 2009 did not have any value at their grant date and no common units
were granted in 2010, 2011, or 2012.
We
recognize compensation expense for employee and independent director services received in exchange for our parent company's common units, which is equal to the fair value of the
common units at grant date. We ratably expense the fair value of grants in general and administrative expenses in our consolidated statements of operations over the remaining service period of the
awards.
We recognize legal claims and other loss contingencies when information becomes available indicating that a liability has been incurred
and the loss amount can be reasonably estimated. Predicting the outcome of claims and litigation involves substantial uncertainties that could cause actual results to vary materially from estimates.
We recognize legal expenses, including those related to loss contingencies, as incurred.
Generally,
we do not recognize gain contingencies until all contingencies have been resolved, but we recognize gain contingencies that are recoveries of previously recognized contingent
losses when realization of the recovery is deemed probable and reasonably estimable.
Quantitative and Qualitative Disclosures of Market Risks
Many of the food products we purchase are affected by commodity pricing that is subject to price volatility caused by weather,
production problems, delivery difficulties and other factors that are outside our control and are generally unpredictable. For fiscal year 2011, Snow Crab, Dungeness Crab, King Crab and shrimp
accounted for approximately 43% of total food purchases. Crab is wild caught and sourced from government regulated and sustainable fisheries. We have experienced increases in crab costs, which we
believe will remain high through 2012 before moderating towards mean historical prices. The impact of some of these increases was partially offset by certain fixed forward pricing contracts for hard
shell crab. Other categories affected by the commodities markets, such as seafood, beef and fish, may each account for approximately 5% to 10% of our food purchases. While we have some of our food
items prepared to our specifications, our food items are based on generally available products, and if any existing suppliers fail, or are unable to deliver in quantities we require, we believe that
there are sufficient other quality suppliers in the marketplace that our sources of supply can be replaced as necessary. We also recognize, however, that commodity pricing is extremely volatile and
can change unpredictably and over short periods. Our purchasing department negotiates prices and quantities for all of our ingredients through either cancellable contracts (with varying length terms),
spot market purchases or commodity pricing formulas. Changes in commodity prices would generally affect us and our competitors similarly, depending on the terms and duration of supply contracts. We
also enter into fixed price supply contracts for certain products in an effort to minimize volatility of
75
Table of Contents
supply
and pricing. In many cases, or over the longer term, we believe we will be able to pass through some or all of the increased commodity costs by adjusting menu pricing. From time to time,
competitive circumstances, or judgments about consumer acceptance of price increases, may limit menu price flexibility, and in those circumstances, increases in commodity prices can have an adverse
effect on margins.
We are subject to interest rate risk in connection with borrowings under our senior secured credit facility, which bear interest at
variable rates. As of March 26, 2012, we had $117.8 million outstanding under our senior secured credit facility. Derivative financial instruments, such as interest rate swap agreements
and interest rate cap agreements, may be used for the purpose of managing fluctuating interest rate exposures that exist from our variable rate debt obligations that are expected to remain
outstanding. Interest rate changes do not affect the market value of such debt, but could impact the amount of our interest payments, and accordingly, our future earnings and cash flows, assuming
other factors are held constant. Our current LIBOR-based borrowings are subject to an interest rate floor of 150 basis points. Prevailing interest rates would have to increase by approximately 130
basis points over the interest rate at March 26, 2012, before our interest expense would change.
76
Table of Contents
BUSINESS
Our Company
Through the success of our two restaurant businesses, Joe's Crab Shack and Brick House Tavern+Tap, we believe that Ignite
Restaurant Group is developing a reputation as a company that can successfully create, develop and grow distinctive restaurant brands. Each of our restaurant businesses offers a variety of
high-quality food in a distinctive, casual, high-energy atmosphere. Joe's Crab Shack and Brick House Tavern+Tap operate in a diverse set of markets across the
United States.
Joe's
Crab Shack, founded in 1991, is an established, national chain of casual seafood restaurants. Joe's serves a variety of high-quality seafood items, with an emphasis on
crab. Joe's is a
high-energy, family-friendly restaurant that encourages guests to "roll up your sleeves and crack into some crab."
Brick
House Tavern+Tap, founded in 2008, is a casual restaurant business that provides guests a differentiated "gastro pub" experience by offering a distinctive blend of menu
items in a polished setting. Brick House seeks to strike a balance between providing guests with an elevated experience while also appealing to "every-man, every-day." In 2011,
Brick House was listed as the #1 "up and comer" full-service, varied-menu restaurant business by Technomic, a leading restaurant industry consulting and research firm.
Our
comparable restaurant sales have increased for 15 consecutive fiscal quarters and outperformed the KNAPP-TRACK™ report of casual dining restaurants, which is an average
of approximately 50 casual dining restaurant brands, over the same period of time. We have grown our comparable restaurant sales by 25% on a cumulative basis over the last four years, which has
outperformed the KNAPP-TRACK growth rate of (8%) by nearly 3,300 basis points on a cumulative basis over the same period of time. During the twelve weeks ended March 26, 2012, our comparable
restaurant sales increased by 5.3% over the comparable period in our prior fiscal year.
Our
current management team was put in place in fiscal year 2007. This team developed and implemented many of the initiatives and strategies which serve as the foundation for what our
company is today. The impact of these strategies began to be take effect in fiscal year 2008. From the fiscal year ended December 29, 2008 through the fiscal year ended January 2, 2012,
total revenues and Adjusted EBITDA (a non-GAAP financial measure) have improved at compounded annual growth rates of 14.0% and 29.5%, respectively. Over the same period, our total revenues increased
from $273.4 million to $405.2 million, net income increased from a net loss of $3.2 million to net income of $11.3 million and Adjusted EBITDA increased from
$20.3 million to $44.1 million. We opened 24 new restaurants, rebuilt one restaurant, closed eight restaurants and converted four Joe's Crab Shack restaurants to Brick House restaurants,
which resulted in a net total of 16 new restaurants over the same period of time. For the twelve weeks ended March 26, 2012, we opened three new restaurants.
As
of March 26, 2012, we owned and operated 138 restaurants in 31 states.
77
Table of Contents
Our Business Strengths
We are focused on developing brands that have category leading and defendable positions within the casual dining segment. As a result,
our core business strengths include the following:
Highly Differentiated Restaurant Brands. Our restaurants strive to provide a unique guest experience in a
"come-as-you-are," upbeat and inviting restaurant environment. Both Joe's Crab Shack and Brick House Tavern+Tap are distinctively positioned restaurant
brands, designed to have unique guest appeal. Joe's Crab Shack is a leading casual seafood brand that offers more than just a meal—a visit to Joe's is an event for the whole family, a
night out. We provide a memorable, shareable "crab-cracking experience" where guests can roll up their sleeves and "break out of their shell" in a vacation-themed environment that offers
an escape from the everyday. Brick House Tavern+Tap offers a comfortable, trend-forward yet timeless setting where guests can gather and share their passion for elevated, chef-inspired
comfort food, while enjoying their favorite local, national or imported brand of beer and cheering for their favorite team. Each brand features food offerings and an atmosphere that attracts a diverse
group of guests.
Authentic and Unique Menu Offerings. We offer high-quality, authentic seafood at Joe's Crab Shack and trend-forward,
chef-inspired, contemporary tavern food and other American fare at Brick House Tavern+Tap. Signature dishes at both brands feature craveable flavor profiles. Food menus are
complemented by an assortment of beverages and distinctive cocktails, including Joe's Shark Bite and Brick House's tap-at-your-table Beer Bongs. Our culinary and
beverage teams develop recipes and menu offerings for both Joe's and Brick House to ensure that all items feature distinctive twists on classic items, as well as items exclusive to each brand.
Memorable Guest Service. Our servers are friendly, attentive and responsive to the needs of our guests. In addition, our servers strive
to provide
guests an unforgettable dining experience. Joe's staff creates a
fun-loving atmosphere through high-energy special occasion celebrations, while the staff at Brick House is focused on providing hospitable and personal service to guests. We achieve this
through experienced restaurant management teams that implement training programs specific to the menu and culture of each brand. We believe our distinctive guest service models provide an additional
layer of brand differentiation.
Attractive Unit Economics. We have successfully increased our restaurant average unit volumes at a compounded annual growth rate of
8.1%, from
$2.4 million in fiscal year 2008 to $3.0 million in fiscal year 2011. Over the same period of time, we have increased our restaurant-level profit margin (a non-GAAP financial
measure) by 340 basis points from 12.6% to 16.0%. We are targeting average unit volumes and restaurant-level profit margins for new locations to exceed system-wide fiscal year 2011 levels.
Experienced Management Team. Our experienced team of industry veterans has an average of 20 years of experience with restaurant
companies such
as T.G.I. Friday's, Darden, Applebee's, Yum! Brands, Landry's and Sbarro. Our management team is led by Raymond A. Blanchette, III, our President and Chief Executive Officer, who joined
us in 2007. Mr. Blanchette was a former President for Pick Up Stix and Executive Director of International Business at T.G.I. Friday's, both are brands operated by Carlson Restaurants
Worldwide. Within twelve months of his arrival, Mr. Blanchette transformed our leadership team by recruiting five highly experienced restaurant executives. Despite a difficult economic
environment, we have achieved 15 consecutive fiscal quarters of comparable restaurant sales growth, expanded our geographic footprint and improved our financial performance. From fiscal year 2008 to
fiscal year 2011, we increased net income from a net loss of $3.2 million to net income of $11.3 million and increased Adjusted EBITDA from $20.3 million to $44.1 million.
The experience of our management team has allowed us to transform Joe's Crab Shack into a market leader while simultaneously developing and launching Brick House Tavern+Tap.
78
Table of Contents
Our Strategy
Our strategies include the following:
Disciplined New Restaurant Growth. We believe there are meaningful opportunities to grow the number of restaurants of both Joe's Crab
Shack and Brick
House Tavern+Tap. We seek to maximize free cash flow for reinvestment into new restaurants at attractive returns. For both brands, we target new restaurant
cash-on-cash returns, which we define as restaurant-level profit per store divided by total build-out cost (excluding capitalized interest) and
pre-opening costs, to exceed 25%.
- •
- Joe's Crab Shack. We target steady state new restaurant
average unit volumes of approximately $3.9 million for Joe's Crab Shack. Joe's has a narrowly defined new restaurant development strategy that predominantly targets (i) specific
geographies with high population density and a propensity for seafood and (ii) locations in close proximity to regional and national tourist attractions. Twenty one of our twenty five top
performing Joe's Crab Shack restaurants meet one or both of these criteria and generated average unit volumes of $4.7 million in fiscal year 2011. In fiscal year 2010, we developed a new
restaurant prototype for Joe's Crab Shack, which has given Joe's a polished look and feel while maintaining the authentic crab shack ambiance. As of March 26, 2012, we have successfully opened
12 new restaurants using this new prototype and development strategy.
- •
- Brick House Tavern+Tap. We target steady state
new restaurant average unit volumes of approximately $3.2 million for Brick House Tavern+Tap. We believe Brick House has significant growth potential and intend to focus future
development in the top 50 designated market areas across the country. We initially opened a limited number of Brick House restaurants across a broad range of geographies with the intent of optimizing
the brand prior to a continued build out. We are currently in the process of integrating key insights into our future new restaurant rollout plans.
For
fiscal year 2012, we target opening 11 new restaurants, the vast majority of which will be new Joe's Crab Shack restaurants. We expect that our new restaurant growth will continue to
be substantially weighted towards new Joe's Crab Shack restaurants for the foreseeable future.
Comparable Restaurant Sales Growth. We believe the following strategies have contributed to our successful growth and will allow us to
generate
comparable restaurant sales growth in the future:
- •
- Continuous Menu Innovation. We believe menu innovation is
a critical factor in building guest loyalty and frequency. Both Joe's Crab Shack and Brick House Tavern+Tap have signature food and beverage offerings and a tradition of consistent menu
innovation. New menu items are typically introduced at both brands twice a year and we test new menu items in restaurants across several diverse geographies before they are introduced into the broader
base of restaurants. We have successfully introduced new and innovative items at both brands with such additions as Queen Crab, Skillet Paella and Mason Jars at Joe's Crab Shack and Brick Pizza, Meat
and Cheese Board, Fried Stuffed Olives and Chicken & Waffles at Brick House Tavern+Tap. We plan to continue our tradition of menu innovation in the future.
- •
- Marketing our Restaurant Brands. We believe that our
marketing strategies will continue to increase brand awareness while driving new guest trial and repeat guest visits. In June 2007, we changed our marketing strategy for Joe's Crab Shack by developing
a long-term marketing plan supported by quantitative analysis that is designed to increase comparable restaurant sales and guest count, as well as build the brand for the future. We also
moved to a national cable platform, which provides television advertising reach to the Joe's Crab Shack restaurants that were previously outside of the spot/local television markets and previews the
Joe's Crab Shack brand in new development markets. These national marketing efforts are complemented by a combination of local marketing programs and social media. Brick House Tavern+Tap
is primarily marketed through local marketing, digital media and social media outlets. We also
79
Table of Contents
Leverage our Scale to Enhance our Profitability. We believe we have a scalable infrastructure and can continue to expand our margins as
we execute
our strategy. While both brands have independent field operations, we use our shared services platform to handle many of the administrative functions for both brands. This leverageable structure
should further our ability to enhance our profitability as we grow.
Our Restaurants
Joe's Crab Shack
Joe's Crab Shack is a come-as-you-are, family restaurant that offers guests an environment that is
laid-back, comfortable, fun, and energetic. Most locations offer an outdoor patio for guests to enjoy eating and drinking and a children's playground as part of the "I'm relaxed"
restaurant experience. Joe's also has many locations that are located on waterfront property. Interior design elements include a nautical, vacation theme to invoke memories of beach vacations and a
genuine crab shack experience. Table tops are decorated with art to prompt dinner conversation, while picnic tables across the patio and interior help guests feel the relaxed tropical vacation
experience. Joe's Crab Shack restaurants are largely free-standing and average 8,000 square feet with over 200 seats. Most Joe's Crab Shack bars are on one side of the restaurant to
provide for a distinct place to grab a drink while waiting for a table. Colorful party lights, a disco ball and bright paint colors enhance the dining experience. Many of our restaurants also include
a small gift shop where guests can purchase souvenirs to commemorate their dining experience. Our new restaurant prototype, introduced in fiscal year 2010, contemporizes many of our key brand
elements, while maintaining our authentic crab shack appeal.
Joe's
Crab Shack restaurants perform well in targeted markets with high population density and a propensity for seafood as well as "destination" markets with national and regional
tourist attractions, both of which are key characteristics of our new site selection strategy.
Brick House Tavern+Tap
Brick House is a trend-forward "gastro pub" set in an inviting, comfortable and modern venue that provides a distinctive guest
experience. Brick House's interior décor includes custom lighting, dark mahogany woods, HD TVs, brick walls and an inviting fireplace. The interior design of Brick House
Tavern+Tap consists of diverse seating and gathering areas where guests can pick multiple ways to enjoy their experience. In addition to a traditional dining room and bar area, Brick House
also offers large communal tables and a section of leather recliners positioned in front of large HD TVs, where guests receive their own TV tray for dining. Each restaurant has a
state-of-the-art entertainment package and provides guests with a clear line of sight to at least two HD TVs from every seat, making Brick House restaurants an
ideal gathering place for sports enthusiasts. Outdoor seating is also available on the patio or around an open fire pit at nearly all locations. Both food and beverages are served by personable and
engaging service staff. The typical Brick House restaurant is approximately 8,500 square feet and averages approximately 250 seats, which includes both traditional tables and seats in unique settings.
We are currently in the process of integrating key insights into our Brick House
80
Table of Contents
concept
and new restaurant rollout plans. As part of this brand optimization process, during the fourth quarter of 2011, we made certain modifications to the style and experience of our Brick House
restaurants to appeal to a broader guest base, including menu modifications and the change from an all-female service staff to a more traditional service model.
Menu and Menu Development
We are focused on continually elevating our unique and high-quality food and beverage offerings. Born out of consumer
insights, our in-house Marketing & Menu department continually creates new chef-driven food and beverage products for both Joe's Crab Shack and Brick House
Tavern+Tap, which are intended to exceed guest expectations. A variety of research tools are used to identify opportunities and evaluate current offerings, including a brand-tracker
program, segmentation and core menu studies, brand screens, focus groups and in-restaurant surveys. We use a third party econometric consulting firm to provide statistical analysis around
pricing, allowing us to make fact-based decisions on pricing and menu engineering.
Joe's Crab Shack
Joe's Crab Shack aims to offer signature, craveable items to its guests by continuously seeking to innovate our menu offerings. For
example, we have dramatically shifted the menu mix at Joe's to focus on entrées featuring crab over the past three fiscal years. Crab is strategically positioned center stage in our
menu through the Steampots and Crab in a Bucket categories, highlighting the importance of the menu item that defines Joe's Crab Shack. Joe's Steampot and Crab in a Bucket offerings allow guests to
choose between four varieties of crabs (Queen, Snow, Dungeness and King) and Maine lobster. Steampots, our best selling item, are overflowing with generous portions of crab, other seafood, red
potatoes, a fresh ear of corn and sausage, combined with a complementary set of seasoning flavors. Our Crab in a Bucket entrées allow guests to pair their favorite crab selection with
several distinctive preparations ranging from BBQ to Chesapeake Style or Garlic Herb. Joe's Crab Shack also leverages its crab-forward menu with other craveable crab items, including
Made-From-Scratch Crab Cakes, Crab Nachos and Crazy-Good Crab Dip. As a result of this strategy, the percentage of entrées at Joe's featuring crab
has increased from approximately 20% to 45% of total food revenues. We believe this shift in menu mix has contributed to increases in guest satisfaction, comparable restaurant sales and gross profit
dollars. In addition to our core crab-focused menu, Joe's also offers a broad range of entrées featuring a variety of seafood, including the Get Stuffed Snapper, Surf 'N
Turf Burger and The Big Hook Up, as well as a wide range of traditional seafood entrées like the Fisherman's Platter. Joe's also offers several "out of water" options such as Pan Fried
Cheesy Chicken and Whiskey Smoked Ribs. In addition, alcoholic beverages have significantly evolved to support the elevated food strategy, with vacation-style drinks, including the 'Shark Bite,'
'Category 5 Hurricane' and Mason Jar cocktails emerging as guests' top choices.
Joe's
menu includes more than 29 items made with either Queen, Snow, Dungeness or King Crabs sourced from government regulated and sustainable fisheries. Our current menu offers 13
appetizers, including Made-From-Scratch Crab Cakes, Crab Nachos and Crazy-Good Crab Dip, and over 50 entrées, including Steampots, Crab in a Bucket,
Skillet Paella, Stuffed Snapper and "out of water" options like Whiskey Smoked Ribs. For fiscal year 2011, Joe's average check was $23.07, lunch and dinner represented 27% and 73% of revenue,
respectively, and revenue distribution was 84% food, 14% alcohol and 2% retail. Prices currently range from $6.69 to $45.99 for items on Joe's menu, including appetizers ordered as
entrées and entrées that are frequently shared.
Menu
implementation roll-outs occur in May and November. For all new menu roll-outs, new product launches are combined with a new menu design and updated pricing
to reflect the current economic environment, as well as the current strategic marketing and creative plan. A menu change typically includes the introduction of five to ten new menu items while
maintaining a balance of
81
Table of Contents
approximately
65 total menu items. Menu items are added or removed only after thorough testing and analysis, which includes guest satisfaction feedback.
Brick House Tavern+Tap
The Brick House Tavern+Tap food and beverage menu was created to support the brand position of "Dispensing Happiness to the
Common Man." We believe Brick House's elevated menu has changed the game for the "burger & beer" crowd by offering an innovative premium food selection, along with over 70 varieties of
beer.
Brick
House offers its guests a broad selection of high-quality, chef-inspired, contemporary tavern food and other American fare. Brick House's menu includes 13
appetizers and over 53 entrées. Unique handcrafted appetizers include Deviled Eggs, Meatloaf Sliders, Brick Pizza, Meat and Cheese Board and Fried Stuffed Olives. Brick House
offers an array of burgers, including The Kobe, which is hand formed from high-quality American Wagyu beef. Guests can also choose from a broad selection of home made
entrées such as Drunken Chops, BBQ Baby Backs, Chicken & Waffles, and our Prime Rib Sandwich. A daily special menu encourages continued innovation with featured items like
Prosciutto Wrapped Meatloaf and Shepherd's Pie. In addition, Brick House's Brick Burgers, including the Gun Show Burger and the Red Chili Burger, offer guests a distinct take on the traditional
burger. Brick House's beverage selection includes imports and domestic beers along with hand-pulled cask beer. Beer is served in vessels unique to our industry such as 40s and Brick
House's signature tap-at-your table beer bongs. All Brick House restaurants have a full bar that supports a variety of liquor drinks, wine and beer cocktails like the Shandy
and Bee Sting as well as specialty cocktails like the Dark & Stormy, Moscow Mule and The Zombie. For fiscal year 2011, Brick House had four full day parts with lunch, afternoon, dinner and late
night accounting for 20%, 25%, 38% and 17%, respectively, and Brick House's revenue distribution was approximately 53% food and 47% alcohol. Brick House's entrées range in price from
$8.00 to $20.00, including appetizers ordered as entrées.
Continuous
menu innovation is a key strategy for Brick House Tavern+Tap. We revise the Brick House Tavern+Tap menu twice a year with design, pricing and product
offerings assessed before each menu implementation. New menu offerings are created to reinforce differentiation in our appetizers, entrées and beverage offerings as part of our effort
to provide our
guests with exceptional food. Testing of new menu items is done in-restaurant before a new item is rolled system-wide.
Marketing
Over 80% of our marketing budget is invested in advertising through television (national cable, syndication and satellite), and digital
advertising (including location-based media, on-demand media as well as in the social media such as Facebook and Twitter), with the balance of the budget being spent on marketing research,
in-restaurant advertising, menus and production costs. Our marketing strategy is fact-based, using consumer insights to build brand affinity, and drive menu optimization. Our
marketing expenditures were 5.4%, 4.9% and 4.4% of revenues for the fiscal years 2009, 2010 and 2011, respectively. As a percentage of revenues, marketing and advertising costs were lower due to
greater leverage with the growth in comparable restaurant sales and the increase in the number of Brick House restaurants, which have lower marketing and advertising expenditures.
Joe's
Crab Shack advertising campaigns typically occur four times per year and are annual, seasonal and frequency-focused campaigns aimed at attracting guests and communicating new menu
items through quality-focused messaging. We engage in a national cable advertising campaign for Joe's that consists of 26 weeks on air, 14 networks, approximately 2,000 target rating points, or
TRPs, and branded partnerships. We supplement Joe's national advertising with innovative media support, including digital advertising, social media outreach, location-based mobile media,
weather-triggered advertising, free media and a Steampot Game application. The Joe's email club currently has approximately 387,000 members.
82
Table of Contents
Brick
House Tavern+Tap's marketing efforts are focused on menu innovation and local marketing initiatives. Local marketing includes events such as bike nights and pint
nights. In April 2011, we added a Happy Hour program using local sports radio, in-house promotion through check attachments, posters and banners, and social media to support the rollout.
The Brick House email club currently has over 60,000 members and has more than doubled since January 2011.
Guest Satisfaction
We use third party vendors to systematically gather, record and analyze key guest data for both of our brands. Our marketing research
tools include:
- •
- AAU, or attitude, awareness and usage surveys;
- •
- third party guest satisfaction surveys;
- •
- annual core menu studies; and
- •
- TURF, or total unduplicated reach and frequency analysis.
We
use the insights gathered from market research and data analytics to support strategic and tactical decisions. We embrace and rely on the use of market research as a tool to better
understand our business and drive improved performance. These market research and data analytics provide us with critical guest feedback that guide us to change or refine individual menu items and
implement operational initiatives to drive positive results on "Satisfaction," "Likely to Return" and "Likely to Recommend" metrics. Our AAU also guides us on changes to perception and awareness of
the Joe's Crab Shack brand when considering shifts in our marketing and advertising strategies and tactics. We believe improved performance of our menu items, in our restaurants and in the
effectiveness of our advertising is driven by understanding guest feedback and making changes accordingly.
In
particular, we use a third party vendor to conduct detailed guest satisfaction surveys of our current guests and provide comparable industry satisfaction survey data for industry
peers. Several surveys have been conducted since 2008 for Joe's Crab Shack and 11 other anonymous national and regional casual dining restaurant chains. While we are unable to confirm the extent to
which the results of the surveys represents a comparison to our primary competitors, of the 12 casual dining companies included in the population study, Joe's ranks third at 76% for overall
satisfaction (top box only) versus the leading
company at 79%. Joe's Crab Shack has been increasing its top box satisfaction scores steadily over time with a 1,300 basis improvement since August 2008.
Restaurant Operations and Shared Services
While both brands have independent field operations, we maintain a shared services platform, which handles many of the administrative
functions for both brands. We believe this provides a scalable infrastructure, which will allow us to increase our profitability and continue to grow.
Joe's Crab Shack
Joe's Crab Shack operations are currently led by one chief operating officer and two regional vice presidents. Each regional vice
president oversees seven directors of operations, who typically manage nine to ten restaurants. Restaurant-level management at Joe's typically includes a general manager, an assistant general manager,
a restaurant manager and flex managers, as required. The flex manager is an hourly employee that is trained during the off-season and may be called upon to perform a managerial role during
the peak season. Each restaurant general manager reports to one of our directors of operations. Each restaurant also has a brand ambassador that volunteers in the local community on behalf of Joe's
for group sales and fundraisers. Our restaurant managers have bonus incentives that are based on sales and restaurant-level profits.
83
Table of Contents
The
Joe's Crab Shack training has three distinct levels. Our manager training is designed to fit all manager levels from the hourly flex manager to general manager. This comprehensive
program is up to nine weeks in length, depending on the knowledge base and skill of the trainee and is both classroom and on-the-job based. Our certified trainer training is a
special workshop designed to develop training specialists that reside in a restaurant or market that can oversee the training programs in that area. In order to be a certified trainer, candidates must
be a fully validated hourly team member with recommendations from their general manager and director of operations. Hourly trainees are orientated by the general manager of their home restaurant with
their program, schedule of activities and on-the-job training then set by the certified trainer. Through the training process, hourly trainees will attend classroom sessions,
take examinations,
watch videos and work along side a certified trainer or a highly recommended individual that reports back to the certified trainer on performance and progress.
Brick House Tavern+Tap
The Brick House team is led by a chief operating officer who oversees three directors of operations who, in turn, each manage five to
seven restaurants. Typical restaurant management includes a general manager, service manager, back-of-the-house manager, whom we refer to as our "executive chef,"
and bar manager. Brick House Tavern+Tap restaurant managers have bonus incentives that are based on sales and restaurant-level profits.
Our
training programs are seven weeks for all salaried managers and one to two weeks for all hourly positions. Our new hire training program is conducted by in-house trainers
who have been certified by our restaurant lead trainer. At the end of training, there is a comprehensive written test and an on-the-job training review that must be completed
before permission to work independently is granted.
Shared Services
Both Joe's Crab Shack and Brick House Tavern+Tap are supported by our Restaurant Support Center located in Houston, Texas.
The Restaurant Support Center provides support services to both brands including marketing, menu development, accounting, real estate and development, human resources, legal, purchasing and
information systems. We believe our Restaurant Support Center allows us to leverage our scale and share best practices across key functional areas that are common to both of our brands.
Site Selection
Over the next several years, we intend to focus our development strategy for Joe's Crab Shack on new locations in narrowly defined
geographic regions with high population density and a propensity for seafood and in close proximity to regional and national tourist attractions. Our development strategy for Brick House
Tavern+Tap is largely intended to focus on opening new locations in the top 50 designated market areas across the country.
We
have a dedicated development team that takes an analytical, data-driven approach to selecting new sites, which is largely based upon, but not limited to, the following
criteria:
- •
- with respect to Joe's, attractiveness of locations from a regional/national and/or "destination market" perspective;
- •
- local market demographics and psychographic profiles;
- •
- characteristics similar to our most successful existing restaurants;
- •
- regional consumer trends and preferences;
- •
- local performance of nationally branded peers;
84
Table of Contents
- •
- vehicle traffic patterns, visibility and access;
- •
- occupancy rates and other performance data from local hotels and other retail establishments, offices and other
establishments that draw restaurant traffic;
- •
- available square footage, parking and lease economics;
- •
- local investment and operating costs; and
- •
- development and expansion constraints.
Restaurant Development and Economics
We have experienced in-house real estate and development capabilities. Beginning fiscal year 2010, we have opened eleven
Joe's using our new prototype, and beginning fiscal year 2008, we have opened 17 Brick House locations across the United States. The average investment, including build-out costs and pre-opening
costs, for our seven new Joe's and four new Brick House restaurants opened during the fiscal year ended January 2, 2012, was $3.3 million and $2.8 million, respectively. A
majority of the Joe's Crab Shack restaurants opened during this period of time were newly developed and built restaurants. Conversions of other existing restaurants to Joe's or Brick House typically
require less capital investment than newly developed and built restaurants. During the past three fiscal years, we have converted two Joe's Crab Shack restaurants to Brick House restaurants, and we
are currently in the process of converting one Brick House restaurant to a Joe's Crab Shack restaurant. Over the longer term, we expect the mix of conversions and newly developed restaurants to be
roughly equivalent. As we continue to develop new Brick House restaurants, we expect our build-out, pre-opening and other new restaurant development costs to moderate. Accordingly, our
targets for build-out costs and pre-opening costs for typical Joe's and Brick House restaurants are $3.1 million and $2.6 million, respectively.
We
target steady state new restaurant average unit volumes of approximately $3.9 million for Joe's Crab Shack and $3.2 million for Brick House, and
cash-on-cash returns, which is defined as restaurant-level profit per store divided by total build-out costs and pre-opening costs, to exceed 25%.
For
fiscal year 2012, we target opening 11 new restaurants, the vast majority of which will be new Joe's Crab Shack restaurants using our new prototype. As of March 26, 2012,
there are three Joe's Crab Shack restaurants using our new prototype that have been open for more than twelve months. For the twelve months ended March 26, 2012, the average sales volumes of
these three Joe's was approximately $4.9 million. As of March 26, 2012, there are 15 Brick House restaurants that have been open for more than twelve months. For the twelve months ended
March 26, 2012, the average sales volumes of these 15 Brick House restaurants was approximately $2.9 million. We are still in the process of optimizing the Brick House brand and
integrating key insights into future new restaurant rollout plans. Our target average sales volumes, restaurant-level profit and cash-on-cash returns levels for our new Brick House restaurants assume
performance enhancements from these initiatives. While we are refining our Brick House concept, we expect that our new restaurant growth will continue to be substantially weighted towards new Joe's
Crab Shack restaurants for the foreseeable future.
Performance
of any new restaurant location will usually differ from its originally targeted performance due to a variety of factors, and these differences may be material. New
restaurants typically encounter significant guest traffic and high sales in their initial months, which may decrease over time. Accordingly, the average sales volumes provided above for certain Joe's
and Brick House restaurants may not be indicative of their future results. Furthermore, average sales volumes of our new restaurants are impacted by a range of risks and uncertainties beyond our
control, including those described under the caption "Risk Factors."
85
Table of Contents
Restaurant Locations and Other Properties
As of March 26, 2012, we had 122 Joe's Crab Shack restaurants in 31 states and 16 Brick House Tavern+Tap
restaurants in 9 states, as shown in the chart below.
|
|
|
|
|
|
|
|
|
|
|
State
|
|
Joe's Crab Shack |
|
Brick House Tavern+Tap |
|
Total |
|
Alabama |
|
|
1 |
|
|
— |
|
|
1 |
|
Arizona |
|
|
3 |
|
|
— |
|
|
3 |
|
California |
|
|
13 |
|
|
— |
|
|
13 |
|
Colorado |
|
|
4 |
|
|
— |
|
|
4 |
|
Delaware |
|
|
1 |
|
|
— |
|
|
1 |
|
Florida |
|
|
12 |
|
|
3 |
|
|
15 |
|
Georgia |
|
|
5 |
|
|
— |
|
|
5 |
|
Idaho |
|
|
1 |
|
|
— |
|
|
1 |
|
Illinois |
|
|
4 |
|
|
2 |
|
|
6 |
|
Indiana |
|
|
3 |
|
|
— |
|
|
3 |
|
Iowa |
|
|
1 |
|
|
— |
|
|
1 |
|
Kansas |
|
|
1 |
|
|
— |
|
|
1 |
|
Kentucky |
|
|
2 |
|
|
1 |
|
|
3 |
|
Louisiana |
|
|
2 |
|
|
— |
|
|
2 |
|
Maryland |
|
|
3 |
|
|
— |
|
|
3 |
|
Michigan |
|
|
3 |
|
|
— |
|
|
3 |
|
Minnesota |
|
|
1 |
|
|
— |
|
|
1 |
|
Missouri |
|
|
3 |
|
|
1 |
|
|
4 |
|
Nevada |
|
|
2 |
|
|
— |
|
|
2 |
|
New Jersey |
|
|
4 |
|
|
1 |
|
|
5 |
|
New York |
|
|
3 |
|
|
1 |
|
|
4 |
|
North Carolina |
|
|
1 |
|
|
— |
|
|
1 |
|
Ohio |
|
|
1 |
|
|
1 |
|
|
2 |
|
Oklahoma |
|
|
3 |
|
|
— |
|
|
3 |
|
Pennsylvania |
|
|
3 |
|
|
1 |
|
|
4 |
|
South Carolina |
|
|
3 |
|
|
— |
|
|
3 |
|
Tennessee |
|
|
2 |
|
|
— |
|
|
2 |
|
Texas |
|
|
29 |
|
|
5 |
|
|
34 |
|
Utah |
|
|
2 |
|
|
— |
|
|
2 |
|
Virginia |
|
|
5 |
|
|
— |
|
|
5 |
|
Washington |
|
|
1 |
|
|
— |
|
|
1 |
|
| |
|
|
|
|
|
|
|
Total |
|
|
122 |
|
|
16 |
|
|
138 |
|
86
Table of Contents
A
summary of new restaurant openings, converted restaurant openings, restaurants permanently closed and restaurants closed for conversions during the last three fiscal years and the
period from January 3, 2012 through March 26, 2012 is provided in the table below.
|
|
|
|
|
|
|
|
|
|
|
|
|
|
|
|
|
|
Fiscal Year |
|
|
|
|
|
Period from
January 3, 2012
to March 26, 2012 |
|
|
|
2009 |
|
2010 |
|
2011 |
|
Ignite Restaurant Group |
|
|
|
|
|
|
|
|
|
|
|
|
|
| |
Restaurants at beginning of period |
|
|
116 |
|
|
119 |
|
|
126 |
|
|
135 |
|
| |
|
New restaurants opened during period |
|
|
4 |
|
|
10 |
|
|
10 |
|
|
3 |
|
| |
|
Converted restaurants opened during period |
|
|
1 |
|
|
— |
|
|
1 |
|
|
— |
|
| |
|
Restaurants permanently closed during period |
|
|
(1 |
) |
|
(2 |
) |
|
(1 |
) |
|
— |
|
| |
|
Restaurants closed for conversion during period(a) |
|
|
(1 |
) |
|
(1 |
) |
|
(1 |
)(b) |
|
— |
|
| |
|
|
|
|
|
|
|
|
|
| |
Restaurants at end of period |
|
|
119 |
|
|
126 |
|
|
135 |
|
|
138 |
|
Joe's Crab Shack |
|
|
|
|
|
|
|
|
|
|
|
|
|
| |
Restaurants at beginning of period |
|
|
114 |
|
|
114 |
|
|
113 |
|
|
119 |
|
| |
|
New restaurants opened during period |
|
|
2 |
|
|
2 |
|
|
7 |
|
|
3 |
|
| |
|
Converted restaurants opened during period |
|
|
— |
|
|
— |
|
|
— |
|
|
— |
|
| |
|
Restaurants permanently closed during period |
|
|
(1 |
) |
|
(2 |
) |
|
(1 |
) |
|
— |
|
| |
|
Restaurants closed for conversion during period(a) |
|
|
(1 |
) |
|
(1 |
) |
|
— |
|
|
— |
|
| |
|
|
|
|
|
|
|
|
|
| |
Restaurants at end of period |
|
|
114 |
|
|
113 |
|
|
119 |
|
|
122 |
|
Brick House Tavern+Tap |
|
|
|
|
|
|
|
|
|
|
|
|
|
| |
Restaurants at beginning of period |
|
|
2 |
|
|
5 |
|
|
13 |
|
|
16 |
|
| |
|
New restaurants opened during period |
|
|
2 |
|
|
8 |
|
|
3 |
|
|
— |
|
| |
|
Converted restaurants opened during period |
|
|
1 |
|
|
— |
|
|
1 |
|
|
— |
|
| |
|
Restaurants permanently closed during period |
|
|
— |
|
|
— |
|
|
— |
|
|
— |
|
| |
|
Restaurants closed for conversion during period(a) |
|
|
— |
|
|
— |
|
|
(1 |
)(b) |
|
— |
|
| |
|
|
|
|
|
|
|
|
|
| |
Restaurants at end of period |
|
|
5 |
|
|
13 |
|
|
16 |
|
|
16 |
|
| |
|
|
|
|
|
|
|
|
|
- (a)
- Represents
Joe's Crab Shack restaurants converted to Brick House restaurants or vice versa.
- (b)
- Represents
a Brick House Tavern+Tap that was closed in the fourth quarter of fiscal year 2011 for conversion into a Joe's Crab Shack restaurant
in the second quarter of fiscal year 2012.
Our Restaurant Support Center is located in Houston, Texas. We occupy this facility under a lease for approximately 25,000 square feet that
expires on October 31, 2015.
All
of our restaurant locations are leased under individual lease agreements. Leases are noncancelable and in general, have 10 to 15 year terms, with three to
five-year extensions. Only two of our leases are set to expire without provisions for renewal within the next five years and these properties are not ranked within the top third of
our restaurants. Most of our leases contain a minimum base rent, which generally have escalating base rent increases over the term of the lease. Some of our leases provide for contingent rent, which
is determined as a percentage of sales in excess of specified minimum sales levels.
Purchasing and Distribution
Our dedicated purchasing team sources, negotiates and purchases all food supplies, operating supplies, and all restaurant equipment,
furniture and fixtures. We have developed an extensive network of suppliers, with many relationships dating back over 20 years to our inception in 1991. We maintain relationships with many
suppliers and have the ability to shift purchasing among suppliers, should more favorable terms become available in the market. In addition, we maintain multiple approved suppliers for all key
components of our menu to mitigate risk and ensure supply. Suppliers are chosen based
87
Table of Contents
upon
their ability to provide (i) a continuous supply of product that meets all safety and quality specifications, (ii) logistics expertise and freight management, (iii) product
innovation, (iv) customer service, (v) transparency of business relationship and (vi) competitive pricing. Specified products are distributed to all restaurants through a national
distribution company under a negotiated contract. This distributor delivers products directly to our restaurants either two or three times per week depending on restaurant requirements. Produce is
purchased locally from an approved supplier network to maximize operating efficiencies and to ensure freshness and product quality.
Our
top selling menu items are all based on Queen Crab, Snow Crab, Dungeness Crab, King Crab, lobster and shrimp, which collectively accounted for approximately 49% of our total food
purchases in fiscal year 2011. We have established long-term relationships with key seafood vendors
and usually source product directly from producers to get advantageous product access at the most competitive prices. As market conditions warrant, we can use these relationships to lock in forward
pricing for six to 18 months. Pricing agreements are entered into for a minimum volume of product and are structured around current and historical prices and the projected menu mix. We employ a
team at the Restaurant Support Center that is solely responsible for actively managing these contracts, which typically roll on a continuous basis.
In
addition to using fixed price contracts, our Joe's menu provides inherent flexibility to help manage food cost built into the menu. Crab is deliberately placed center stage as a
defining item to the Joe's experience. Joe's Steampot and Crab in a Bucket offerings allow guests to choose between four varieties of crabs (Queen, Snow, Dungeness and King) and Maine lobster. Each of
these species has multiple fisheries and seasons. In addition to the ability to direct guests to other crab varieties, Steampots, the top selling item on the menu, provide additional product
flexibility. The Steampot is a variety of both shellfish and non-seafood items served together in a simmering pot that have individual ingredients that can be adjusted based on prevailing
market prices and general input availability. We believe this strategy greatly reduces our reliance on individual inputs and is largely opaque to the guest. In addition, should input prices increase,
we have the ability to adjust menu prices very quickly, even within a few days, if appropriate.
Crab
is harvested during seasons and in accordance with regulations which are determined by various regulatory agencies. Crab is processed, frozen and shipped to either cold storage or
to the master distributor. The master distributor fulfills restaurant orders by delivering frozen crab, which our restaurants store in a frozen state until preparation for service to the guest. We
believe our strong supplier relationships, coupled with the inherent flexibility of our menu, minimizes our exposure to seafood supply chain shortages and market price increases. Cost of sales as a
percentage of revenues for fiscal year 2009 through fiscal year 2011 were 29.2%, 29.6%, and 31.5%, respectively. The increase in cost of sales as a percentage of revenues in 2011 was primarily because
of increased crab prices. The impact of some of these increases was partially offset by certain fixed priced supply contracts for hard shell crab during the first half of fiscal year 2011. We
anticipate our food costs will remain high through 2012 before moderating towards mean historical prices. In fiscal year 2011, our largest supplier accounted for 16% of our total food purchases.
Food Safety
We have food safety and quality assurance programs which are designed to ensure that our restaurant team members and managers are
trained in proper food handling techniques. Our restaurants operate in various municipalities, which requires the Company to have systems in place to adhere to various locals standards. With the goal
of achieving industry leadership in the area of food safety and sanitation, we have implemented a national operating standard, which includes comprehensive, unannounced inspections by a third party
service provider. Restaurant managers receive feedback and coaching as an integral part of the semi-annual visits to each restaurant.
88
Table of Contents
Our
operations, procurement and culinary teams work in close coordination to exceed industry standards. Our procurement team works to ensure that product fulfillment fits to the
specifications set by our culinary experts. This process requires that our seafood products are caught, produced or processed in environments that meet and often exceed legal requirements. Our
culinary team works to use products that are safe for processing and handling in our restaurants' environment. Our training team provides both proprietary and non-proprietary materials and
programs to educate salaried and hourly team members, while our operations team implements programs and sets standards for measurement of performance to ensure consistent performance at our
restaurants.
We
require all of our suppliers to agree to adhere to strict Hazard Analysis and Critical Control Points, or HACCP, quality control and environmental standards in the development,
harvest, catch, and production of food products. Management requires chemical, physical and microbiological testing of seafood and other commodities for conformance to safety and quality requirements.
All
potential suppliers are required to meet minimum standards to achieve approved supplier status for the Ignite system.
Information Systems and Restaurant Reporting
All of our restaurants use computerized management information systems, which are designed to improve operating efficiencies, provide
restaurant and Restaurant Support Center management with timely access to financial and operating data and reduce administrative time and expense. Our integrated management information systems
platform is a combination of in-house and outsourced systems. The major management information systems are divided by function:
- •
- restaurant point-of-sale;
- •
- restaurant back-of-house;
- •
- financial;
- •
- payroll/human resources; and
- •
- internal operational reports.
All
of our restaurants are equipped with computerized point-of-sale, or POS, and back-of-house systems. We use a third party vendor for
our restaurant POS System. We have the ability to generate weekly and period-to-date operating results on a company-wide, brand-wide, regional and/or
individual restaurant basis. Together, this allows us to closely monitor sales, food and beverage costs and labor and operating expenses at each of our restaurants. Our system was updated in 2010 and
runs on non-proprietary hardware with open architecture, intuitive touch screen interface and integrated credit and gift card processing. All systems comply with all payment card industry
security standards for processing of credit and gift cards. Our back-of-house systems include a kitchen display system for many of our restaurants. These systems also run on
non-proprietary hardware with open architecture.
We
contract with a third party service provider for outsourced business process services that include accounts payable, general ledger and internal financial reporting. Our third party
service solution provides a complete web-based reporting package allowing for detailed profit and loss visibility at the restaurant-level. Our accounting department prepares period and
year-to-date profit and loss statements, which provide a detailed analysis of sales and costs, and which are compared to budgets and to prior periods. Additionally, we use
outsourced payroll processing and human resources information systems. These outsourced systems support standard payroll functions as well as hiring, promotion, and benefits administration.
89
Table of Contents
Employees
As of March 31, 2012, we employed approximately 10,900 employees, of whom 119 were Restaurant Support Center, executive
management and multi-unit restaurant management personnel, 462 were restaurant-level management personnel and the remainder were hourly restaurant personnel. During 2011, total employee
counts ranged from 11,700 during peak summer season to 8,000 during the winter. None of our employees are covered by collective bargaining agreements, and we believe we have good relations with our
employees.
Competition
The restaurant industry is fragmented and intensely competitive. We believe guests make their dining selection based on a variety of
factors such as menu offering, taste, quality and price of food offered, perceived value, service, atmosphere, location and overall dining experience. Our competitive landscape includes
nationally-branded restaurant chains as well as regional and local restaurant operators. According to Technomic, the largest three competitors in the full-service restaurant segment accounted for less
than 7% of the market share.
For
Joe's Crab Shack, our primary competitors in the casual seafood segment include Red Lobster, Bonefish Grill, Landry's and Bubba Gump Shrimp Company. Joe's is America's only national
crab house. Red Lobster is our only large-scale, nationally branded seafood competitor. Both brands also compete with a broader range of other casual dining restaurants including newer brands such as
BJ's Restaurants, Yard House, Cheesecake Factory, Bravo Brio and Buffalo Wild Wings, as well as traditional brands such as Applebee's, Chili's, T.G.I. Friday's, Texas Roadhouse and Outback
Steakhouse.
Seasonality
There is a seasonal component to Joe's Crab Shack's business which typically peaks in the summer months (June, July and August) and
slows in the winter months (November, December, January). Because of the seasonality of our system-wide business, results for any fiscal quarter are not necessarily indicative of the
results that may be achieved for future fiscal quarters or for the full fiscal year.
Trademarks and Service Marks
Our registered trademarks and service marks include Joe's Crab Shack® and the design, our stylized logos set forth on the
cover and back pages of this prospectus and Brick House Tavern+Tap® and the design. We have used or intend to use all the foregoing marks in connection with our restaurants. We
believe that our trademarks and service marks have significant value and are important to our brand-building efforts and identity and the marketing of our restaurant brand.
Licensing Arrangements
In addition to our Joe's Crab Shack restaurant operations, we have recently established a licensing initiative to provide branded
seafood options under the Joe's Crab Shack brand at various retailers. We receive royalty revenues in connection with the license of the Joe's Crab Shack brand name based on a percentage of product
sales, subject to a minimum royalty requirement. We believe that this initiative further enhances Joe's Crab Shack brand awareness to prospective guests of our Joe's Crab Shack restaurants.
We
also receive royalty revenues from a license granted to Landry's in connection with the Landry Acquisition for two Joe's Crab Shack restaurants. The license allows Landry's to use
certain of our intellectual property, including the Joe's Crab Shack name, to operate its two restaurants. Under the license, we receive royalty revenues based on a percentage of sales at such
restaurants. We do not receive any revenues from the operation of the restaurants other than license royalty revenues, and
90
Table of Contents
such
restaurants are operated by Landry's entirely independent from our Joe's Crab Shack restaurants. Although Landry's is required to adhere to certain minimum quality standards under the license,
including with respect to menu, promotional materials and the specification and preparation of food and beverage items, we do not have operational control over such restaurants, and they may not be
operated in a manner consistent with the standards we uphold at our restaurants.
Government Regulation
We are subject to a variety of federal, state and local laws. Each of our restaurants is subject to permits, licensing and regulation
by a number of government authorities, relating to alcoholic beverage control, health, safety, sanitation, building and fire codes, including compliance with the applicable zoning, land use and
environmental laws and regulations. Difficulties in obtaining or failure to obtain required licenses or approvals could delay or prevent the development of a new restaurant in a particular area.
Alcoholic
beverage control regulations require each of our restaurants to apply to a state authority and, in certain locations, county or municipal authorities for a license that
typically, must be renewed annually and may be revoked or suspended for cause at any time. Alcoholic beverage control regulations affect many aspects of restaurant operations, including minimum age of
patrons and employees, hours of operation, advertising, trade practices, wholesale purchasing, inventory control and handling, storage and dispensing of alcoholic beverages.
We
are subject in certain states to "dram shop" statutes, which generally provide a person injured by an intoxicated person the right to recover damages from an establishment that
wrongfully served alcoholic beverages to the intoxicated person. We carry liquor liability coverage as part of our comprehensive general liability insurance policy.
Our
restaurant operations are also subject to federal and state laws governing employment (including the Fair Labor Standards Act of 1938, the Immigration Reform and Control Act of
1986), including such matters as the minimum hourly wage, unemployment tax rates, sales tax and similar matters. Significant numbers of our service, food preparation and other personnel are paid at
rates related to the federal minimum wage, which currently is $7.25 per hour. The tip credit allowance is the amount an employer is permitted to assume an employee receives in tips when the employer
calculates the employee's hourly wage for minimum wage compliance purposes. Increases in the federal minimum wage, directly or by either a decrease in the tip credit amount or an insufficient increase
in the tip credit amount to match an increase in the federal minimum wage, would increase our labor costs.
In
addition, our restaurants must comply with the applicable requirements of the ADA and related state accessibility statutes. Under the ADA and related state laws, we must provide
equivalent service to disabled persons and make reasonable accommodation for their employment, and when constructing or undertaking significant remodeling of our restaurants, we must make those
facilities accessible.
We
are also subject to laws and regulations relating to nutritional content, nutritional labeling, product safety, menu labeling and other regulations imposed by the FDA, including the
newly enacted Food Safety Modernization Act. Regulations relating to nutritional labeling may lead to increased operational complexity and expenses and may impact our sales.
Litigation
Occasionally, we are a defendant or otherwise involved in lawsuits arising in the ordinary course of our business including claims
resulting from "slip and fall" accidents, "dram shop" claims, construction-related disputes, employment-related claims, and claims from guests or employees alleging illness, injury or other food
quality, health or operational concerns. When the potential liability can be estimated and the loss is considered probable, we record the estimated loss. Due to uncertainties related to the resolution
of lawsuits and claims, the ultimate outcome may differ from our estimates. As of the date of this prospectus, we do not believe the potential exposure with respect to any of these pending lawsuits
and claims will have a material adverse effect on our consolidated financial position, results of operations or cash flows.
91
Table of Contents
MANAGEMENT
Set forth below are the name, age, position and a description of the business experience of each of our executive officers, directors
and other key employees as of March 26, 2012:
|
|
|
|
|
|
Name
|
|
Age |
|
Position(s) |
Raymond A. Blanchette, III |
|
|
45 |
|
President, Chief Executive Officer and Director |
Jeffrey L. Rager |
|
|
51 |
|
Senior Vice President, Chief Financial Officer and Director |
James F. Mazany |
|
|
44 |
|
Senior Vice President and Chief Operating Officer, Joe's Crab Shack |
James W. Kuhn |
|
|
50 |
|
Senior Vice President and Chief Operating Officer, Brick House Tavern+Tap |
Kevin T. Cottingim |
|
|
54 |
|
Senior Vice President and Chief Administrative Officer |
Robin N. Ahearn |
|
|
42 |
|
Senior Vice President and Chief Marketing Officer |
Edward W. Engel |
|
|
61 |
|
Senior Vice President, General Counsel and Director |
Edward J. McGraw |
|
|
48 |
|
Senior Vice President, Development |
Ellen J. Clarry |
|
|
57 |
|
Senior Vice President, Quality Assurance and Global Supply Chain |
Richard P. Bermingham |
|
|
72 |
|
Director Nominee |
John F. Gilbert III |
|
|
55 |
|
Director Nominee |
Zane Leshner |
|
|
69 |
|
Director Nominee |
Brian N. Cherry |
|
|
37 |
|
Director Nominee |
Paul R. Vigano |
|
|
39 |
|
Director Nominee |
Background of Executive Officers and Directors
Raymond A. Blanchette, III has served as our President and Chief Executive
Officer since joining Ignite in May 2007. Prior to joining Ignite, Mr. Blanchette served as President and Chief Operating Officer for Pick Up Stix, a leader in the quick-casual dining segment
from April 2006. Mr. Blanchette also held multiple leadership positions both domestically and internationally during his 18-year tenure with Carlson Restaurants Worldwide
(T.G.I. Friday's and Pick Up Stix), or "Carlson Restaurants," including Executive Director of International Business. Mr. Blanchette has more than two decades of restaurant experience
and was the voluntary Chairman of the Great American Dine Out, an annual charity event sponsored by Share Our Strength, a non-profit organization which brings together thousands of
restaurants nationwide to raise funds to end childhood hunger in America. Mr. Blanchette holds an M.B.A. from Southern Methodist University in Dallas, Texas.
As
a result of these and other professional experiences, Mr. Blanchette brings to the board, among other skills and qualifications, his significant knowledge and understanding of
the industry, specifically the casual dining segment, and his extensive associations in the restaurant industry.
Jeffrey L. Rager has served as our Senior Vice President and Chief Financial Officer since joining Ignite in March 2008. Prior to
joining Ignite, Mr. Rager served as Vice President, Finance for Limited Brands, Inc., a parent company of various retail brands, leading the global finance, planning and analysis function for
Mast, Inc., a subsidiary of Limited Brands. Prior to Limited Brands, Mr. Rager spent eight years at Yum! Brands, leading the finance and cross-functional operations teams. Mr. Rager also
held positions at Accenture, where he advised clients on developing business strategies in the consumer products and consumer durables industries, and KPMG. Mr. Rager holds an M.B.A. from the
Kellogg Graduate School of Management at Northwestern University, and a B.S. in business administration from Miami University in Oxford, Ohio.
92
Table of Contents
As
a result of these and other professional experiences, Mr. Rager brings to the board, among other skills and qualifications, his extensive knowledge of and experience in the
financial, consumer brands and restaurant fields.
Mr. Rager
has agreed to resign from our board of directors immediately prior to the effectiveness of the registration statement of which this prospectus forms a part.
James F. Mazany has served as our Senior Vice President and Chief Operating Officer of Joe's Crab Shack since December 2010. He
joined Ignite in July 2007 and initially served as Regional Vice President for the East Coast and then served as our Senior Vice President of Operations for Joe's Crab Shack. Prior to joining Ignite,
Mr. Mazany served as Vice President of Operations for Apple Gold Group, the second largest Applebee's franchise group, since July 2005. Mr. Mazany has over 25 years of restaurant
experience, which includes serving as Director of Operations for T.G.I. Friday's, where he oversaw the highest volume T.G.I. Friday's market in the country.
James W. Kuhn has served as our Senior Vice President and Chief Operating Officer of Brick House Tavern+Tap since
December 2010. He initially joined Ignite in July 2007 and initially served as our Vice President of Operations and then as our Senior Vice President of Growth and Technology as of February 2009 until
his appointment as Senior Vice President and Chief Operating Officer of Brick House Tavern+Tap. Prior to joining Ignite, Mr. Kuhn served as Regional Vice President for Ruby
Tuesday's since May 2005, where he was responsible for improvement in key areas including sales growth, people development, margin and facilities. Mr. Kuhn has more than 35 years of
restaurant experience, including serving as Vice President of Operations for Sbarro's, and as a Regional Vice President for Bertucci's restaurants. Mr. Kuhn holds B.S. degrees in accounting and
management from Jacksonville University.
Kevin T. Cottingim has served as our Senior Vice President and Chief Administrative Officer since December 2010.
Mr. Cottingim joined Ignite in December 2008 and initially served as Senior Vice President, Human Resources. Mr. Cottingim is responsible for all aspects of Ignite's human resources and
information technology functions. Prior to joining Ignite, Mr. Cotttingim served as Vice President of Human Resources for Pick Up Stix from April 2006. Mr. Cottingim has extensive
restaurant industry experience having held various leadership positions with Carlson Restaurants, Darden Restaurants and Batrus Hollweg, a firm that specializes in providing consulting services to the
restaurant industry. Currently, Mr. Cottingim serves on the board of directors of the Women's Foodservice Forum, where he is also co-chair of the H.R. Advisory Council.
Mr. Cottingim holds an M.B.A. from the University of Central Florida, a master's degree in psychology from the University of Southern Mississippi, and a bachelor's degree in psychology from
Sophia University in Tokyo, Japan.
Robin N. Ahearn has served as our Senior Vice President and Chief Marketing Officer since December 2010. Ms. Ahearn joined
Ignite in April 2007 and initially served as our Vice President of Marketing in charge of marketing and menu development and then as our Senior Vice President of Marketing as of January 2010. Prior to
joining Ignite, Ms. Ahearn served in several different leadership capacities, including as Media and National Campaign Director, for Applebee's International, Inc., where she was employed since
July 1998. Ms. Ahearn has a broad range of marketing, advertising and media experience. Ms. Ahearn worked for the Associates Financial Services Corporation, where she managed the
campaign to introduce home equity lending to the consumer, and for TracyLocke, a marketing agency, where she handled the Pepsi core brands and the new products account. She also managed the
in-house media department for Michaels Stores, Inc., the largest arts-and-crafts retailer in the country. Ms. Ahearn is the voluntary Chairperson of the
Marketing Advisory Board for Great American Dine Out. Ms. Ahearn holds an M.B.A. from Texas Christian University in Fort Worth, Texas, and a bachelor's degree in radio, television and film from
Baylor University in Waco, Texas.
Edward W. Engel has served as our Senior Vice President and General Counsel since January 1, 2010. He initially joined Ignite in
November 2006 and served as our Vice President and General
93
Table of Contents
Counsel.
Prior to joining Ignite, Mr. Engel spent five years as Associate Counsel for Landry's Restaurants, Inc., working primarily in the areas of mergers and acquisitions, real estate and
international franchises. Mr. Engel has more than 30 years of legal experience, which includes functioning as Chief Legal Counsel to Rainforest Cafe, Inc. and as a member of the board of
directors of companies in England, Japan and Hong Kong. Additionally, he has successfully negotiated franchise agreements throughout the Middle East. Mr. Engel is a current member of the Texas
College of Real Estate Attorneys and a former member of the College of the State Bar. Mr. Engel holds a J.D. from the South Texas College of Law and a B.B.A. from the University of Texas at
Austin. Upon graduation from college, Mr. Engel was commissioned as a 2nd Lt. in the United States Army and is an honor graduate of the U.S. Army Quartermaster Officer Basic School.
As
a result of these and other professional experiences, Mr. Engel brings to the board, among other skills and qualifications, his extensive knowledge and experience in the legal,
regulatory and real estate fields based on his more than 30 years of experience as an attorney.
Mr. Engel
has agreed to resign from our board of directors immediately prior to the effectiveness of the registration statement of which this prospectus forms a part.
Edward J. McGraw has served as our Senior Vice President of Development since December 2010. He joined Ignite in July 2009 and
served as our Vice President of Development. Mr. McGraw has over 20 years of business experience with a focus on restaurant real estate and legal matters. Prior to joining Ignite,
Mr. McGraw held senior level development positions with Carlson Restaurants, Wagamama and David's Bridal. Mr. McGraw is an attorney with civil litigation experience. Mr. McGraw
holds a J.D. from Widener University School of Law, where he graduated cum laude and was a member of the law review, and an M.B.A. and B.A. from the
State University of New York at Buffalo.
Ellen J. Clarry has served as our Senior Vice President of Quality Assurance and Global Supply Chain since January 2012.
Ms. Clarry joined Ignite in November 2006. She initially served as our Director of Purchasing, then the Vice President of Quality Assurance and Global Supply Chain. Ms. Clarry leads all
aspects of supplier quality assurance and Ignite's global supply chain. Ms. Clarry has more than thirty years of product development and management, quality assurance, planning, pricing, and
procurement experience in the restaurant and food processing industries. Prior to joining Ignite, Ms. Clarry held leadership roles with Tyson Foods, Ventura Foods, Carlson Restaurants
Worldwide, S&A Restaurant Corp. and Ingredient Technology Corporation. Ms. Clarry holds a B.A. from Excelsior College.
Richard P. Bermingham has been nominated, and has agreed to serve, as a member of our board of directors upon completion of this
offering. Mr. Bermingham is currently retired, with over 40 years of business experience. Since 1994, Mr. Bermingham has been engaged in real estate development and investing
activities as a private investor. Prior to his retirement, Mr. Bermingham worked for Collins Food International, Inc. (now known as Worldwide Restaurant Concepts, Inc.), which was acquired by
Sizzler International, Inc., from 1967 to 1994. He served as the Chief Executive Officer and a member of the board of directors of Collins Food International, Inc. from 1987 to 1994.
Mr. Bermingham currently serves as a director of Herbalife Ltd., a global network marketing company that sells weight management, nutritional supplement, energy, sports & fitness
products and personal care products. Mr. Bermingham currently serves as a director of several private companies, including Special Value Expansion Fund, LLC. Mr. Bermingham was a
certified public accountant and holds a Bachelor of Science degree from the University of Colorado.
Mr. Bermingham's
experience as chief executive officer at a publicly-traded company in the restaurant and food service industries provided him valuable and relevant experience as
a senior executive and an understanding of the restaurant and food service industries, as well as significant experience dealing with consumer marketing, financings, mergers, acquisitions, domestic
expansion and
94
Table of Contents
leadership
of complex organizations and provides him with the qualifications and skills to serve as a director.
John F. Gilbert III has been nominated, and has agreed to serve, as a member of our board of directors upon completion of
this offering. Mr. Gilbert has served as the President and Chief Executive Officer of Vermont Teddy Bear Company since February 2009. From January 2007 to February 2009, he was the Executive
Vice President and Chief Marketing Officer of The TJX Companies, Inc. Prior to that time, Mr. Gilbert held senior marketing positions with Dunkin' Brands, Inc., YUM! Brands, Inc. and Carlson
Restaurants Worldwide, Inc. Mr. Gilbert currently serves as a director of Famous Dave's of America, Inc., a nationwide chain of casual dining restaurants. Mr. Gilbert holds a Bachelor of
Arts from the University of Maine and an M.B.A from the University of Louisville.
Mr. Gilbert's
experience as chief executive officer and senior marketing executive in the e-commerce, retail and restaurant industries provided him valuable and
relevant experience in brand management, advertising, consumer strategy and leadership of complex organizations and provides him with the qualifications and skills to serve as a director.
Zane Leshner has been nominated, and has agreed to serve, as a member of our board of directors upon completion of this offering.
Mr. Leshner has served as a restaurant and food service industry consultant since 1997. Throughout his 40 year career, Mr. Leshner has served in a variety of domestic and
international executive positions with Burger King, Taco Bell, California Pizza Kitchen and also developed start-up restaurant concepts. Mr. Leshner holds a Bachelor of Science
degree in Economics from Western Michigan University and a Juris Doctor from Memphis State University.
Mr. Leshner's
experience as a senior executive officer and senior legal counsel in the restaurant and food service industries provided him valuable and relevant experience in
brand management, as well as significant experience dealing with domestic expansion, strategic planning and leadership of complex organizations and provides him with the qualifications and skills to
serve as a director.
Brian N. Cherry has been nominated, and has agreed to serve, as a member of our board of directors upon completion of this
offering. Mr. Cherry is a Managing Director of J.H. Whitney, a Connecticut-based private equity firm, where he has worked since 2000. Prior to joining J.H. Whitney, he was an
investment professional with Cornerstone Equity Investors and prior to that he was a member of the merchant banking group at Donaldson, Lufkin & Jenrette, Inc. Mr. Cherry holds an A.B
from Princeton University and an M.B.A. from The Wharton School of the University of Pennsylvania. Mr. Cherry currently serves as a director of several private companies.
Mr. Cherry
has been involved with his respective firms' investments in many branded consumer companies over the past 12 years, including all of the firm's restaurant
investments. His in-depth knowledge and industry experience, coupled with his skills in corporate finance, strategic planning and leadership of complex organizations, provides him with the
qualifications and skills to serve as a director.
Paul R. Vigano has been nominated, and has agreed to serve, as Chairman of our board of directors upon completion of this offering.
Mr. Vigano has served as Co-Managing Partner at J.H. Whitney, a Connecticut-based private equity firm, since April 2010 and has been a Managing Director since 2001.
Mr. Vigano joined J.H. Whitney in 1998. Prior to joining J.H. Whitney, he was a member of the mergers and acquisitions group at Goldman, Sachs & Co. Mr. Vigano holds
a B.B.A. degree from the University of Michigan where he graduated Phi Betta Kappa and an M.B.A. from Stanford Graduate School of Business.
Mr. Vigano
currently serves as a director of several private companies, including several consumer product companies. His in-depth knowledge and experience in the
branded consumer products industry, coupled with his skills in corporate finance, strategic planning and leadership of complex organizations, provides him with the qualifications and skills to serve
as a director.
95
Table of Contents
Each
executive officer serves at the discretion of our board of directors and holds office until his successor is elected and qualified or until his earlier death, resignation or
removal.
Corporate Governance
Our board of directors currently consists of three members, Mr. Blanchette, Mr. Engel, and Mr. Rager.
Mr. Bermingham, Mr. Gilbert, Mr. Leshner, Mr. Cherry and Mr. Vigano will join our board of directors prior to the closing of this offering. In addition,
Mr. Engel and Mr. Rager have agreed to resign from our board of directors immediately prior to the effectiveness of the registration statement of which this prospectus forms a part. Upon
completion of this offering, our board of directors will consist of six members. Our amended and restated bylaws, which we will adopt prior to the completion of this offering, will provide that our
board of directors shall consist of such number of directors as determined from time to time by resolution adopted by a majority of the total number of directors then in office. Any additional
directorships resulting from an increase in the number of directors may only be filled by the directors then in office. At each annual meeting of
stockholders, the successors to directors whose terms then expire will be elected to serve from the time of election and qualification until the third annual meeting following election or until their
earlier death, resignation or removal. Our classified board structure will continue and be in effect for at least one full election cycle so that at the fourth annual meeting of stockholders, we will
begin the process of phasing out our staggered elections.
Our
amended and restated certificate of incorporation will provide that upon completion of this offering our board of directors will be divided into three classes, with each director
serving a three-year term. Mr. Gilbert and Mr. Leshner will serve as Class I directors with an initial term expiring in 2013. Mr. Bermingham and
Mr. Blanchette will serve as Class II directors with an initial term expiring in 2014. Mr. Cherry and Mr. Vigano will serve as Class III directors with an initial
term expiring in 2015. Any additional directorships resulting from an increase in the number of directors will be distributed among the three classes so that, as nearly as possible, each class will
consist of one-third of the total number of directors.
At
our 2013 annual meeting of stockholders, the Class I directors will be elected for a term expiring at the 2016 annual meeting of stockholders. At the 2014 annual meeting of
stockholders, the Class II directors will be elected for a term expiring at the 2016 annual meeting of stockholders. At the 2015 annual meeting of stockholders, the Class III directors
will be elected for a term expiring at the 2016 annual meeting of stockholders. Beginning with the 2016 annual meeting of stockholders, directors will be elected for a term expiring at the next annual
meeting of stockholders and until his or her successor shall be elected and qualified, subject, however to prior death, resignation, retirement, disqualification or removal from office.
Our
board of directors has determined that Messrs. Leshner, Bermingham and Gilbert are "independent" as such term is defined by The NASDAQ Stock Market, corporate governance
standards and the federal securities laws.
Upon completion of this offering, J.H. Whitney VI will continue to control a majority of the voting power of our
outstanding common stock. As a result, we will be a "controlled company" under The NASDAQ Stock Market corporate governance standards. As a controlled company, exemptions under
96
Table of Contents
the
standards will free us from the obligation to comply with certain corporate governance requirements, including the requirements:
- •
- that a majority of our board of directors consists of "independent directors," as defined under the rules of The NASDAQ
Stock Market;
- •
- that we have a corporate governance and nominating committee that is composed entirely of independent directors with a
written charter addressing the committee's purpose and responsibilities;
- •
- that we have a compensation committee that is composed entirely of independent directors with a written charter addressing
the committee's purpose and responsibilities; and
- •
- for an annual performance evaluation of the nominating and governance committees and compensation committee.
These
exemptions do not modify the independence requirements for our Audit Committee, and we intend to comply with the requirements of Rule 10A-3 of the Exchange Act
and the rules of The NASDAQ Stock Market within the applicable time frame.
Prior to the completion of this offering, our board of directors will establish an Audit Committee, a Compensation Committee and a
Nominating and Corporate Governance Committee. Each of the committees will report to the board of directors as they deem appropriate, and as the board may request. The expected composition, duties and
responsibilities of these committees are set forth below. In the future, our board may establish other committees, as it deems appropriate, to assist it with its responsibilities.
The Audit Committee will be responsible for, among other matters: (i) appointing, compensating, retaining, evaluating,
terminating and overseeing our independent registered public accounting firm; (ii) discussing with our independent registered public accounting firm their independence from management;
(iii) reviewing with our independent registered public accounting firm the scope and results of their audit; (iv) approving all audit and permissible non-audit services to be
performed by our independent registered public accounting firm; (v) overseeing the financial reporting process and discussing with management and our independent registered public accounting
firm the interim and annual financial statements that we file with the SEC; (vi) reviewing and monitoring our accounting principles, accounting policies, financial and accounting controls and
compliance with legal and regulatory requirements; (vii) establishing procedures for the confidential anonymous submission of concerns regarding questionable accounting, internal controls or
auditing matters; and (viii) reviewing and approving related person transactions.
Upon
completion of this offering, our Audit Committee will consist of Messrs. Cherry, Bermingham and Gilbert. The SEC rules and The NASDAQ Stock Market rules require us to have
one independent Audit Committee member upon the listing of our common stock on The NASDAQ Global Select Market, a majority of independent directors within 90 days of the date of the completion
of this offering and all independent Audit Committee members within one year of the date of the completion of this offering. Our board of directors has affirmatively determined that
Messrs. Bermingham and Gilbert meet the definition of "independent directors" for purposes of serving on an Audit Committee under applicable SEC and The NASDAQ Stock Market rules, and we intend
to comply with these independence requirements within the time periods specified. In addition, Mr. Bermingham will qualify as our "audit committee financial expert," as such term is defined in
Item 401(h) of Regulation S-K.
97
Table of Contents
Our
board of directors will adopt a written charter for the Audit Committee, which will be available on our corporate website at www.igniterestaurants.com upon the completion of this offering. Our website
is not part of this prospectus.
The Compensation Committee will be responsible for, among other matters: (i) reviewing key employee compensation goals,
policies, plans and programs; (ii) reviewing and approving the compensation of our directors, chief executive officer and other executive officers; (iii) reviewing and approving
employment agreements and other similar arrangements between us and our executive officers; and (iv) administering our stock plans and other incentive compensation plans.
Upon
completion of this offering, our Compensation Committee will consist of Messrs. Vigano and Leshner. Our board of directors has affirmatively determined that
Mr. Leshner meets the definition of an "independent director" for purposes of serving on a compensation committee under applicable SEC and The NASDAQ Stock Market rules.
Our
board of directors will adopt a new written charter for the Compensation Committee, which will be available on our corporate website at www.igniterestaurants.com upon the completion of this offering.
Our website is not part of this prospectus.
Our Corporate Governance and Nominating Committee will be responsible for, among other matters: (i) identifying individuals
qualified to become members of our board of directors, consistent with criteria approved by our board of directors; (ii) overseeing the organization of our board of directors to discharge the
board's duties and responsibilities properly and efficiently; (iii) identifying best practices and recommending corporate governance principles; and (iv) developing and recommending to
our board of directors a set of corporate governance guidelines and principles applicable to us.
Upon
completion of this offering, our Corporate Governance and Nominating Committee will consist of Messrs. Vigano, Cherry and Gilbert. Our board of directors has affirmatively
determined that Mr. Gilbert meets the definition of an "independent director" for purposes of serving on a corporate governance and nominating committee under applicable SEC and The NASDAQ
Stock Market rules.
Our
board of directors will adopt a written charter for the Corporate Governance and Nominating Committee, which will be available on our corporate website at www.igniterestaurants.com upon the completion
of this offering. Our website is not part of this prospectus.
Our board of directors is currently responsible for overseeing our risk management process. The board focuses on our general risk
management strategy and the most significant risks facing us, and ensures that appropriate risk mitigation strategies are implemented by management. The board is also apprised of particular risk
management matters in connection with its general oversight and approval of corporate matters and significant transactions.
Following
the completion of this offering, our board will delegate to the Audit Committee oversight of our risk management process. Our other board committees will also consider and
address risk as they perform their respective committee responsibilities. All committees will report to the full board as appropriate, including when a matter rises to the level of a material or
enterprise level risk.
98
Table of Contents
Our
management is responsible for day-to-day risk management. This oversight includes identifying, evaluating, and addressing potential risks that may exist at
the enterprise, strategic, financial, operational, compliance and reporting levels.
Compensation Committee Interlocks and Insider Participation
None of our executive officers currently serves, or in the past year has served, as a member of the board of directors or compensation
committee of any entity that has one or more executive officers serving on our board of directors or compensation committee.
Code of Ethics
We will adopt a code of business conduct and ethics applicable to our principal executive, financial and accounting officers and all
persons performing similar functions. A copy of that code will be available on our corporate website at www.igniterestaurants.com upon completion of
this offering. We expect that any amendments to the code, or any waivers of its requirements, will be disclosed on our website. Our website is not part of this prospectus.
Director Compensation
In fiscal year 2011, none of our directors received any compensation for his services on our board of directors. In fiscal year 2011,
we paid $32,000 to each of Richard Bermingham, Zane Leshner and John Gilbert plus the reimbursement of reasonable and documented costs and expenses incurred by them in connection with attending any
meetings of the management committee or any committees thereof of our parent company, JCS Holdings, LLC.
After
completion of this offering, only independent directors will receive compensation for their participation on the board, or service as a chair or member of a Committee. For
participation on the board, each independent director will receive an annual cash retainer of $30,000 and a grant of 4,000 shares of restricted common stock subject to a one year
time-based vesting schedule. The chairs of the Audit, Compensation, and Nominating and Corporate Governance Committees will receive a supplemental annual cash retainer of $20,000, $10,000
and $7,500, respectively. In addition, each member of the Audit, Compensation, and Nominating and Corporate Governance Committees other than the chair, will receive a supplemental annual cash retainer
of $8,000, $4,000 and $3,000, respectively. Non-independent directors will receive no compensation for their participation on the board or involvement in any of it's Committees.
99
Table of Contents
EXECUTIVE COMPENSATION
Compensation Discussion and Analysis
The purpose of this compensation discussion and analysis section is to provide information about the material elements of compensation
that are paid, awarded to, or earned by, our "named executive officers," who consist of our principal executive officer, principal financial officer and our three other most highly compensated
executive officers. For fiscal year 2011, our named executive officers, were:
- •
- Raymond A. Blanchette, III, President and Chief Executive Officer;
- •
- Jeffrey L. Rager, Senior Vice President and Chief Financial Officer;
- •
- James F. Mazany, Senior Vice President and Chief Operating Officer, Joe's Crab Shack;
- •
- James W. Kuhn, Senior Vice President and Chief Operating Officer, Brick House Tavern+Tap; and
- •
- Kevin T. Cottingim, Senior Vice President and Chief Administrative Officer.
This
compensation discussion and analysis section focuses primarily on the information contained in the compensation tables below and related footnotes. We also describe compensation
actions taken for fiscal year 2012 and current expectations about future compensation program decisions to the extent that such discussion enhances the understanding of our executive compensation
program.
Overview
In November 2006, we were acquired by JCS Holdings, LLC, an entity controlled by J.H. Whitney VI. In connection
with the acquisition, J.H. Whitney VI acquired an 88.5% equity interest in our parent company, JCS Holdings, LLC, and our current and former executive officers, directors and
employees hold the remaining equity interest in our parent company, JCS Holdings, LLC. As a result of the acquisition, we are privately held and controlled by JCS Holdings, LLC, which is
controlled by J.H. Whitney VI. Our board of directors is currently comprised of two members, Raymond A. Blanchette, III, our President and Chief Executive Officer, and
Edward W. Engel, our Senior Vice President and General Counsel. Our parent company, JCS Holdings, LLC, is managed by a six member management committee, which has delegated all
compensation related responsibilities and decisions relating to us to a compensation committee. We refer to this compensation committee as the Parent Compensation Committee.
As
a privately-owned company with a relatively small board of directors, our President and Chief Executive Officer and our Senior Vice President and Chief Administrative Officer have
been responsible for recommending and determining base salary amounts and increases for executive officers (other than themselves), and have recommended the annual performance objectives under our
Management Incentive Plan to the Parent Compensation Committee for its approval. The Parent Compensation Committee has been responsible for determining the elements that comprise our executive
compensation program in general, as well as approving the annual performance objectives and individual performance objectives associated with our Management Incentive Plan and approving the equity
grants made to employees, both as described below. Most, if not all, of our prior compensation policies and determinations, including those made for fiscal year 2011, have been the product of informal
discussions between our President and Chief Executive Officer and our Senior Vice President and Chief Administrative Officer and members of the Parent Compensation Committee.
Following
the offering, we will establish a separate Company-level compensation committee to whom responsibility for administering our executive compensation program will be delegated.
With respect to periods following this offering, references to the compensation committee will be to the newly established Company-level compensation committee.
100
Table of Contents
Compensation Philosophy and Objectives
We have designed our executive compensation program to help attract talented individuals to manage and operate all aspects of our
business, to reward those individuals based upon corporate results, and to retain those individuals who continue to meet our expectations. We also intend for our executive compensation program to make
us competitive within the restaurant and foodservice industry, where there is significant competition for talented leaders who possess the skills and experience to build and deliver on
long-term value creation. We believe that the compensation of our executive officers should incentivize them to focus on the achievement of both short- and long-term business
objectives and strategies. In that regard, we have strived to create an executive compensation program that balances short-term versus long-term payments and awards, cash
payments versus equity-based awards and fixed versus contingent payments and awards in ways that we believe are most appropriate to motivate our executive officers. Our executive compensation program
is designed to:
- •
- attract and retain talented and experienced executives in our industry;
- •
- reward executives whose knowledge, skills and performance are critical to our success;
- •
- align the interests of our executive officers and stockholders by motivating executive officers to increase stockholder
value and rewarding executive officers when stockholder value increases;
- •
- motivate the executive management team by recognizing the contributions each executive makes to our success;
- •
- foster a shared commitment among executives by aligning their individual goals, where appropriate, with the goals of the
executive management team and our company; and
- •
- compensate our executives in a manner that incentivizes them to manage our business to meet our long-range
objectives.
A
significant portion of the compensation of our named executive officers has historically consisted of cash incentive compensation and, to a lesser extent, equity-based compensation
that subjects half of the award to time-based vesting provisions and the other half of the award to performance-based vesting provisions contingent upon the achievement of financial
performance metrics. These two elements of executive compensation are aligned with the interests of our stockholders because the amount of compensation ultimately received will vary with our financial
performance, encourage equity ownership and promote retention of key talent. Equity-based compensation derives its value from our equity value, which is likely to fluctuate based on our financial
performance. Payment of cash incentives is dependent on our achievement of pre-determined financial and operational objectives.
We
seek to apply a consistent philosophy to compensation for all executive officers. The compensation components described below simultaneously fulfill one or more of the above
principles and objectives
Compensation Decision-Making Process
Prior to our initial public offering, we were a privately-held company with a relatively small number of stockholders,
including our principal stockholder, J.H. Whitney VI. As a result, we were not subject to any stock exchange listing or SEC rules requiring a majority of our board of directors to be
independent or relating to the formation and functioning of board committees, including a Company-level compensation committee.
Historically,
our President and Chief Executive Officer and our Senior Vice President and Chief Administrative Officer have been responsible for recommending and determining base salary
amounts and increases for executive officers (other than themselves), and have recommended the annual
101
Table of Contents
performance
objectives under our Management Incentive Plan to the Parent Compensation Committee for its approval. The Parent Compensation Committee has been responsible for determining the elements
that comprise our executive compensation program in general, as well as approving the annual performance objectives associated with our Management Incentive Plan and approving the equity grants made
to employees, both as described below. The Parent Compensation Committee is currently comprised of Paul R. Vigano and Zane Leshner.
The
Parent Compensation Committee has historically operated somewhat informally with a written charter and has responsibility for discharging the responsibilities of our board of
directors relating to the compensation of our executive officers and related duties. We do not currently have employment agreements with any of our named executive officers. Compensation of our named
executive officers has historically been highly individualized, resulting from independent negotiations between our President and Chief Executive Officer, and to a lesser extent our Senior Vice
President and Chief Administrative Officer, and members of the Parent Compensation Committee and such individuals and based on a variety of informal factors considered at the time of the applicable
compensation decisions, including our financial condition and available resources, the need for a particular position to be filled, the length of service of the named executive officer and comparisons
to the compensation levels of our other executives.
In
addition, we informally consider the competitive market for corresponding positions of companies of similar size and stage of development operating in the restaurant and foodservice
industry and, in certain cases, outside the restaurant and foodservice industry. This informal consideration was based on the general knowledge possessed by our President and Chief Executive Officer
and our Senior Vice President and Chief Administrative Officer regarding the compensation provided to certain executive officers of other companies in our industry through informal discussions with
recruiting firms, general research and survey data and informal competitive positioning against their personal knowledge of the competitive market. As a result, our President and Chief Executive
Officer and, in the case of our President and Chief Executive Officer, members of the Parent Compensation Committee have typically reviewed the performance of each of our named executive officers on
an annual basis, which typically occurs in late-February or early-March of a given year. After informal discussions with our Senior Vice President and Chief Administrative Officer to gain
a general understanding of current compensation practices, our President and Chief Executive Officer presents compensation recommendations to the Parent Compensation Committee for its consideration
and approval, but does not make any recommendations with respect to his own compensation. The Parent Compensation Committee reviews these proposals and makes all final compensation decisions for
executive officers by exercising its discretion in accepting, modifying or rejecting any such recommendations.
We
expect that, prior to the completion of this offering, our board of directors will establish a Company-level compensation committee, and the compensation committee will undertake,
after this offering, a substantial review of our existing compensation programs, objectives and philosophy and determine whether such programs, objectives, and philosophy are appropriate for a public
company. As we gain experience as a public company, we expect that the specific direction, emphasis and components of our executive compensation program will continue to evolve. For example, over time
we may reduce our reliance upon subjective determinations made by our President and Chief Executive Officer and members of the Parent Compensation Committee in favor of a more empirically-based
approach that may involve benchmarking against peer companies. Accordingly, the compensation paid to our named executive officers for fiscal year 2010 is not necessarily indicative of how we will
compensate our named executive officers after this offering.
Each year members of our human resources department conduct an analysis of our executive compensation programs relative to those of
other comparable companies to gain a general
102
Table of Contents
understanding
of whether our executive compensation programs are competitive. For fiscal year 2010, our Senior Vice President and Chief Administrative Officer and the head of our human resources
department compiled executive compensation data from the Chain Restaurant Compensation Association Compensation Survey, The Human Capital Intelligence report published by the People Report and the Hay
Group compensation study to assist with the assessment of our compensation programs. The Chain Restaurant Compensation Association Compensation Survey included data from
approximately 125 restaurant concepts. The Human Capital Intelligence report provides compensation information on a variety of positions in the restaurant industry based upon information from 97
restaurant brands. The Hay Group compensation database contains more than seven million individual compensation related records from over 13,000 leading organizations. Our President and Chief
Executive Officer and members of the Parent Compensation Committee reviewed the data compiled by our Senior Vice President and Chief Administrative Officer and our human resources department from
these sources regarding executive compensation paid by companies against which we believe we compete for executive talent to gain a general understanding of current compensation practices.
The
compensation of each of the named executive officers was generally compared to competitive market ranges derived from the compensation programs of companies participating in the
surveys for executives with comparable positions and job responsibilities to gain a current understanding of general compensation practices. The compensation components reviewed for each position were
base salary and annual incentive award opportunity, both individually and in the aggregate. Although the survey data was used as an important measure for assessing competitive levels of compensation
for our named executive officers, we did not benchmark the compensation of our named executive officers against the companies participating in the survey. Rather, the survey data was used as a guide
to gain a general understanding of current compensation practices. Our President and Chief Executive Officer and/or members of the Parent Compensation Committee exercised their discretion in setting
both the individual compensation components and the total pay of each of our named executive officers at levels that were commensurate with their specific positions and job responsibilities, taking
into account the need to retain and motivate our named executive officers to achieve superior levels of performance.
We
anticipate that our Company-level compensation committee may more formally benchmark executive compensation against a peer group of comparable companies in the future. We also
anticipate that our Company-level compensation committee may make adjustments in executive compensation levels in the future as a result of this more formal benchmarking process.
We
have not retained a compensation consultant to assist in determining or recommending the amount or form of executive compensation, although our Company-level compensation committee
may elect in the future to retain a compensation consultant if it determines that doing so would assist it in implementing and maintaining compensation plans.
Highlights of Fiscal Year 2011 Performance
During fiscal year 2011, we achieved strong financial performance, and we believe our named executive officers were instrumental in
helping us achieve these results. Highlights of our fiscal year 2011 performance include the following:
- •
- Revenues increased $53.9 million, or 15.3%, to $405.2 million for fiscal year 2011 compared with
$351.3 million for fiscal year 2010. Comparable restaurant sales increased 6.9% during fiscal year 2011;
- •
- Net income decreased by $0.5 million to $11.3 million for fiscal year 2011 compared with net income of
$11.8 million in fiscal year 2010;
- •
- Adjusted EBITDA as a percentage of revenues decreased to 10.9% during fiscal year 2011 compared with 11.4% for fiscal year
2010; and
103
Table of Contents
- •
- We opened eleven new restaurants in fiscal year 2011. New restaurants, net of restaurants closed or converted, added
$36.3 million in revenue during fiscal year 2011.
Elements of Compensation
The following is a discussion of the primary elements of the compensation for each of our named executive officers. Compensation for
our named executive officers generally consists of the following elements:
- •
- Base Salary. A fixed cash payment intended to attract and
retain talented individuals, recognize career experience and individual performance and provide competitive compensation.
- •
- Short-Term Incentives. Our Management
Incentive Plan provides annual cash incentive opportunities based upon Company performance that is intended to promote and reward achievement of the Company's annual financial and strategic objectives
and, for certain of our named executive officers, individual performance objectives measured over the current year.
- •
- Long-Term Incentives. Historically, we have
made grants of time vesting and performance vesting units of our parent company, JCS Holdings, LLC, intended to align the executive's interests with those of our stockholders by tying value to
long-term Company performance.
- •
- Health and Welfare Benefits. Health and welfare benefits
(including medical, dental, vision, life and AD&D insurance and long-term disability insurance) are intended to provide comprehensive benefits.
- •
- Executive Perquisites. Additional benefits offered to our
named executive officers to provide competitive supplemental benefits, such as Company payment of financial counseling and tax preparation services and an automobile allowance.
Executive
compensation includes both fixed components (base salary, health and welfare benefits and executive perquisites) and variable components (annual cash incentive awards and
grants of time vesting and performance vesting units in our parent company, JCS Holdings, LLC) with the heaviest weight generally placed on the variable components. Each component is linked to
one or more of the strategic objectives listed above. The fixed components of compensation are designed to be competitive in order to induce talented executives to join our company, as well as retain
such key talent. Revisions to the fixed components of compensation occur infrequently aside from our annual salary review or upon promotions or substantial increases to the executive's scope of
responsibility. Salary increases are, in part, designed to reward executives for their management activities during the year and to maintain their level of income with respect to cost of living
increases.
The
variable compensation related to our Management Incentive Plan tied to the achievement of our annual financial objectives and is designed so that above average performance is
rewarded with above average rewards. Target annual cash incentive award levels under our Management Incentive Plan, as a percentage of base salary, are set once the executive is hired and generally
relate to his or her scope of responsibility, with revisions typically occurring upon promotions or substantial increases to the executive's scope of responsibility. Our Management Incentive Plan is
designed to align each executive's
annual goals for their respective area of responsibility with the financial goals of the entire business as set by the Parent Compensation Committee.
The
other material element to variable compensation is the grant of time vesting and performance vesting units of our parent company, JCS Holdings, LLC. We typically grant the
time vesting and performance vesting units of our parent company at the time the respective officer joins us, or if necessary to retain our executives or recognize outstanding achievement. We have not
typically made annual grants of equity-based units in our parent company. The equity-based units have had no public market and no opportunity for liquidity, making them inherently
long-term compensation. The equity-
104
Table of Contents
based
units have been used to motivate executives and employees to individually and collectively build long-term stockholder value that might in the future create a liquid market
opportunity.
A primary component of compensation of our executive officers has historically been base salary. Base salary is designed to provide our
executive officers with steady cash flow during the course of the fiscal year that is not contingent on short-term variations in our corporate performance. The base salary established for
each of our executive officers is intended to reflect each individual's responsibilities, the skills and experience required for the job, their individual performance, our business performance, labor
market conditions and competitive market salary levels.
We
do not currently have employment agreements with any of our named executive officers.
Base
salaries are reviewed during the fiscal year by our President and Chief Executive Officer and members of the Parent Compensation Committee, and salary increases typically take
effect in late-February or early March of each fiscal year, unless business circumstances require otherwise. In past years, our President and Chief Executive Officer and/or the Parent
Compensation Committee reviewed the performance of all executive officers, and based upon this review and any relevant informal competitive market data made available to him or them during the
preceding year, through informal discussions with recruiting firms, research and informal competitive positioning against our President and Chief Executive Officer and/or members of the Parent
Compensation Committee's personal knowledge of the competitive market, set the salary level for each executive officer for the coming year. Upon completion of this offering, we expect our
Company-level compensation committee will take a more significant role in this annual review and decision-making process.
As part of our annual review process, in February 2011, our President and Chief Executive Officer recommended and the Parent
Compensation Committee approved annual merit salary increases for each of Messrs. Mazany, Kuhn and Cottingim. These merit increases ranged from approximately 4.3% to 6.0% and took into account
accomplishments of each individual; for example, Mr. Mazany's management of new restaurant growth and management of the operational aspects of Joe's Crab Shack, Mr. Kuhn's contributions
and management of construction and development projects, and Mr. Cottingim's contributions in the Company's human resources functions. Mr. Mazany's salary increased from $235,828 to
$250,000; Mr. Kuhn's salary increased from $225,264 to $235,000; and Mr. Cottingim's salary increased from $220,000 to $230,000. Mr. Blanchette's salary remained the same at
$500,000, and Mr. Rager's salary remained the same at $250,000.
Due to superior performance results in the Joe's Crab Shack brand, Mr. Mazany's salary was increased to $275,000 in February
2012. Upon completion of this offering, Mr. Blanchette's base salary will increase $125,000 to $625,000 and Mr. Rager's base salary will increase $25,000 to $275,000. Base salaries for
Messrs. Kuhn and Cottingim will remain the same.
In addition to receiving base salaries, our named executive officers are eligible to earn annual incentive awards under our Management
Incentive Plan based upon the attainment of specific financial performance objectives and, for certain executives, individual performance objectives. The annual cash incentive awards under our
Management Incentive Plan are intended to offer incentive compensation by rewarding the achievement of corporate objectives linked to our overall financial results. Our President and Chief Executive
Officer and the Parent Compensation Committee have authority to
105
Table of Contents
award
annual cash incentives under our Management Incentive Plan to our executive officers. We believe that establishing annual cash incentive opportunities under our Management Incentive Plan
helps us attract and retain qualified and highly skilled executives. These annual cash incentive awards under our Management Incentive Plan are intended to reward executive officers who have a
positive impact on corporate results.
On an annual basis, or at the commencement of an executive officer's employment with us, our President and Chief Executive Officer
and/or the Parent Compensation Committee, based upon input from our Senior Vice President and Chief Administrative Officer, typically sets a target level of annual cash incentive award opportunity
under our Management Incentive Plan that is structured as a percentage of such executive officer's base salary at December 31 of each year. An executive officer's target level of annual cash
incentive award opportunity is set between 40% to 50% of his base salary. Under the terms of his May 2007 offer letter, Mr. Blanchette's target level of annual cash incentive award opportunity
may be up to 50% of his base salary. For fiscal year 2011, each of Messrs. Blanchette, Kuhn and Mazany's target annual cash incentive award opportunity was set based upon each executive's scope
of responsibility and impact upon our overall financial performance at 50%. For fiscal year 2011, each of Messrs. Rager and Cottingim's target annual cash incentive award opportunity was set
based upon each executive's scope of responsibility and impact upon our overall financial performance at 40%.
Each year the Parent Compensation Committee establishes our corporate financial performance objective and sets a threshold, target and
maximum amount with reference to achieving pre-set levels of desired financial performance, with consideration given to our annual and long-term financial plan, as well as to
macroeconomic conditions. All or part of a named executive officer's annual cash incentive award opportunity under our Management Incentive Plan is determined based upon the achievement level of the
Company's Adjusted EBITDA. See "Prospectus Summary—Summary Historical Consolidated Financial and Operating Data" for a definition of Adjusted EBITDA and reconciliation of Adjusted EBITDA
and EBITDA to net income. The Parent Compensation Committee believes this corporate performance objective reflected our overall Company goals for fiscal year 2011, which balanced the achievement of
revenue growth and improving our operating efficiency. The Parent Compensation Committee believes that this definition of Adjusted EBITDA provides a meaningful understanding of our core operating
performance and is the same financial metric used under our senior secured credit facility.
The
Parent Compensation Committee has historically attempted to maintain consistency year-over-year with respect to the difficulty of achieving the financial performance objectives under
our Management Incentive Plan. The financial performance objectives used by the Parent Compensation Committee in recent years, including fiscal year 2011, for the annual incentive awards for most of
our executive
officers (Adjusted EBITDA and their respective individual performance goals described below) are identical to or derived from our annual Adjusted EBITDA calculation under our existing senior secured
credit facility and capital expenditures budget approved at the beginning of each fiscal year by the Parent Compensation Committee. Our annual Adjusted EBITDA financial target typically increases each
year to promote continuous growth consistent with our business plan. The financial performance targets are designed to be realistic and attainable though slightly aggressive, requiring in each fiscal
year strong performance and execution that in our view provides an annual incentive firmly aligned with stockholder interests.
Depending
upon the named executive officer's position within the Company, his annual cash incentive award potential under our Management Incentive Plan is based solely on the achievement
106
Table of Contents
level
of the Company's Adjusted EBITDA, or is based on a combination of Adjusted EBITDA achievement and attainment of pre-determined individual performance objectives comprised of
operating division or business unit-specific goals to advance the strategic and operating plans of both the operating division or business unit and the Company. The level of achievement of
each performance objective is set as a percentage ranging from 40% for achieving the threshold level of the applicable performance objective, 100% for achieving the target level of the applicable
performance objective to 150% for achieving the maximum level of the applicable performance objective. The minimum level of performance must be achieved for the applicable performance objective to be
included in the annual cash incentive award. Earned individual payouts also range from 40% to 150% of target and reflect allocations based on corporate, business unit, and individual performance, as
discussed later in further detail.
Generally,
the named executive officer must be employed at the time of payment to receive such amount. In addition, our President and Chief Executive Officer and/or the Parent
Compensation Committee may adjust annual cash incentive awards due to extraordinary or nonrecurring events, such as significant financings, equity offerings or acquisitions.
For fiscal year 2011, the threshold Adjusted EBITDA amount was set at $41.5 million, the target Adjusted EBITDA amount was set
at $46.5 million and the maximum Adjusted EBITDA amount was set at $51.5 million. At the conclusion of the fiscal year, we presented our financial statements to our independent auditor
for their review. Once our independent auditor completed their audit of our financial statements, we presented our Adjusted EBITDA and our financial statements to the audit committee of our parent
company for review and approval. Once the audit committee of our parent company approved our financial statements and Adjusted EBITDA results, we then presented that information to our President and
Chief Executive Officer and the Parent Compensation Committee for review and approval. Actual Adjusted EBITDA for fiscal year
2011 was $44.1 million, slightly below the target Adjusted EBITDA amount of $46.5 million, and each of our named executive officers received an amount slightly below the target level of
this performance objective.
Messrs. Blanchette
and Rager's annual cash incentive award was solely based upon the achievement of the Adjusted EBITDA objective.
Mr. Mazany's
annual cash incentive award was based upon the achievement of the Adjusted EBITDA objective (40%) and achievement of his individual performance objective (60%), which
consisted of the attainment of a restaurant level profit of Joe's Crab Shack set at threshold, target and maximum amounts. The actual restaurant level profit of Joe's Crab Shack for fiscal year 2011
was between the targeted and maximum amounts.
Mr. Kuhn's
annual cash incentive award was based on the achievement of the Adjusted EBITDA objective (40%) and the achievement of his individual performance objective (60%), which
consisted of the attainment of a restaurant level profit of Brick House Tavern+Tap set at threshold, target and maximum amounts. The actual restaurant level profit for Brick House
Tavern+Tap for fiscal year 2011 was below the threshold amount.
Mr. Cottingim's
annual cash incentive award was based upon the achievement of the Adjusted EBITDA objective (70%) and achievement of his respective individual performance
objectives (30%), which consisted of (i) implementation of IT network improvements (15%) set at a threshold, target and maximum date for completion, and (ii) achievement of
non-seafood purchases savings (15%) set at a threshold, target and maximum amount. The IT network improvements were completed prior to the maximum date for completion, and total
non-seafood savings for fiscal year 2011 was above the maximum. Accordingly, the first individual performance objective exceeded the maximum level and the second individual performance
objective also exceeded the maximum level. However, because overall
107
Table of Contents
costs
of goods increased dramatically during 2011, the chief executive officer and the parent compensation committee reduced the maximum payout for the second objective to target.
The
table below indicates the total annual cash incentive award payment for fiscal year 2011 for our named executive officers, as well as the weighted components used to determine award
payments.
|
|
|
|
|
|
|
|
|
|
|
|
|
|
|
|
|
Name
|
|
Base Salary at
12/31/11 |
|
Target Award
as a Percentage
of Base Salary |
|
Weighting of
Adjusted EBITDA
Objective |
|
Weighting of
Individual
Performance
Objectives |
|
Actual Award
Payment |
|
Raymond A. Blanchette, III |
|
$ |
500,000 |
|
|
50 |
% |
|
100 |
% |
|
— |
|
$ |
178,175 |
|
Jeffrey L. Rager |
|
$ |
250,000 |
|
|
40 |
% |
|
100 |
% |
|
— |
|
$ |
71,270 |
|
James F. Mazany |
|
$ |
250,000 |
(a) |
|
50 |
% |
|
40 |
% |
|
60% |
(b) |
$ |
129,288 |
|
James W. Kuhn |
|
$ |
235,000 |
(c) |
|
50 |
% |
|
40 |
% |
|
60% |
(d) |
$ |
33,497 |
|
Kevin T. Cottingim |
|
$ |
230,000 |
(e) |
|
40 |
% |
|
70 |
% |
|
30% |
(f) |
$ |
80,398 |
|
- (a)
- Mr. Mazany's
salary was increased from $235,828 to $250,000 in February 2011.
- (b)
- Represents
achievement of the restaurant level profit target of Joe's Crab Shack.
- (c)
- Mr. Kuhn's
salary was increased from $225,264 to $235,000 in February 2011.
- (d)
- Represents
achievement of the restaurant level profit target of Brick House Tavern+Tap.
- (e)
- Mr. Cottingim's
salary was increased from $220,000 to $230,000 in February 2011.
- (f)
- Represents
achievement of implementation of IT network improvements (15%) and achieving targeted non-seafood savings (15%).
JCS Holdings, LLC, the sole stockholder of the Company, established a class of equity ownership units, or common units, that may
be issued to employees of the Company providing services to or for the benefit of JCS Holdings, LLC at the discretion of the Parent Compensation Committee. The Company does not have an equity
program in place and has not granted any equity awards. The common units are granted under the terms of the Third Amended and Restated Limited Liability Company Agreement of JCS Holdings, LLC,
which we refer to as the Parent LLC Agreement, and are administered by the Parent Compensation Committee.
Our
President and Chief Executive Officer and the Parent Compensation Committee believe that equity-based compensation is an important component of our executive compensation program and
that providing a significant portion of our executive officers' total compensation package in equity-based compensation aligns the incentives of our executives with the interests of our stockholders
and with our long-term corporate success. Additionally, our President and Chief Executive Officer and the Parent Compensation Committee believe that equity-based compensation awards enable
us to attract, motivate, retain and adequately compensate executive talent. To that end, the Parent Compensation Committee has awarded equity-based compensation in the form of common units of our
parent company with both a time vesting component and a performance vesting component. Our President and Chief Executive Officer and the Parent Compensation Committee believe the award of common units
of our parent company provide executives with a significant long-term interest in our success by rewarding the creation of stockholder value over time. Under the Parent LLC Agreement,
approximately 12% of the common units of our parent company have been allocated for grants of awards to our management.
Generally,
each executive officer is provided with a grant of common units of our parent company when they join our Company based upon his or her position with us and his or her relevant
prior experience. In addition to common units granted upon commencement of employment with us, our President and Chief Executive Officer and/or the Parent Compensation Committee may grant
108
Table of Contents
additional
awards to retain our executives and to recognize the achievement of corporate and individual goals and/or strong individual performance. Each grant of common units is awarded pursuant to a
unit grant agreement. In allocating the number of common units awarded to our named executive officers, each individual's compensation package is reviewed and a subjective determination of the number
of common units that would be appropriate to retain and motivate each executive officer in his position is set. A greater number of common units are granted to our more senior executives who have more
strategic responsibilities and a more direct impact on corporate results. Each unit grant agreement specifies that the common units are subject to the transfer limitations and repurchase rights
contained in the Parent LLC Agreement.
These
inducement grants typically contain both a time vesting component (relating to 50% of the common units) and a performance vesting component (relating to 50% of the common units).
The time vesting units each vest ratably over the course of five years, subject to continued employment on the vesting date, to encourage executive longevity and to compensate our executive officers
for their contribution to our success over a period of time. The performance vesting component generally provides for ratable vesting of the common units in each fiscal year that EBITDA (as defined in
our senior secured credit facility) equals or exceeds the annual target EBITDA or, if the annual target EBITDA is not achieved, the common units may vest if certain cumulative target EBITDA amounts
are achieved, each as set forth in the unit grant agreement of the recipient. See "Prospectus Summary—Summary Historical Consolidated Financial and Operating Data" for a definition of
EBITDA and reconciliation of EBITDA to net income. For fiscal year 2011, the annual target EBITDA for each named executive officer of $35.0 million was exceeded. Accordingly, the performance
vesting component of the inducement grants was satisfied and 20% of the common units for each of the named executive officers vested at fiscal year end. Over the course of fiscal years 2007, 2008 and
2009, certain of our named executive officers were awarded common units. In fiscal years 2010 and 2011, none of our named executive officers were awarded common units.
The
common units are granted with an exercise price equal to or greater than the fair market value of the common units on the applicable date of grant. To date, because there has not
been a public market for the common units, fair market value has been determined based on the good-faith determination of the Parent Compensation Committee. Upon completion of this
offering, we expect to determine fair market value for purposes of equity-based award pricing based upon the closing price of our common stock on The NASDAQ Global Select Market on the date of grant.
Historically,
the Parent Compensation Committee, in consultation with our President and Chief Executive Officer and our Senior Vice President and Chief Administrative Officer, has made
all equity-based grant decisions with respect to our executive officers, and we anticipate that, upon completion of this offering, our Company-level compensation committee will, subject to approval by
our board of directors as deemed necessary by the compensation committee, determine the size and terms
and conditions of equity grants to our executive officers in accordance with the terms of the applicable plan and will approve them on an individual basis.
Immediately after completion of this public offering, JCS Holdings, LLC, our parent company, will distribute substantially all of the shares of our common stock then held by it
and/or the cash proceeds received in this public offering to the holders of its Series A preferred units and its common units, including those held by our named executive officers, in
accordance with the provisions then in effect of the Parent LLC Agreement. In connection with this subsequent distribution by JCS Holdings, LLC, our named executive officers will receive
$2,026,206 for the sale of common stock in this offering and 1,191,300 shares of our common stock pursuant to the terms of the Parent LLC Agreement for their remaining vested common units,
based upon a price of $13.00 per share, the midpoint of the price range set forth on the cover page of this prospectus. JCS Holdings, LLC will thereafter continue to hold 147,525 shares
of our common stock, based upon an initial public offering price of $13.00 per share, the midpoint of the price range set forth on the cover page of this prospectus, equal to less than
109
Table of Contents
one percent of our outstanding common stock for the benefit of certain of our named executive officers who will continue to hold unvested common units in JCS Holdings, LLC upon
consummation of this offering.
Messrs.
Blanchette, Rager, Mazany, Kuhn, and Cottingim are expected to receive grants, contingent upon the closing of this offering, of stock appreciation rights as follows,
respectively: 170,000; 42,500; 42,500; 30,000; and 20,000, in each case, 25% of which will vest on each of June 30, 2013, 2014, 2015 and 2016. The grants are expected to be made to incentivize
them to work to grow our stock price over time and to achieve growth in targeted areas of our business, and as a retention incentive. In addition to the grants to the named executive officers, our
other executive officers and employees, contingent upon the closing of this offering, are expected to receive a total of 122,500 stock appreciation rights, which will vest upon the timing above for
our named executive officers.
We do not currently have employment agreements with any of our named executive officers. However, as part of substantial review of our
existing compensation programs, objectives and philosophy to be undertaken after this offering by our Company-level compensation committee, we may enter into employment agreements with our executive
officers in the future.
In
connection with the grant of common units in our parent company, we have entered into unit grant agreements with each recipient that contain severance benefits and change of control
provisions, the terms of which are described under the heading "—Potential Payments Upon Termination
or Change of Control." We believe these severance and change in control benefits are an essential element of our executive compensation package and assist us in recruiting and retaining talented
individuals.
Effective upon the completion of this offering, we will implement the Ignite Restaurant Group, Inc. 2012 Omnibus Incentive Plan, or
2012 Plan. For more information relating to our 2012 Plan, see "—Ignite Restaurant Group, Inc. 2012 Omnibus Incentive Plan."
Our
2012 Plan will allow for the grant of a number of forms of equity incentives, including stock options, restricted stock, restricted stock units and stock appreciation rights. In the
future, our Company-level compensation committee may consider awarding such additional or alternative forms of awards to our executive officers, although no decision to use such other forms of award
has yet been made.
We believe that attracting and retaining superior management talent requires an executive compensation program that is competitive in
all respects with the programs provided at similar companies.
We
do not maintain defined benefit plans, non-qualified deferred compensation plans or supplemental retirement plans for our executive officers.
All named executive officers are eligible for other benefits including: medical, dental, short- and long-term disability
and life insurance. The executives participate in these plans on the same basis, terms, and conditions as other administrative employees. The named executive officers also participate in our vacation,
holiday and sick day program, which provides paid leave during the year at various
110
Table of Contents
amounts
based upon the executive's position, length of service and any arrangements negotiated at time of hire.
Our executive officers, including our named executive officers, may make limited use of financial counseling and tax preparation
services, receive an automobile allowance and a medical examination and other very modest usual and customary perquisites. Any perquisites are negotiated with the executive officer at the time such
executive officer joins us. All such perquisites for the named executive officers are reflected in the "All Other Compensation" column of the Summary Compensation Table and the accompanying footnotes.
We do not currently have a formal policy for recovery of incentive-based compensation paid to current and former executive officers.
Our longstanding practice is that each participant in the Management Incentive Plan is responsible to repay any net overpayment amount. Following the completion of this offering, we intend to
implement a formal policy for the recovery of incentive-based compensation paid to current and former executive officers that will comply with regulations to be adopted pursuant to the Dodd-Frank Wall
Street Reform and Consumer Protection Act.
After analysis, we believe that our compensation policies and practices for our employees, including our executives, do not encourage
excessive risk or unnecessary risk-taking and in our opinion the risks arising from such compensation policies and practices are not reasonably likely to have a material adverse effect on
us. We believe our compensation programs have been balanced to focus our key employees on both short- and long-term financial and operational performance.
Section 162(m) disallows a tax deduction for any publicly held corporation for individual compensation exceeding
$1.0 million in any taxable year for a company's named executive officers, other than its chief financial officer, unless such compensation qualifies as performance-based under such section.
Neither the Parent Compensation Committee nor our board of directors has previously taken the deductibility limit imposed by Section 162(m) into consideration in setting compensation because we
are not currently publicly traded. Following this offering, at such time as we are subject to the deduction limitations of Section 162(m), we expect that our compensation committee will seek to
qualify the variable compensation paid to our named executive officers for an exemption from the deductibility limitations of Section 162(m). However, our compensation committee may, in its
judgment, authorize compensation payments that do not comply with the exemptions in Section 162(m) when it believes that such payments are appropriate to attract and retain executive talent.
Our
President and Chief Executive Officer and the Parent Compensation Committee, in connection with decisions that relate to our equity incentive award plans and programs, consider the
accounting implications of significant compensation decisions. As accounting standards change, we may revise certain programs to appropriately align accounting expenses of our equity awards with our
overall executive compensation philosophy and objectives.
111
Table of Contents
Compensation of Named Executive Officers
The tables in the following sections provide information required by the SEC regarding compensation paid to or earned by our named
executive officers.
Summary Compensation Table
The following table sets forth the total compensation awarded to, earned by, or paid to our named executive officers for all services
rendered in all capacities to us or our parent, JCS Holding, LLC, in fiscal year 2011.
|
|
|
|
|
|
|
|
|
|
|
|
|
|
|
|
|
Name and Principal Position
|
|
Year |
|
Salary
($) |
|
Non-Equity
Incentive Plan
Compensation
($)(a) |
|
All Other
Compensation
($)(b) |
|
Total
($) |
|
Raymond A. Blanchette, III
President and Chief Executive Officer |
|
|
2011 |
|
|
500,000 |
|
|
178,175 |
|
|
10,200 |
|
|
688,375 |
|
Jeffrey L. Rager
Senior Vice President and Chief Financial Officer |
|
|
2011 |
|
|
250,000 |
|
|
71,270 |
|
|
— |
|
|
321,270 |
|
James F. Mazany
Senior Vice President and Chief Operations Officer, Joe's Crab
Shack |
|
|
2011 |
|
|
247,274 |
(c) |
|
129,288 |
|
|
11,200 |
|
|
387,762 |
|
James W. Kuhn
Senior Vice President and Chief Operations Officer, Brick House
Tavern+Tap |
|
|
2011 |
|
|
232,940 |
(d) |
|
33,497 |
|
|
14,168 |
|
|
280,605 |
|
Kevin T. Cottingim
Senior Vice President and Chief Administrative Officer |
|
|
2011 |
|
|
228,076 |
(e) |
|
80,398 |
|
|
11,354 |
|
|
319,828 |
|
- (a)
- Represents
annual cash incentive awards under our Management Incentive Plan. The annual cash incentive is either based solely on achievement of the
Company's Adjusted EBITDA target, or for Messrs. Mazany, Kuhn and Cottingim, based on a combination of Adjusted EBITDA target achievement and individual performance goals. See
"—Compensation Discussion and Analysis—Elements of Compensation—Short-Term Incentive Arrangements."
- (b)
- The
amounts included in this column include the following:
2011 All Other Compensation Table
|
|
|
|
|
|
|
|
|
|
|
Name
|
|
Automobile
Allowance
($) |
|
Financial
Counseling
and Tax
Preparation
($) |
|
Medical
Examination
($) |
|
Raymond A. Blanchette, III |
|
|
10,200 |
|
|
— |
|
|
— |
|
Jeffrey L. Rager |
|
|
— |
|
|
— |
|
|
— |
|
James F. Mazany |
|
|
10,200 |
|
|
1,000 |
|
|
— |
|
James W. Kuhn |
|
|
10,200 |
|
|
3,000 |
|
|
968 |
|
Kevin T. Cottingim |
|
|
10,200 |
|
|
1,154 |
|
|
— |
|
- (c)
- Mr. Mazany's
salary was increased from $235,828 to $250,000 in February 2011.
- (d)
- Mr. Kuhn's
salary was increased from $225,264 to $235,000 in February 2011.
- (e)
- Mr. Cottingim's
salary was increased from $220,000 to $230,000 in February 2011.
112
Table of Contents
Grants of Plan-Based Awards Table
The following table sets forth information regarding grants of plan-based awards made to our named executive officers
during fiscal year 2011 under our Management Incentive Plan. No equity awards were granted during fiscal year 2011 to our named executive officers.
|
|
|
|
|
|
|
|
|
|
|
|
|
Estimated Future Payments Under
Non-Equity Incentive
Plan Awards(a) |
|
Name
|
|
Threshold
($) |
|
Target
($) |
|
Maximum
($) |
|
Raymond A. Blanchette, III |
|
|
100,000 |
|
|
250,000 |
|
|
375,000 |
|
Jeffrey L. Rager |
|
|
40,000 |
|
|
100,000 |
|
|
150,000 |
|
James F. Mazany |
|
|
55,000 |
|
|
137,500 |
|
|
206,250 |
|
James W. Kuhn |
|
|
47,000 |
|
|
117,500 |
|
|
176,250 |
|
Kevin T. Cottingim |
|
|
36,800 |
|
|
92,000 |
|
|
138,000 |
|
- (a)
- These
amounts represent threshold, target and maximum annual cash incentive opportunities for each of the named executive officers under our Management
Incentive Plan. The actual amount of the annual cash incentive award earned by each named executive officer for fiscal year 2011 is reported in the Summary Compensation Table. For a description of the
performance targets relating to the Company's annual cash incentive opportunities for fiscal year 2011, please refer to "—Compensation Discussion and Analysis—Elements of
Compensation—Short-Term Incentive Arrangements" above.
Outstanding Equity Awards at Fiscal Year End
The following table sets forth for each of the named executive officers information with respect to outstanding common units as of
January 2, 2012.
|
|
|
|
|
|
|
|
|
|
|
|
|
|
|
|
Stock Awards |
|
Name
|
|
Number of Units
That Have
Not Vested(#) |
|
Market Value
of Units
That Have Not
Vested($)(d) |
|
Number of
Unearned Units
That Have Not
Vested(#) |
|
Market or
Payout Value of
Unearned Units
That Have Not
Vested($)(d) |
|
Raymond A. Blanchette, III |
|
|
— |
(a) |
|
— |
|
|
— |
(a) |
|
— |
|
|
|
|
500,000 |
(b) |
|
140,000 |
|
|
— |
|
|
— |
|
Jeffrey L. Rager |
|
|
130,000 |
(c) |
|
36,400 |
|
|
130,000 |
(c) |
|
36,400 |
|
James F. Mazany |
|
|
— |
(c) |
|
— |
|
|
— |
(c) |
|
— |
|
James W. Kuhn |
|
|
— |
(c) |
|
— |
|
|
— |
(c) |
|
— |
|
Kevin T. Cottingim |
|
|
80,000 |
(c) |
|
22,400 |
|
|
80,000 |
(c) |
|
22,400 |
|
- (a)
- Under
the terms of his May 2007 offer letter, Mr. Blanchette was granted 4,195,804 common units. Half of the common units are subject to
time-based vesting provisions and the following: 209,790 common units vested at issuance and 209,790 common units vested ratably over the remainder of 2007. The remaining common units vest
ratably over four years, with 25% of such common units vesting on December 31 of each year, subject to continued employment. The other half of the common units vest ratably over five years,
with 20% of such common units vesting each fiscal year if certain performance-based provisions are satisfied, subject to continued employment. Any unvested portion of the common units fully vests
immediately prior to a change of control. If employee is terminated without cause, the time-based common units vest on a prorata basis for that year based upon the number of months of
employment during that year divided by 12. The common units are subject to certain transfer restrictions and repurchase rights pursuant to the Parent LLC Agreement. These transfer and repurchase
restrictions will lapse upon our initial public offering.
- (b)
- In
June 2009, Mr. Blanchette was granted 500,000 common units. The common units vest on June 11, 2014, subject to continued employment. Any
unvested portion of the common units fully vest immediately prior to a change of control or upon an underwritten public offering with net proceeds to us greater than $100.0 million.
113
Table of Contents
- (c)
- In
July 2008, Mr. Rager was granted 1,300,000 common units. In October 2007, Messrs. Mazany and Kuhn were each granted 655,266 common units. In
December 2008, Mr. Cottingim was granted 400,000 common units. Half of the common units are subject to time-based vesting provisions, subject to continued employment, with 20% of
such common units vesting on December 31 of each year. The other half of the common units vest ratably over five years, with 20% of such common units vesting each fiscal year if certain
performance-based provisions are satisfied, subject to continued employment. Any unvested portion of the common units fully vests immediately prior to a change of control. If employee is terminated
without cause, the common units vest on a prorata basis for that year based upon the number of months of employment during that year divided by 12. The common units are subject to certain transfer
restrictions and repurchase rights pursuant to the Parent LLC Agreement. These transfer and repurchase restrictions will lapse upon our initial public offering.
- (d)
- There
was no public market for the common units as of January 2, 2012. The market value of unvested common units is based upon the fair market value
of such common units as of December 28, 2009 of $0.28 per common unit, which is the most recent valuation because no equity awards were granted in fiscal years 2010 or 2011.
Immediately
after completion of this public offering, JCS Holdings, LLC, our parent company, will distribute substantially all of the shares of our common stock then held by it
and/or the cash proceeds received in this public offering to the holders of its Series A preferred units and its common units, including those held by our named executive officers, in
accordance with the provisions then in effect of the Parent LLC Agreement. JCS Holdings, LLC will thereafter continue to hold less than one percent of our outstanding common stock for
the benefit of certain of our officers and directors who will continue to hold unvested common units in JCS Holdings, LLC upon consummation of this offering.
Option Exercises and Stock Vested Table
The following table sets forth information regarding the number and value of common units for each named executive officer that vested
during fiscal year 2011. No named executive officer holds stock options.
|
|
|
|
|
|
|
|
Name
|
|
Number of Common Units
Acquired on Vesting
(#)(a) |
|
Value Realized
on Vesting
($)(b) |
|
Raymond A. Blanchette, III |
|
|
839,161 |
|
|
234,965 |
|
Jeffrey L. Rager |
|
|
260,000 |
|
|
72,800 |
|
James F. Mazany |
|
|
131,053 |
|
|
36,695 |
|
James W. Kuhn |
|
|
131,053 |
|
|
36,695 |
|
Kevin T. Cottingim |
|
|
80,000 |
|
|
22,400 |
|
- (a)
- Reflects
time-based and performance-based common units that vested during fiscal year 2011. For a description of the common units, please refer
to "—Compensation Discussion and Analysis—Elements of Compensation—Long-Term Equity-Based Compensation."
- (b)
- There
was no public market for the common units as of January 3, 2012. The market value of unvested common units is based upon the fair market value
of such common units as of December 28, 2009 $0.28 per common unit, which is the most recent valuation because no equity awards were granted in fiscal years 2010 or 2011.
Immediately
after completion of this public offering, JCS Holdings, LLC, our parent company, will distribute substantially all of the shares of our common stock then held by it
and/or the cash proceeds received in this public offering to the holders of its Series A preferred units and its common units, including those held by our named executive officers, in
accordance with the provisions then in effect of the Parent LLC Agreement. JCS Holdings, LLC will thereafter continue to hold shares equal to less than one percent of our
outstanding common stock for the benefit of certain of our officers and directors who will continue to hold unvested common units in JCS Holdings, LLC upon consummation of this offering.
114
Table of Contents
Pension Benefits
Our named executive officers did not participate in or have account balances in qualified or nonqualified defined benefit plans
sponsored by us. Our board of directors or our Company-level compensation committee may elect to adopt qualified or nonqualified benefit plans in the future if it determines that doing so is in our
best interest.
Nonqualified Deferred Compensation
Our named executive officers did not participate in or have account balances in nonqualified defined contribution plans or other
nonqualified deferred compensation plans maintained by us. Our board of directors or our Company-level compensation committee may elect to provide our executive officers and other employees with
nonqualified defined contribution or other nonqualified deferred compensation benefits in the future if it determines that doing so is in our best interest.
Potential Payments Upon Termination or Change in Control
The information below describes and quantifies certain compensation that would become payable under each named executive officer's
respective unit grant agreements if, as of January 2, 2012, their respective employment with us had been terminated. Due to the number of factors that affect the nature and amount of any
benefits provided upon the events discussed below, any actual amounts paid or distributed may be different. Factors that could affect these amounts include the timing during the year of any such
event.
|
|
|
|
|
|
|
|
|
|
|
|
|
|
|
|
Named Executive Officer
|
|
Benefit |
|
Death or
Disability |
|
Change in
Control(1) |
|
Termination
Without
Cause |
|
Termination
for Good
Reason |
|
Raymond A. Blanchette, III |
|
Cash severance |
|
$ |
1,000,000 |
|
$ |
1,000,000 |
|
$ |
1,000,000 |
|
$ |
1,000,000 |
|
|
|
Acceleration of equity(2) |
|
|
140,000 |
|
|
— |
|
|
— |
|
|
— |
|
|
|
Health benefits continuation |
|
|
6,923 |
|
|
6,923 |
|
|
6,923 |
|
|
6,923 |
|
| |
|
|
|
|
|
|
|
|
|
|
|
|
|
Total |
|
$ |
1,146,923 |
|
$ |
1,006,923 |
|
$ |
1,006,923 |
|
$ |
1,006,923 |
|
Jeffrey L. Rager |
|
Cash severance |
|
|
— |
|
$ |
250,000 |
|
$ |
250,000 |
|
|
— |
|
|
|
Acceleration of equity(2) |
|
|
— |
|
|
72,800 |
|
|
36,400 |
|
|
— |
|
|
|
Health benefits continuation |
|
|
— |
|
|
6,923 |
|
|
6,923 |
|
|
— |
|
| |
|
|
|
|
|
|
|
|
|
|
|
|
|
|
|
Total |
|
|
— |
|
$ |
329,723 |
|
$ |
293,323 |
|
|
— |
|
James F. Mazany |
|
Cash severance |
|
|
— |
|
$ |
125,000 |
|
$ |
125,000 |
|
|
— |
|
|
|
Acceleration of equity(2) |
|
|
— |
|
|
— |
|
|
— |
|
|
— |
|
|
|
Health benefits continuation |
|
|
— |
|
|
3,462 |
|
|
3,462 |
|
|
— |
|
| |
|
|
|
|
|
|
|
|
|
|
|
|
|
|
|
Total |
|
|
— |
|
$ |
128,462 |
|
$ |
128,462 |
|
|
— |
|
James W. Kuhn |
|
Cash severance |
|
|
— |
|
$ |
117,500 |
|
$ |
117,500 |
|
|
— |
|
|
|
Acceleration of equity(2) |
|
|
— |
|
|
— |
|
|
— |
|
|
— |
|
|
|
Health benefits continuation |
|
|
— |
|
|
3,462 |
|
|
3,462 |
|
|
— |
|
| |
|
|
|
|
|
|
|
|
|
|
|
|
|
|
|
Total |
|
|
— |
|
$ |
120,962 |
|
$ |
120,962 |
|
|
— |
|
Kevin T. Cottingim |
|
Cash severance |
|
|
— |
|
$ |
172,500 |
|
$ |
172,500 |
|
|
— |
|
|
|
Acceleration of equity(2) |
|
|
— |
|
|
44,800 |
|
|
22,400 |
|
|
— |
|
|
|
Health benefits continuation |
|
|
— |
|
|
3,695 |
|
|
3,695 |
|
|
— |
|
| |
|
|
|
|
|
|
|
|
|
|
|
|
|
|
|
Total |
|
|
— |
|
$ |
220,995 |
|
$ |
198,595 |
|
|
— |
|
- (1)
- Assumes
the executive is terminated without cause following a change in control. Without a termination, the executive would receive only an acceleration of
equity upon a change in control.
- (2)
- There
was no public market for the common units as of January 3, 2011. The market value of unvested common units is based upon the fair market value
of such common units as of December 28, 2009 of $0.28 per common unit, which is the most recent valuation because no equity awards were granted in fiscal year 2010.
115
Table of Contents
In accordance with his unit grant agreements, if his employment is terminated without cause (as such term is defined in the Parent LLC
Agreement) or he terminates his employment for good reason (as such term is defined in his 2009 unit grant agreement) or as a result of his death or disability (as such term is defined in his 2009
unit grant agreement), then he is, subject to his execution of a general release and his compliance with post-termination obligations relating to confidentiality, intellectual property,
non-competition and non-solicitation, entitled to the following:
- •
- twenty-four months salary continuation; provided, that if he becomes employed, this payment obligation ceases
on the later of twelve months after termination or the date he is otherwise employed;
- •
- if employee is terminated without cause (as such term is defined in the Parent LLC Agreement), any unvested
time-based common units granted in 2007 vest on a prorata basis for that year based upon the number of months of employment during that year divided by twelve; and
- •
- twelve months continuation of medical and dental coverage.
Messrs. Rager, Mazany, Kuhn and Cottingim
In accordance with their respective unit grant agreements, if their employment is terminated without cause (as such term is defined in
the Parent LLC Agreement), then the named executive officer is, subject to his execution of a general release and his compliance with post-termination obligations relating to
confidentiality, intellectual property, non-competition and non-solicitation, entitled to the following:
- •
- For Mr. Rager:
- •
- twelve months salary continuation;
- •
- any unvested time-based common units vest on a prorata basis for that year based upon the number of months of
employment during that year divided by twelve; and
- •
- twelve months continuation of medical and dental coverage.
- •
- For Mr. Mazany and Kuhn:
- •
- six months salary continuation;
- •
- any unvested time-based common units vest on a prorata basis for that year based upon the number of months of
employment during that year divided by twelve; and
- •
- six months continuation of medical and dental coverage.
- •
- For Mr. Cottingim:
- •
- nine months salary continuation;
- •
- any unvested time-based common units vest on a prorata basis for that year based upon the number of months of
employment during that year divided by twelve; and
- •
- nine months continuation of medical and dental coverage.
Under the terms of their respective unit grant agreements, each named executive officer has agreed to confidentiality obligations
during and after employment. In addition, under their respective unit grant agreements, each named executive officer has agreed to the following:
- •
- non-solicitation obligations for two years following employment termination;
116
Table of Contents
- •
- Messrs. Blanchette (pursuant to his May 2007 offer letter) Mazany and Kuhn have agreed to
non-competition obligations for twelve months following employment termination;
- •
- Mr. Rager has agreed to non-competition obligations for nine months following employment termination;
and
- •
- Mr. Cottingim has agreed to non-competition obligations for six months following employment
termination.
Ignite Restaurant Group, Inc. 2012 Omnibus Incentive Plan
We intend to adopt the 2012 Plan, in connection with our initial public offering. The 2012 Plan will provide for grants of stock
options, stock appreciation rights, restricted stock, other stock-based awards and other cash-based awards. Directors, officers and other employees of us and our subsidiaries, as well as
others performing consulting or advisory services for us, will be eligible for grants under the 2012 Plan. The purpose of the 2012 Plan is to provide incentives that will attract, retain and motivate
highly competent officers, directors, employees and consultants by providing them with appropriate incentives and rewards either through a proprietary interest in our long-term success or
compensation based on their performance in fulfilling their personal responsibilities. The following is a summary of the material terms of the 2012 Plan, but does not include all of the provisions of
the 2012 Plan. For further information about the 2012 Plan, we refer you to the complete copy of the 2012 Plan, which we will file as an exhibit to the registration statement, of which this prospectus
is a part.
The 2012 Plan is administered by a committee designated by our board of directors. Among the committee's powers are to determine the
form, amount and other terms and conditions of awards, clarify, construe or resolve any ambiguity in any provision of the 2012 Plan or any award agreement, amend the terms of outstanding awards and
adopt such rules, forms, instruments and guidelines for administering the 2012 Plan as it deems necessary or proper. All actions, interpretations and determinations by the committee or by our board of
directors are final and binding.
The
committee has full authority to administer and interpret the 2012 Plan, to grant discretionary awards under the 2012 Plan, to determine the persons to whom awards will be granted, to
determine the types of awards to be granted, to determine the terms and conditions of each award, to determine the number of shares of common stock to be covered by each award and to make all other
determinations in connection with the 2012 Plan and the awards thereunder as the committee, in its sole discretion, deems necessary or desirable.
The aggregate number of shares of common stock which may be issued or used for reference purposes under the 2012 Plan or with respect
to which awards may be granted may
not exceed 1,980,074 shares, which may be either authorized and unissued shares of our common stock or shares of common stock held in or acquired for our treasury. In general, if awards under
the 2012 Plan are for any reason cancelled, or expire or terminate unexercised, the shares covered by such awards will again be available for the grant of awards under the 2012 Plan.
Members of our board of directors, as well as employees of, and consultants to, us or any of our subsidiaries and affiliates are
eligible to receive awards under the 2012 Plan. The selection of participants is within the sole discretion of the committee.
117
Table of Contents
Awards granted under the 2012 Plan shall be evidenced by award agreements, which need not be identical, that provide additional terms,
conditions, restrictions and/or limitations covering the grant of the award, including, without limitation, additional terms providing for the acceleration of exercisability or vesting of awards in
the event of a change of control or conditions regarding the participant's employment, as determined by the committee in its sole discretion.
The committee may grant nonqualified stock options and incentive stock options to purchase shares of our common stock only to eligible
employees. The committee will determine the number of shares of our common stock subject to each option, the term of each option, which may not exceed ten years, or five years in the case of an
incentive stock option granted to a 10.0% stockholder, the exercise price, the vesting schedule, if any, and the other material terms of each option. No incentive stock option or nonqualified stock
option may have an exercise price less than the fair market value of a share of our common stock at the time of grant or, in the case of an incentive stock option granted to a 10.0% stockholder,
110.0% of such share's fair market value. Options will be
exercisable at such time or times and subject to such terms and conditions as determined by the committee at grant and the exercisability of such options may be accelerated by the committee in its
sole discretion.
The committee may grant stock appreciation rights, which we refer to as SARs, either with a stock option, which may be exercised only
at such times and to the extent the related option is exercisable, which we refer to as a Tandem SAR, or independent of a stock option, which we refer to as a Non-Tandem SAR. A SAR is a
right to receive a payment in shares of our common stock or cash, as determined by the committee, equal in value to the excess of the fair market value of one share of our common stock on the date of
exercise over the exercise price per share established in connection with the grant of the SAR. The term of each SAR may not exceed ten years. The exercise price per share covered by an SAR will be
the exercise price per share of the related option in the case of a Tandem SAR and will be the fair market value of our common stock on the date of grant in the case of a Non-Tandem SAR.
The committee may also grant limited SARs, either as Tandem SARs or Non-Tandem SARs, which may become exercisable only upon the occurrence of a change in control, as defined in the 2011
Plan, or such other event as the committee may, in its sole discretion, designate at the time of grant or thereafter.
The committee may award shares of restricted stock. Except as otherwise provided by the committee upon the award of restricted stock,
the recipient generally has the rights of a stockholder with respect to the shares, including the right to receive dividends, the right to vote the shares of restricted stock and, conditioned upon
full vesting of shares of restricted stock, the right to tender such shares, subject to the conditions and restrictions generally applicable to restricted stock or specifically set forth in the
recipient's restricted stock agreement. The committee may determine at the time of award that the payment of dividends, if any, will be deferred until the expiration of the applicable restriction
period.
Recipients
of restricted stock are required to enter into a restricted stock agreement with us that states the restrictions to which the shares are subject, which may include
satisfaction of pre-established performance goals, and the criteria or date or dates on which such restrictions will lapse.
If
the grant of restricted stock or the lapse of the relevant restrictions is based on the attainment of performance goals, the committee will establish for each recipient the applicable
performance goals, formulae or standards and the applicable vesting percentages with reference to the attainment of such
118
Table of Contents
goals
or satisfaction of such formulae or standards while the outcome of the performance goals are substantially uncertain. Such performance goals may incorporate provisions for disregarding, or
adjusting for, changes in accounting methods, corporate transactions, including, without limitation, dispositions and acquisitions, and other similar events or circumstances. Section 162(m) of
the Internal Revenue Code of 1986, as amended, which we refer to as the Code, requires that performance awards be based upon objective performance measures. The performance goals for performance-based
restricted stock will be based on one or more of the objective criteria set forth on Exhibit A to the 2011 Plan and are discussed in general below.
The committee may, subject to limitations under applicable law, make a grant of such other stock-based awards, including, without
limitation, performance units, dividend equivalent units, stock equivalent units, restricted stock units and deferred stock units under the 2011 Plan that are payable in cash or denominated or payable
in or valued by shares of our common stock or factors that influence the value of such shares. The committee shall determine the terms and conditions of any such other awards, which may include the
achievement of certain minimum performance goals for purposes of compliance with Section 162(m) of the Code and/or a minimum vesting period. The performance goals for performance-based other
stock-based awards will be based on one or more of the objective criteria set forth on Exhibit A to the 2011 Plan and discussed in general below.
The committee, may grant awards payable in cash. Cash-based awards shall be in such form, and dependent on such conditions,
as the committee shall determine, including, without limitation, being subject to the satisfaction of vesting conditions or awarded purely as a bonus and not subject to restrictions or conditions. If
a cash-based award is subject to vesting conditions, the committee may accelerate the vesting of such award in its discretion.
The committee may grant a performance award to a participant payable upon the attainment of specific performance goals. The committee
may grant performance awards that are intended to qualify as performance- based compensation under Section 162(m) of the Code as well as performance awards that are not intended to qualify as
performance-based compensation under Section 162(m) of the Code. If the performance award is payable in cash, it may be paid upon the attainment of the relevant performance goals either in cash
or in shares of restricted stock, based on the then current fair market value of such shares, as determined by the committee, in its sole discretion. Based on service, performance and/or such other
factors or criteria, if any, as the committee may determine, the committee may, at or after grant, accelerate the vesting of all or any part of any performance award.
The committee may grant awards of restricted stock, performance awards, and other stock-based awards that are intended to qualify as
performance-based compensation for purposes of Section 162(m) of the Code. These awards may be granted, vest and be paid based on attainment of specified performance goals established by the
committee. These performance goals will be based on the attainment of a certain target level of, or a specified increase or decrease in, one or more of the following criteria selected by the
committee: (i) earnings per share; (ii) operating income; (iii) gross income; (iv) net income (before or after taxes); (v) cash flow; (vi) gross profit;
(vii) gross profit return on investment; (viii) gross margin return on investment; (ix) gross margin; (x) operating margin; (xi) working capital;
(xii) earnings before interest and taxes; (xiii) earnings before interest, tax, depreciation and amortization; (xiv) return on equity; (xv) return on assets;
(xvi) return on capital; (xvii) return on invested capital; (xviii) net revenues; (xix) gross revenues; (xx) revenue growth;
119
Table of Contents
(xxi) annual
recurring revenues; (xxii) recurring revenues; (xxiii) license revenues; (xxiv) sales or market share; (xxv) total stockholder return;
(xxvi) economic value added; (xxvii) specified objectives with regard to limiting the level of increase in all or a portion of our bank debt or other long-term or
short-term public or private debt or other similar financial obligations, which may be calculated net of cash balances and/or other offsets and adjustments as may be established by the
committee in its sole discretion; (xxviii) the fair market value of the a share of common stock; (xxix) the growth in the value of an investment in the common stock assuming the
reinvestment of dividends; (xxx) reduction in operating expenses (xxxi) same store sales; (xxxii) operating weeks for new restaurants; (xxxiii) guest count; or
(xxxiv) construction budget.
To
the extent permitted by law, the committee may also exclude the impact of an event or occurrence which the committee determines should be appropriately excluded, including:
(i) restructurings, discontinued operations, extraordinary items and other unusual or non-recurring charges; (ii) an event either not directly related to our operations or
not within the reasonable control of management; or (iii) a change in accounting standards required by generally accepted accounting principles.
Performance
goals may also be based on an individual participant's performance goals, as determined by the committee, in its sole discretion.
In
addition, all performance goals may be based upon the attainment of specified levels of our performance, or subsidiary, division or other operational unit, under one or more of the
measures described above relative to the performance of other corporations. The committee may designate additional business criteria on which the performance goals may be based or adjust, modify or
amend those criteria.
In connection with a change in control, as defined in the 2012 Plan, the committee may accelerate vesting of outstanding awards under
the 2012 Plan. In addition, such awards will be, in the discretion of the committee, (i) assumed and continued or substituted in accordance with applicable law, (ii) purchased by us for
an amount equal to the excess of the price of a share of our common stock paid in a change in control over the exercise price of the award(s), or (iii) cancelled if the price of a share of our
common stock paid in a change in control is less than the exercise price of the award. The committee may also, in its sole discretion, provide for accelerated vesting or lapse of restrictions of an
award at any time.
Except as otherwise provided in the applicable award agreement, and with respect to an award of restricted stock a participant has no
rights as a stockholder with respect to shares of our common stock covered by any award until the participant becomes the record holder of such shares.
Notwithstanding any other provision of the 2012 Plan, our board of directors may at any time amend any or all of the provisions of the
2012 Plan, or suspend or terminate it entirely, retroactively or otherwise; provided, however, that, unless otherwise required by law or specifically
provided in the 2012 Plan, the rights of a participant with respect to awards granted prior to such amendment, suspension or termination may not be adversely affected without the consent of such
participant.
Awards granted under the 2012 Plan are generally nontransferable (other than by will or the laws of descent and distribution), except
that the committee may provide for the transferability of nonqualified stock options at the time of grant or thereafter to certain family members.
The 2012 Plan will be adopted in connection with this offering.
120
Table of Contents
PRINCIPAL AND SELLING STOCKHOLDER
The following table sets forth information as of April 27, 2012 regarding the beneficial ownership of our common stock
by:
- •
- each person known by us to beneficially own 5% or more of our outstanding common stock;
- •
- each of our directors;
- •
- each of our named executive officers;
- •
- all of our directors and executive officers as a group; and
- •
- selling stockholder.
The
amount and percentage of shares beneficially owned by our existing shareholders will be dependent upon the actual offering price per share of common stock in this offering. The
information presented in the table below is based on an offering price of $13.00 per share, which is the midpoint of the range shown on the front cover page of this prospectus, and
24,750,929 shares of our common stock outstanding after the completion of this offering.
A
$1.00 increase in the assumed initial public offering price of $13.00 per share, the midpoint of the price range set forth on the cover page of this prospectus, would decrease the
number of shares beneficially owned by J.H. Whitney following the offering by approximately 28,400 shares and the number of shares beneficially owned by members of management will
increase by approximately 28,400 shares.
A
$1.00 decrease in the assumed initial public offering price would increase the number of shares beneficially owned by J.H. Whitney following the offering by approximately
33,200 shares and the number of shares beneficially owned by members of management will decrease by approximately 33,200 shares.
For
further information regarding material transactions between us and certain of our stockholders, see "Certain Relationships and Related Party Transactions." The selling stockholder in
this offering may be deemed to be a statutory underwriter.
Beneficial
ownership for the purposes of the following table is determined in accordance with the rules and regulations of the SEC. Under these rules, beneficial ownership includes any
shares as to which the individual or entity has sole or shared voting or investment power and any shares as to which the individual or entity has the right to acquire beneficial ownership within
60 days after April 27, 2012 through the exercise of any stock option, warrant or other right. For purposes of calculating each person's or group's percentage ownership, shares of common
stock issuable pursuant to stock options exercisable within 60 days after April 27, 2012 are included as outstanding and beneficially owned for that person or group but are not treated
as outstanding for the purpose of computing the percentage ownership of any other person or group. The numbers listed below are based on 24,750,929 shares of our common stock outstanding as of
April 27, 2012 after giving effect to the stock split and subsequent distribution by JCS Holdings, LLC as if they occurred on that date. Except as disclosed in the footnotes to this
table and subject to applicable community property laws, we believe that each stockholder identified in the table possesses sole voting and investment power over all shares of common stock shown as
beneficially owned by the stockholder. Unless otherwise
121
Table of Contents
indicated
in the table or footnotes below, the address for each beneficial owner is c/o Ignite Restaurant Group, Inc., 9900 Westpark Drive, Suite 300, Houston, Texas 77063.
|
|
|
|
|
|
|
|
|
|
|
|
|
|
|
|
|
|
|
Shares Beneficially Owned
Prior to This Offering(1) |
|
|
|
Shares Beneficially Owned
After This Offering(1)
(no option exercise) |
|
|
|
Number of
Shares
Offered |
|
Name
|
|
Number |
|
Percent |
|
Number |
|
Percent |
|
Selling Stockholder: |
|
|
|
|
|
|
|
|
|
|
|
|
|
|
|
|
JCS Holdings, LLC
c/o J.H. Whitney & Co.
130 Main Street
New Canaan, Connecticut 06840 |
|
|
19,178,226 |
|
|
100 |
% |
|
196,528 |
(2) |
|
196,887 |
(3) |
|
* |
|
5% Stockholder: |
|
|
|
|
|
|
|
|
|
|
|
|
|
|
|
|
J.H. Whitney VI(4)
130 Main Street
New Canaan, Connecticut 06840 |
|
|
19,178,226 |
|
|
100 |
% |
|
— |
|
|
17,388,131 |
|
|
70.3 |
% |
Named Executive Officers and Directors: |
|
|
|
|
|
|
|
|
|
|
|
|
|
|
|
|
Raymond A. Blanchette, III |
|
|
— |
|
|
— |
|
|
72,894 |
|
|
656,045 |
|
|
2.7 |
% |
Jeffrey L. Rager |
|
|
— |
|
|
— |
|
|
28,514 |
|
|
161,576 |
|
|
* |
|
James F. Mazany |
|
|
— |
|
|
— |
|
|
22,768 |
|
|
91,072 |
|
|
* |
|
James W. Kuhn |
|
|
— |
|
|
— |
|
|
22,768 |
|
|
91,072 |
|
|
* |
|
Kevin T. Cottingim |
|
|
— |
|
|
— |
|
|
8,918 |
|
|
35,673 |
|
|
* |
|
Richard P. Bermingham |
|
|
— |
|
|
— |
|
|
3,648 |
|
|
14,594 |
|
|
* |
|
John F. Gilbert III |
|
|
— |
|
|
— |
|
|
— |
|
|
29,245 |
|
|
— |
|
Zane Leshner |
|
|
— |
|
|
— |
|
|
6,949 |
|
|
27,797 |
|
|
* |
|
Brian N. Cherry |
|
|
— |
|
|
— |
|
|
— |
|
|
— |
|
|
— |
|
Paul R. Vigano |
|
|
— |
|
|
— |
|
|
— |
|
|
— |
|
|
— |
|
All executive officers and directors as a group (14 persons) |
|
|
— |
|
|
— |
|
|
189,238 |
|
|
1,259,160 |
|
|
5.0 |
% |
- *
- Represents
beneficial ownership of less than one percent (1%) of our outstanding common stock.
- (1)
- Shares
shown in the table above include shares held in the beneficial owner's name or jointly with others, or in the name of a bank, nominee or trustee for
the beneficial owner's account.
- (2)
- JCS Holdings,
LLC, our parent company, holds 100% of our outstanding common stock. J.H. Whitney VI holds an 88.6% equity interest in
JCS Holdings, LLC and certain of our current and former executive officers, directors and employees hold the remaining equity interests. Immediately after completion of this offering,
JCS Holdings, LLC will distribute substantially all of the shares of our common stock then held by it and/or the cash proceeds received in this public offering to the holders of its
Series A preferred units and its common units in accordance with the provisions then in effect of the Parent LLC Agreement. JCS Holdings, LLC will thereafter continue to hold shares
equal to less than one percent of our outstanding common stock for the benefit of certain of our officers and directors who will continue to hold unvested common units in JCS Holdings, LLC upon
consummation of this offering. Of the 196,528 shares of common stock being sold by JCS Holdings, the following persons have pecuniary interest in such shares, and will receive a distribution from JCS
Holdings, LLC, of the net proceeds from the sale of such shares, as follows: Raymond A Blanchette, III (72,894 shares), Jeffrey L. Rager (28,514 shares), Edward W.
Engel (22,779 shares), James F. Mazany (22,768 shares), James W. Kuhn (22,768 shares), Kevin T. Cottingim (8,918 shares), Zane Leshner (6,949 shares),
Richard P. Bermingham (3,648 shares) and other officers and employees of the company (7,290 shares).
- (3)
- Consists
of shares of common stock held for the benefit of certain of our officers and directors who will continue to hold unvested common units in JCS
Holdings, LLC upon consummation of this offering as follows: Raymond A. Blanchette, III (86,865 shares), Jeffrey L. Rager (35,760 shares), Kevin T. Cottingim
(24,901 shares), Edward J. McGraw (19,762 shares), John F. Gilbert III (5,502 shares) and other officers and employees of the company (24,097 shares). These shares are not
included in the table as being beneficially owned after this offering for each of our named executive officers and directors and for all of our executive officers and directors as a group.
- (4)
- Includes
19,178,226 shares of common stock held by JCS Holdings, LLC, our parent company. J.H. Whitney VI is an investment fund,
principally engaged in the business of making private equity investments. J.H. Whitney Equity Partners VI, LLC is the sole general partner of J.H. Whitney VI and as such
may be deemed to have beneficial ownership of the shares held by J.H. Whitney VI. The managing members of J.H. Whitney Equity Partners VI, LLC have voting and disposition
power over the shares of common stock held by J.H. Whitney VI. The members of J.H. Whitney Equity Partners VI, LLC are Peter M. Castleman, James H. Fordyce,
Michael C. Salvator, Paul R. Vigano and Robert M. Williams, Jr. Each of Messrs. Castleman, Fordyce, Salvator, Vigano and Williams disclaim beneficial ownership of the
shares held by J.H. Whitney Equity Partners VI, LLC and its affiliated entities, except to the extent of his pecuniary interest therein.
122
Table of Contents
CERTAIN RELATIONSHIPS AND RELATED PARTY TRANSACTIONS
Management Agreement
We are party to a management agreement with J.H. Whitney, pursuant to which J.H. Whitney provides management consulting
services to us and receives specified consideration for such services. These management consulting services generally consist of advice in connection with financing arrangements, the development and
implementation of strategies to improve business performance or advice in connection with business combinations or other extraordinary corporate transactions. We paid an aggregate of
$1.1 million for these management consulting services for each of the fiscal years 2011, 2010 and 2009, respectively. We expect to terminate the management agreement in connection with this
offering. Upon termination of the management agreement and the consummation of this offering, J.H. Whitney will receive an aggregate payment from us of $1.0 million. The management
agreement includes customary exculpation and indemnification provisions in favor of J.H. Whitney.
JCS Holdings LLC Agreement
In March 2010, JCS Holdings, LLC, our parent company, and its members entered into the Parent LLC Agreement. The Parent LLC
Agreement governs the operations of our parent company and sets forth certain rights and restrictions relating to our Series A preferred units and common units (in each case, as defined in the
Parent LLC Agreement), including:
- •
- allocation of income, gain, loss or deduction;
- •
- indemnification provisions;
- •
- tag along rights, in the event of a sale of at least 50% of all outstanding units;
- •
- drag along rights, in the event J.H. Whitney VI sells more than 50% of all outstanding units;
- •
- dissolution and termination; and
- •
- restrictions on the transfer of interests.
As
of March 26, 2012, there were 80,000,000 Series A preferred units outstanding and 10,303,858 common units issued or outstanding. Holders of each Series A
preferred unit are entitled to one vote.
In
connection with, and immediately prior to the completion of this public offering, Ignite Restaurant Group, Inc. will effect a 19,178.226-for-1 stock split of our common stock.
The stock split will result in 19,178,226 shares of common stock outstanding immediately after the stock split, all of which will be held by JCS Holdings, LLC, our parent company. Immediately
after completion of this public offering, JCS Holdings, LLC will then distribute substantially all of the shares of our common stock then held by it and/or the cash proceeds received in
this public offering to the holders of its Series A preferred units and its common units in accordance with the provisions then in effect of the Parent LLC Agreement.
JCS Holdings, LLC will thereafter continue to hold shares equal to less than one percent of our outstanding common stock for the benefit of certain of our officers and directors who will
continue to hold unvested common units in JCS Holdings, LLC upon consummation of this offering.
Board Compensation
Upon completion of this offering, directors who are our employees or employees of our subsidiaries or affiliated with
J.H. Whitney will not receive any compensation for their service as members of either our board of directors or board committees. All non-employee members of our board of directors
not affiliated with J.H. Whitney will be compensated as set forth under "Management—Corporate Governance—Director Compensation."
123
Table of Contents
Following
the completion of this offering, we may re-evaluate and, if appropriate, adjust the compensation awarded to directors in order to ensure that our director compensation is
commensurate with that of similarly situated public companies.
Indemnification Agreements
We intend to enter into indemnification agreements with each of our current directors and executive officers. These agreements will
require us to indemnify these individuals to the fullest extent permitted under Delaware law against liabilities that may arise by reason of their service to us, and to advance expenses incurred as a
result of any proceeding against them as to which they could be indemnified. We also intend to enter into indemnification agreements with our future directors and executive officers.
Registration Rights Agreement
Pursuant to a registration rights agreement that we will enter into prior to the completion of this public offering, we will grant
registration rights to J.H. Whitney VI and members of management. See "Description of Capital Stock—Registration Rights" for more information.
Policies and Procedures With Respect to Related Party Transactions
Upon the closing of this offering, we intend to adopt policies and procedures whereby our audit committee will be responsible for
reviewing and approving related party transactions. In addition, our Code of Ethics will require that all of our employees and directors inform the chairman of the audit committee of any material
transaction or relationship that comes to their attention that could reasonably be expected to create a conflict of interest. Further, at least annually, each director and executive officer will
complete a detailed questionnaire that asks questions about any business relationship that may give rise to a conflict of interest and all transactions in which we are involved and in which the
executive officer, a director or a related person has a direct or indirect material interest.
124
Table of Contents
DESCRIPTION OF CAPITAL STOCK
General
In connection with, and immediately prior to the completion of this public offering, Ignite Restaurant Group, Inc. will effect a
19,178.226-for-1 stock split of our common stock. The stock split will result in 19,178,226 shares of common stock outstanding immediately after the stock split, all of which will be held by
JCS Holdings, LLC, our parent company. Immediately after completion of this public offering, JCS Holdings, LLC will then distribute substantially all of the shares of our common stock
then held by it and/or the cash proceeds received in this public offering to the holders of its Series A preferred units and its common units in accordance with the provisions then in effect of
the Parent LLC Agreement. JCS Holdings, LLC will thereafter continue to hold shares equal to less than one percent of our outstanding common stock for the benefit of certain of our officers and
directors who will continue to hold unvested common units in JCS Holdings, LLC upon consummation of this offering.
Upon
completion of this offering, our total amount of authorized capital stock will be 500,000,000 shares of common stock, par value $0.01 per share, and 100,000,000 shares
of preferred stock, par value $0.01 per share. Upon completion of this offering and after giving effect to the stock split and subsequent distribution by JCS Holdings, LLC described above,
24,750,929 shares of common stock will be issued and outstanding and no shares of preferred stock will be issued or outstanding. The discussion set forth below describes our capital stock,
amended and restated certificate of incorporation and amended and restated bylaws as will be in effect upon consummation of this offering and the stock split and subsequent distribution by
JCS Holdings, LLC. The following summary of certain provisions of our capital stock describes material provisions of, but does not purport to be complete and is subject to, and is qualified in
its entirety by, our amended and restated certificate of incorporation and amended and restated bylaws. We urge you to read our amended and restated certificate of incorporation and amended and
restated bylaws, as will be in effect upon completion of this offering, which are included as exhibits to the registration statement of which this prospectus forms a part.
Common Stock
Voting Rights. Except as required by law or matters relating solely to the terms of preferred stock, each outstanding share of common
stock will be
entitled to one vote on all matters submitted to a vote of stockholders. Holders of shares of our common stock shall have no cumulative voting rights. Except in respect of matters relating to the
election and removal of directors on our board of directors and as otherwise provided in our amended and restated certificate of incorporation or required by law, all matters to be voted on by our
stockholders must be approved by a majority of the shares present in person or by proxy at the meeting and entitled to vote on the subject matter. In the case of election of directors, all matters to
be voted on by our stockholders must be approved by a plurality of the votes entitled to be cast by all shares of our common stock.
Dividend Rights. Subject to preferences that may apply to shares of preferred stock outstanding at the time, holders of outstanding
shares of common
stock will be entitled to receive dividends out of assets legally available at the times and in the amounts as the board of directors may from time to time determine. Our ability to pay dividends on
our common stock may be limited by restrictions under the terms of the agreements governing our indebtedness. See "Dividend Policy."
Preemptive Rights. Our common stock will not be entitled to preemptive or other similar subscription rights to purchase any of our
securities.
Conversion or Redemption Rights. Our common stock will be neither convertible nor redeemable. All shares of our common stock that will
be outstanding
at the time of the completion of the offering will be fully paid and non-assessable.
125
Table of Contents
Liquidation Rights. Upon our liquidation, the holders of our common stock will be entitled to receive pro rata our assets which are
legally available
for distribution, after payment of all debts and other liabilities and subject to the prior rights of any holders of preferred stock then outstanding.
Listing. We intend to apply to have our common stock approved for listing on The NASDAQ Global Select Market under the symbol "IRG."
Undesignated Preferred Stock
Our board of directors may, without further action by our stockholders, from time to time, direct the issuance of shares of preferred
stock in series and may, at the time of issuance, determine the designations, powers, preferences, privileges, and relative participating, optional or special rights as well as the qualifications,
limitations or restrictions thereof, including dividend rights, conversion rights, voting rights, terms of redemption and liquidation preferences, any or all of which may be greater than the rights of
the common stock. Satisfaction of any dividend preferences of outstanding shares of preferred stock would reduce the amount of funds available for the payment of dividends on shares of our common
stock. Holders of shares of preferred stock may be entitled to receive a preference payment in the event of our liquidation before any payment is made to the holders of shares of our common stock.
Under specified circumstances, the issuance of shares of preferred stock may render more difficult or tend to discourage a merger, tender offer or proxy contest, the assumption of control by a holder
of a large block of our securities or the removal of incumbent management. Upon the affirmative vote of a majority of the total number of directors then
in office, our board of directors, without stockholder approval, may issue shares of preferred stock with voting and conversion rights which could adversely affect the holders of shares of our common
stock and the market value of our common stock. Upon consummation of this offering, there will be no shares of preferred stock outstanding, and we have no present intention to issue any shares of
preferred stock.
Registration Rights
Pursuant to a registration rights agreement that we will enter into prior to the completion of this public offering, we will grant
registration rights to J.H. Whitney VI and members of management.
So
long as we do not have an effective shelf registration statement with respect to our common stock and securities delivered in connection therewith (the "registrable securities"),
J.H. Whitney VI may request registration of all or a portion of its registrable securities (a "demand registration"). We shall not be obligated to effectuate more than three demand
registrations in any 12-month period.
The registration rights agreement will provide that subject to certain limitations, at any time that we are eligible to use Form S-3, we will upon request of
J.H. Whitney VI file a shelf registration statement covering all registrable securities and, if such shelf registration statement is not automatically effective, use reasonable best
efforts to cause the shelf registration statement to be declared effective. Once the shelf registration statement is effective, we are required to use reasonable best efforts to keep the shelf
registration statement continuously effective and usable for resale of registrable securities. The registration rights agreement will also provide that, subject to limitations described below, any
holder with registrable securities registered pursuant to a shelf registration may effect an underwritten offering of its registrable securities after delivery of advance notice to us. The other
holders shall have the right to elect to include in such underwritten offering such portion of their registrable securities as they may request, subject to cutback provisions. Any underwritten
offering must reasonably be expected to result in at least $10.0 million in gross proceeds.
In connection with an underwritten offering, we may have to agree to not effect any public sale or distribution of equity securities (1) during the 90-day period
(subject to a 17-day extension) following the effective date of any underwritten demand registration or (2) during the period ending 90 days
126
Table of Contents
(subject to a 17-day extension) after commencement of such underwritten shelf offering, unless the managing underwriters agree to a shorter period.
Under
the registration rights agreement, we agree, subject to certain limitations, to indemnify J.H. Whitney VI its officers, directors, managers and partners, and each
person controlling such holder against all losses, claims, actions, damages, liabilities and expenses in certain circumstances and to pay any expenses reasonably incurred in connection investigating,
preparing or defending these, except insofar as the same are caused by or contained in any information furnished in writing to us by such holder expressly for use therein.
Anti-takeover Effects of our Amended and Restated Certificate of Incorporation and Amended and Restated Bylaws
Our amended and restated certificate of incorporation and our amended and restated bylaws will contain provisions that may delay, defer
or discourage another party from acquiring control of us. We expect that these provisions, which are summarized below, will discourage coercive takeover practices or inadequate takeover bids. These
provisions are also designed to encourage persons seeking to acquire control of us to first negotiate with the board of directors, which we believe may result in an improvement of the terms of any
such acquisition in favor of our stockholders. However, they also give the board of directors the power to discourage acquisitions that some stockholders may favor.
Our board of directors will initially be divided into three classes, Class I, Class II and Class III, with members
of each class serving staggered three-year terms. Our amended and restated bylaws will provide that the authorized number of directors may be changed only by resolution of the board of
directors. Any additional directorships resulting from an increase in the number of directors will be distributed among the three classes so that, as nearly as possible, each class will consist of
one-third of the directors. Our amended and restated certificate of incorporation and our amended and restated bylaws will also provide that a director may be removed only for cause by the
affirmative vote of the holders of at least a majority of our voting stock, and that any vacancy on our board of directors, including a vacancy resulting from an enlargement of our board of directors,
may be filled only by vote of a majority of our directors then in office. Our classified board structure will continue and be in effect for one full election cycle so that at the fourth annual meeting
of stockholders following the consummation of this offering, we will begin the process of phasing out staggered elections. Accordingly, beginning with the 2016 annual meeting of stockholders,
directors will be elected for a term expiring at the next annual meeting of stockholders. Until our board of directors is fully declassified, the classified nature of our board of directors could have
the effect of delaying or discouraging an acquisition of us or a change in our management.
The Delaware General Corporation Law, or DGCL, provides that, unless otherwise stated in a corporation's certificate of incorporation,
the stockholders may act by written consent without a meeting. Our amended and restated certificate of incorporation provides that after the investments funds associated with J.H. Whitney
collectively own less than 50% of our outstanding common stock, any action required or permitted to be taken by our stockholders at an annual meeting or special meeting of the stockholders may only be
taken at an annual or special meeting before which it is properly brought, and not by written consent without a meeting. As a result, J.H. Whitney VI will be able to act by written
consent so long as it owns at least 50% of our outstanding common stock.
127
Table of Contents
Our amended and restated certificate of incorporation and amended and restated bylaws provide that, except as otherwise required by
law, special meetings of the stockholders can only be called by (a) our chairman or vice chairman of the board of directors, (b) our chief executive officer or (c) a majority of
the board of directors through a special resolution.
In
addition, our amended and restated bylaws require advance notice procedures for stockholder proposals to be brought before an annual meeting of the stockholders, including the
nomination of directors. Stockholders at an annual meeting may only consider the proposals specified in the notice of meeting or brought before the meeting by or at the direction of the board of
directors, or by a stockholder of record on the record date for the meeting, who is entitled to vote at the meeting and who has delivered a timely written notice in proper form to our secretary, of
the stockholder's intention to bring such business before the meeting.
These
provisions could have the effect of delaying until the next stockholder meeting any stockholder actions, even if they are favored by the holders of a majority of our outstanding
voting securities.
The DGCL provides generally that the affirmative vote of a majority of the outstanding stock entitled to vote on amendments to a
corporation's certificate of incorporation or bylaws is required to approve such amendment, unless a corporation's certificate of incorporation or bylaws, as the case may be, requires a greater
percentage. Our amended and restated bylaws may be amended or repealed by a majority vote of our board of directors or, in addition to any other vote otherwise required by law, the affirmative vote of
at least a majority of the voting power of our outstanding shares of common stock. Additionally, the affirmative vote of at least 662/3% of the voting power of the outstanding shares of
capital stock entitled to vote generally in the election of directors, voting as a single class, is required to amend or repeal or to adopt any provision inconsistent with the "Classified Board of
Directors," "Action by Written Consent," "Special Meetings of Stockholders," "Corporate Opportunity," "Amendments to Certificate of Incorporation and Bylaws," "Exclusive Jurisdiction of Certain
Actions" and "Business Combinations" provisions, as well as the "Limitations on Liability and Indemnification of Officers and Directors" discussed below described in our amended and restated
certificate of incorporation. These provisions may have the effect of deferring, delaying or discouraging the removal of any anti-takeover defenses provided for in our amended and restated
certificate of incorporation and our amended and restated bylaws.
Our amended and restated certificate of incorporation provides that we renounce any interest or expectancy in, or in being offered an
opportunity to participate in, any business opportunity that may from time to time be presented to J.H. Whitney or any of its officers, directors, agents, stockholders, members, partners,
affiliates and subsidiaries (other than us and our subsidiaries) and that may be a business opportunity for J.H. Whitney, even if the opportunity is one that we might reasonably have pursued or
had the ability or desire to pursue if granted the opportunity to do so. No such person will be liable to us for breach of any fiduciary or other duty, as a director or officer or otherwise, by reason
of the fact that such person, acting in good faith, pursues or acquires any such business opportunity, directs any such business opportunity to another person or fails to present any such business
opportunity, or information regarding any such business opportunity, to us unless, in the case of any such person who is our director or officer, any such business opportunity is expressly offered to
such director or officer solely in his or her capacity as our director or officer. None of J.H. Whitney, any of the investment funds associated with J.H. Whitney or any of their
respective representatives has any
128
Table of Contents
duty
to refrain from engaging directly or indirectly in the same or similar business activities or lines of business as us or any of our subsidiaries.
Our amended and restated certificate of incorporation requires, to the fullest extent permitted by law that derivative actions brought
in the name of the Company, actions against directors, officers and employees for breach of fiduciary duty and other similar actions may be brought only in the Court of Chancery in the State of
Delaware. Although we believe this provision benefits the Company by providing increased consistency in the application of Delaware law in the types of lawsuits to which it applies, the provision may
have the effect of discouraging lawsuits against our directors and officers.
We have opted out of Section 203 of the DGCL. However, our amended and restated certificate of incorporation contains similar
provisions providing that we may not engage in certain "business combinations" with any "interested stockholder" for a three-year period following the time that the stockholder became an
interested stockholder, unless:
- •
- prior to such time, our board of directors approved either the business combination or the transaction which resulted in
the stockholder becoming an interested stockholder;
- •
- upon consummation of the transaction that resulted in the stockholder becoming an interested stockholder, the interested
stockholder owned at least 85% of our voting stock outstanding at the time the transaction commenced, excluding certain shares; or
- •
- at or subsequent to that time, the business combination is approved by our board of directors and by the affirmative vote
of holders of at least 662/3% of the outstanding voting stock that is not owned by the interested stockholder.
Generally,
a "business combination" includes a merger, asset or stock sale or other transaction resulting in a financial benefit to the interested stockholder. Subject to certain
exceptions, an "interested stockholder" is a person who, together with that person's affiliates and associates, owns, or within the previous three years owned, 15% or more of our voting stock.
Under
certain circumstances, this provision will make it more difficult for a person who would be an "interested stockholder" to effect various business combinations with a corporation
for a three-year period. This provision may encourage companies interested in acquiring our company to negotiate in advance with our board of directors because the stockholder approval
requirement would be avoided if our board of directors approves either the business combination or the transaction which results in the stockholder becoming an interested stockholder. These provisions
also may have the effect of preventing changes in our board of directors and may make it more difficult to accomplish transactions which stockholders may otherwise deem to be in their best interests.
Our
amended and restated certificate of incorporation provides that J.H. Whitney VI, any affiliated investment entity, and any of their respective direct or indirect
transferees of at least 15% of our outstanding common stock and any group as to which such persons are party to, do not constitute "interested stockholders" for purposes of this provision.
Limitations on Liability and Indemnification of Officers and Directors
Our amended and restated certificate of incorporation will limit the liability of our directors to the fullest extent permitted by
applicable law and provides that we will indemnify them to the fullest extent permitted by such law. We expect to enter into indemnification agreements with our current directors and executive
officers prior to the completion of this offering and expect to enter into a similar
129
Table of Contents
agreement with any new directors or executive officers. We expect to increase our directors' and officers' liability insurance coverage prior to the completion of this offering.
Transfer Agent and Registrar
The transfer agent and registrar for our common stock will be American Stock Transfer & Trust Company, LLC.
130
Table of Contents
SHARES ELIGIBLE FOR FUTURE SALE
Prior to this offering, there has been no public market for our common stock. Future sales of substantial amounts of our common stock
in the public market, or the perception that such sales may occur, could adversely affect the prevailing market price of our common stock. No prediction can be made as to the effect, if any, future
sales of shares, or the availability of shares for future sales, will have on the market price of our common stock prevailing from time to time. The sale of substantial amounts of our common stock in
the public market, or the perception that such sales could occur, could harm the prevailing market price of our common stock.
Sale of Restricted Shares
Upon completion of this offering, we will have 24,750,929 shares of common stock outstanding. Of these shares of common stock,
the 5,769,231 shares of common stock being sold in this offering, plus any shares sold upon exercise of the underwriters' option to purchase additional shares, will be freely tradable without
restriction under the Securities Act, except for any
such shares which may be held or acquired by an "affiliate" of ours, as that term is defined in Rule 144 promulgated under the Securities Act, which shares will be subject to the volume
limitations and other restrictions of Rule 144 described below. The remaining 18,981,698 shares of common stock held by our existing stockholders upon completion of this offering will be
"restricted securities," as that term is defined in Rule 144, and may be resold only after registration under the Securities Act or pursuant to an exemption from such registration, including,
among others, the exemptions provided by Rule 144 and Rule 701 under the Securities Act, which rules are summarized below. These remaining shares of common stock held by our existing
stockholders upon completion of this offering will be available for sale in the public market after the expiration of the lock-up agreements described in "Underwriting," only if registered
or if they qualify for an exemption from registration under Rule 144 or Rule 701 under the Securities Act, as described below.
Rule 144
In general, under Rule 144 as currently in effect, persons who are not one of our affiliates at any time during the three months
preceding a sale may sell shares of our common stock beneficially held upon the earlier of (i) the expiration of a six-month holding period, if we have been subject to the reporting
requirements of the Exchange Act and have filed all required reports for at least 90 days prior to the date of the sale, or (ii) a one-year holding period.
At
the expiration of the six-month holding period, a person who was not one of our affiliates at any time during the three months preceding a sale would be entitled to sell
an unlimited number of shares of our common stock provided current public information about us is available, and a person who was one of our affiliates at any time during the three months preceding a
sale would be entitled to sell within any three-month period a number of shares of common stock that does not exceed the greater of either of the following:
- •
- 1% of the number of shares of our common stock then outstanding, which will equal approximately 247,509 shares
immediately after this offering, based on the number of shares of our common stock outstanding as of April 27, 2012; or
- •
- the average weekly trading volume of our common stock on The NASDAQ Global Select Market during the four calendar weeks
preceding the filing of a notice on Form 144 with respect to the sale.
At
the expiration of the one-year holding period, a person who was not one of our affiliates at any time during the three months preceding a sale would be entitled to sell an
unlimited number of shares of our common stock without restriction. A person who was one of our affiliates at any time during the three months preceding a sale would remain subject to the volume
restrictions described above.
131
Table of Contents
Sales
under Rule 144 by our affiliates are also subject to manner of sale provisions and notice requirements and to the availability of current public information about us.
Rule 701
In general and subject to the expiration of the lock-up restrictions, under Rule 701, any of our employees,
directors, officers, consultants or advisors who purchased shares from us in connection with a qualified compensatory stock or option plan or other written agreement before the effective date of this
offering, or who purchased shares from us after that date upon the exercise of options granted before that date, are eligible to resell such shares in reliance upon Rule 144 beginning
90 days after the date of this prospectus. If such person is not an affiliate, the sale may be made under Rule 144 without compliance with the holding periods of Rule 144 and
subject only to the manner-of-sale restrictions of Rule 144. If such a person is an affiliate, the sale may be made under Rule 144 without compliance with its
one-year minimum holding period, but subject to the other Rule 144 restrictions.
Stock Plans
We intend to file one or more registration statements on Form S-8 under the Securities Act to register shares of our
common stock issued or reserved for issuance under our existing option plan and the new equity incentive plan we intend to adopt in connection with this offering. The first such registration statement
is expected to be filed soon after the date of this prospectus and will automatically become effective upon filing with the SEC. Accordingly, shares registered under such registration statement will
be available for sale in the open market following the effective date, unless such shares are subject to vesting restrictions with us,
Rule 144 restrictions applicable to our affiliates or the lock-up restrictions described below.
Lock-Up Agreements
We, each of our officers and directors and the selling stockholder have agreed, subject to certain exceptions, not to offer, sell,
contract to sell, pledge or otherwise dispose of, directly or indirectly, any shares of our common stock or securities convertible into or exchangeable or exercisable for any shares of our common
stock, enter into a transaction that would have the same effect, or enter into any swap, hedge or other arrangement that transfers, in whole or in part, any of the economic consequences of ownership
of our common stock, whether any of these transactions are to be settled by delivery of our common stock or other securities, in cash or otherwise, or publicly disclose the intention to make any
offer, sale, pledge or disposition, or to enter into any transaction, swap, hedge or other arrangement, without, in each case, the prior written consent of Credit Suisse Securities (USA) LLC for a
period of 180 days after the date of this prospectus. However, in the event that either (i) during the last 17 days of the "lock-up" period, we release earnings results or
material news or a material event relating to us occurs or (ii) prior to the expiration of the "lock-up" period, we announce that we will release earnings results during the
16-day period beginning on the last day of the "lock-up" period, then in either case the expiration of the "lock-up" will be extended until the expiration of the
18-day period beginning on the date of the release of the earnings results or the occurrence of the material news or event, as applicable, unless Credit Suisse Securities (USA) LLC waives,
in writing, such an extension. For additional information, see "Underwriting."
Registration Rights Agreement
Upon completion of this offering, the holders of an aggregate of 18,981,698 shares of our common stock, or their transferees, will be
entitled to certain rights with respect to the registration of their shares under the Securities Act. Except for shares purchased by affiliates, registration of their shares under the Securities Act
would result in these shares becoming freely tradable without restriction under the Securities Act immediately upon effectiveness of the registration, subject to the expiration of the
lock-up period described under "Underwriting" in this prospectus, and to the extent such shares have been released from any repurchase option that we may hold. See "Description of Capital
Stock—Registration Rights Agreement" for more information.
132
Table of Contents
U.S. FEDERAL TAX CONSIDERATIONS FOR NON-UNITED STATES HOLDERS
Overview
The following is a summary of the material U.S. federal income tax consequences of the purchase, ownership and disposition of our
common stock to a non-U.S. holder that purchases shares of our common stock in this offering. For purposes of this summary, a "non-U.S. holder" means a beneficial owner of our
common stock that is, for U.S. federal income tax purposes:
- •
- a nonresident alien individual;
- •
- a foreign corporation (or an entity treated as a foreign corporation for U.S. federal income tax purposes); or
- •
- a foreign estate or foreign trust.
In
the case of a holder that is classified as a partnership for U.S. federal income tax purposes, the tax treatment of a partner in such partnership generally will depend upon the status
of the partner and the activities of the partner and the partnership. If you are a partner in a partnership holding our common stock, then you should consult your own tax advisor.
This
summary is based upon the provisions of the U.S. Internal Revenue Code of 1986, as amended, which we refer to as the Code, the Treasury regulations promulgated thereunder and
administrative and judicial interpretations thereof, all as of the date hereof. Those authorities may be changed, perhaps retroactively, so as to result in U.S. federal income tax consequences
different from those summarized below. We cannot assure you that a change in law, possibly with retroactive application, will not alter significantly the tax considerations that we describe in this
summary. We have not sought and do not plan to seek any ruling from the U.S. Internal Revenue Service, which we refer to as the IRS, with respect to statements made and the conclusions reached in the
following summary, and there can be no assurance that the IRS or a court will agree with our statements and conclusions.
This
summary does not address all aspects of U.S. federal income taxes that may be relevant to non-U.S. holders in light of their personal circumstances, and does not deal
with federal taxes other than the U.S. federal income tax or with non-U.S., state or local tax considerations. Special rules, not discussed here, may apply to certain non-U.S.
holders, including:
- •
- U.S. expatriates;
- •
- controlled foreign corporations;
- •
- passive foreign investment companies; and
- •
- investors in pass-through entities that are subject to special treatment under the Code.
Such
non-U.S. holders should consult their own tax advisors to determine the U.S. federal, state, local and other tax consequences that may be relevant to them.
This
summary applies only to a non-U.S. holder that holds our common stock as a capital asset (within the meaning of Section 1221 of the Code).
If
you are considering the purchase of our common stock, you should consult your own tax advisor concerning the particular U.S. federal income tax consequences to you of the purchase,
ownership and disposition of our common stock, as well as the consequences to you arising under U.S. tax laws other than the federal income tax laws or under the laws of any other taxing jurisdiction.
Dividends
As discussed under the section entitled "Dividend Policy" above, we do not currently anticipate paying any dividends in the foreseeable
future. In the event that we do make a distribution of cash or
133
Table of Contents
property
(other than certain stock distributions) with respect to our common stock (or certain redemptions that are treated as distributions with respect to common stock), any such distribution will
be treated as a dividend for U.S. federal income tax purposes to the extent paid from our current or accumulated earnings and profits (as determined under U.S. federal income tax principles).
Dividends paid to you generally will be subject to withholding of U.S. federal income tax at a 30% rate or such lower rate as may be specified by an applicable income tax treaty. However, dividends
that are effectively connected with the conduct of a trade or business by you within the U.S. and, in cases in which certain tax treaties apply, are attributable to a U.S. permanent establishment, are
not subject to the withholding tax, but instead are subject to U.S. federal income tax on a net income basis at
applicable graduated individual or corporate rates. Certain certification and disclosure requirements including delivery of a properly executed IRS Form W-8ECI must be satisfied for
effectively connected income to be exempt from withholding. Any such effectively connected dividends received by a foreign corporation may be subject to an additional "branch profits tax" at a 30.0%
rate or such lower rate as may be specified by an applicable income tax treaty.
If
the amount of a distribution paid on our common stock exceeds our current and accumulated earnings and profits, such excess will be allocated ratably among each share of common stock
with respect to which the distribution is paid and treated first as a tax-free return of capital to the extent of your adjusted tax basis in each such share, and thereafter as capital gain
from a sale or other disposition of such share of common stock that is taxed to you as described below under the heading "Gain on Disposition of Common Stock." Your adjusted tax basis is generally the
purchase price of such shares, reduced by the amount of any such tax-free returns of capital.
If
you wish to claim the benefit of an applicable treaty rate to avoid or reduce withholding of U.S. federal income tax for dividends, then you must (i) provide the withholding
agent with a properly completed IRS Form W-8BEN (or other applicable form) and certify under penalties of perjury that you are not a U.S. person and are eligible for treaty
benefits, or (ii) if our common stock is held through certain foreign intermediaries, satisfy the relevant certification requirements of applicable U.S. Treasury regulations. Special
certification and other requirements apply to certain non-U.S. holders that act as intermediaries (including partnerships).
If
you are eligible for a reduced rate of U.S. federal income tax pursuant to an income tax treaty, then you may obtain a refund or credit of any excess amounts withheld by filing timely
an appropriate claim with the IRS.
Gain on Disposition of Common Stock
You generally will not be subject to U.S. federal income tax with respect to gain realized on the sale or other taxable disposition of
our common stock, unless:
- •
- the gain is effectively connected with a trade or business you conduct in the U.S., and, in cases in which certain tax
treaties apply, is attributable to a U.S. permanent establishment;
- •
- if you are an individual, you are present in the U.S. for 183 days or more in the taxable year of the sale or other
taxable disposition, and you have a "tax home" (as defined in the Code) in the U.S.; or
- •
- we are or have been during a specified testing period a "U.S. real property holding corporation" for U.S. federal income
tax purposes, and certain other conditions are met. See the discussion under "—Status as a U.S. Real Property Holding Corporation."
If
you are an individual described in the first bullet point above, you will be subject to tax on the net gain derived from the sale under regular graduated U.S. federal income tax
rates. If you are a foreign corporation described in the first bullet point above, you will be subject to tax on your gain under regular graduated U.S. federal income tax rates and, in addition, may
be subject to the branch
134
Table of Contents
profits
tax equal to 30.0% of your effectively connected earnings and profits or at such lower rate as may be specified by an applicable income tax treaty. If you are an individual described in the
second bullet point above, you will be subject to a flat 30.0% tax on the gain derived from the sale, which may be offset by U.S. source capital losses (even though you are not considered a resident
of the U.S.) but may not be offset by any capital loss carryovers.
Status as a U.S. Real Property Holding Corporation
It is possible that we are now, or in the future may become, a U.S. real property holding corporation within the meaning of the Code.
If we are considered a U.S. real property holding corporation at any time during the shorter of the period that you owned our common stock or the five-year period immediately preceding the
disposition of our common stock, you may be subject to a tax on any gain realized on the disposition of shares of our common stock if our common stock is not regularly traded on an established
securities market during the calendar year in which the disposition occurs. In that case, you also may be subject to a withholding tax on the proceeds from the disposition of the shares of our common
stock. We expect that upon the consummation of this offering, our common stock will be regularly traded on an established securities market and, therefore, the tax and the withholding tax described
above would not apply to a disposition of shares, except as provided below. The tax described above would apply to the disposition by you of shares of our common stock even though our common stock is
regularly traded on an established securities market if you are a non-U.S. person who, actually or constructively, beneficially owns more than 5% of the total fair market value of all
outstanding shares of our common stock at any time during the shorter of the period that you owned our common stock or the five-year period
immediately preceding the disposition. The withholding tax described above, however, generally would not apply to the disposition.
Information Reporting and Backup Withholding Tax
We must report annually to the IRS and to you the amount of dividends paid to you and the amount of tax, if any, withheld with respect
to such dividends. The IRS may make this information available to the tax authorities in the country in which you are resident.
In
addition, you may be subject to information reporting requirements and backup withholding tax (currently at a rate of 28%) with respect to dividends paid on, and the proceeds of
disposition of, shares of our common stock, unless, generally, you certify under penalties of perjury (usually on IRS Form W-8BEN) that you are not a U.S. person or you otherwise
establish an exemption. Additional rules relating to information reporting requirements and backup withholding tax with respect to payments of the proceeds from the disposition of shares of our common
stock are as follows:
- •
- if the proceeds are paid to or through the U.S. office of a broker, the proceeds generally will be subject to backup
withholding tax and information reporting, unless you certify under penalties of perjury (usually on IRS Form W-8BEN) that you are not a U.S. person or you otherwise establish an
exemption;
- •
- if the proceeds are paid to or through a non-U.S. office of a broker that is not a U.S. person and is not a
foreign person with certain specified U.S. connections (a "U.S.-related person"), information reporting and backup withholding tax generally will not apply; and
- •
- if the proceeds are paid to or through a non-U.S. office of a broker that is a U.S. person or a U.S.-related
person, the proceeds generally will be subject to information reporting (but not to backup withholding tax), unless you certify under penalties of perjury (usually on IRS
Form W-8BEN) that you are not a U.S. person or you otherwise establish an exemption.
135
Table of Contents
Any
amounts withheld under the backup withholding tax rules may be allowed as a refund or a credit against your U.S. federal income tax liability, provided the required information is
timely furnished by you to the IRS.
New Legislation Affecting Taxation of Common Stock Held By or Through Foreign Entities
Recently enacted legislation generally will impose a withholding tax of 30.0% on dividend income from our common stock and the gross
proceeds of a disposition of our common stock paid to a "foreign financial institution" (as specifically defined for this purpose), unless such institution enters into an agreement with the U.S.
government to collect and provide to the U.S. tax authorities substantial information regarding U.S. account holders of such institution (which would include certain equity and debt holders of such
institution, as well as certain account holders that are foreign entities with U.S. owners). Absent any applicable exception, this legislation also generally will impose a withholding tax of 30.0% on
dividend income from our common stock and the gross proceeds of a disposition of our common stock paid to a foreign entity that is not a foreign financial institution unless such entity provides the
withholding agent either with (i) a certification identifying the substantial U.S. owners of the entity, which generally includes any U.S. person who directly or indirectly owns more than 10.0%
of the entity (or more than zero percent in the case of some entities) or (ii) a certification that the entity does not have any substantial U.S. owners. Under certain circumstances, a
non-U.S. holder of our common stock might be eligible for refunds or credits of such taxes, and a non-U.S. holder might be required to file a U.S. federal income tax return to
claim such refunds or credits. This legislation generally is effective for dividend payments made after December 31, 2013 and payments of gross proceeds made after December 31, 2014.
Investors are encouraged to consult with their own tax advisors regarding the implications of this legislation on their investment in our common stock.
POTENTIAL PURCHASERS OF OUR COMMON STOCK ARE URGED TO CONSULT THEIR OWN TAX ADVISORS TO DETERMINE THE U.S. FEDERAL, STATE, LOCAL AND NON-U.S. TAX
CONSIDERATIONS OF PURCHASING, OWNING AND DISPOSING OF OUR COMMON STOCK.
136
Table of Contents
UNDERWRITING
Under the terms and subject to the conditions contained in an underwriting agreement
dated , 2012, we and the selling
stockholder have agreed to sell to the underwriters named below, for whom Credit Suisse Securities (USA) LLC, Robert W. Baird & Co. Incorporated and Piper Jaffray & Co. are acting
as representatives, the following respective numbers of shares of our common stock:
|
|
|
|
Underwriter
|
|
Number
of Shares |
Credit Suisse Securities (USA) LLC |
|
|
Robert W. Baird & Co. Incorporated |
|
|
Piper Jaffray & Co. |
|
|
KeyBanc Capital Markets Inc. |
|
|
Lazard Capital Markets LLC |
|
|
Raymond James & Associates, Inc. |
|
|
| |
|
|
| |
Total |
|
|
| |
|
|
The
underwriting agreement provides that the underwriters are obligated to purchase all of the shares of common stock in this offering if any are purchased, other than those shares
covered by the over-allotment option described below. The underwriting agreement also provides that if an underwriter defaults the purchase commitments of non-defaulting
underwriters may be increased or this offering may be terminated.
We
have granted to the underwriters a 30-day option to purchase on a pro rata basis up
to and additional shares,
respectively at the initial
public offering price less the underwriting discounts and commissions. The option may be exercised only to cover any over-allotments of common stock.
The
underwriters propose to offer the shares of our common stock initially at the public offering price on the cover page of this prospectus and to selling group members at that price
less a selling concession of $ per share. The underwriters and selling group members may allow a discount of
$ per share on sales to other broker/dealers. After the
initial public offering, the underwriters may change the public offering price and concession and discount to broker/dealers.
The
following table summarizes the compensation and estimated expenses we and the selling stockholder will pay. Such amounts are shown assuming both no exercise and full exercise of the
underwriters' option to purchase additional shares.
|
|
|
|
|
|
|
|
|
|
|
|
|
|
|
|
Per Share |
|
Total |
|
|
|
With
No Exercise |
|
With
Full Exercise |
|
With
No Exercise |
|
With
Full Exercise |
|
Underwriting discounts and commissions paid by us |
|
$ |
|
|
$ |
|
|
$ |
|
|
$ |
|
|
Expenses payable by us |
|
$ |
|
|
$ |
|
|
$ |
|
|
$ |
|
|
Underwriting discounts and commissions paid by selling stockholder |
|
$ |
|
|
$ |
|
|
$ |
|
|
$ |
|
|
Expenses payable by selling stockholder |
|
$ |
|
|
$ |
|
|
$ |
|
|
$ |
|
|
The underwriters have informed us that they do not expect sales to accounts over which the underwriters have discretionary authority to exceed
5.0% of the shares of common stock being offered.
Lazard
Fréres & Co. LLC referred this transaction to Lazard Capital Markets LLC and will receive a referral fee from Lazard Capital Markets LLC in connection therewith.
137
Table of Contents
We
have agreed that we will not offer, sell, contract to sell, pledge or otherwise dispose of, directly or indirectly, or file with the SEC, a registration statement under the Securities
Act relating to, any shares of our common stock or securities convertible into or exchangeable or exercisable for any shares of our common stock, or publicly disclose the intention to make any offer,
sale, pledge, disposition or filing, without the prior written consent of Credit Suisse Securities (USA) LLC, for a period of 180 days after the date of this prospectus, subject to limited
exceptions. However, in the event that either (i) during the last 17 days of the "lock-up" period, we release earnings results or material news or a material event relating
to us occurs or (ii) prior to the expiration of the 'lock-up' period, we announce that we will release earnings results during the 16-day period beginning on the last
day of the "lock-up" period, then in either case the expiration of the 'lock-up' will be extended until the expiration of the 18-day period beginning on the date of
the release of the earnings results or the occurrence of the material news or event, as applicable, unless Credit Suisse Securities (USA) LLC waives, in writing, such an extension.
We,
each of our officers, directors and the selling stockholder have agreed that, subject to certain exceptions, not to offer, sell, contract to sell, pledge or otherwise dispose of,
directly or indirectly, any shares of our common stock or securities convertible into or exchangeable or exercisable for any shares of our common stock, enter into a transaction that would have the
same effect, or enter into any swap, hedge or other arrangement that transfers, in whole or in part, any of the economic consequences of ownership of our common stock, whether any of these
transactions are to be settled by delivery of our common stock or other securities, in cash or otherwise, or publicly disclose the intention to make any offer, sale, pledge or disposition, or to enter
into any transaction, swap, hedge or other arrangement, without, in each case, the prior written consent of Credit Suisse Securities (USA) LLC for a period of 180 days after the date of this
prospectus, subject to limited exceptions. However, in the event that either (i) during the last 17 days of the "lock-up" period, we release earnings results or material news
or a material event relating to us occurs or (ii) prior to the expiration of the "lock-up" period, we announce that we will release earnings results during the 16-day
period beginning on the last day of the "lock-up" period, then in either case the expiration of the "lock-up" will be extended until the expiration of the 18-day
period beginning on the date of the release of the earnings results or the occurrence of the material news or event, as applicable, unless Credit Suisse Securities (USA) LLC waives, in writing, such
an extension.
We
and the selling stockholder have agreed to indemnify the underwriters against liabilities under the Securities Act or contribute to payments that the underwriters may be required to
make in that respect.
We
intend to apply to have our common stock approved for listing on the The NASDAQ Global Select Market under the symbol "IRG."
Some
of the underwriters and their affiliates have engaged in, and may in the future engage in, investment banking and other commercial dealings in the ordinary course of business with
us or our affiliates. They have received, or may in the future receive, customary fees and commissions for these transactions.
Prior
to the completion of this offering, there will have been no public market for our common stock. The initial public offering price will be determined by negotiations among us and
the underwriters. The principal factors to be considered in determining the initial public offering price include the following:
- •
- the information included in this prospectus and otherwise available to the underwriters;
- •
- market conditions for initial public offerings;
- •
- the history of and prospects for our business and our past and present operations;
138
Table of Contents
- •
- our past and present earnings and current financial position;
- •
- an assessment of our management;
- •
- the market for securities of companies in business similar to ours; and
- •
- the general condition of the securities markets.
In
connection with this offering, the underwriters may engage in stabilizing transactions, over-allotment transactions, syndicate covering transactions and penalty bids in
accordance with Regulation M under the Exchange Act.
- •
- Stabilizing transactions permit bids to purchase the underlying security so long as the stabilizing bids do not exceed a
specified maximum.
- •
- Over-allotment transactions involve sales by the underwriters of shares in excess of the number of shares the
underwriters are obligated to purchase, which creates a syndicate short position. The short position may be either a covered short position or a naked short position. In a covered short position, the
number of shares over-allotted by the underwriters is not greater than the number of shares that they may purchase in the over-allotment option. In a naked short position, the
number of shares involved is greater than the number of shares in the over-allotment option. The underwriters may close out any covered short position by either exercising their
over-allotment option and/or purchasing shares in the open market.
- •
- Syndicate covering transactions involve the purchases of our common stock in the open market after the distribution has
been completed in order to cover syndicate short positions. In determining the source of shares to close out the short position, the underwriters will consider, among other things, the price of shares
available for purchase in the open market as compared to the price at which they may purchase shares through the over-allotment option. If the underwriters sell more shares than could be
covered by the over-allotment option, a naked short position, the position can only be closed out by buying shares in the open market. A naked short position is more likely to be created
if the underwriters are concerned that there could be downward pressure on the price of the shares in the open market after pricing that could adversely affect investors who purchase in this offering.
- •
- Penalty bids permit the representative to reclaim a selling concession from a syndicate member when our common stock
originally sold by the syndicate member is purchased in a stabilizing or syndicate covering transaction to cover syndicate short positions.
These
stabilizing transactions, syndicate covering transactions and penalty bids may have the effect of raising or maintaining the market price of our common stock or preventing or
retarding a decline in the market price of our common stock. As a result the price of our common stock may be higher than the price that might otherwise exist in the open market. These transactions
may be effected on The NASDAQ Global Select Market or otherwise and, if commenced, may be discontinued at any time.
A
prospectus in electronic format may be made available on the websites maintained by one or more of the underwriters, or selling group members, if any, participating in this offering
and one or more of the underwriters participating in this offering may distribute prospectuses electronically. The representative may agree to allocate a number of shares to underwriters and selling
group members for sale to their online brokerage account holders. Internet distributions will be allocated by the underwriters and selling group members that will make internet distributions on the
same basis as other allocations.
139
Table of Contents
Conflicts of Interest
KeyBank National Association, an affiliate of KeyBanc Capital Markets Inc., one of the underwriters in this offering, is
expected to receive more than 5% of the net proceeds of this offering in connection with the prepayment of a portion of our senior secured credit facility. See "Use of Proceeds." Accordingly, this
offering is being made in compliance with the requirements of FINRA Rule 5121. As required by FINRA Rule 5121, KeyBanc Capital Markets Inc. will not confirm sales to any account
over which it exercises discretionary authority without the specific written approval of the accountholder. In addition, KeyBank National Association will receive a fee of approximately $25,000 for
its portion of the restructuring fee related to the amendment of our senior secured credit facility.
European Selling Restrictions
In relation to each member state of the European Economic Area which has implemented the Prospectus Directive (each, a relevant member
state) an offer to the public of any shares of common stock which are the subject of the offering contemplated by this prospectus may not be made in that relevant member state, except that an offer to
the public in that relevant member state of any shares of common stock may be made at any time under the following exemptions under the Prospectus Directive, if they have been implemented in that
relevant member state:
- •
- to any legal entity which is a qualified investor as defined in the Prospectus Directive;
- •
- to fewer than 100 or, if the relevant member state has implemented the relevant provision of the 2010 PD Amending
Directive, 150, natural or legal persons (other than qualified investors as defined in the Prospectus Directive), as permitted under the Prospectus Directive; or
- •
- in any other circumstances falling within Article 3(2) of the Prospectus Directive, provided that no such offer of
the common stock shall result in a requirement for the publication by us or any underwriter of a prospectus pursuant to Article 3 of the Prospectus Directive.
For
the purposes of this provision, the expression an "offer to the public" in relation to any shares of common stock in any relevant member state means the communication in any form and
by any means of sufficient information on the terms of the offer and any shares of common stock to be offered so as to enable an investor to decide to purchase any shares of common stock, as the same
may be varied in that member state by any measure implementing the Prospectus Directive in that member state, the expression "Prospectus Directive" means Directive 2003/71/EC (and amendments thereto,
including the
2010 PD Amending Directive, to the extent implemented in the Relevant Member State), and includes any relevant implementing measure in the relevant member state, and the expression "2010 PD Amending
Directive" means Directive 2010/73/EU.
Each underwriter has represented and agreed that:
- •
- it has only communicated or caused to be communicated and will only communicate or cause to be communicated an invitation
or inducement to engage in investment activity (within the meaning of Section 21 of the FSMA) received by it in connection with the issue or sale of the common stock in circumstances in which
Section 21(1) of the FSMA does not apply to us; and
- •
- it has complied and will comply with all applicable provisions of the FSMA with respect to anything done by it in relation
to the common stock in, from or otherwise involving the United Kingdom.
140
Table of Contents
LEGAL MATTERS
Kirkland & Ellis LLP, New York, New York will pass upon the validity of the common stock offered hereby on our behalf.
Kirkland & Ellis LLP represents entities affiliated with J.H. Whitney in connection with certain legal matters. The underwriters are represented by King & Spalding LLP, Atlanta,
Georgia.
EXPERTS
The consolidated balance sheets of Ignite Restaurant Group, Inc. and its subsidiaries as of January 2, 2012 and
January 3, 2011, and the related consolidated statements of operations, changes in stockholder's equity, and cash flows of Ignite Restaurant Group, Inc. and its subsidiaries for the fiscal
years ended January 2, 2012, January 3, 2011 and December 28, 2009, included in this prospectus have been audited by PricewaterhouseCoopers LLP, or PwC, an independent registered
public accounting firm, as stated in their report appearing herein. Such financial statements
have been so included in reliance upon the report of such firm given upon their authority as experts in accounting and auditing.
PwC
informed us that PwC and an entity that is part of the PwC global network of firms, or the PwC Affiliate in the Netherlands, performed non-audit services for affiliates
of J.H. Whitney that were not in accordance with the auditor independence standards of Regulation S-X and the Public Company Accounting Oversight Board, or PCAOB. The
following non-audit services were performed by PwC and the PwC Affiliate in the Netherlands:
- •
- from May 2009 through July 2010, PwC provided certain tax services on a contingent fee basis to a portfolio company of a
J.H. Whitney affiliated fund. The fees for these tax services were approximately $230,000; and
- •
- from October 2007 through June 2009, the PwC Affiliate in the Netherlands provided certain expert services to a portfolio
company of a J.H. Whitney affiliated fund in a litigation involving the portfolio company. The fees for these expert services were approximately $211,000.
PwC
communicated these matters to the audit committee of our parent company, JCS Holdings, LLC, which we refer to as the Parent Audit Committee. The Parent Audit Committee and PwC
individually considered the impact that these non-audit services may have had on PwC's independence with respect to us. Both our Parent Audit Committee and PwC concluded that neither of
these non-audit services would impair PwC's ability to exercise objective and impartial judgment on issues encompassed within the audit of our financial statements.
In
making these determinations, both our Parent Audit Committee and PwC considered, among other things, the amount of fees paid to PwC and the PwC Affiliate in the Netherlands and that
the non-audit services were provided during a time that the entities were not considered affiliates pursuant to the standards under which the audit engagement was performed.
141
Table of Contents
WHERE YOU CAN FIND MORE INFORMATION
We have filed with the SEC a registration statement on Form S-1, including exhibits and schedules, under the
Securities Act with respect to the shares of our common stock offered hereby. This prospectus, which constitutes a part of the registration statement, does not contain all of the information set forth
in the registration statement or the exhibits and schedules filed therewith. For further information with respect to us and the common stock offered hereby, reference is made to the registration
statement and the exhibits and schedules filed therewith. Statements contained in this prospectus regarding the contents of any contract or any other document that is filed as an exhibit to the
registration statement are not necessarily complete, and each such statement is qualified in all respects by reference to the full text of such contract or other document filed as an exhibit to the
registration statement.
Upon
completion of this offering, we will become subject to the information and periodic and current reporting requirements of the Exchange Act, and in accordance therewith, will file
periodic and current reports, proxy statements and other information with the SEC. The registration statement, such periodic and current reports and other information can be inspected and copied at
the Public Reference Room of the SEC located at 100 F Street, N.E., Washington, D.C. 20549. Copies of such materials, including copies of all or any portion of the registration
statement, can be obtained from the Public Reference Room of the SEC at prescribed rates. You can call the SEC at 1-800-SEC-0330 to obtain information on the operation of the Public Reference Room.
Such materials may also be accessed electronically by means of the SEC's website at www.sec.gov.
142
Table of Contents
INDEX TO CONSOLIDATED FINANCIAL STATEMENTS
|
|
|
Report of Independent Registered Public Accounting Firm |
|
F-2 |
Consolidated Balance Sheets as of January 3, 2011 and January 2, 2012 |
|
F-3 |
Consolidated Statements of Operations for the years ended December 28, 2009, January 3, 2011 and
January 2, 2012 |
|
F-4 |
Consolidated Statements of Changes in Stockholder's Equity for the years ended December 28, 2009, January 3,
2011 and January 2, 2012 |
|
F-5 |
Consolidated Statements of Cash Flows for the years ended December 28, 2009, January 3, 2011 and
January 2, 2012 |
|
F-6 |
Notes to Consolidated Financial Statements |
|
F-7 |
Condensed Consolidated Balance Sheets as of January 2, 2012 and March 26, 2012 (unaudited) |
|
F-26 |
Condensed Consolidated Statements of Operations for the twelve weeks ended March 28, 2011 (unaudited) and
March 26, 2012 (unaudited) |
|
F-27 |
Condensed Consolidated Statements of Comprehensive Income for the twelve weeks ended March 28, 2011
(unaudited) and March 26, 2012 (unaudited) |
|
F-28 |
Condensed Consolidated Statements of Cash Flows for the twelve weeks ended March 28, 2011 (unaudited) and
March 26, 2012 (unaudited) |
|
F-29 |
Notes to Condensed Consolidated Financial Statements (unaudited) |
|
F-30 |
F-1
Table of Contents
Report of Independent Registered Public Accounting Firm
To
the Stockholder and Board of Directors of
Ignite Restaurant Group, Inc.
In
our opinion, the accompanying consolidated balance sheets and the related consolidated statements of operations, changes in stockholder's equity and cash flows present fairly, in all
material respects, the financial position of Ignite Restaurant Group, Inc. and its subsidiaries (the "Company") at January 3, 2011 and January 2, 2012, and the results of their
operations and their cash flows for the fiscal years ended December 28, 2009, January 3, 2011, and January 2, 2012, in conformity with accounting principles generally accepted in
the United States of America. These financial statements are the responsibility of the Company's management. Our responsibility is to express an opinion on these financial statements based on our
audits. We conducted our audits of these statements in accordance with the standards of
the Public Company Accounting Oversight Board (United States). Those standards require that we plan and perform the audit to obtain reasonable assurance about whether the financial statements are free
of material misstatement. An audit includes examining, on a test basis, evidence supporting the amounts and disclosures in the financial statements, assessing the accounting principles used and
significant estimates made by management, and evaluating the overall financial statement presentation. We believe that our audits provide a reasonable basis for our opinion.
/s/
PricewaterhouseCoopers LLP
Houston, Texas
March 1,
2012
F-2
Table of Contents
IGNITE RESTAURANT GROUP, INC.
CONSOLIDATED BALANCE SHEETS
(in thousands, except par value and shares)
|
|
|
|
|
|
|
|
|
|
|
|
January 3,
2011 |
|
January 2,
2012 |
|
ASSETS |
|
|
|
|
|
|
|
Current assets |
|
|
|
|
|
|
|
| |
Cash and cash equivalents |
|
$ |
12,572 |
|
$ |
3,725 |
|
| |
Accounts receivable |
|
|
4,596 |
|
|
7,830 |
|
| |
Inventories |
|
|
3,967 |
|
|
4,179 |
|
| |
Deferred tax assets |
|
|
562 |
|
|
1,090 |
|
| |
Prepaid rent and other current assets |
|
|
3,623 |
|
|
4,595 |
|
| |
|
|
|
|
|
| |
|
Total current assets |
|
|
25,320 |
|
|
21,419 |
|
Property and equipment, net |
|
|
125,556 |
|
|
148,131 |
|
Intangible assets, net |
|
|
2,641 |
|
|
2,198 |
|
Deferred charges, net |
|
|
2,251 |
|
|
4,605 |
|
Deferred tax assets |
|
|
— |
|
|
686 |
|
Other assets |
|
|
1,395 |
|
|
3,168 |
|
| |
|
|
|
|
|
| |
|
Total assets |
|
$ |
157,163 |
|
$ |
180,207 |
|
| |
|
|
|
|
|
LIABILITIES AND STOCKHOLDER'S EQUITY |
|
|
|
|
|
|
|
Current liabilities |
|
|
|
|
|
|
|
| |
Accounts payable |
|
$ |
11,126 |
|
$ |
14,157 |
|
| |
Accrued liabilities |
|
|
14,721 |
|
|
20,390 |
|
| |
Income taxes payable |
|
|
1,365 |
|
|
— |
|
| |
Current portion of debt obligations |
|
|
137 |
|
|
3,007 |
|
| |
|
|
|
|
|
| |
|
Total current liabilities |
|
|
27,349 |
|
|
37,554 |
|
Long-term debt obligations |
|
|
34,696 |
|
|
114,750 |
|
Deferred rent |
|
|
4,221 |
|
|
5,510 |
|
Deferred tax liabilities |
|
|
375 |
|
|
— |
|
Other long-term liabilities |
|
|
524 |
|
|
800 |
|
| |
|
|
|
|
|
| |
|
Total liabilities |
|
|
67,165 |
|
|
158,614 |
|
| |
|
|
|
|
|
Commitments and contingencies |
|
|
|
|
|
|
|
Stockholder's equity |
|
|
|
|
|
|
|
| |
Common stock, $1.00 par value per share, 1,000 shares authorized, issued and outstanding |
|
|
1 |
|
|
1 |
|
| |
Additional paid-in capital |
|
|
77,623 |
|
|
11,720 |
|
| |
Accumulated earnings |
|
|
12,680 |
|
|
9,872 |
|
| |
Accumulated other comprehensive loss |
|
|
(306 |
) |
|
— |
|
| |
|
|
|
|
|
| |
|
Total stockholder's equity |
|
|
89,998 |
|
|
21,593 |
|
| |
|
|
|
|
|
| |
|
Total liabilities and stockholder's equity |
|
$ |
157,163 |
|
$ |
180,207 |
|
| |
|
|
|
|
|
See
accompanying notes to consolidated financial statements.
F-3
Table of Contents
IGNITE RESTAURANT GROUP, INC.
CONSOLIDATED STATEMENTS OF OPERATIONS
(in thousands, except earnings per share)
|
|
|
|
|
|
|
|
|
|
|
|
|
|
|
Fiscal Year |
|
|
|
2009 |
|
2010 |
|
2011 |
|
Revenues |
|
$ |
307,801 |
|
$ |
351,327 |
|
$ |
405,243 |
|
Costs and expenses |
|
|
|
|
|
|
|
|
|
|
| |
Restaurant operating costs |
|
|
|
|
|
|
|
|
|
|
| |
|
Cost of sales |
|
|
89,845 |
|
|
103,981 |
|
|
127,607 |
|
| |
|
Labor and benefits |
|
|
87,920 |
|
|
98,162 |
|
|
111,721 |
|
| |
|
Occupancy expenses |
|
|
25,243 |
|
|
27,440 |
|
|
30,244 |
|
| |
|
Other operating expenses |
|
|
58,140 |
|
|
63,963 |
|
|
71,696 |
|
| |
General and administrative |
|
|
18,765 |
|
|
20,634 |
|
|
23,340 |
|
| |
Depreciation and amortization |
|
|
12,733 |
|
|
13,445 |
|
|
16,063 |
|
| |
Pre-opening costs |
|
|
1,323 |
|
|
3,844 |
|
|
3,989 |
|
| |
Restaurant impairments and closures |
|
|
15 |
|
|
909 |
|
|
333 |
|
| |
Loss on disposal of property and equipment |
|
|
1,017 |
|
|
2,797 |
|
|
821 |
|
| |
|
|
|
|
|
|
|
| |
|
Total costs and expenses |
|
|
295,001 |
|
|
335,175 |
|
|
385,814 |
|
| |
|
|
|
|
|
|
|
Income from operations |
|
|
12,800 |
|
|
16,152 |
|
|
19,429 |
|
Interest expense, net |
|
|
(3,867 |
) |
|
(3,831 |
) |
|
(9,215 |
) |
Gain on insurance settlements |
|
|
1,192 |
|
|
944 |
|
|
1,126 |
|
| |
|
|
|
|
|
|
|
Income before income taxes |
|
|
10,125 |
|
|
13,265 |
|
|
11,340 |
|
Income tax expense |
|
|
255 |
|
|
1,417 |
|
|
87 |
|
| |
|
|
|
|
|
|
|
Net income |
|
$ |
9,870 |
|
$ |
11,848 |
|
$ |
11,253 |
|
| |
|
|
|
|
|
|
|
Basic and diluted net income per share data: |
|
|
|
|
|
|
|
|
|
|
| |
Net income per share |
|
|
|
|
|
|
|
|
|
|
| |
|
Basic and diluted |
|
$ |
9,870.00 |
|
$ |
11,848.00 |
|
$ |
11,253.00 |
|
| |
Weighted average shares outstanding |
|
|
|
|
|
|
|
|
|
|
| |
|
Basic and diluted |
|
|
1 |
|
|
1 |
|
|
1 |
|
See
accompanying notes to consolidated financial statements.
F-4
Table of Contents
IGNITE RESTAURANT GROUP, INC.
CONSOLIDATED STATEMENTS OF CHANGES IN STOCKHOLDER'S EQUITY
(in thousands, except shares and as indicated)
|
|
|
|
|
|
|
|
|
|
|
|
|
|
|
|
|
|
|
|
|
|
|
Common Stock |
|
|
|
|
|
Accumulated
Other
Comprehensive
Loss |
|
|
|
|
|
Additional
Paid-in
Capital |
|
Accumulated
(Deficit)/
Earnings |
|
|
|
|
|
Shares |
|
Amount |
|
Total |
|
Balance at December 29, 2008 |
|
|
1,000 |
|
$ |
1 |
|
$ |
77,518 |
|
$ |
(9,038 |
) |
$ |
(804 |
) |
$ |
67,677 |
|
Components of comprehensive income: |
|
|
|
|
|
|
|
|
|
|
|
|
|
|
|
|
|
|
|
| |
Net income |
|
|
— |
|
|
— |
|
|
— |
|
|
9,870 |
|
|
— |
|
|
9,870 |
|
| |
Change in fair value of cash flow hedge |
|
|
— |
|
|
— |
|
|
— |
|
|
— |
|
|
89 |
|
|
89 |
|
| |
|
|
|
|
|
|
|
|
|
|
|
|
|
|
|
|
|
|
| |
Total comprehensive income |
|
|
|
|
|
|
|
|
|
|
|
|
|
|
|
|
|
9,959 |
|
Capital contribution |
|
|
— |
|
|
— |
|
|
51 |
|
|
— |
|
|
— |
|
|
51 |
|
Stock-based compensation |
|
|
— |
|
|
— |
|
|
9 |
|
|
— |
|
|
— |
|
|
9 |
|
| |
|
|
|
|
|
|
|
|
|
|
|
|
|
Balance at December 28, 2009 |
|
|
1,000 |
|
$ |
1 |
|
$ |
77,578 |
|
$ |
832 |
|
$ |
(715 |
) |
$ |
77,696 |
|
| |
|
|
|
|
|
|
|
|
|
|
|
|
|
Components of comprehensive income: |
|
|
|
|
|
|
|
|
|
|
|
|
|
|
|
|
|
|
|
| |
Net income |
|
|
— |
|
|
— |
|
|
— |
|
|
11,848 |
|
|
— |
|
|
11,848 |
|
| |
Change in fair value of cash flow hedge, inclusive of cumulative tax effect of $0.2 million |
|
|
— |
|
|
— |
|
|
— |
|
|
— |
|
|
409 |
|
|
409 |
|
| |
|
|
|
|
|
|
|
|
|
|
|
|
|
|
|
|
|
|
| |
Total comprehensive income |
|
|
|
|
|
|
|
|
|
|
|
|
|
|
|
|
|
12,257 |
|
Stock-based compensation |
|
|
— |
|
|
— |
|
|
45 |
|
|
— |
|
|
— |
|
|
45 |
|
| |
|
|
|
|
|
|
|
|
|
|
|
|
|
Balance at January 3, 2011 |
|
|
1,000 |
|
$ |
1 |
|
$ |
77,623 |
|
$ |
12,680 |
|
$ |
(306 |
) |
$ |
89,998 |
|
Components of comprehensive income: |
|
|
|
|
|
|
|
|
|
|
|
|
|
|
|
|
|
|
|
| |
Net income |
|
|
— |
|
|
— |
|
|
— |
|
|
11,253 |
|
|
— |
|
|
11,253 |
|
| |
Change in fair value of cash flow hedge, inclusive of tax effect of ($0.2) million |
|
|
— |
|
|
— |
|
|
— |
|
|
— |
|
|
(121 |
) |
|
(121 |
) |
| |
Termination of interest rate swap |
|
|
— |
|
|
— |
|
|
— |
|
|
— |
|
|
427 |
|
|
427 |
|
| |
|
|
|
|
|
|
|
|
|
|
|
|
|
|
|
|
|
|
| |
Total comprehensive income |
|
|
— |
|
|
— |
|
|
|
|
|
|
|
|
|
|
|
11,559 |
|
Dividends paid |
|
|
— |
|
|
— |
|
|
(65,939 |
) |
|
(14,061 |
) |
|
— |
|
|
(80,000 |
) |
Stock-based compensation |
|
|
|
|
|
|
|
|
36 |
|
|
— |
|
|
— |
|
|
36 |
|
| |
|
|
|
|
|
|
|
|
|
|
|
|
|
Balance at January 2, 2012 |
|
|
1,000 |
|
$ |
1 |
|
$ |
11,720 |
|
$ |
9,872 |
|
$ |
— |
|
$ |
21,593 |
|
| |
|
|
|
|
|
|
|
|
|
|
|
|
|
See
accompanying notes to consolidated financial statements.
F-5
Table of Contents
IGNITE RESTAURANT GROUP, INC.
CONSOLIDATED STATEMENTS OF CASH FLOWS
(in thousands)
|
|
|
|
|
|
|
|
|
|
|
|
|
|
|
|
2009 |
|
2010 |
|
2011 |
|
Cash flows from operating activities |
|
|
|
|
|
|
|
|
|
|
Net income |
|
$ |
9,870 |
|
$ |
11,848 |
|
$ |
11,253 |
|
Adjustments to reconcile net income to net cash provided by operating activities: |
|
|
|
|
|
|
|
|
|
|
| |
Depreciation and amortization |
|
|
12,733 |
|
|
13,445 |
|
|
16,063 |
|
| |
Amortization of debt issuance costs |
|
|
740 |
|
|
754 |
|
|
2,270 |
|
| |
Stock-based compensation |
|
|
9 |
|
|
45 |
|
|
36 |
|
| |
Restaurant impairments |
|
|
— |
|
|
276 |
|
|
— |
|
| |
Deferred income tax |
|
|
— |
|
|
— |
|
|
(1,308 |
) |
| |
Gain on insurance related to property and equipment |
|
|
(1,192 |
) |
|
(944 |
) |
|
(1,126 |
) |
| |
Loss on disposal of property and equipment |
|
|
1,017 |
|
|
2,797 |
|
|
821 |
|
| |
Lease incentive allowance received |
|
|
— |
|
|
350 |
|
|
60 |
|
| |
Decrease (increase) in operating assets: |
|
|
|
|
|
|
|
|
|
|
| |
|
Accounts receivable |
|
|
988 |
|
|
(1,131 |
) |
|
(2,449 |
) |
| |
|
Inventory |
|
|
(680 |
) |
|
(155 |
) |
|
(212 |
) |
| |
|
Prepaids and other assets |
|
|
(4,183 |
) |
|
888 |
|
|
(2,754 |
) |
| |
(Decrease) increase in operating liabilities: |
|
|
|
|
|
|
|
|
|
|
| |
|
Accounts payable and accrued liabilities |
|
|
(4,924 |
) |
|
9,662 |
|
|
8,475 |
|
| |
|
Other liabilities |
|
|
575 |
|
|
402 |
|
|
1,588 |
|
| |
|
|
|
|
|
|
|
| |
|
|
Net cash provided by operating activities |
|
|
14,953 |
|
|
38,237 |
|
|
32,717 |
|
| |
|
|
|
|
|
|
|
Cash flows from investing activities |
|
|
|
|
|
|
|
|
|
|
| |
Proceeds from maturity of investments |
|
|
3,073 |
|
|
— |
|
|
— |
|
| |
Purchases of property and equipment |
|
|
(18,348 |
) |
|
(33,333 |
) |
|
(40,102 |
) |
| |
Proceeds from property insurance claims |
|
|
400 |
|
|
2,738 |
|
|
281 |
|
| |
Proceeds from disposal of property and equipment |
|
|
130 |
|
|
109 |
|
|
4 |
|
| |
|
|
|
|
|
|
|
| |
|
|
Net cash used in investing activities |
|
|
(14,745 |
) |
|
(30,486 |
) |
|
(39,817 |
) |
| |
|
|
|
|
|
|
|
Cash flows from financing activities |
|
|
|
|
|
|
|
|
|
|
| |
Proceeds from long-term debt |
|
|
— |
|
|
— |
|
|
120,000 |
|
| |
Payments on long-term debt |
|
|
(102 |
) |
|
(102 |
) |
|
(37,046 |
) |
| |
Payments on capital leases |
|
|
(291 |
) |
|
(53 |
) |
|
(30 |
) |
| |
Debt issuance costs paid |
|
|
— |
|
|
— |
|
|
(4,671 |
) |
| |
Dividends paid |
|
|
— |
|
|
— |
|
|
(80,000 |
) |
| |
Capital contributions |
|
|
51 |
|
|
— |
|
|
— |
|
| |
|
|
|
|
|
|
|
| |
|
Net cash used in financing activities |
|
|
(342 |
) |
|
(155 |
) |
|
(1,747 |
) |
| |
|
|
|
|
|
|
|
Net (decrease) increase in cash and cash equivalents |
|
|
(134 |
) |
|
7,596 |
|
|
(8,847 |
) |
Cash and cash equivalents at beginning of period |
|
|
5,110 |
|
|
4,976 |
|
|
12,572 |
|
| |
|
|
|
|
|
|
|
Cash and cash equivalents at end of period |
|
$ |
4,976 |
|
$ |
12,572 |
|
$ |
3,725 |
|
| |
|
|
|
|
|
|
|
See
accompanying notes to consolidated financial statements.
F-6
Table of Contents
IGNITE RESTAURANT GROUP, INC.
Notes to Consolidated Financial Statements
Note 1—Description of Business
Ignite Restaurant Group, Inc. (referred to herein as the "Company," "Ignite," "we," "us" or "our") operates two highly differentiated restaurant businesses, Joe's Crab Shack and
Brick House Tavern + Tap. As of January 2, 2012, we owned and operated 119 Joe's Crab Shack restaurants and 16 Brick House Tavern + Tap restaurants in 31 states within the United
States. Joe's Crab Shack is an established, national chain of casual seafood restaurants. Joe's serves a variety of high-quality seafood items, with an emphasis on crab. Joe's is a
high-energy, family-friendly restaurant that encourages guests to "roll up your sleeves and crack into some crab." Brick House Tavern + Tap is a casual restaurant business that
provides guests a differentiated "gastro pub" experience by offering a distinctive blend of menu items in a polished setting. Brick House seeks to strike a balance between providing guests with an
elevated experience while also appealing to "every-man, every-day."
J.H.
Whitney VI, L.P. ("J.H. Whitney VI"), an affiliate of J.H. Whitney Capital Partners, LLC, holds all the Series A preferred units of JCS
Holdings, LLC, our parent. Consequently, J.H. Whitney VI holds approximately 100% of our total voting stock and, thus, is able to exert substantial influence over us and to
control matters requiring approval by our shareholders, including the election of directors, increasing our authorized capital stock, or a merger or sale of substantially all of our assets. As a
result of J.H. Whitney VI's control of us, no change of control can occur without J.H. Whitney VI's consent.
Note 2—Significant Accounting Policies
Principles of Consolidation
The accompanying consolidated financial statements include the accounts of Ignite and its wholly-owned subsidiaries. All significant
intercompany balances and transactions have been eliminated in consolidation.
Fiscal Year
Our fiscal year ends on the Monday nearest to December 31 of each year. Fiscal year 2010 was a 53-week year, while
fiscal years 2009 and 2011 were 52-week years. References to 2009, 2010, and 2011 are references to fiscal years ended December 28, 2009, January 3, 2011, and
January 2, 2012, respectively. The first three quarters of our fiscal year consist of 12 weeks and our fourth quarter consists of 16 weeks for 52-week fiscal years and
17 weeks for 53-week fiscal years.
Segment Reporting
We own and operate the Joe's Crab Shack and Brick House Tavern + Tap restaurant brands in the United States. All of our
restaurants compete in the full-service casual dining industry, providing in-restaurant, full service, casual dining, food away from home to our guests. Our brands also possess similar
production methods, distribution methods, and economic characteristics, resulting in similar long-term expected financial performance characteristics. Therefore, we believe we meet the
criteria for aggregating our restaurant operations into a single reporting segment.
F-7
Table of Contents
IGNITE RESTAURANT GROUP, INC.
Notes to Consolidated Financial Statements (Continued)
Note 2—Significant Accounting Policies (Continued)
Subsequent Events
We evaluate events subsequent to the balance sheet date through the date the financial statements were issued, noting no subsequent
events or transactions that required recognition or disclosures in the financial statements.
Use of Estimates
The preparation of financial statements in conformity with generally accepted accounting principles requires management to make
estimates and assumptions that affect the reported amounts of assets and liabilities and disclosure of contingent assets and liabilities at the date of the financial statements and the reported
amounts of revenues and expenses during the reporting period. Actual results could differ from those estimates.
Fair Value Measurements
We apply fair value accounting for all financial assets and liabilities and nonfinancial assets and liabilities that are recognized or
disclosed at fair value in the financial statements on a recurring basis. We define fair value as the price that would be received from selling an asset or paid to transfer a liability in an orderly
transaction between market participants at the measurement date. When determining the fair value measurements for assets and liabilities that are required to be recorded at fair value, we assume the
highest and best use of the asset by market participants in which we would transact and the market-based risk measurements or assumptions that market participants would use in pricing the asset or
liability, such as inherent risk, transfer restrictions, and credit risk.
We
apply the following fair value hierarchy, which prioritizes the inputs used to measure fair value into three levels, and base the categorization within the hierarchy upon the lowest
level of input that is available and significant to the fair value measurement:
|
|
|
| Level 1 – |
|
Quoted prices in active markets for identical assets or liabilities. |
Level 2 – |
|
Observable inputs other than quoted prices in active markets for identical assets or liabilities, quoted prices for identical or similar assets or liabilities in inactive markets, or other inputs that are observable
or can be corroborated by observable market data for substantially the full term of the assets or liabilities. |
Level 3 – |
|
Inputs that are both unobservable and significant to the overall fair value measurement reflect an entity's estimates of assumptions that market participants would use in pricing the asset or liability. |
Financial Instruments
We record all financial instruments at cost, which is the fair value at the date of transaction. The amounts reported in the
consolidated balance sheets for cash and cash equivalents, investments, accounts receivable, derivative financial instruments, and accounts payable and accrued liabilities approximate their fair value
because of the short-term maturities of these instruments. The carrying amount of debt is a reasonable estimate of its fair value given the variable rate of interest associated with the
instruments.
F-8
Table of Contents
IGNITE RESTAURANT GROUP, INC.
Notes to Consolidated Financial Statements (Continued)
Note 2—Significant Accounting Policies (Continued)
Revenue Recognition
Revenues from food and beverage sales are recognized when payment is tendered at the point-of-sale and are
presented net of promotional allowances, discounts, and employee meals.
Revenues
from the sale of gift cards are deferred and recognized upon redemption. Deferred gift card revenue included in accrued liabilities in our consolidated balance sheets was
$1.5 million and $1.9 million as of January 3, 2011 and January 2, 2012, respectively. Our gift cards do not have an expiration date and we do not deduct non-usage fees
from outstanding gift card balances. We recognize gift card breakage income exclusive of amounts subject to state escheatment laws when the likelihood of redemption of the cards becomes remote. We
recorded breakage income of $0.3 million during 2011, the first year in which we have accumulated enough redemption historical data to make such an estimate, and is included in revenues in our
consolidated statements of operations. As 2011 was the first year in which we recognized breakage income, the amount recognized includes breakage income related to gift cards sold since the inception
of the program in 2007.
We
also benefit from certain vendor rebates which are recorded as a reduction to cost of sales. Additionally, we may enter into certain contracts that provide marketing allowances, which
are amortized over the life of the contract.
Cash and Cash Equivalents
We consider cash on hand in restaurant units, deposits in banks, and short-term marketable securities with original
maturities of 90 days or less as cash and cash equivalents.
Investments
Investments include short-term marketable securities with original maturities greater than 90 days.
Accounts Receivable
Accounts receivable consist primarily of receivables from major credit card processors. We do not provide an allowance for doubtful
accounts due to the relative certainty of collection of these receivables and based on our prior loss history with these credit card companies.
Inventories
Inventories are stated at the lower of cost or market, and consist of food, beverage, and retail merchandise. Food and beverage cost is
determined using the average cost method. Retail merchandise cost is on a first-in, first-out basis.
F-9
Table of Contents
IGNITE RESTAURANT GROUP, INC.
Notes to Consolidated Financial Statements (Continued)
Note 2—Significant Accounting Policies (Continued)
Property and Equipment
Property and equipment acquired is stated at cost less accumulated depreciation. Depreciation is calculated using the
straight-line method, based on the following estimated useful lives:
|
|
|
Leasehold improvements |
|
Shorter of 20 years or primary lease term |
Kitchen equipment |
|
10 years |
Furniture, fixtures and equipment |
|
10 years |
Computer equipment |
|
5 years |
We
capitalize major replacements and improvements that increase the useful life of the asset, whereas we expense repairs and maintenance as incurred. The cost and accumulated
depreciation of assets sold or otherwise disposed of are removed from the balance sheet and any gain or loss is included in the statement of operations.
We
capitalize direct costs associated with the site acquisition and construction of restaurant units, including direct internal payroll and payroll-related costs, incremental travel
expenses, and interest cost as leasehold improvements. If we subsequently determine that we will not continue acquiring or developing a project for which we have been capitalizing costs, any
previously capitalized internal development and third-party costs will be written off as dead deals and included in general and administrative expenses.
We
changed our business model during 2010 from primarily contracting with third parties to manage our construction projects to employing internal resources. During the third quarter of
2011, we identified certain previously expensed personnel, travel and interest costs which should have been capitalized and amortized over the applicable useful life of the related restaurant unit
assets.
We
assessed the materiality of these errors and concluded that they were not material to any prior annual or interim periods. We have revised our consolidated financial statements as of
and for the fiscal year ended January 3, 2011 to correct these transactions, and we will revise our previously issued interim fiscal year 2011 financial statements to correct these amounts when
such financial statements are included in future filings. See also the impact on unaudited quarterly financial information in Note 14.
The
consolidated balance sheet as of January 3, 2011 presented herein has been revised to correct Property and equipment, net, in the amount of $313,000, from previously reported
amounts of $125.2 million to $125.5 million and Stockholder's equity in the amount of $285,000 from a previously reported amount of $89.7 million to $90.0 million as of
January 3, 2011.
F-10
Table of Contents
IGNITE RESTAURANT GROUP, INC.
Notes to Consolidated Financial Statements (Continued)
Note 2—Significant Accounting Policies (Continued)
The
table below presents the impact of the revision in our consolidated statement of operations for the fiscal year ended January 3, 2011:
|
|
|
|
|
|
|
|
|
|
|
|
|
Fiscal Year Ended January 3, 2011 |
|
|
|
As Previously
Reported |
|
Adjustment |
|
As Revised |
|
|
|
(in '000s)
|
|
Statement of operations |
|
|
|
|
|
|
|
|
|
|
General and administrative expenses |
|
$ |
20,852 |
|
$ |
(218 |
) |
$ |
20,634 |
|
Depreciation and amortization |
|
|
13,435 |
|
|
10 |
|
|
13,445 |
|
Total costs and expenses |
|
|
335,383 |
|
|
(208 |
) |
|
335,175 |
|
Income from operations |
|
|
15,944 |
|
|
208 |
|
|
16,152 |
|
Interest expense, net |
|
|
3,936 |
|
|
(105 |
) |
|
3,831 |
|
Income before income taxes |
|
|
12,952 |
|
|
313 |
|
|
13,265 |
|
Income tax expense |
|
|
1,388 |
|
|
29 |
|
|
1,417 |
|
Net income |
|
|
11,564 |
|
|
284 |
|
|
11,848 |
|
We
have revised Net cash used in investing activities from previously reported $30.2 million to $30.5 million to reflect the additional capitalized amounts, with a
corresponding increase in Net cash provided by operating activities from previously reported $37.9 million to $38.2 million in the consolidated statement of cash flows for the year ended
January 3, 2011.
Impairment of Long-Lived Assets
We evaluate the recoverability of the carrying amount of long-lived assets, which include property and equipment and
intangible assets with definite useful lives, whenever events and circumstances indicate that the carrying value of an asset may not be fully recoverable. Our review for impairment of these
long-lived assets takes into account estimates of future undiscounted cash flows. Factors considered include, but are not limited to, significant underperformance relative to historical or
projected future operating results, significant changes in the manner of use of the acquired assets or the strategy for the overall business, and significant negative industry or economic trends. Our
asset group for impairment testing is comprised of the assets and liabilities of each of our individual restaurants, since this is the lowest level of identifiable cash flows. An impairment loss is
recognized if the future undiscounted cash flows associated with the assets are less than their carrying value. Impairment losses are measured as the amount by which the carrying values of the assets
exceed their fair values. For assets held for sale or disposal, we measure fair value using quoted market prices or an estimation of net realizable value.
Restaurant Closure
Costs associated with restaurant closures are recorded when the decision is made to close the restaurant. Expenses and losses related
to closed restaurants are recorded in restaurant impairments and closures and loss on disposal of property and equipment in our consolidated statements of operations.
F-11
Table of Contents
IGNITE RESTAURANT GROUP, INC.
Notes to Consolidated Financial Statements (Continued)
Note 2—Significant Accounting Policies (Continued)
Intangible Assets
Intangible assets consist of trademarks we acquired during the purchase of Joe's Crab Shack from Landry's Restaurants, Inc.
("Landry's") in November 2006. At the time of purchase, the trademarks were determined to be approximately $4.4 million, and as of January 3, 2011 and January 2, 2012 had
accumulated amortization of approximately $1.8 million and $2.2 million, respectively. Trademarks are amortized on a straight-line basis over their estimated useful life of
10 years. Amortization expense was approximately $0.4 million for 2009, 2010 and 2011, respectively.
Scheduled
amortization of trademarks is as follows (in thousands):
|
|
|
|
|
Fiscal Year
|
|
Amount |
|
2012 |
|
$ |
443 |
|
2013 |
|
|
443 |
|
2014 |
|
|
443 |
|
2015 |
|
|
443 |
|
2016 |
|
|
426 |
|
| |
|
|
|
|
|
$ |
2,198 |
|
| |
|
|
|
Deferred Charges
Debt issuance costs representing costs to obtain long-term financing are accounted for as a deferred charge and amortized
using the interest method over the term of the related financing. Amortization of debt issuance costs, which was approximately $0.7 million, $0.7 million, and $0.8 million for
2009, 2010 and 2011, respectively, are included in interest expense in our consolidated statements of operations.
Scheduled
amortization of debt issuance costs is as follows (in thousands):
|
|
|
|
|
Fiscal Year
|
|
Amount |
|
2012 |
|
$ |
998 |
|
2013 |
|
|
967 |
|
2014 |
|
|
912 |
|
2015 |
|
|
831 |
|
2016 |
|
|
185 |
|
| |
|
|
|
|
|
$ |
3,893 |
|
| |
|
|
|
In
2007 we entered into sale-leaseback transactions related to 29 properties we owned at that time and recognized deferred costs in the amount of approximately
$0.9 million, with accumulated amortization of $129,000 and $176,000 as of January 3, 2011 and January 2, 2012, respectively. These costs are being amortized over the life of the
leases and we recorded amortization expense of $51,000, $47,000, and $46,000 for 2009, 2010, and 2011, respectively.
F-12
Table of Contents
IGNITE RESTAURANT GROUP, INC.
Notes to Consolidated Financial Statements (Continued)
Note 2—Significant Accounting Policies (Continued)
Leases
We currently lease all of our restaurant locations under leases classified as operating leases. Minimum base rent for our operating
leases, which generally have escalating rentals over the term of the lease, is recorded on a straight-line basis over the lease term. As such, an equal amount of rent expense is attributed
to each period during the term of the lease regardless of when actual payments occur. Lease terms begin on the inception date and include option periods only where such renewals are imminent and
assured. The difference between rent expense and actual cash payments is classified as deferred rent in the consolidated balance sheets.
Certain
leases contain provisions that require additional rental payments based upon restaurant sales volume ("contingent rentals"). Contingent rentals are accrued each period as the
liabilities are incurred, in addition to the straight-line rent expense noted above.
Insurance Liabilities
We maintain large deductibles on workers' compensation, general liability, property, and business interruption insurance coverage.
These policies have been structured to limit our per-occurrence exposure. Our estimated liabilities for workers' compensation and general liability are based on our judgment regarding a
number of assumptions and factors, including the frequency and severity of claims, claims development history, case jurisdiction, applicable legislation, and our claims settlement practices.
Hedging Activity
We use financial derivatives to manage exposure to interest rate risks. Our derivative instrument is structured as a cash flow hedge,
which focuses on variability in cash flows of future transactions. The counterparty to the instrument is a major financial institution who also participates in our bank credit facilities. We do not
use this hedge instrument for speculative purposes. Derivative instruments are recorded in the balance sheet at fair value. Changes in the fair value of derivatives that are highly effective and are
designated and qualify as cash flow hedges are recorded in other comprehensive income until realized.
Advertising Expenses
Advertising costs are expensed as incurred. Advertising expenses were approximately $16.7 million, $17.2 million, and
$17.9 million for 2009, 2010 and 2011, respectively, and are included in other operating expenses in our consolidated statements of operations.
Pre-opening Costs
Non-capital expenditures associated with the opening of new or converted restaurants are expensed as incurred.
Pre-opening costs consist of costs incurred prior to opening a new or converted restaurant and are made up primarily of manager salaries, employee payroll, and other costs related to
training and preparing new or converted restaurants for opening.
F-13
Table of Contents
IGNITE RESTAURANT GROUP, INC.
Notes to Consolidated Financial Statements (Continued)
Note 2—Significant Accounting Policies (Continued)
Stock-based Compensation
Certain key members of management and independent directors have been granted common units of JCS Holdings, LLC, our
parent company, under unit grant agreements. Because our parent company's membership interests have no active market, we performed a valuation to determine the fair value of each common unit granted
in fiscal year 2009. The valuation used the market and income approaches with an appropriate discount factor for the common unit's lack of marketability. No units were granted in fiscal years 2010 or
2011.
We
recognize compensation expense for employee and independent director services received in exchange for our parent company's common units, which is equal to the fair value of the
common units at grant date. We ratably expense the fair value of grants in general and administrative expenses in our consolidated statements of operations over the remaining service period of the
awards.
Interest Expense, Net
Interest expense, net consists primarily of interest expense related to our debt and amortization of debt issuance costs, net of
interest income totalling $1,000, $7,000, and $0 for fiscal years ended 2009, 2010 and 2011, respectively, and capitalized interest expense of $0.3 million in 2011, $0.2 million in 2010,
and $0 in 2009.
Income Taxes
We are subject to U.S. federal income tax and income taxes imposed in the state and local jurisdictions where we operate our
restaurants. Deferred income taxes are provided on temporary differences between financial statement and income tax reporting. Temporary differences are differences between the amounts of assets and
liabilities reported for financial statement purposes and their tax bases. Deferred tax assets are recognized for temporary differences that will be deductible in future years' tax returns and for
operating loss and tax credit carryforwards. Deferred tax assets are reduced by a valuation allowance if it is deemed more likely than not that some or all of the deferred tax assets will not be
realized. In assessing the realizability of deferred tax assets, we consider whether it is more likely than not that some portion or all of the deferred tax assets will not be realized. The ultimate
realization of deferred tax assets is dependent upon the generation of future taxable income during the periods in which those temporary differences become deductible. We consider the scheduled
reversal of deferred tax liabilities, projected future taxable income, and tax planning strategies in making this assessment. Deferred tax liabilities are recognized for temporary differences that
will be taxable in future years' tax returns.
We
account for uncertain tax positions under Financial Accounting Standards Board ("FASB") guidance, which prescribes a minimum probability threshold that a tax position must meet before
a financial statement benefit is recognized. The minimum threshold is defined as a tax position that is more likely than not to be sustained upon examination by tax authorities, based on the technical
merits of the position. The tax benefit to be recognized is measured as the largest amount of benefit that is greater than fifty percent likely of being realized upon ultimate settlement. See
Note 9 for information regarding changes in our unrecognized tax benefits during fiscal year 2010.
F-14
Table of Contents
IGNITE RESTAURANT GROUP, INC.
Notes to Consolidated Financial Statements (Continued)
Note 2—Significant Accounting Policies (Continued)
Claims and Other Contingencies
We recognize legal claims and other loss contingencies when information becomes available indicating that a liability has been incurred
and the loss amount can be reasonably estimated. Predicting the outcome of claims and litigation involves substantial uncertainties that could cause actual results to vary materially from estimates.
We recognize legal expenses, including those related to loss contingencies, as incurred.
Generally,
we do not recognize gain contingencies until all contingencies have been resolved, but we recognize gain contingencies that are recoveries of previously recognized contingent
losses when realization of the recovery is deemed probable and reasonably estimable.
Recent Accounting Pronouncements
In May 2011, the FASB issued Accounting Standards Update ("ASU") No. 2011-04, Fair Value
Measurement (Topic 820): Amendments to Achieve Common Fair Value Measurement and Disclosure Requirements in US GAAP and IFRS, which clarifies Topic 820 and provides
guidance on changes to certain principles or requirements for measuring fair value. The amendment is effective during interim and annual periods beginning after December 15, 2011. We do not
believe that adoption of this standard will have a significant impact on our consolidated financial statements.
In
June 2011, the FASB issued ASU No. 2011-05, Comprehensive Income (Topic 220): Presentation of Comprehensive Income,
which eliminates the option to present components of other comprehensive income as part of the statement of changes in stockholders' equity and other reclassifications presented in the financial
statements. The update is effective for fiscal years and interim periods beginning after December 15, 2011. Certain provisions of ASU 2011-05 have been amended by ASU
No. 2011-12, Comprehensive Income (Topic 220): Deferral of the Effective Date for Amendments to the Presentation of Reclassifications of Items Out of
Accumulated Other Comprehensive Income in Accounting Standards Update No. 2011-05, to effectively defer only those changes in ASU 2011-05 that
relate to the presentation of reclassification adjustments out of accumulated other comprehensive income. We do not believe adoption of these two updates will have a significant impact on our
consolidated financial statements.
Unaudited Pro Forma Net Income per Share
We have filed a registration statement with the Securities and Exchange Commission ("SEC") to sell shares of our common stock to the
public. Immediately after completion of this public offering, JCS Holdings, LLC, our parent company, will distribute substantially all of the shares of our common stock then held by it and/or
the cash proceeds received in this public offering to the holders of its Series A preferred units and its vested common units. JCS Holdings, LLC will thereafter continue to hold
less than one percent of our outstanding common stock for the benefit of certain of our officers and directors who will continue to hold unvested common units in JCS Holdings, LLC upon
consummation of this offering.
Immediately
prior to the completion of the offering, we will effect a 19,178.226-for-1 split of our common stock.
The
unaudited pro forma basic and diluted net income per share for fiscal year 2011 gives effect to the initial public offering and stock split as if they were completed at the beginning
of fiscal year 2011.
F-15
Table of Contents
IGNITE RESTAURANT GROUP, INC.
Notes to Consolidated Financial Statements (Continued)
Note 2—Significant Accounting Policies (Continued)
Shares
to be sold in the offering from which proceeds will be used to prepay a portion of our term loan and pay fees and expenses related to this offering are included in the unaudited pro forma basic
and diluted net income per share calculations. The following table sets forth the computation of unaudited pro forma basic and diluted net income per share based on an offering price of $13.00 per
share, the midpoint of the price range set forth on the cover page of this prospectus:
|
|
|
|
|
|
|
Fiscal Year 2011 |
|
Pro forma net income (in thousands) |
|
$ |
13,913 |
|
Pro forma basic and diluted weighted average number of shares |
|
|
22,870,760 |
|
Pro forma net income per share |
|
$ |
0.61 |
|
Note 3—Property and Equipment, net
Property and equipment consists of the following (in thousands):
|
|
|
|
|
|
|
|
|
|
January 3,
2011 |
|
January 2,
2012 |
|
Leasehold improvements |
|
$ |
128,201 |
|
$ |
153,426 |
|
Equipment |
|
|
28,178 |
|
|
39,573 |
|
Furniture and fixtures |
|
|
8,422 |
|
|
10,076 |
|
Construction in progress |
|
|
10,969 |
|
|
10,644 |
|
| |
|
|
|
|
|
|
|
|
175,770 |
|
|
213,719 |
|
Less accumulated depreciation |
|
|
50,214 |
|
|
65,588 |
|
| |
|
|
|
|
|
|
|
$ |
125,556 |
|
$ |
148,131 |
|
| |
|
|
|
|
|
Depreciation
expense was approximately $12.2 million, $12.9 million, and $15.6 million for fiscal years 2009, 2010, and 2011, respectively. Allocation of
depreciation expense between our restaurants and administration is as follows (in thousands):
|
|
|
|
|
|
|
|
|
|
|
|
|
2009 |
|
2010 |
|
2011 |
|
Restaurants |
|
$ |
11,763 |
|
$ |
12,405 |
|
$ |
14,976 |
|
Administration |
|
|
451 |
|
|
541 |
|
|
598 |
|
| |
|
|
|
|
|
|
|
|
|
$ |
12,214 |
|
$ |
12,946 |
|
$ |
15,574 |
|
| |
|
|
|
|
|
|
|
Based
on a regular review of our restaurant units for impairment, we identified certain restaurants with carrying values on property and equipment that may not be fully recoverable.
Restaurant impairments for these units amounting to approximately $0.3 million was recorded in 2010. No impairment charge was recorded in 2009 and 2011. The impairment charges reflect the
difference between the impaired assets' carrying value and their fair value, and are recorded as part of restaurant impairments and closures in the consolidated statements of operations.
F-16
Table of Contents
IGNITE RESTAURANT GROUP, INC.
Notes to Consolidated Financial Statements (Continued)
Note 4—Accrued Liabilities
The components of accrued liabilities were as follows (in thousands):
|
|
|
|
|
|
|
|
|
|
January 3,
2011 |
|
January 2,
2012 |
|
Payroll and related costs |
|
$ |
5,202 |
|
$ |
6,652 |
|
Property taxes |
|
|
2,275 |
|
|
2,663 |
|
Sales and alcohol taxes |
|
|
1,486 |
|
|
2,008 |
|
Deferred gift card revenue |
|
|
1,460 |
|
|
1,990 |
|
Workers' compensation |
|
|
1,455 |
|
|
1,891 |
|
Insurance financing |
|
|
— |
|
|
1,359 |
|
Interest and commitment fees |
|
|
89 |
|
|
1,076 |
|
Occupancy |
|
|
808 |
|
|
873 |
|
Legal claims |
|
|
637 |
|
|
865 |
|
Interest rate swap |
|
|
493 |
|
|
— |
|
Other |
|
|
816 |
|
|
1,013 |
|
| |
|
|
|
|
|
|
|
$ |
14,721 |
|
$ |
20,390 |
|
| |
|
|
|
|
|
Note 5—Debt Obligations
Debt obligations consisted of the following for the periods presented below (in thousands):
|
|
|
|
|
|
|
|
|
|
|
January 3, 2011 |
|
January 2, 2012 |
|
$120.0 million term loan, due March 2016 |
|
$ |
— |
|
$ |
117,750 |
|
$25.0 million term loan, due May 2013 |
|
|
25,000 |
|
|
— |
|
$90.0 million term loan, due November 2012 |
|
|
9,796 |
|
|
— |
|
Capital leases |
|
|
37 |
|
|
7 |
|
| |
|
|
|
|
|
| |
Total debt |
|
|
34,833 |
|
|
117,757 |
|
| |
Less current portion |
|
|
137 |
|
|
3,007 |
|
| |
|
|
|
|
|
| |
Long-term debt obligations |
|
$ |
34,696 |
|
$ |
114,750 |
|
| |
|
|
|
|
|
In
March 2011, we entered into a $145.0 million senior secured credit facility with General Electric Capital Corporation and a syndicate of financial institutions. The credit
facility consists of (a) a $120.0 million term loan ("Term Loan") and (b) a revolving credit facility of up to $25.0 million ("Revolving Credit Facility") which includes a
letter of credit subfacility for up to $6.0 million and a swing line subfacility of up to $5.0 million. Borrowings under the senior secured credit facility bear interest at a fluctuating
rate equal to, at our option, either (a) a base rate plus three and one-half percent (3.50%) per annum, or (b) LIBOR (subject to a floor of 1.5%) plus four and three-quarter
percent (4.75%) per annum. The base rate is the higher of (1) the federal funds rate plus 0.50%, (2) the U.S. prime rate last quoted by The Wall Street
Journal, and (3) the sum of the three-month LIBOR (subject to a floor of 1.5%) plus the excess of the LIBOR applicable margin over
the base rate applicable margin. The Revolving Credit Facility provides for a commitment fee of 0.5% per year on the unused portion.
F-17
Table of Contents
IGNITE RESTAURANT GROUP, INC.
Notes to Consolidated Financial Statements (Continued)
Note 5—Debt Obligations (Continued)
The
weighted annual average interest rate (including margin) on the Term Loan during 2011 was 6.25%. As of January 2, 2012, we had outstanding letters of credit of approximately
$1.4 million and available borrowing capacity of approximately $23.6 million under the Revolving Credit Facility.
The
Term Loan and Revolving Credit Facility expire in five years. Scheduled principal payments of the Term Loan balance outstanding as of January 2, 2012 are as follows (in
thousands):
|
|
|
|
|
Fiscal Year
|
|
Amount |
|
2012 |
|
$ |
3,000 |
|
2013 |
|
|
5,250 |
|
2014 |
|
|
8,250 |
|
2015 |
|
|
11,250 |
|
2016 |
|
|
90,000 |
|
| |
|
|
|
|
|
$ |
117,750 |
|
| |
|
|
|
In
addition to regularly scheduled payments of principal, mandatory prepayments are also required to be made upon the occurrence of certain events including, without limitation,
(i) sales of certain assets, subject to reinvestment provisions, (ii) receipt of certain casualty and condemnation awards proceeds, subject to reinvestment provisions, (iii) the
incurrence of certain additional indebtedness, (iv) issuance of equity in some cases, and (v) excess cash flow on an annual basis (as defined in the credit agreement). The senior secured
credit facility contains a number of covenants that restrict our ability to incur additional indebtedness, create liens on assets, sell assets, make investments, and pay dividends and distributions.
In addition, we are required to comply with certain financial covenants, including maximum consolidated effective leverage ratio, maximum capital expenditures, and a minimum consolidated fixed charge
ratio beginning as of June 20, 2011.
We
used the proceeds from the Term Loan to repay prior indebtedness, make an $80.0 million distribution to our stockholder, pay certain fees and expenses associated with the
closing of the credit facility, and terminate our interest rate swap contract. Deferred financing fees of $4.6 million relating to the Term Loan were capitalized as deferred charges in the
consolidated balance sheets. The termination of the interest rate swap was paid in March 2011 and was recorded as a $0.4 million increase to accumulated other comprehensive loss and a decrease
to deferred tax assets in the accompanying consolidated balance sheets. The $1.4 million balance of deferred financing costs related to our prior indebtedness was written off to interest
expense in our consolidated statements of operations.
Further,
our long-term debt approximates fair values as it has been negotiated on an arm's length basis with a reputable third party lender at prevailing market rates.
Capital Leases
In 2007, we entered into capital leases for computer equipment and furniture and fixtures in the amount of approximately
$0.9 million. As of January 2, 2012, we have a remaining principal balance for these capital leases amounting to $7,000, all of which is payable within the next fiscal year.
F-18
Table of Contents
IGNITE RESTAURANT GROUP, INC.
Notes to Consolidated Financial Statements (Continued)
Note 6—Derivative Financial Instruments
In November 2008, we entered into an interest rate swap agreement to manage the risk associated with variable interest rates related to our then existing debt obligations. We refinanced
our debt obligations in March 2011 and terminated our interest swap agreement in connection therewith. The variable-to-fixed interest rate swap was accounted for as a cash flow hedge, with
effectiveness assessed based on the hypothetical derivative method. The interest rate swap agreement served to convert our variable LIBOR rate on our term loan facilities to a fixed rate of interest.
The
interest rate on the swap was 2.92% per year through the expiration of the agreement in November 2011. The underlying notional amount of the swap agreement was equal to 60% of
the outstanding cumulative balance of the First and Second Lien agreements of $35.0 million at December 29, 2008. The fair value of the interest rate swap was approximately
$0.5 million as of January 3, 2011 and is included in other accrued liabilities. The change in its fair value is recorded in other comprehensive income. Net cash settlements under the
swap agreement are reflected in interest expense in the statements of operations for the applicable period. Under the swap agreement, we paid an annual fixed rate of 2.92%, which on a monthly basis
was settled against a floating rate based on the one month LIBOR. The floating rate was set at the start of each monthly interest period with the final interest settlement date on the last day of each
month.
Note 7—Fair Value Measurements
The following table summarizes our financial liability measured at fair value on a recurring basis in the consolidated balance sheets (in thousands):
|
|
|
|
|
|
|
|
|
|
|
|
|
|
|
|
Balance as of
January 3,
2011 |
|
Quoted Prices in
Active Markets for
Identical
Instruments
(Level 1) |
|
Significant
Other Observable
Inputs
(Level 2) |
|
Significant
Unobservable
Inputs
(Level 3) |
|
Interest rate swap(1) |
|
$ |
493 |
|
$ |
— |
|
$ |
493 |
|
$ |
— |
|
| |
|
|
|
|
|
|
|
|
|
- (1)
- We
have recorded in accrued liabilities as of January 3, 2011 an amount related to our interest rate swap, which we revalue quarterly using the
market approach. Changes in the fair value of the financial instrument are recorded in accumulated other comprehensive loss. In conjunction with our debt refinancing in March 2011, we
terminated our interest rate swap contract (see Note 5).
Note 8—Insurance and Other Recoveries
Two restaurants in the Texas Gulf Coast area closed temporarily in 2008 due to hurricane damage one of which reopened during 2008 and the other reopened in 2011. In an unrelated incident
during 2008, a restaurant in Fort Worth, Texas temporarily closed due to foundation issues and has not yet reopened. Our restaurant in the Nashville, Tennessee area closed in April 2010 due to
flooding and
F-19
Table of Contents
IGNITE RESTAURANT GROUP, INC.
Notes to Consolidated Financial Statements (Continued)
Note 8—Insurance and Other Recoveries (Continued)
reopened
in May 2010. In relation to these events, the following amounts were recorded in our consolidated financial statements (in thousands):
|
|
|
|
|
|
|
|
|
|
|
|
|
2009 |
|
2010 |
|
2011 |
|
Proceeds from property insurance claims(1) |
|
$ |
400 |
|
$ |
2,738 |
|
$ |
281 |
|
Business interruption recoveries(2) |
|
$ |
237 |
|
$ |
276 |
|
$ |
— |
|
Gain on insurance recoveries related to property and equipment |
|
$ |
1,192 |
|
$ |
944 |
|
$ |
1,126 |
|
- (1)
- Included
in our consolidated statements of cash flows.
- (2)
- Included
as reduction in other operating expenses in our consolidated statements of operations.
In April 2010, certain of our restaurants in the Gulf Coast area were affected by British Petroleum's Deepwater Horizon oil spill ("BP Oil Spill")
due to reduced tourism levels in some of our markets. British Petroleum set up a fund, which is administered by a third party administrator, to indemnify entities affected by the BP Oil Spill. During
2010, we received $0.2 million in emergency payment claims for lost profits, which was recorded as a reduction of other operating expenses in our consolidated statements of operations.
Note 9—Income Taxes
All of our operations are domestic. Income tax expense consisted of the following (in thousands):
|
|
|
|
|
|
|
|
|
|
|
|
|
|
2009 |
|
2010 |
|
2011 |
|
Current income tax |
|
|
|
|
|
|
|
|
|
|
| |
Federal |
|
$ |
— |
|
$ |
786 |
|
$ |
479 |
|
| |
State |
|
|
255 |
|
|
631 |
|
|
916 |
|
| |
|
|
|
|
|
|
|
|
|
|
255 |
|
|
1,417 |
|
|
1,395 |
|
| |
|
|
|
|
|
|
|
Deferred income tax |
|
|
|
|
|
|
|
|
|
|
| |
Federal |
|
|
— |
|
|
— |
|
|
(1,391 |
) |
| |
State |
|
|
— |
|
|
— |
|
|
83 |
|
| |
|
|
|
|
|
|
|
|
|
|
— |
|
|
— |
|
|
(1,308 |
) |
| |
|
|
|
|
|
|
|
|
|
$ |
255 |
|
$ |
1,417 |
|
$ |
87 |
|
| |
|
|
|
|
|
|
|
At January 2, 2012, we had federal income tax credit carryforwards of approximately $9.0 million, comprised primarily of the credit
for FICA and Medicare taxes paid on reported employee tip income. We also have Alternative Minimum Tax ("AMT") credits of approximately $0.3 million and a Texas margin tax credit of
approximately $0.1 million. The FICA credit will begin to expire in 2027 if unused prior to that time, while the AMT credit may be carried forward indefinitely.
In
December 2011, we released the valuation allowance due to consistent historical earnings and our ability to reasonably project future performance, which supports the conclusion that
we will be able to fully utilize the credits.
F-20
Table of Contents
IGNITE RESTAURANT GROUP, INC.
Notes to Consolidated Financial Statements (Continued)
Note 9—Income Taxes (Continued)
A
reconciliation between the amount of income tax expense (benefit) determined by applying the applicable U.S. statutory income tax rate to pre-tax income (loss) is as
follows (in thousands):
|
|
|
|
|
|
|
|
|
|
|
|
|
|
2009 |
|
2010 |
|
2011 |
|
Tax expense (benefit) at the federal statutory income tax rate |
|
$ |
3,544 |
|
$ |
4,643 |
|
$ |
3,856 |
|
Permanent differences |
|
|
878 |
|
|
1,001 |
|
|
28 |
|
State income taxes, net of federal impact |
|
|
166 |
|
|
418 |
|
|
722 |
|
Tax credit carryforwards |
|
|
(2,406 |
) |
|
(2,917 |
) |
|
(2,427 |
) |
Change in valuation allowance |
|
|
(2,132 |
) |
|
(1,828 |
) |
|
(2,025 |
) |
Other |
|
|
205 |
|
|
100 |
|
|
(67 |
) |
| |
|
|
|
|
|
|
|
| |
Total provision |
|
$ |
255 |
|
$ |
1,417 |
|
$ |
87 |
|
| |
|
|
|
|
|
|
|
| |
Effective income tax rate |
|
|
2.5 |
% |
|
10.7 |
% |
|
0.8 |
% |
| |
|
|
|
|
|
|
|
The
components of our deferred tax assets and liabilities are as follows (in thousands):
|
|
|
|
|
|
|
|
|
|
|
|
January 3,
2011 |
|
January 2,
2012 |
|
Deferred tax assets—current |
|
|
|
|
|
|
|
| |
Reserves and accruals |
|
$ |
1,441 |
|
$ |
1,792 |
|
| |
Interest rate swap |
|
|
186 |
|
|
— |
|
| |
Valuation allowance |
|
|
(297 |
) |
|
— |
|
| |
|
|
|
|
|
|
|
|
1,330 |
|
|
1,792 |
|
Deferred tax liability—current
Prepaids and depreciation |
|
|
(768 |
) |
|
(702 |
) |
| |
|
|
|
|
|
| |
|
Net deferred tax asset—current |
|
$ |
562 |
|
$ |
1,090 |
|
| |
|
|
|
|
|
Deferred tax assets—non-current |
|
|
|
|
|
|
|
| |
Intangibles |
|
$ |
98 |
|
$ |
882 |
|
| |
Credit carryforwards |
|
|
7,060 |
|
|
9,200 |
|
| |
Net operating loss carryforwards |
|
|
— |
|
|
156 |
|
| |
Valuation allowance |
|
|
(1,727 |
) |
|
— |
|
| |
|
|
|
|
|
|
|
|
5,431 |
|
|
10,238 |
|
Deferred tax liabilities—non-current
Prepaids and depreciation |
|
|
(5,519 |
) |
|
(9,272 |
) |
| |
Sale-leaseback |
|
|
(287 |
) |
|
(280 |
) |
| |
|
|
|
|
|
| |
|
Net deferred tax asset (liability)—non-current |
|
$ |
(375 |
) |
$ |
686 |
|
| |
|
|
|
|
|
We
file income tax returns in the U.S. federal jurisdiction and various state and local jurisdictions. We are subject to U.S. federal income tax examinations by tax authorities for the
fiscal year ended January 3, 2011 and forward. We believe that an adequate provision has been made for any adjustments that may result from tax examinations. Although the outcome of tax audits
is uncertain, we have concluded that we do have uncertain tax positions, as defined in ASC No. 740, Income Taxes, that need to be recognized in
our financial statements, which amounted to $469,000 at January 2, 2012 and
F-21
Table of Contents
IGNITE RESTAURANT GROUP, INC.
Notes to Consolidated Financial Statements (Continued)
Note 9—Income Taxes (Continued)
reflected
a reduction of $45,000 for 2011. If any issues addressed in our tax audits are not resolved to our expectations, any interest and/or penalties would be classified as income tax expense in
our consolidated statements of operations. During 2011, we completed a federal income tax audit for tax years 2008 and 2009, without material adjustments, as well as an income tax audit by the State
of Alabama, also without material adjustments. We have no other tax audits either open or scheduled at this time.
Note 10—Commitments and Contingencies
In the course of business affairs and operations, we are subject to possible loss contingencies arising from third-party litigation and federal, state, and local environmental, health,
and safety laws and regulations.
Minimum Lease Commitments
We lease our restaurants, office facilities, and certain equipment under operating lease agreements with remaining terms ranging from 1
to 25 years. The future minimum rental commitments under these noncancelable operating leases are as follows (in thousands):
|
|
|
|
|
Fiscal Year
|
|
Amount |
|
2012 |
|
$ |
22,761 |
|
2013 |
|
|
22,221 |
|
2014 |
|
|
21,949 |
|
2015 |
|
|
21,404 |
|
2016 |
|
|
20,727 |
|
Thereafter |
|
|
152,899 |
|
| |
|
|
|
|
|
$ |
261,961 |
|
| |
|
|
|
The
above amounts do not include property taxes, insurance, and normal maintenance that we are required to pay. Rental expense relating to operating leases amounted to approximately
$21.0 million, $23.3 million, and $25.7 million for 2009, 2010, and 2011, respectively. A number of our leases also provide for contingent rentals based on a percentage of sales
above a specified minimum. Total contingent rentals, included in rent expense, amounted to approximately $1.0 million, $1.2 million, and $1.7 million for 2009, 2010, and 2011,
respectively.
Litigation
We are a defendant or otherwise involved in a number of lawsuits in the ordinary course of business. When the potential liability can
be estimated and the loss is considered probable, we record the estimated loss. Due to uncertainties related to the resolution of lawsuits and claims, the ultimate outcome may differ from our
estimates. We believe that the ultimate exposure with respect to these pending lawsuits and claims is not expected to have a material adverse effect on our consolidated financial position, results of
operations, or cash flows.
F-22
Table of Contents
IGNITE RESTAURANT GROUP, INC.
Notes to Consolidated Financial Statements (Continued)
Note 11—Stock-Based Compensation
Certain key members of the executive management team and certain members of the Board of Directors were granted common units of equity in JCS Holdings, LLC, the Company's parent,
in conjunction with the Third Amended and Restated Limited Liability Company Operating Agreement (the "LLC Agreement") under a Unit Grant Agreement. One-half of each recipient's
non-vested common unit award generally step vests for a period of five years, while the other half vests based on time and Company performance, except for a certain executive
grant that cliff vests after five years. Performance conditions include pre-established annual and/or cumulative EBITDA thresholds, as defined in each employee's unit agreement. Upon a change
in control, all non-vested units would become fully vested. The LLC Agreement has authorized a total of 11,909,091 common units. Any common unit that has been vested and reacquired in
accordance with the LLC Agreement, or otherwise forfeited, shall revert back to the pool and shall be available for future grants. As of January 2, 2012, there are 1,605,233 common units
available for distribution.
The
following table summarizes the compensation expense recorded in the last three fiscal years (in thousands):
|
|
|
|
|
|
|
|
|
|
|
|
|
2009 |
|
2010 |
|
2011 |
|
Compensation expense |
|
$ |
9 |
|
$ |
45 |
|
$ |
36 |
|
Related tax benefit |
|
|
(3 |
) |
|
(17 |
) |
|
0 |
|
| |
|
|
|
|
|
|
|
|
|
$ |
6 |
|
$ |
28 |
|
$ |
36 |
|
| |
|
|
|
|
|
|
|
As
of January 2, 2012, we had unrecognized equity compensation expense of approximately $97,000 related to common unit awards. That cost is expected to be recognized over a
weighted average period of 2.8 years.
The
following table summarizes the activity of the common unit grants for the year ended January 2, 2012:
|
|
|
|
|
|
|
|
|
Management Share Units
|
|
Number of
Units |
|
Weighted
Average
Grant
Date Fair
Value |
|
Unvested at January 3, 2011 |
|
|
3,185,352 |
|
$ |
0.06 |
|
| |
Vested |
|
|
(1,854,144 |
) |
$ |
0.01 |
|
| |
Forfeited |
|
|
(103,125 |
) |
$ |
0.28 |
|
| |
|
|
|
|
|
|
Unvested at January 2, 2012 |
|
|
1,228,083 |
|
$ |
0.12 |
|
| |
|
|
|
|
|
|
Since
the parent company's membership interest has no active market, we estimated the fair value of each common unit for units granted on the date of grant based on a variety of
considerations and assumptions, including but not limited to a third-party valuation, which utilized the market and income approaches with an appropriate discount factor for the common unit's lack of
marketability. The average fair value per unit granted during 2009 was $0.22 at their date of grant. No units were granted in fiscal years 2010 or 2011. The aggregate intrinsic value of common units
that vested was approximately $0.5 million each during fiscal years 2009, 2010 and 2011. The intrinsic value amounts are based on the estimated fair value per unit from the last time units were
granted in 2009. See also the discussion on unaudited pro forma and pro forma as adjusted net income per share in Note 2.
F-23
Table of Contents
IGNITE RESTAURANT GROUP, INC.
Notes to Consolidated Financial Statements (Continued)
Note 11—Stock-Based Compensation (Continued)
The
Unit Grant Agreement for certain key members of the executive management team provides for severance periods ranging from three months to two years for termination without cause
and/or good reason.
Note 12—Related Parties
In the ordinary course of business, we transact with certain related parties. During 2009, 2010, and 2011, we were billed approximately $1.1 million per year in management fees
and out-of-pocket expenses by our ultimate parent. These expenses are included in general and administrative expenses in our consolidated statements of operations.
Note 13—Supplemental Disclosure of Cash Flow Information
The following table sets forth certain cash and non-cash activities as follows (in thousands):
|
|
|
|
|
|
|
|
|
|
|
|
|
|
2009 |
|
2010 |
|
2011 |
|
Cash paid for interest |
|
$ |
4,044 |
|
$ |
3,077 |
|
$ |
5,491 |
|
Cash paid for income tax |
|
$ |
90 |
|
$ |
307 |
|
$ |
2,877 |
|
Supplemental noncash investing and financing activities |
|
|
|
|
|
|
|
|
|
|
| |
Unpaid liabilities for property and equipment |
|
$ |
— |
|
$ |
3,898 |
|
$ |
2,758 |
|
| |
(Decrease) increase in value of interest rate swap |
|
$ |
(89 |
) |
$ |
(223 |
) |
$ |
121 |
|
F-24
Table of Contents
IGNITE RESTAURANT GROUP, INC.
Notes to Consolidated Financial Statements (Continued)
Note 14—Quarterly Financial Information (Unaudited)
The following table summarizes unaudited quarterly data for 2011, as revised to correct the matters discussed in Note 2—Significant Accounting
Policies—Property and Equipment:
|
|
|
|
|
|
|
|
|
|
|
|
|
|
|
|
|
|
|
|
|
Fiscal Year 2011 |
|
(In '000s, except per share data)
|
|
First
Quarter |
|
Second
Quarter |
|
Third
Quarter |
|
Fourth
Quarter |
|
Full
Year |
|
As previously reported |
|
|
|
|
|
|
|
|
|
|
|
|
|
|
|
|
| |
Revenues |
|
$ |
87,431 |
|
$ |
103,188 |
|
|
|
|
|
|
|
|
|
|
| |
Income (loss) from operations |
|
|
4,078 |
|
|
7,437 |
|
|
|
|
|
|
|
|
|
|
| |
Net income (loss) |
|
|
1,038 |
|
|
3,858 |
|
|
|
|
|
|
|
|
|
|
| |
Net income (loss) per share |
|
|
|
|
|
|
|
|
|
|
|
|
|
|
|
|
| |
|
Basic and diluted |
|
$ |
1,038.00 |
|
$ |
3,858.00 |
|
|
|
|
|
|
|
|
|
|
Adjustments |
|
|
|
|
|
|
|
|
|
|
|
|
|
|
|
|
| |
Revenues |
|
$ |
— |
|
$ |
— |
|
|
|
|
|
|
|
|
|
|
| |
Income (loss) from operations |
|
|
102 |
|
|
99 |
|
|
|
|
|
|
|
|
|
|
| |
Net income (loss) |
|
|
120 |
|
|
117 |
|
|
|
|
|
|
|
|
|
|
| |
Net income (loss) per share |
|
|
|
|
|
|
|
|
|
|
|
|
|
|
|
|
| |
|
Basic and diluted |
|
$ |
120.00 |
|
$ |
117.00 |
|
|
|
|
|
|
|
|
|
|
*As revised
|
|
|
|
|
|
|
|
|
|
|
|
|
|
|
|
|
| |
Revenues |
|
$ |
87,431 |
|
$ |
103,188 |
|
$ |
113,233 |
|
$ |
101,391 |
|
$ |
405,243 |
|
| |
Income (loss) from operations |
|
|
4,180 |
|
|
7,536 |
|
|
11,494 |
|
|
(3,781 |
) |
|
19,429 |
|
| |
Net income (loss) |
|
|
1,158 |
|
|
3,975 |
|
|
7,521 |
|
|
(1,401 |
) |
|
11,253 |
|
| |
Net income (loss) per share |
|
|
|
|
|
|
|
|
|
|
|
|
|
|
|
|
| |
|
Basic and diluted |
|
$ |
1,158.00 |
|
$ |
3,975.00 |
|
$ |
7,521.00 |
|
$ |
(1,401.00 |
) |
$ |
11,253.00 |
|
- *
- There
were no revisions to the results of operations for the third and fourth quarters of fiscal year 2011.
The revision also impacted previously reported cash flows for the 12 week period ended March 28, 2011 and the 24 week period
ended June 20, 2011. For the 12 week period ended March 28, 2011, Net cash used in investing activities will be revised from a previously reported $8.1 million to
$8.3 million to reflect the additional capitalized amounts, with a corresponding increase in Net cash provided by operating activities from a previously reported $9.7 million to
$9.9 million; for the 24 week period ended June 20, 2011, Net cash used in investing activities will be revised from a previously reported $18.0 million to
$18.3 million to reflect the additional capitalized amounts, with a corresponding increase in Net cash provided by operating activities from a previously reported $19.3 million to
$19.6 million.
We
assessed the impact of the revision identified relating to the fiscal year ending Jaunary 3, 2011 on the interim periods therein, and determined that the resulting increase in
income (loss) from operations and net income for each interim period during fiscal year 2010 was less than $0.1 million to each of the fiscal quarters.
F-25
Table of Contents
IGNITE RESTAURANT GROUP, INC.
CONDENSED CONSOLIDATED BALANCE SHEETS
(in thousands, except par value and shares)
|
|
|
|
|
|
|
|
|
|
January 2,
2012 |
|
March 26,
2012 |
|
|
|
|
|
(Unaudited)
|
|
ASSETS |
|
|
|
|
|
|
|
Current assets |
|
|
|
|
|
|
|
Cash and cash equivalents |
|
$ |
3,725 |
|
$ |
7,736 |
|
Accounts receivable |
|
|
7,830 |
|
|
6,948 |
|
Inventories |
|
|
4,179 |
|
|
5,251 |
|
Deferred tax assets |
|
|
1,090 |
|
|
1,053 |
|
Prepaid rent and other current assets |
|
|
4,595 |
|
|
4,774 |
|
| |
|
|
|
|
|
Total current assets |
|
|
21,419 |
|
|
25,762 |
|
Property and equipment, net |
|
|
148,131 |
|
|
157,067 |
|
Intangible assets, net |
|
|
2,198 |
|
|
2,096 |
|
Deferred charges, net |
|
|
4,605 |
|
|
4,364 |
|
Deferred tax assets |
|
|
686 |
|
|
664 |
|
Other assets |
|
|
3,168 |
|
|
3,123 |
|
| |
|
|
|
|
|
Total assets |
|
$ |
180,207 |
|
$ |
193,076 |
|
| |
|
|
|
|
|
LIABILITIES AND STOCKHOLDER'S EQUITY |
|
|
|
|
|
|
|
Current liabilities |
|
|
|
|
|
|
|
Accounts payable |
|
$ |
14,157 |
|
$ |
21,887 |
|
Accrued liabilities |
|
|
20,390 |
|
|
23,271 |
|
Current portion of debt obligations |
|
|
3,007 |
|
|
3,000 |
|
| |
|
|
|
|
|
Total current liabilities |
|
|
37,554 |
|
|
48,158 |
|
Long-term debt obligations |
|
|
114,750 |
|
|
114,000 |
|
Deferred rent |
|
|
5,510 |
|
|
6,006 |
|
Other long-term liabilities |
|
|
800 |
|
|
819 |
|
| |
|
|
|
|
|
Total liabilities |
|
|
158,614 |
|
|
168,983 |
|
| |
|
|
|
|
|
Commitments and contingencies |
|
|
|
|
|
|
|
Stockholder's equity |
|
|
|
|
|
|
|
Common stock, $1.00 par value per share, 1,000 shares authorized, issued and outstanding |
|
|
1 |
|
|
1 |
|
Additional paid-in capital |
|
|
11,720 |
|
|
11,729 |
|
Accumulated earnings |
|
|
9,872 |
|
|
12,363 |
|
| |
|
|
|
|
|
Total stockholder's equity |
|
|
21,593 |
|
|
24,093 |
|
| |
|
|
|
|
|
Total liabilities and stockholder's equity |
|
$ |
180,207 |
|
$ |
193,076 |
|
| |
|
|
|
|
|
See accompanying notes to condensed consolidated financial statements.
F-26
Table of Contents
IGNITE RESTAURANT GROUP, INC.
CONDENSED CONSOLIDATED STATEMENTS OF OPERATIONS
(in thousands, except per share data)
(Unaudited)
|
|
|
|
|
|
|
|
|
|
Twelve Weeks Ended |
|
|
|
March 28,
2011 |
|
March 26,
2012 |
|
Revenues |
|
$ |
87,431 |
|
$ |
103,430 |
|
Costs and expenses |
|
|
|
|
|
|
|
Restaurant operating costs |
|
|
|
|
|
|
|
Cost of sales |
|
|
27,519 |
|
|
32,915 |
|
Labor and benefits |
|
|
24,450 |
|
|
28,047 |
|
Occupancy expenses |
|
|
6,510 |
|
|
7,281 |
|
Other operating expenses |
|
|
15,077 |
|
|
18,206 |
|
General and administrative |
|
|
5,517 |
|
|
6,386 |
|
Depreciation and amortization |
|
|
3,349 |
|
|
3,938 |
|
Pre-opening costs |
|
|
805 |
|
|
1,242 |
|
Restaurant impairments and closures |
|
|
28 |
|
|
49 |
|
Gain on disposal of property and equipment |
|
|
(4 |
) |
|
— |
|
| |
|
|
|
|
|
Total costs and expenses |
|
|
83,251 |
|
|
98,064 |
|
| |
|
|
|
|
|
Income from operations |
|
|
4,180 |
|
|
5,366 |
|
Interest expense, net |
|
|
(2,558 |
) |
|
(1,997 |
) |
| |
|
|
|
|
|
Income before income taxes |
|
|
1,622 |
|
|
3,369 |
|
Income tax expense |
|
|
464 |
|
|
878 |
|
| |
|
|
|
|
|
Net income |
|
$ |
1,158 |
|
$ |
2,491 |
|
| |
|
|
|
|
|
Basic and diluted net income per share data: |
|
|
|
|
|
|
|
Net income per share |
|
|
|
|
|
|
|
Basic and diluted |
|
$ |
1,158.00 |
|
$ |
2,491.00 |
|
Weighted average shares outstanding |
|
|
|
|
|
|
|
Basic and diluted |
|
|
1 |
|
|
1 |
|
See accompanying notes to condensed consolidated financial statements.
F-27
Table of Contents
IGNITE RESTAURANT GROUP, INC.
CONDENSED CONSOLIDATED STATEMENTS OF COMPREHENSIVE INCOME
(in thousands)
(Unaudited)
|
|
|
|
|
|
|
|
|
|
Twelve Weeks Ended |
|
|
|
March 28,
2011 |
|
March 26,
2012 |
|
Net income |
|
$ |
1,158 |
|
$ |
2,491 |
|
| |
|
|
|
|
|
Other comprehensive income: |
|
|
|
|
|
|
|
Change in fair value of cash flow hedge |
|
|
66 |
|
|
— |
|
Reclassification adjustment for loss on termination of cash flow hedge included in interest expense, net |
|
|
427 |
|
|
— |
|
| |
|
|
|
|
|
Other comprehensive income before tax |
|
|
493 |
|
|
— |
|
Income tax expense related to other comprehensive income |
|
|
187 |
|
|
— |
|
| |
|
|
|
|
|
Other comprehensive income, net of tax |
|
|
306 |
|
|
— |
|
| |
|
|
|
|
|
Comprehensive income |
|
$ |
1,464 |
|
$ |
2,491 |
|
| |
|
|
|
|
|
F-28
Table of Contents
IGNITE RESTAURANT GROUP, INC.
CONDENSED CONSOLIDATED STATEMENTS OF CASH FLOWS
(in thousands)
(Unaudited)
|
|
|
|
|
|
|
|
|
|
Twelve Weeks Ended |
|
|
|
March 28,
2011 |
|
March 26,
2012 |
|
Cash flows from operating activities |
|
|
|
|
|
|
|
Net income |
|
$ |
1,158 |
|
$ |
2,491 |
|
Adjustments to reconcile net income to net cash provided by operating activities: |
|
|
|
|
|
|
|
Depreciation and amortization |
|
|
3,349 |
|
|
3,938 |
|
Amortization of debt issuance costs |
|
|
1,491 |
|
|
233 |
|
Stock-based compensation |
|
|
— |
|
|
9 |
|
Deferred income tax |
|
|
315 |
|
|
59 |
|
Gain on disposal of property and equipment |
|
|
(4 |
) |
|
— |
|
Increase in operating assets: |
|
|
|
|
|
|
|
Accounts receivable |
|
|
(1,648 |
) |
|
(242 |
) |
Inventory |
|
|
(731 |
) |
|
(1,072 |
) |
Prepaids and other assets |
|
|
(711 |
) |
|
(136 |
) |
Increase in operating liabilities: |
|
|
|
|
|
|
|
Accounts payable and accrued liabilities |
|
|
6,460 |
|
|
4,585 |
|
Other liabilities |
|
|
218 |
|
|
515 |
|
| |
|
|
|
|
|
Net cash provided by operating activities |
|
|
9,897 |
|
|
10,380 |
|
| |
|
|
|
|
|
Cash flows from investing activities |
|
|
|
|
|
|
|
Purchases of property and equipment |
|
|
(8,301 |
) |
|
(6,737 |
) |
Proceeds from property insurance claims |
|
|
— |
|
|
1,124 |
|
Proceeds from disposal of property and equipment |
|
|
4 |
|
|
1 |
|
| |
|
|
|
|
|
Net cash used in investing activities |
|
|
(8,297 |
) |
|
(5,612 |
) |
| |
|
|
|
|
|
Cash flows from financing activities |
|
|
|
|
|
|
|
Borrowings on revolving credit facility |
|
|
— |
|
|
5,500 |
|
Payments on revolving credit facility |
|
|
— |
|
|
(5,500 |
) |
Proceeds from long-term debt |
|
|
120,000 |
|
|
— |
|
Payments on long-term debt |
|
|
(34,796 |
) |
|
(750 |
) |
Payments on capital leases |
|
|
(9 |
) |
|
(7 |
) |
Debt issuance costs paid |
|
|
(4,548 |
) |
|
— |
|
Dividends paid |
|
|
(80,000 |
) |
|
— |
|
| |
|
|
|
|
|
Net cash provided by (used in) financing activities |
|
|
647 |
|
|
(757 |
) |
| |
|
|
|
|
|
Net increase in cash and cash equivalents |
|
|
2,247 |
|
|
4,011 |
|
Cash and cash equivalents at beginning of period |
|
|
12,572 |
|
|
3,725 |
|
| |
|
|
|
|
|
Cash and cash equivalents at end of period |
|
$ |
14,819 |
|
$ |
7,736 |
|
| |
|
|
|
|
|
See accompanying notes to condensed consolidated financial statements.
F-29
Table of Contents
IGNITE RESTAURANT GROUP, INC.
Notes to Condensed Consolidated Financial Statements
Note 1—Basis of Presentation
Ignite Restaurant Group, Inc. (referred to herein as the "Company," "Ignite," "we," "us" or "our") owns and operates two full service, casual dining restaurants under the names Joe's
Crab Shack and Brick House Tavern+Tap. As of March 26, 2012, we owned and operated 122 Joe's Crab Shack restaurants and 16 Brick House Tavern+Tap restaurants in
31 states within the United States. J.H. Whitney VI, L.P. ("J.H. Whitney VI"), an affiliate of J.H. Whitney Capital Partners, LLC, owns all the
Series A preferred units of JCS Holdings, LLC, our parent. Consequently, J.H. Whitney VI holds approximately 100% of our total voting stock.
We
prepared the accompanying unaudited condensed consolidated financial statements in accordance with Rule 10-01 of Regulation S-X, and hence, do
not include all of the information and footnotes required by accounting principles generally accepted in the United States of America ("GAAP") for complete financial statements. We have made
adjustments that are, in our opinion, necessary for the fair presentation of the results of the interim periods presented. The results of operations for such interim periods are not necessarily
indicative of the results of operations for a full year. The accompanying unaudited condensed consolidated financial statements should be read in conjunction with the more detailed audited
consolidated financial statements for the fiscal years ended December 28, 2009, January 3, 2011, and January 2, 2012 found elsewhere in this prospectus.
Principles of Consolidation
The accompanying unaudited condensed consolidated financial statements include the accounts of Ignite and its wholly-owned
subsidiaries. All significant intercompany balances and transactions have been eliminated in consolidation.
Fiscal Year
Our fiscal year ends on the Monday nearest to December 31 of each year. Fiscal years 2011 and 2012 are 52-week
years. The first three quarters of our fiscal year consist of 12 weeks and our fourth quarter consists of 16 weeks for 52-week fiscal years and 17 weeks for
53-week fiscal years.
Recent Accounting Pronouncements
In May 2011, the FASB issued Accounting Standards Update ("ASU") No. 2011-04, Fair Value
Measurement (Topic 820): Amendments to Achieve Common Fair Value Measurement and Disclosure Requirements in US GAAP and IFRS, which clarifies Topic 820 and provides
guidance on changes to certain principles or requirements for measuring fair value. The amendment is effective during interim and annual periods beginning after December 15, 2011. We adopted
ASU 2011-04 as of January 3, 2012, which did not have a significant impact on our consolidated financial statements.
In
June 2011, the FASB issued ASU No. 2011-05, Comprehensive Income (Topic 220): Presentation of Comprehensive Income,
which eliminates the option to present components of other comprehensive income as part of the statement of changes in stockholders' equity and other reclassifications presented in the financial
statements. The update is effective for fiscal years and interim periods beginning after December 15, 2011. Certain provisions of ASU 2011-05 have been amended by ASU
No. 2011-12, Comprehensive Income (Topic 220): Deferral of the Effective Date for Amendments to the Presentation of Reclassifications of Items Out of
Accumulated Other Comprehensive Income in Accounting Standards Update No. 2011-05, to effectively defer only those changes in ASU 2011-05 that
relate to the presentation of reclassification adjustments out of accumulated other comprehensive income. We
F-30
Table of Contents
IGNITE RESTAURANT GROUP, INC.
Notes to Condensed Consolidated Financial Statements (Continued)
Note 1—Basis of Presentation (Continued)
adopted
ASU 2011-05 as of January 3, 2012 by including a separate statement of comprehensive income for all periods presented.
Note 2—Property and Equipment, net
Property and equipment consists of the following (in thousands):
|
|
|
|
|
|
|
|
|
|
January 2,
2012 |
|
March 26,
2012 |
|
Leasehold improvements |
|
$ |
153,426 |
|
$ |
159,988 |
|
Equipment |
|
|
39,573 |
|
|
42,153 |
|
Furniture and fixtures |
|
|
10,076 |
|
|
10,480 |
|
Construction in progress |
|
|
10,644 |
|
|
13,816 |
|
| |
|
|
|
|
|
|
|
|
213,719 |
|
|
226,437 |
|
Less accumulated depreciation |
|
|
65,588 |
|
|
69,370 |
|
| |
|
|
|
|
|
|
|
$ |
148,131 |
|
$ |
157,067 |
|
| |
|
|
|
|
|
Depreciation
expense was approximately $3.2 million and $3.8 million for the twelve weeks ended March 28, 2011 and March 26, 2012, respectively, of which
approximately $3.1 million and $3.7 million relate to restaurant operations.
Note 3—Debt Obligations
Debt obligations consisted of the following for the periods presented below (in thousands):
|
|
|
|
|
|
|
|
|
|
January 2,
2012 |
|
March 26,
2012 |
|
$120.0 million term loan, due March 2016 |
|
$ |
117,750 |
|
$ |
117,000 |
|
Capital leases |
|
|
7 |
|
|
— |
|
| |
|
|
|
|
|
Total debt |
|
|
117,757 |
|
|
117,000 |
|
Less current portion |
|
|
3,007 |
|
|
3,000 |
|
| |
|
|
|
|
|
Long-term debt obligations |
|
$ |
114,750 |
|
$ |
114,000 |
|
| |
|
|
|
|
|
In
March 2011, we entered into a $145.0 million senior secured credit facility with General Electric Capital Corporation and a syndicate of financial institutions ("GE"). The
credit facility consists of (a) a $120.0 million term loan ("Term Loan") and (b) a revolving credit facility of up to $25.0 million ("Revolving Credit Facility") which
includes a letter of credit subfacility for up to $6.0 million and a swing line subfacility of up to $5.0 million. Borrowings under the senior secured credit facility bear interest at a
fluctuating rate equal to, at our option, either (a) a base rate plus three and one-half percent (3.50%) per annum, or (b) LIBOR (subject to a floor of 1.5%) plus four and
three-quarter percent (4.75%) per annum. The base rate is the higher of (1) the federal funds rate plus 0.50%, (2) the U.S. prime rate last quoted by The Wall
Street Journal, and (3) the sum of the three-month LIBOR (subject to a floor of 1.5%) plus the excess of the LIBOR applicable margin over the base rate applicable
margin. The Revolving Credit Facility provides for a commitment fee of 0.5% per year on the unused portion.
F-31
Table of Contents
IGNITE RESTAURANT GROUP, INC.
Notes to Condensed Consolidated Financial Statements (Continued)
Note 3—Debt Obligations (Continued)
The
weighted average interest rate (including margin) on the Term Loan and the Revolving Credit Facility for the twelve weeks ended March 26, 2012 was 6.25% and 6.75%,
respectively. As of March 26, 2012, we had outstanding letters of credit of approximately $1.8 million and available borrowing capacity of approximately $23.2 million under the
Revolving Credit Facility. During the twelve weeks ended March 26, 2012, the Revolving Credit Facility had average daily borrowings of $1.2 million. As of January 2, 2012 and
March 26, 2012, the Revolving Credit Facility had no outstanding balance.
In
addition to regularly scheduled payments of principal, mandatory prepayments are also required to be made upon the occurrence of certain events including, without limitation,
(i) sales of certain assets, subject to reinvestment provisions, (ii) receipt of certain casualty and condemnation awards proceeds, subject to reinvestment provisions, (iii) the
incurrence of certain additional indebtedness, (iv) issuance of equity in some cases, and (v) excess cash flow on an annual basis (as defined in the credit agreement). The senior secured
credit facility contains a number of covenants that restrict our ability to incur additional indebtedness, create liens on assets, sell assets, make investments, and pay dividends and distributions.
In addition, we are required to comply with certain financial covenants, including maximum consolidated effective leverage ratio, maximum capital expenditures, and a minimum consolidated fixed charge
ratio. As of March 26, 2012, we were in compliance with these covenants.
We
used the proceeds from the Term Loan to repay prior indebtedness, make an $80.0 million distribution to our stockholder, pay certain fees and expenses associated with the
closing of the credit facility, and terminate our interest rate swap contract. Deferred financing fees of $4.6 million relating to the Term Loan were capitalized as deferred charges in the
consolidated balance sheets. The termination of the interest rate swap was paid in March 2011 and was recorded as a $0.4 million increase in interest expense, net. The $1.4 million
balance of deferred financing costs related to our prior indebtedness was written off to interest expense in our consolidated statements of operations.
The
carrying value of our long-term debt approximates fair value. The estimate of the fair value of our debt is based on observable market information from a third party pricing source
and is classified in level 2 of the fair value hierarchy.
Note 4—Net Income per Share
Basic net income per share is computed using the weighted average number of common shares outstanding during the period, while diluted net income per share is computed using the weighted
average number of common shares outstanding plus all potentially dilutive common share equivalents
F-32
Table of Contents
IGNITE RESTAURANT GROUP, INC.
Notes to Condensed Consolidated Financial Statements (Continued)
Note 4—Net Income per Share (Continued)
outstanding
during the period. The following table summarizes the components to determine the numerator and denominators of basic and diluted net income per share (in thousands):
|
|
|
|
|
|
|
|
|
|
Twelve Weeks Ended |
|
|
|
March 28,
2011 |
|
March 26,
2012 |
|
Numerator: |
|
|
|
|
|
|
|
Net income |
|
$ |
1,158 |
|
$ |
2,491 |
|
| |
|
|
|
|
|
Denominator: |
|
|
|
|
|
|
|
Basic and diluted weighted average shares outstanding |
|
|
1 |
|
|
1 |
|
| |
|
|
|
|
|
Unaudited Pro Forma Net Income per Share
We have filed a registration statement with the Securities and Exchange Commission ("SEC") to sell shares of our common stock to the
public. Immediately after the completion of this public offering, JCS Holdings, LLC, our parent company, will distribute substantially all of the shares of our common stock then held by it
and/or the cash proceeds received in this public offering to the holders of its Series A preferred units and its vested common units. JCS Holdings, LLC will thereafter continue to hold
shares equal to less than one percent of our outstanding common stock for the benefit of certain of our officers and directors who will continue to hold unvested common units in JCS Holdings,
LLC upon consummation of this offering.
Immediately
prior to the completion of the offering, we will effect a 19,178.226-to-1 stock split.
The
unaudited pro forma basic and diluted net income per share for the twelve weeks ended March 26, 2012 give effect to the initial public offering and stock split as if they were
completed at the beginning of fiscal year 2011. Shares to be sold in the offering from which proceeds will be used to prepay a portion of our term loan and pay fees and expenses related to this
offering are included in the unaudited pro forma basic and diluted net income per share calculations. The following table sets forth the computation of unaudited pro forma basic and diluted net income
per share based on an offering
price of $13.00 per share, the midpoint of the price range set forth on the cover page of this prospectus:
|
|
|
|
|
|
|
Twelve Weeks Ended
March 26, 2012 |
|
Pro forma net income (in thousands) |
|
$ |
3,013 |
|
Pro forma basic and diluted weighted average number of shares |
|
|
22,870,760 |
|
Pro forma net income per share |
|
$ |
0.13 |
|
F-33
Table of Contents
IGNITE RESTAURANT GROUP, INC.
Notes to Condensed Consolidated Financial Statements (Continued)
Note 5—Supplemental Disclosure of Cash Flow Information
The following table sets forth certain noncash financing activities as follows (in thousands):
|
|
|
|
|
|
|
|
|
|
Twelve Weeks Ended |
|
|
|
March 28,
2011 |
|
March 26,
2012 |
|
Unpaid liabilities for property and equipment |
|
$ |
4,004 |
|
$ |
8,783 |
|
Increase in value of interest rate swap |
|
$ |
121 |
|
$ |
— |
|
Note 6—Subsequent Events
On April 23, 2012, we entered into an amendment to our senior secured credit agreement that will become effective on the date we receive proceeds from an initial public offering.
The amendment requires us to prepay a portion of the term loan with proceeds from the initial public offering in an amount equal to the greater of (a) $35.0 million and (b) the
lesser of (1) 56% of the gross cash proceeds of the initial public offering and (2) $42.5 million. The prepayment will first be applied to the next six regularly scheduled
quarterly term loan principal payments and then will reduce the remaining principal payments on a pro rata basis. The amendment includes other revisions to the credit agreement, the most significant
of which are modifications to our financial covenants that increase the amount that we can spend annually on growth related capital expenditures, lower the principal component of the fixed charge
ratio calculation proportionally to the pay down, and reduce our effective leverage ratio by 25 basis points for substantially all remaining quarterly periods. The amendment also eliminates the annual
mandatory prepayment requirement related to excess cash flow.
F-34
Table of Contents
Table of Contents
5,769,231 Shares
Ignite Restaurant Group, Inc.
Common Stock
Credit Suisse
Baird
Piper Jaffray
KeyBanc Capital Markets
Lazard Capital Markets
Raymond James
Prospectus
, 2012
Table of Contents
PART II
INFORMATION NOT REQUIRED IN PROSPECTUS
Item 13. Other Expenses of Issuance and Distribution.
The following table sets forth all costs and expenses, other than the underwriting discounts and commissions payable by us, in
connection with the offer and sale of the securities being registered. All amounts shown are estimates except for the SEC registration fee and the Financial Industry Regulatory Authority, Inc.
("FINRA") filing fee.
|
|
|
|
|
|
|
|
Amount |
|
SEC registration fee |
|
$ |
11,610 |
|
FINRA filing fee |
|
$ |
10,500 |
|
NASDAQ listing fee |
|
|
|
* |
Printing expenses |
|
|
|
* |
Accounting fees and expenses |
|
|
|
* |
Legal fees and expenses |
|
|
|
* |
Blue Sky fees and expenses |
|
|
|
* |
Transfer Agent and Registrar fees and expenses |
|
|
|
* |
Miscellaneous expenses |
|
|
|
* |
| |
|
|
|
| |
Total |
|
$ |
22,110 |
|
| |
|
|
|
- *
- To
be provided by amendment.
Item 14. Indemnification of Officers and Directors.
Section 102(b)(7) of the DGCL allows a corporation to provide in its certificate of incorporation that a director of the
corporation will not be personally liable to the corporation or its stockholders for monetary damages for breach of fiduciary duty as a director, except where the director breached the duty of
loyalty, failed to act in good faith, engaged in intentional misconduct or knowingly violated a law, authorized the payment of a dividend or approved a stock repurchase in violation of Delaware
corporate law or obtained an improper personal benefit. Our restated certificate of incorporation will provide for this limitation of liability.
Section 145
of the DGCL ("Section 145"), provides that a Delaware corporation may indemnify any person who was, is or is threatened to be made, party to any threatened,
pending or completed action, suit or proceeding, whether civil, criminal, administrative or investigative (other than an action by or in the right of such corporation), by reason of the fact that such
person is or was an officer, director, employee or agent of such corporation or is or was serving at the request of such corporation as a director, officer, employee or agent of another corporation or
enterprise. The indemnity may include expenses (including attorneys' fees), judgments, fines and amounts paid in settlement actually and reasonably incurred by such person in connection with such
action, suit or proceeding, provided such person acted in good faith and in a manner he reasonably believed to be in or not opposed to the corporation's best interests and, with respect to any
criminal action or proceeding, had no reasonable cause to believe that his or her conduct was illegal. A Delaware corporation may indemnify any persons who are, were or are threatened to be made a
party to any threatened, pending or completed action or suit by or in the right of the corporation by reason of the fact that such person is or was a director, officer, employee or agent of another
corporation or enterprise. The indemnity may include expenses (including attorneys' fees) actually and reasonably incurred by such person in connection with the defense or settlement of such action or
suit, provided such person acted in good faith and in a manner he reasonably believed to be in or not opposed to the corporation's best interests, provided that no indemnification is permitted without
judicial approval if the officer, director, employee or agent is
II-1
Table of Contents
adjudged
to be liable to the corporation. Where an officer or director is successful on the merits or otherwise in the defense of any action referred to above, the corporation must indemnify him
against the expenses which such officer or director has actually and reasonably incurred.
Section 145
further authorizes a corporation to purchase and maintain insurance on behalf of any person who is or was a director, officer, employee or agent of the corporation or
is or was serving at the request of the corporation as a director, officer, employee or agent of another corporation or enterprise, against any liability asserted against him and incurred by him in
any such capacity, or arising out of his or her status as such, whether or not the corporation would otherwise have the power to indemnify him under Section 145.
Our
amended and restated certificate of incorporation will provide that we must indemnify our directors and officers to the fullest extent authorized by the DGCL and must also pay
expenses incurred in defending any such proceeding in advance of its final disposition upon delivery of an undertaking, by or on behalf of an indemnified person, to repay all amounts so advanced if it
should be determined ultimately that such person is not entitled to be indemnified under this section or otherwise.
We
intend to enter into indemnification agreements with each of our current directors and officers. These agreements will require us to indemnify these individuals to the fullest extent
permitted under Delaware law against liabilities that may arise by reason of their service to us, and to advance expenses incurred as a result of any proceeding against them as to which they could be
indemnified.
The
indemnification rights set forth above shall not be exclusive of any other right which an indemnified person may have or hereafter acquire under any statute, provision of our
certificate of incorporation, our bylaws, agreement, vote of stockholders or disinterested directors or otherwise.
We
expect to maintain standard policies of insurance that provide coverage (1) to our directors and officers against loss rising from claims made by reason of breach of duty or
other wrongful act and (2) to us with respect to indemnification payments that we may make to such directors and officers.
The
proposed form of Underwriting Agreement to be filed as Exhibit 1.1 to this Registration Statement provides for indemnification to our directors and officers by the
underwriters against certain liabilities.
Item 15. Recent Sales of Unregistered Securities
In the three years preceding the filing of this registration statement, we have not issued any securities that were not registered
under the Securities Act of 1933, as amended.
Item 16. Exhibits
(a) Exhibits
The exhibit index attached hereto is incorporated herein by reference.
(b) Financial Statement Schedules
No financial statement schedules are provided because the information called for is not applicable or is shown in the financial statements or notes thereto.
Item 17. Undertakings
(a) The
undersigned registrant hereby undertakes to provide to the underwriters at the closing specified in the underwriting agreement certificates in such denominations and
registered in such names as required by the underwriters to permit prompt delivery to each purchaser.
II-2
Table of Contents
(b) Insofar
as indemnification for liabilities arising under the Securities Act of 1933, as amended, may be permitted to directors, officers and controlling persons of the
registrant pursuant to the foregoing provisions, or otherwise, the registrant has been advised that in the opinion of the Securities and Exchange Commission such indemnification is against public
policy as expressed in the Securities Act and is, therefore, unenforceable. In the event that a claim for indemnification against such liabilities (other than the payment by the registrant of expenses
incurred or paid by a director, officer or controlling person of the registrant in the successful defense of any action, suit or proceeding) is asserted by such director, officer or controlling person
in connection with the securities being registered, the registrant will, unless in the opinion of its counsel the matter has been settled by controlling precedent, submit to a court of appropriate
jurisdiction, the question whether such indemnification by it is against public policy as expressed in the Securities Act and will be governed by the final adjudication of such issue.
(c) The
undersigned registrant hereby further undertakes that:
(1) For
purposes of determining any liability under the Securities Act of 1933, as amended, the information omitted from the form of prospectus filed as part of this
registration statement in reliance upon Rule 430A and contained in a form of prospectus filed by the registrant pursuant to Rule 424(b)(1) or (4) or 497(h) under the Securities
Act shall be deemed to be part of this registration statement as of the time it was declared effective.
(2) For
the purpose of determining any liability under the Securities Act of 1933, as amended, each post-effective amendment that contains a form of prospectus
shall be deemed to be a new registration statement relating to the securities offered therein, and the offering of such securities at that time shall be deemed to be the initial bona fide offering
thereof.
II-3
Table of Contents
SIGNATURES
Pursuant to the requirements of the Securities Act of 1933, as amended, the registrant has duly caused this Amendment No. 7 to
the Registration Statement to be signed on its behalf by the undersigned, thereunto duly authorized in the City of Houston, State of Texas, on May 8, 2012.
|
|
|
|
|
|
|
| |
|
IGNITE RESTAURANT GROUP, INC. |
|
|
By: |
|
/s/ JEFFREY L. RAGER
|
| |
|
|
|
Name: |
|
Jeffrey L. Rager |
| |
|
|
|
Title: |
|
Senior Vice President, Chief Financial Officer and Director
|
Pursuant to the requirements of the Securities Act of 1933, as amended, this Amendment No. 7 to the Registration Statement has been signed by the following persons in the
capacities indicated and on the date indicated below:
|
|
|
|
|
Signatures
|
|
Title
|
|
Date |
*
Raymond A. Blanchette, III |
|
President, Chief Executive Officer
and Director
(principal executive officer) |
|
May 8, 2012 |
/s/ JEFFREY L. RAGER
Jeffrey L. Rager |
|
Senior Vice President, Chief Financial Officer and Director
(principal financial officer and principal accounting officer) |
|
May 8, 2012 |
/s/ EDWARD W. ENGEL
Edward W. Engel |
|
Senior Vice President, General Counsel
and Director |
|
May 8, 2012 |
|
|
|
|
|
| *By: |
|
/s/ JEFFREY L. RAGER
Jeffrey L. Rager
as attorney in fact |
|
|
II-4
Table of Contents
EXHIBIT INDEX
|
|
|
| Exhibit No. |
|
Description |
| 1.1+ |
|
Form of Underwriting Agreement. |
| 3.1* |
|
Form of Amended and Restated Certificate of Incorporation of Ignite Restaurant Group, Inc. |
| 3.2+ |
|
Form of Amended and Restated Bylaws of Ignite Restaurant Group, Inc. |
| 4.1+ |
|
Specimen Common Stock Certificate. |
| 4.2* |
|
Form of Registration Rights Agreement. |
| 5.1* |
|
Form of Opinion of Kirkland & Ellis LLP. |
| 10.1+ |
|
Credit Agreement, dated as of March 24, 2011, by and between Ignite Restaurant Group, Inc., as borrower, the guarantors named therein, General Electric Capital Corporation and the lenders named therein. |
| 10.2+ |
|
Amendment No. 1, dated as of May 31, 2011, to the Credit Agreement, dated as of March 24, 2011, by and between Ignite Restaurant Group, Inc., as borrower, the guarantors named therein, General Electric
Capital Corporation and the lenders named therein. |
| 10.3+ |
|
Amendment No. 2, dated as of July 22, 2011, to the Credit Agreement, dated as of March 24, 2011, by and between Ignite Restaurant Group, Inc., as borrower, the guarantors named therein, General Electric
Capital Corporation and the lenders named therein. |
| 10.4+ |
|
Amendment No. 3, dated as of November 18, 2011, to the Credit Agreement, dated as of March 24, 2011, by and between Ignite Restaurant Group, Inc., as borrower, the guarantors named therein, General Electric
Capital Corporation and the lenders named therein. |
| 10.5+ |
|
Amendment No. 4, dated as of April 23, 2012, to the Credit Agreement, dated as of March 24, 2011, by and between Ignite Restaurant Group, Inc., as borrower, the guarantors named therein, General Electric
Capital Corporation and the lenders named therein. |
| 10.6+† |
|
Form of Ignite Restaurant Group, Inc. 2012 Omnibus Incentive Plan. |
| 10.7+† |
|
Offer Term Sheet, effective as of May 21, 2007, between Joe's Crab Shack Holdings, Inc. and Raymond A. Blanchette, III. |
| 10.8+† |
|
Form of JCS Holdings, LLC Unit Grant Agreement. |
| 10.9+ |
|
Third Amended and Restated Limited Liability Company Operating Agreement of JCS Holdings, LLC. |
| 10.10* |
|
Form of First Amendment to the Third Amended and Restated Limited Liability Company Operating Agreement of JCS Holdings, LLC. |
| 10.11+ |
|
Management Agreement, by and between J.H. Whitney Capital Partners, LLC, JCS Holdings, LLC, Ignite Restaurant Group, Inc. and certain of its subsidiaries party thereto. |
| 10.12*† |
|
Form of Directors and Officers Indemnification Agreement. |
| 21.1+ |
|
List of Subsidiaries of Ignite Restaurant Group, Inc. |
| 23.1* |
|
Consent of PricewaterhouseCoopers LLP. |
| 23.2* |
|
Consent of Kirkland & Ellis LLP (included in Exhibit 5.1). |
| 24.1+ |
|
Power of Attorney (included in Exhibit 5.1). |
| 99.1+ |
|
Consent of Director Nominee (Richard P. Bermingham). |
| 99.2+ |
|
Consent of Director Nominee (John Gilbert). |
| 99.3+ |
|
Consent of Director Nominee (Zane Leshner). |
| 99.4+ |
|
Consent of Director Nominee (Brian N. Cherry). |
| 99.5+ |
|
Consent of Director Nominee (Paul R. Vigano). |
- *
- Filed
herewith.
- **
- To
be filed by amendment.
- †
- Indicates
a management contract or compensatory plan or arrangement.
- +
- Previously
filed.
II-5