Attached files
| file | filename |
|---|---|
| 8-K - 8-K - FIFTH THIRD BANCORP | d348485d8k.htm |
 ©
Fifth Third Bank | All Rights Reserved
Exhibit 99.1
UBS Global Financial Services Conference
Kevin T. Kabat
President & Chief Executive Officer
May 8, 2012
Please refer to earnings release dated April 19, 2012 for further information.
|
 2
©
Fifth Third Bank | All Rights Reserved
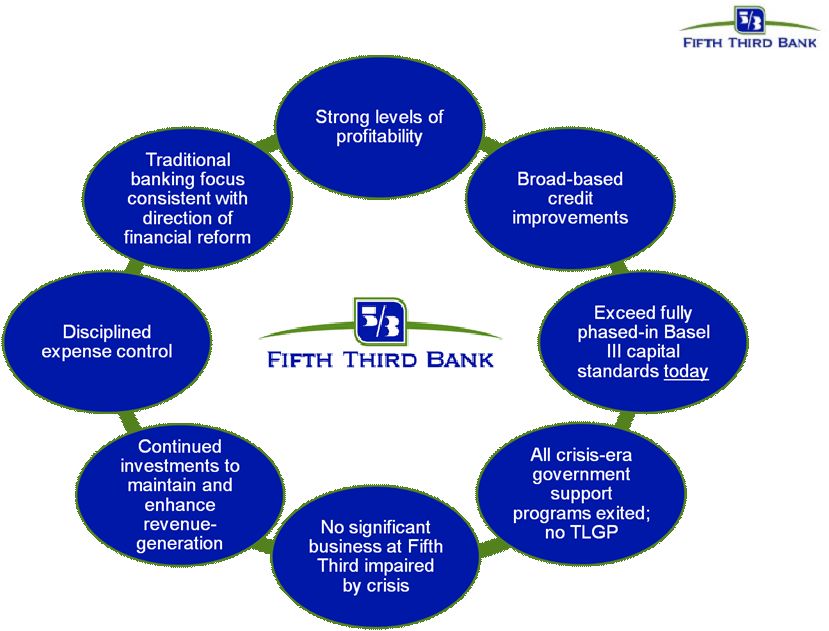
Well-positioned for success and leadership in new banking landscape
Key themes |
 3
©
Fifth Third Bank | All Rights Reserved
Environment characterized by low growth
expectations and low interest rates
•
Prolonged low-rate environment, coupled
with modest economic growth
•
Lower securities reinvestment yields on
portfolio cash flows
•
Strong deposit flows
•
Competitive dynamics
•
Elevated mortgage refinance activity
•
Firms facing significant litigation related to:
–
Mortgage securitizations
–
GSE repurchases
–
Private label mortgage repurchases
•
Concerns about European banks and
sovereign debt
•
Higher capital standards; limitations on
dividend payout ratios; capital building
beyond targeted / required levels
•
Continued strong loan production
–
Rates on loan originations relatively stable
•
Careful management of liability costs
–
Disciplined pricing on deposits
–
Continued evaluation of term liabilities
including TruPS
•
Strong mortgage banking results
•
Mortgage risks manageable
–
Quarterly mortgage repurchase costs
~$20mm; claims inventory has declined
–
Total
mortgage securitizations outstanding
$19mm (2003 HELOC and performing well)
•
No direct European sovereign exposure
–
Total exposure to European peripheral
borrowers <$0.2bn*
–
Total exposure to European banks <$0.1bn
•
Strong profitability and capital in excess of
fully
phased-in
Basel
III
standards
today
–
2012 CCAR** plan to increase distributions
Fifth Third is well-positioned to deal with current environmental
challenges Characteristics of current environment
Fifth Third’s response / position
* Greece, Ireland, Italy, Portugal, Spain
** Comprehensive Capital Analysis & Review by Federal Reserve; subject to Board
of Directors and regulatory approval. |
 4
©
Fifth Third Bank | All Rights Reserved
Balance sheet growth mitigates rate environment
Commercial Loan Growth^ ($bn)
Consumer Loan Growth^ ($bn)
•
Sustained growth in commercial loans driven by C&I
–
Growth is geographically diverse and across number
of industry segments, particularly manufacturing
•
Commercial line utilization stable at 32%; potential
source of future growth
•
CRE portfolio run-off at slowing rate, with modest
selective current origination volume
•
Consumer loan growth driven by auto and in-branch
mortgage originations
–
Managing auto volumes to ensure appropriate
returns; spread pressure due to competition
–
Branch mortgage refi product has FICO over 780, LTV
~60% and avg. term ~17 years while yielding above
market rates due to process convenience
^ Excluding loans held-for-sale
* Excludes CMA and PNC due to large acquisitions
Peer Banks include BBT, CMA, HBAN, KEY, MTB, PNC, RF, STI, USB, WFC, ZION. Source:
SNL Financial and Company Reports. EOP quarterly C&I loan growth^
•
C&I loans as a percent of total commercial loans was
68% at 1Q12 versus peer average of 61%
•
Year-over-year C&I growth 18% versus peer median of
12%* |
 5
©
Fifth Third Bank | All Rights Reserved
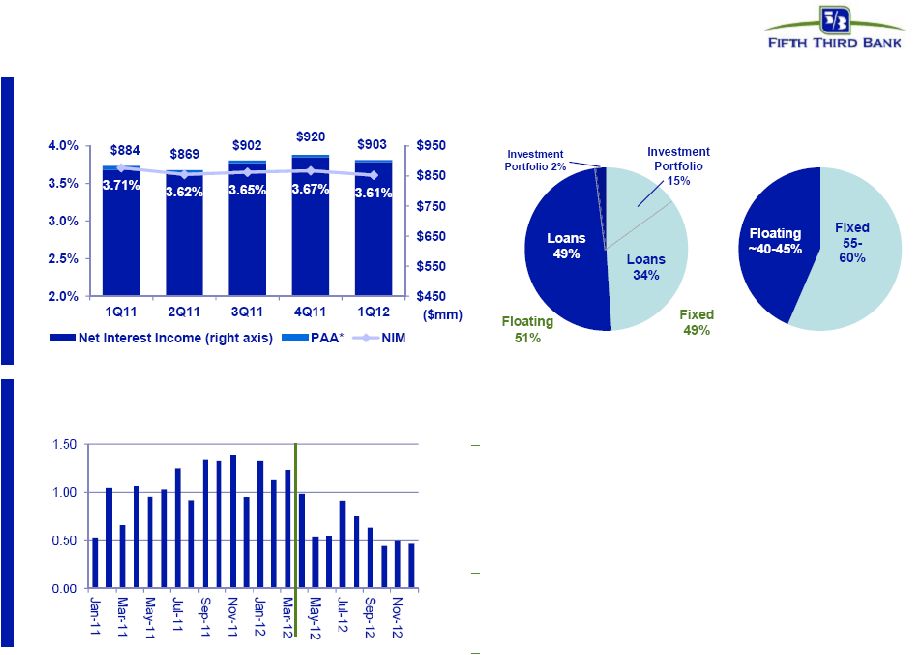
Rate of NIM pressure declining
* Represents purchase accounting adjustments included in net interest income.
^ Estimate; funding (DDAs + interest-bearing liabilities); liabilities
attributed to fixed or floating using terms and expected beta
Fixed / Floating Portfolio
•
Modest natural asset sensitivity creates near-
term NIM pressure but we expect it to be
manageable
~50% of assets, ~40-45% of funding
variable in nature
•
Coupons on new originations of variable rate
assets consistent with portfolio weighted
average coupons
Emphasis on variable rate C&I lending
•
Coupons on new fixed rate originations
converging with portfolio average coupons
Fixed rate securities only 15% earning
assets
Interest-Earning
Assets
Funding^
NII and NIM (FTE)
Trend: fixed rate origination coupons
relative to fixed portfolio weighted avg |
 6
©
Fifth Third Bank | All Rights Reserved
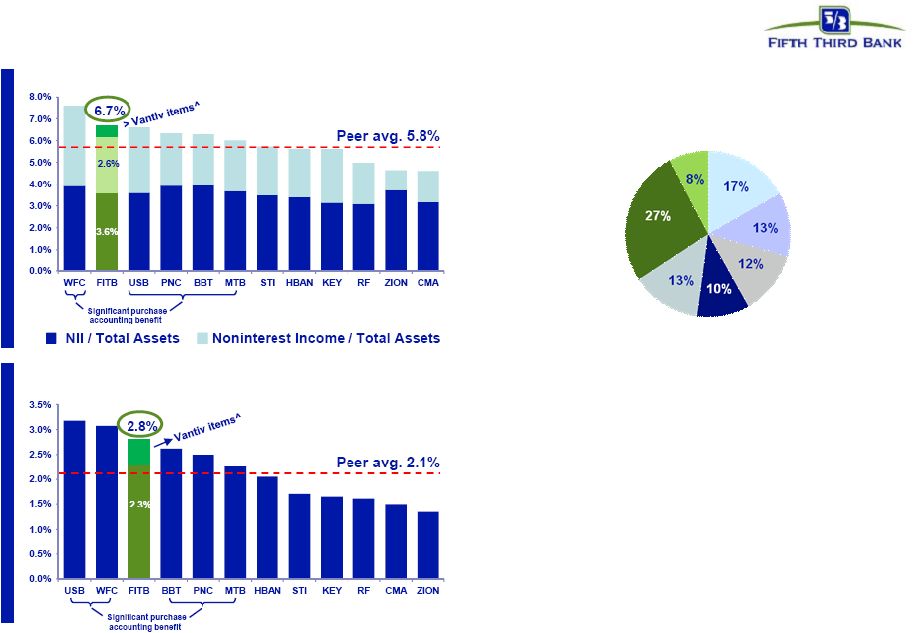
Strong revenue and profit generation
Source: SNL Financial and Company Reports.
* Non-GAAP measure. See Reg. G reconciliation in the Appendix to the
presentation. ^ ~50 bps of Vantiv items in noninterest income include $115mm
gains from Vantiv’s IPO, ~$36mm charge related to Vantiv's debt refinancing, and $46mm positive valuation adjustment on the
Vantiv warrant and put option.
Revenue / Avg. Int. Earning Assets
PPNR* / Avg. Int. Earning Assets
Deposit fees
Corporate
banking
Investment
advisors
Other
Mortgage
Card &
Processing
Fee Income Distribution
Vantiv^
•
Business mix provides higher than
average diversity among spread and
fee revenues (40+% of revenue)
•
Relatively strong margin and
relatively high fee income
contribution drives strong revenue
and PPNR generation profitability
•
Profitability remains strong despite
sluggish economy |
 7
©
Fifth Third Bank | All Rights Reserved
Customer oriented solutions
•
Broad suite of product offerings with distinct value propositions appealing to
various customer segments
•
Implementation of new products, like DUO Card, Real Life Rewards, Relationship
Savings •
Letting customers choose how to pay for products and services they use
•
More straightforward, simpler suite of consumer deposit products
Providing customers with products and services they find valuable
•
Negative impact from debit interchange legislation and Reg E in run-rates
•
Initial impact of debit interchange legislation (~$30mm per quarter) expected to be
mitigated over time; implementing carefully and deliberately through various
actions, including: –
Reduced costs associated with debit card offerings; changes and eliminations of
reward programs
–
Incorporation of debit usage into bundled deposit product offerings
–
Adjustment of product and fee structures relative to services provided
–
Charge card alternatives
–
Implementation of new products
Deliberate and multi-pronged approach to mitigation of regulatory / legislative
impacts •
In-depth discussions with customers to determine what matters most to them
•
Actively seeking input and feedback from customer base and prospective
customers •
Working carefully to ensure we align value to the customer with value to us
Listening to the voice of our customers |
 8
©
Fifth Third Bank | All Rights Reserved
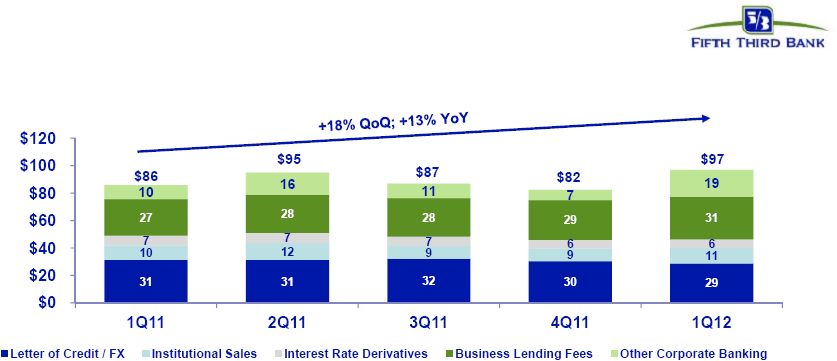
Momentum building in corporate banking
Corporate banking revenue ($mm)
•
Syndication fee revenue up
150% from 1Q11; fees from
lead transactions up 260%
from 1Q11 largely due to 11
lead syndications
transactions closed during
1Q12
•
Average fees on lead
transactions of ~$1mm in
1Q12 vs <$500k in 2011
Mid-corporate opportunity
•
Target clients: businesses
that generate $200mm to
$2B in revenue
•
Hired 20+ bankers in the
past 6 months
–
Have generated $1.2B in
committed credit and
more than $400mm in
funded loans
•
Cash-centric retail locations such as
quick service restaurants, convenience
stores, and specialty stores
•
Simplifies cash handling; improves cash
flow
•
Automates and streamlines account
reconciliation
•
Decreases employee theft (risk
management)
•
RCM locations have doubled since 2009,
with more than 6,400 locations as of
3/31/12
Syndications
Remote Currency Manager |
 9
©
Fifth Third Bank | All Rights Reserved
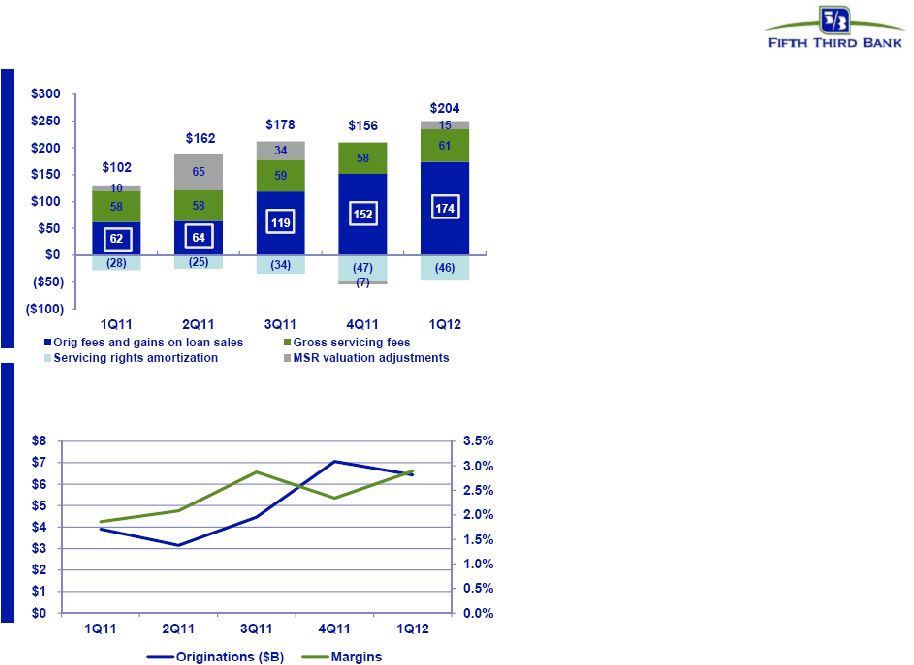
Strong mortgage banking results
•
Record origination fees and gain on
loan sales in 1Q12
Looking forward:
•
Continued strong originations /
deliveries in 2Q12
–
Continuing while rates remain low
•
Gain on sale margins benefitting
from:
–
Strong demand
–
Industry capacity constraints
–
Low prepayment expectations
(particularly on HARP 2.0
originations)
•
HARP 2.0 originations expected to
increase as percentage of total
originations
Mortgage originations and gain-on-sale margins
Mortgage Banking Revenue ($mm) |
 10
©
Fifth Third Bank | All Rights Reserved
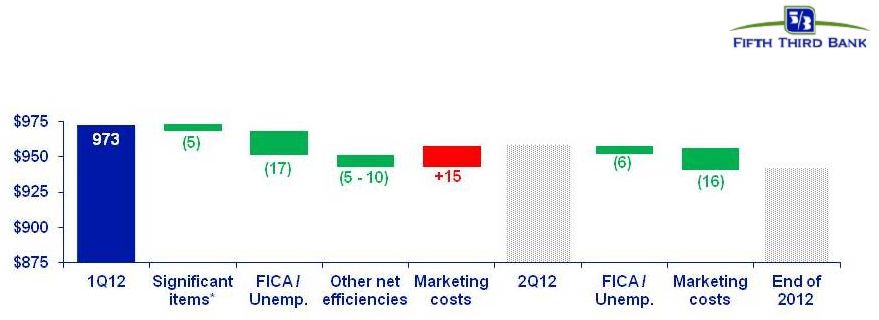
Disciplined expense management
•
Expenses trending downward: 1Q12 expenses down 2% from 4Q11
•
2Q12 expenses expected to decline ~2% despite temporary increase
in marketing costs
•
Expect further overall reduction in expenses in 2H12
•
Managing expenses carefully in response to revenue environment; continuous process of
expense evaluation
•
Expect efficiency ratio to move closer to 60% by year-end and target mid-50%
in normalized environment (with higher interest rate environment)
–
Current impact of credit costs on revenue and expenses; initial impact of regulatory
reforms (e.g., debit interchange)
–
Reflects below-capacity balance sheet and lower revenue than we expect and can
support longer term
Managing expenses for current revenue environment and long-term franchise
value 2012 expense trends ($mm)
*
Significant
items
include
$23mm
benefit
from
agreements
reached
on
certain
non-income
tax
related
assessments,
$13mm
in
additions
to
litigation
reserves,
$9mm
in
debt extinguishment charges, and $6mm in severance expense incurred in 1Q12
|
 11
©
Fifth Third Bank | All Rights Reserved
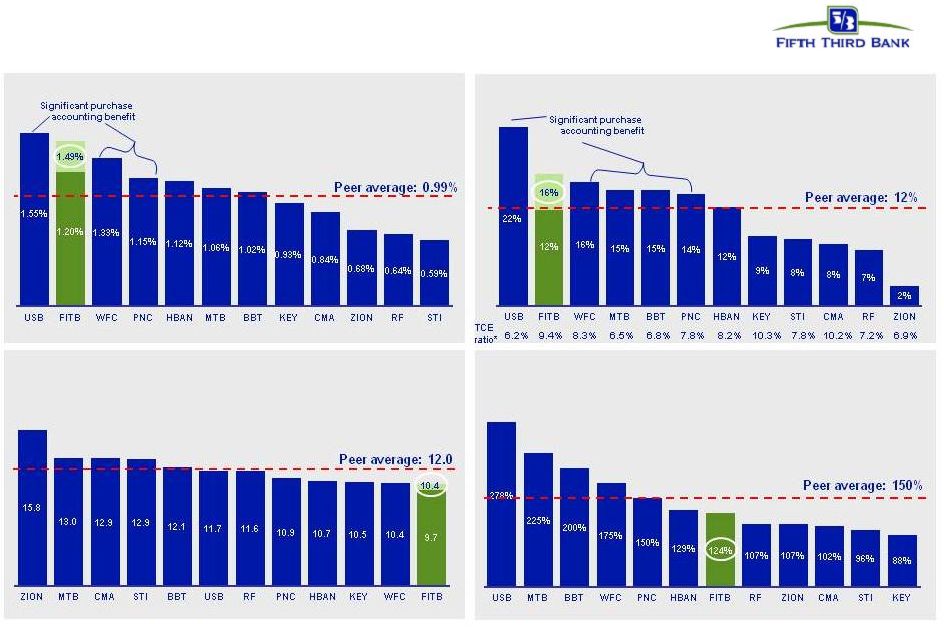
Credit trends continue to improve
with strong reserve coverage levels
Source: SNL Financial and Company Reports. Data as of 1Q12. HFI NPAs and NPLs
exclude loans held-for-sale and also exclude covered assets for BBT, USB, and ZION
*
Non-GAAP
measure.
See
Reg.
G
reconciliation
in
the
Appendix
to
the
presentation.
Reserves, pre-provision profits and capital levels significant in relation to
problem assets Reserves / NPLs
“Texas Ratio”
(HFI NPAs + Over 90s) / (Reserves + TCE*)
HFI NPA Ratio
•
Problem asset levels continue to
decline
•
Reserves remain significantly higher
than pre-crisis levels and peers, with
strong coverage of problem assets and
net charge-offs
•
PPNR levels and profitability provides
Fifth Third with strong ongoing loss
absorption capacity |
 12
©
Fifth Third Bank | All Rights Reserved
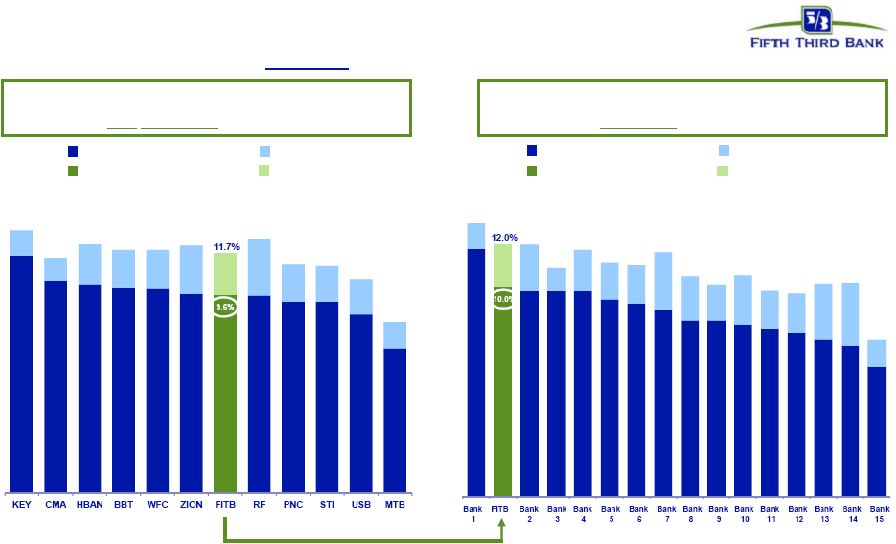
Exceed fully phased-in Basel III
capital standards today
Source: SNL Financial, Company Reports, and third-party estimates. Data as of
1Q12. Risk-weighted assets for MTB, PNC, ZION as of 4Q11. *
Peers
include
BAC,
BBT,
C,
CMA,
COF,
HBAN,
JPM,
KEY,
MTB,
PNC,
RF,
STI,
USB,
WFC,
ZION
** Non-GAAP measure. See Reg. G reconciliation in the Appendix to the
presentation. Fifth Third’s capital position already well in excess of
established standards, likely standards, and most peers Tier 1 common
(peers) Tier 1 common (FITB)
Reserves
(Tier 1 common + reserves) / RWA**
(not
adjusted
for Basel III)
Peers* not in order of graph at left; estimated
(Tier 1 common + reserves) / RWA**
(adjusted
for Basel III)
Note:
Estimates
based
on
current
Basel
III
rules
released
by
the
Basel
Committee;
actual
rules subject to U.S. banking regulation. Assumes unrealized securities gains
included in Tier 1 common. Not adjusted for potential mitigation efforts.
Four large peers include estimated Basel 2 / 2.5 / 3 RWA impact based on
BIS proposals. Reserves
Tier 1 common (peers)
Tier 1 common (FITB)
Reserves (FITB)
Reserves (FITB) |
 13
©
Fifth Third Bank | All Rights Reserved
Capital management philosophy
* Subject to Board of Directors and regulatory approval
** Subject to Federal Reserve non-objection to Comprehensive Capital Analysis
& Review capital plan Organic growth opportunities
•
Support growth of core banking franchise
•
Continued loan growth despite sluggish
economy
Strategic opportunities
*
•
Prudently expand franchise or increase
density in core markets via disciplined
acquisitions or selective de novos
•
Expect future acquisition activity although
less likely in near-term
•
Attain top 3 market position in 65% of
markets or more longer term
Return to more normal dividend policy
*^
•
Strong levels of profitability would support
higher dividend than current level
•
Move towards levels more consistent with
Fed’s near-term payout ratio guidance of
30%
Repurchases / Redemptions
*
•
Initiate common share repurchases to limit
and manage growth in excess capital levels^
–
Manage common equity in light of
regulatory environment, other
alternatives, maintenance of desired /
required buffers, and stock price
•
Potential redemption of $1.4bn in TruPS
–
Evaluated in context of desired capital
structure and regulatory developments
Intend to increase shareholder distributions with
Federal Reserve approval of capital plan**
Capital Deployment
Capital Return |
 14
©
Fifth Third Bank | All Rights Reserved
Strong returns drive capital generation
Source: SNL Financial and Company Reports. Price as of 5/1/12
*1Q12
annualized. **FY2012 consensus estimate. Source: Thomson One
^Non-GAAP measure. See Reg. G reconciliation in the Appendix to the
presentation. Note: FITB light green shading represents1Q12 impact of Vantiv.
Well above average profitability and capital generation, well below average
valuation Price / Tangible Book Value^
Price / FY12 Earnings**
Return on Average Tangible Common Equity
*^
Return on Average Assets
* |
 15
©
Fifth Third Bank | All Rights Reserved
Well-positioned for the future
•
Holding company cash currently sufficient for more than 3 years of obligations; no
holding company and minimal Bank unsecured debt maturities until 2013
•
Fifth Third has completely exited all crisis-era government support
programs –
Fifth Third is one of the few large banks that have no TLGP-guaranteed debt to
refinance in 2012 Superior capital and liquidity position
•
NCOs of 1.1%; 2.4x reserves / annualized NCOs
•
Substantial reduction in exposure to CRE since 1Q09; relatively low CRE exposure
versus peers •
Very low relative exposure to areas of concern, e.g. European financials, mortgage
repurchase risk Proactive approach to risk management
•
Traditional commercial banking franchise built on customer-oriented localized
operating model •
Strong market share in key markets with focus on further improving density
•
Fee income ~46% of total revenues
Diversified traditional banking platform
•
PPNR has remained strong throughout the credit cycle
•
PPNR substantially exceeds annual net charge-offs (315% PPNR / NCOs^ in
1Q12) •
1.5% ROAA; 16% return on average tangible common equity^
Industry leader in earnings power
^ Non-GAAP measure. See Reg. G reconciliation in the appendix to the
presentation. |
 16
©
Fifth Third Bank | All Rights Reserved
Cautionary statement
This
report
contains
statements
that
we
believe
are
“forward-looking
statements”
within
the
meaning
of
Section
27A
of
the
Securities
Act
of
1933,
as
amended,
and
Rule
175
promulgated
thereunder,
and
Section
21E
of
the
Securities
Exchange
Act
of
1934,
as
amended,
and
Rule
3b-6
promulgated
thereunder.
These
statements
relate
to
our
financial
condition,
results
of
operations,
plans,
objectives,
future
performance
or
business.
They
usually
can
be
identified
by
the
use
of
forward-looking
language
such
as
“will
likely
result,”
“may,”
“are
expected
to,”
“is
anticipated,”
“estimate,”
“forecast,”
“projected,”
“intends
to,”
or
may
include
other
similar
words
or
phrases
such
as
“believes,”
“plans,”
“trend,”
“objective,”
“continue,”
“remain,”
or
similar
expressions,
or
future
or
conditional
verbs
such
as
“will,”
“would,”
“should,”
“could,”
“might,”
“can,”
or
similar
verbs.
You
should
not
place
undue
reliance
on
these
statements,
as
they
are
subject
to
risks
and
uncertainties,
including
but
not
limited
to
the
risk
factors
set
forth
in
our
most
recent
Annual
Report
on
Form
10-K.
When
considering
these
forward-looking
statements,
you
should
keep
in
mind
these
risks
and
uncertainties,
as
well
as
any
cautionary
statements
we
may
make.
Moreover,
you
should
treat
these
statements
as
speaking
only
as
of
the
date
they
are
made
and
based
only
on
information
then
actually
known to us.
There
are
a
number
of
important
factors
that
could
cause
future
results
to
differ
materially
from
historical
performance
and
these
forward-
looking
statements.
Factors
that
might
cause
such
a
difference
include,
but
are
not
limited
to:
(1)
general
economic
conditions
and
weakening
in
the
economy,
specifically
the
real
estate
market,
either
nationally
or
in
the
states
in
which
Fifth
Third,
one
or
more
acquired
entities
and/or
the
combined
company
do
business,
are
less
favorable
than
expected;
(2)
deteriorating
credit
quality;
(3)
political
developments,
wars
or
other
hostilities
may
disrupt
or
increase
volatility
in
securities
markets
or
other
economic
conditions;
(4)
changes
in
the
interest
rate
environment
reduce
interest
margins;
(5)
prepayment
speeds,
loan
origination
and
sale
volumes,
charge-offs
and
loan
loss
provisions;
(6)
Fifth
Third’s
ability
to
maintain
required
capital
levels
and
adequate
sources
of
funding
and
liquidity;
(7)
maintaining
capital
requirements
may
limit
Fifth
Third’s
operations
and
potential
growth;
(8)
changes
and
trends
in
capital
markets;
(9)
problems
encountered
by
larger
or
similar
financial
institutions
may
adversely
affect
the
banking
industry
and/or
Fifth
Third;
(10)
competitive
pressures
among
depository
institutions
increase
significantly;
(11)
effects
of
critical
accounting
policies
and
judgments;
(12)
changes
in
accounting
policies
or
procedures
as
may
be
required
by
the
Financial
Accounting
Standards
Board
(FASB)
or
other
regulatory
agencies;
(13)
legislative
or
regulatory
changes
or
actions,
or
significant
litigation,
adversely
affect
Fifth
Third,
one
or
more
acquired
entities
and/or
the
combined
company
or
the
businesses
in
which
Fifth
Third,
one
or
more
acquired
entities
and/or
the
combined
company
are
engaged,
including
the
Dodd-Frank
Wall
Street
Reform
and
Consumer
Protection
Act;
(14)
ability
to
maintain
favorable
ratings
from
rating
agencies;
(15)
fluctuation
of
Fifth
Third’s
stock
price;
(16)
ability
to
attract
and
retain
key
personnel;
(17)
ability
to
receive
dividends
from
its
subsidiaries;
(18)
potentially
dilutive
effect
of
future
acquisitions
on
current
shareholders’
ownership
of
Fifth
Third;
(19)
effects
of
accounting
or
financial
results
of
one
or
more
acquired
entities;
(20)
difficulties
from
the
separation
of
Vantiv,
LLC,
formerly
Fifth
Third
Processing
Solutions
from
Fifth
Third;
(21)
loss
of
income
from
any
sale
or
potential
sale
of
businesses
that
could
have
an
adverse
effect
on
Fifth
Third’s
earnings
and
future
growth;
(22)
ability
to
secure
confidential
information
through
the
use
of
computer
systems
and
telecommunications networks; and (23) the impact of reputational
risk created by these developments on such matters as business
generation and retention, funding and liquidity.
You
should
refer
to
our
periodic
and
current
reports
filed
with
the
Securities
and
Exchange
Commission,
or
“SEC,”
for
further
information
on other factors, which could cause actual results to be significantly different
from those expressed or implied by these forward-looking statements.
|
 17
©
Fifth Third Bank | All Rights Reserved
Appendix |
 18
©
Fifth Third Bank | All Rights Reserved
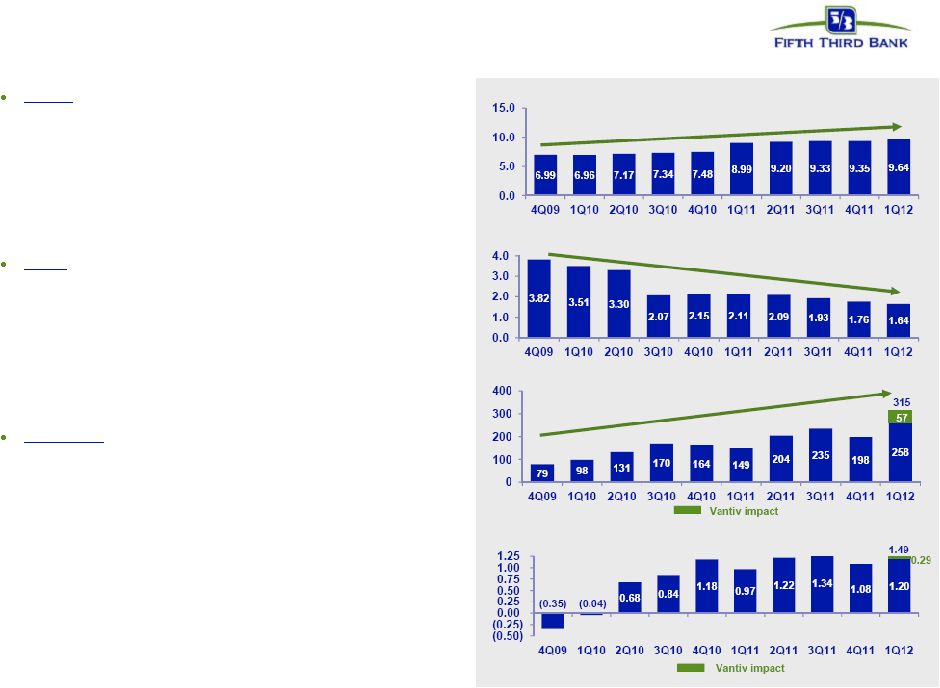
A foundation of continued robust results
Capital
–
exceeds required and targeted levels
—
Tier
1
common*
capital
up
~530bps
or
$5.2bn
from
4Q08
—
Capital base transformed through series of capital actions
–
~10.0% pro forma
1
Tier 1 common ratio* on a fully-phased in
Basel III-adjusted basis
—
Capital levels supplemented by strong reserve levels
–
Loan loss reserves 2.59% of loans and 157% of NPLs
Credit
–
ongoing steady improvement
—
Broad-based improvements in problem loans
–
~80% reduction in 90+ day delinquent loans since 3Q09
–
NCO ratio of 1.08%, lowest NCO level since 4Q07
–
315% PPNR / NCOs*; 258% excluding 1Q12 Vantiv
—
Balance sheet risk lowered through asset sales, resolutions
–
$1.6bn (54%) decline in NPLs since 4Q09
Profitability
–
strong relative and absolute results
—
PPNR* remained stable throughout cycle
—
8 consecutive profitable quarters
—
Return on assets 1.49%; 1.20% excluding 1Q12 Vantiv
—
Return on average tangible common equity
*
16%
* Non-GAAP measure; see Reg. G reconciliation on pages 28-29.
1
Current estimate (non-GAAP), subject to final rule-making and clarification
by U.S. banking regulators; currently assumes unrealized securities gains
are included in common equity for purposes of this calculation
2
Nonperforming
loans
and
leases
as
a
percent
of
portfolio
loans,
leases
and
other
assets,
including other real estate owned (does not include nonaccrual loans
held-for-sale) 3
3Q10 excludes $510mm net charge-offs attributable to credit actions
Tier 1 common ratio (%)*
NPL / Loans²
(%)
PPNR / Net charge-offs (%)³*
Return on assets (%)
57 |
 19
©
Fifth Third Bank | All Rights Reserved
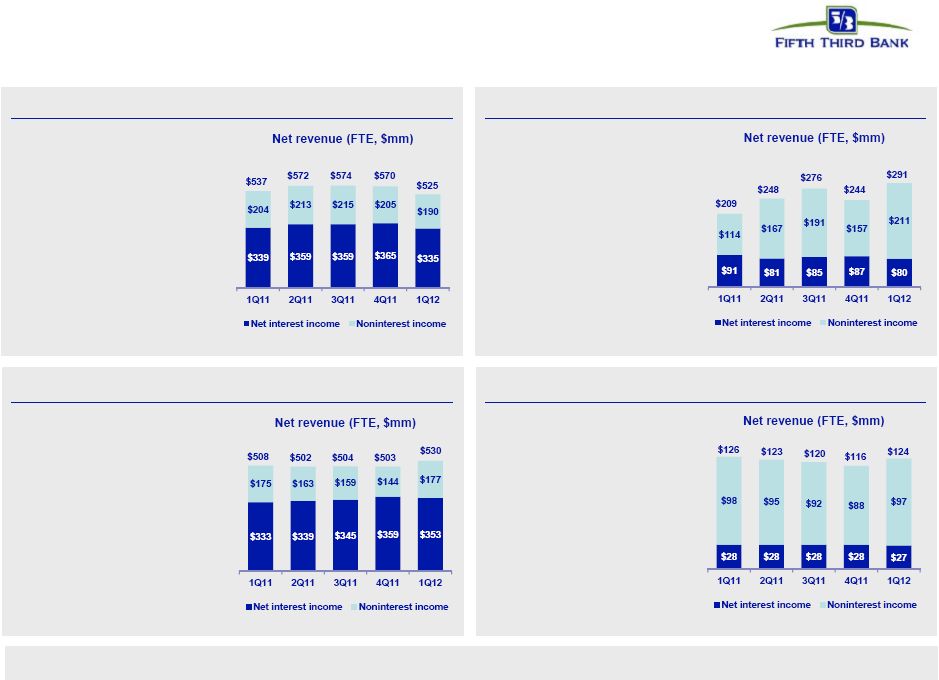
Diverse business mix
Branch Banking
Consumer Lending
Commercial Banking
Investment Advisors
•
Professionals committed to
understanding customers’
unique needs, providing
options and identifying the
right solution
•
Top 5 market share within
the non-captive prime auto
lending space
•
Top 13
mortgage
origination share
•
$1.0bn total FY11 revenue
•
Holistic approach to branch
banking combined with
mobile convenience to
improve the banking
experience and be the
trusted financial partner for
our customers
•
1,315 full-service banking
centers
•
2,404 full-service ATMs
•
$2.3bn total FY11 revenue
•
Comprehensive product and
service offering including
commercial lending,
treasury management, and
capital markets
•
Innovative products,
advancements in
technology, and exceptional
customer service
•
$2.0bn total FY11 revenue
•
Provide financial insight, a
wide array of leading-edge
products and services, and
a professional team to
help develop a strategy for
clients’
financial success
•
$486mm total FY11
revenue
•
$26bn assets under
management
•
$296bn assets under care
•
39% interest in Vantiv, LLC, formerly Fifth Third Processing Solutions, LLC
|
 20
©
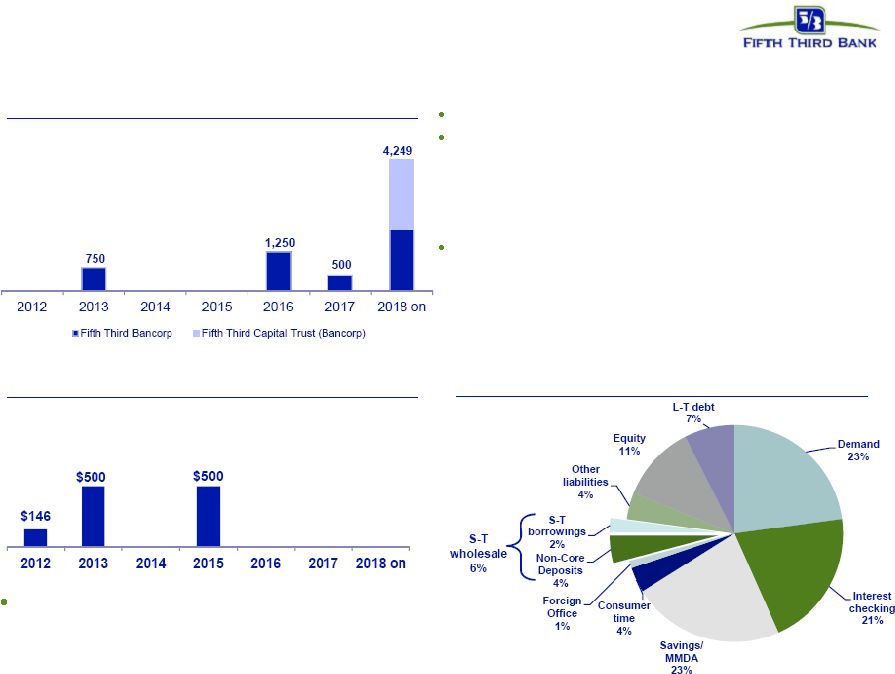
Fifth Third Bank | All Rights Reserved
Available and contingent borrowing capacity (1Q12):
–
FHLB ~$11B
–
Federal Reserve ~$24B
Holding Company cash at 3/31/12: $3.2B
Cash currently sufficient to satisfy all fixed obligations
in a stressed environment for more than 3 years
(debt maturities, common and preferred dividends,
interest and other expenses) without accessing capital
markets; relying on dividends from subsidiaries;
proceeds from asset sales
Expected cash obligations over the next 24 months
—
~$591mm common dividends
—
~$70mm Series G preferred dividends
—
~$889mm interest and other expenses
Holding company unsecured debt maturities ($mm)
Bank unsecured debt maturities ($mm –
excl. Brokered CDs)
Heavily core funded
Strong liquidity profile |
 21
©
Fifth Third Bank | All Rights Reserved
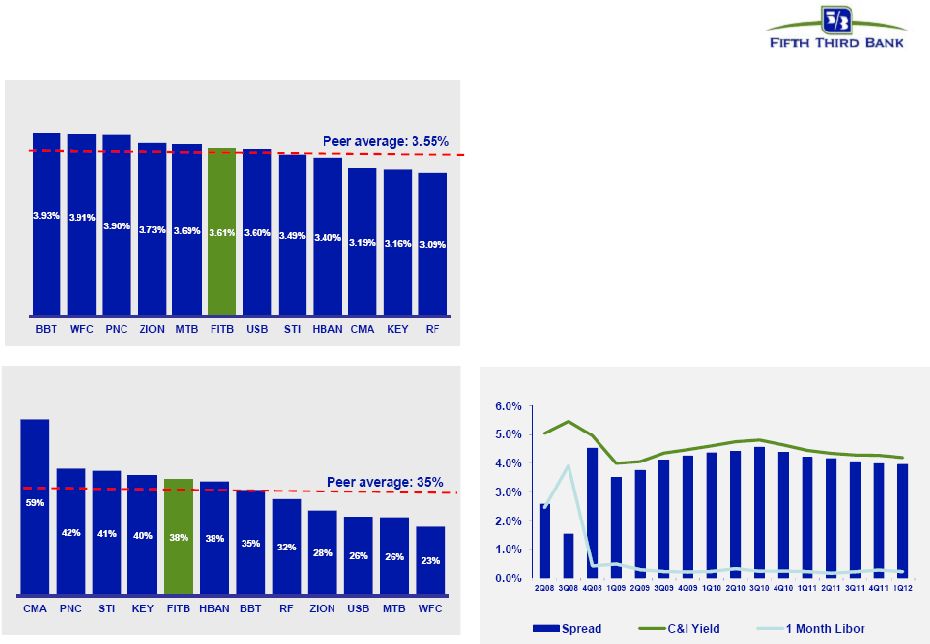
C&I/Total Loans*^
NIM
•
NIM supported by balance sheet and business
mix
–
Heavy emphasis on traditional C&I lending,
much of which is variable
•
Pricing discipline on commercial loans
–
Spreads have narrowed from post-crisis
levels but remain attractive
–
Loan origination rates have stabilized the
past several months
Relatively strong NIM results
due to balance sheet and business mix
Source: SNL Financial and Company Reports. Data as of 1Q12.
*ZION & BBT exclude government guaranteed loans; ZION presented as end of
period data. ^Presented on an average basis; Excluding held-for-sale
loans. C&I Spread to 1-month LIBOR |
 22
©
Fifth Third Bank | All Rights Reserved
Core funded balance sheet and pricing discipline
•
Strong, deposit-rich core funding mix supports
relatively low cost of funds
–
High percentage of funding base in low cost
transaction deposits and noninterest-
bearing DDA accounts
–
Low reliance on wholesale funding
SOURCE: SNL Financial and Company Reports. Data as of 1Q12
Transaction deposits defined as DDA, NOW and Savings/MMDA accounts; Cost of Funds
defined as interest incurred on interest-bearing liabilities as a percentage of average noninterest-bearing deposits and interest-
bearing liabilities; Transaction deposits/Total deposits presented on an average
basis; DDA/Total deposits presented on end-of-period basis. Transaction
Deposits / Total Deposits Cost of Funds
DDA/Total Deposits |
 23
©
Fifth Third Bank | All Rights Reserved
Continued improvement in credit trends
Peer average includes: BBT, CMA, HBAN, KEY, MTB, PNC, RF, STI, USB, WFC, and
ZION Source: SNL Financial and company filings. All ratios exclude loans
held-for-sale and covered assets for peers where appropriate. *
4Q08
NCOs
included
$800mm
in
NCOs
related
to
commercial
loans
moved
to
held-for-sale;
3Q10
NCOs
included
$510mm
in
NCOs
related
to
loans
sold
or
moved
to
held-for-sale
FITB credit metrics are in line with or better than peers
NPA ratio vs. peers
Net charge-off ratio vs. peers
Loans 90+ days delinquent % vs. peers
Loans 30-89 days delinquent % vs. peers |
 24
©
Fifth Third Bank | All Rights Reserved
NPL HFI Rollforward
Commercial
1Q11
2Q11
3Q11
4Q11
1Q12
Beginning NPL Amount
1,214
1,211
1,253
1,155
1,058
Transfers to nonperforming
329
340
217
189
168
Transfers to performing
(2)
(10)
(11)
-
(1)
Transfers to performing (restructured)
-
-
(1)
-
(2)
Transfers from held for sale
-
-
-
4
-
Transfers to held for sale
(16)
(15)
(58)
(3)
(3)
Loans sold from portfolio
(12)
(7)
(17)
(21)
(8)
Loan paydowns/payoffs
(108)
(91)
(77)
(149)
(94)
Transfer to other real estate owned
(37)
(39)
(20)
(14)
(36)
Charge-offs
(164)
(141)
(136)
(113)
(101)
Draws/other extensions of credit
7
5
5
10
7
Ending Commercial NPL
1,211
1,253
1,155
1,058
988
Consumer
1Q11
2Q11
3Q11
4Q11
1Q12
Beginning NPL Amount
466
434
386
383
380
Transfers to nonperforming
232
214
201
205
184
Transfers to performing
(35)
(34)
(33)
(28)
(36)
Transfers to performing (restructured)
(50)
(41)
(39)
(39)
(36)
Transfers to held for sale
-
-
-
-
-
Loans sold from portfolio
(1)
(21)
-
-
(4)
Loan paydowns/payoffs
(18)
(27)
(27)
(26)
(28)
Transfer to other real estate owned
(18)
(15)
(16)
(30)
(18)
Charge-offs
(144)
(126)
(91)
(87)
(80)
Draws/other extensions of credit
2
2
2
2
2
Ending Consumer NPL
434
386
383
380
364
Total NPL
1,645
1,639
1,538
1,438
1,352
Total new nonaccrual loans - HFI
561
554
418
394
352
NPL rollforward
Significant improvement in NPL inflows over past year
Note: Numbers may not sum due to rounding |
 25
©
Fifth Third Bank | All Rights Reserved
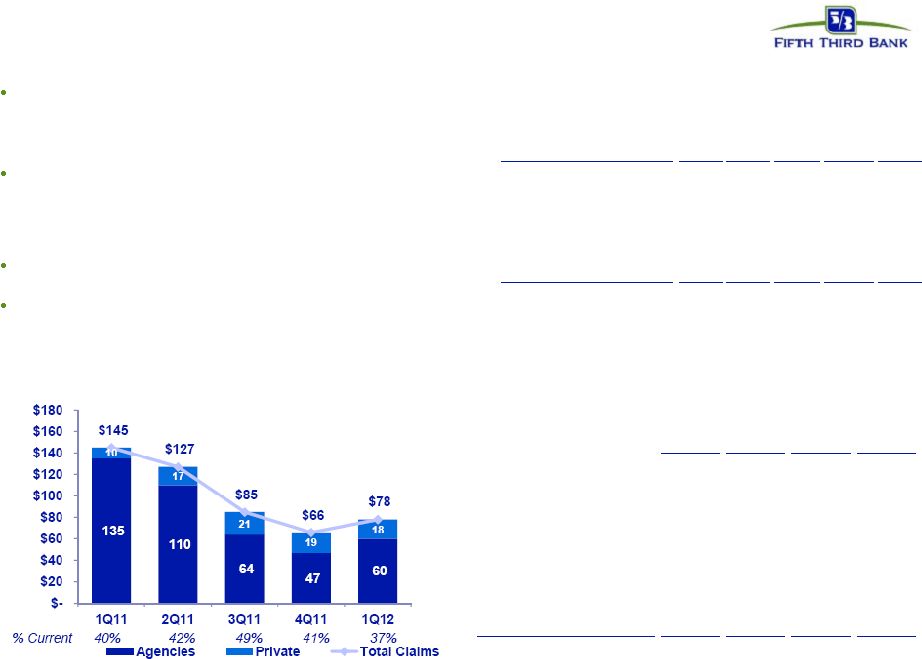
Mortgage repurchase overview
18% rise in 1Q12 outstanding claims balance from prior
quarter
—
Within recent norms of quarterly increases and
decreases
Virtually all sold loans and the majority of new claims relate
to agencies
—
98% of outstanding balance of loans sold
—
77% of current quarter outstanding claims
Majority of outstanding balances of the serviced for others
portfolio relates to origination activity in 2009 and later
Private claims and exposure relate to whole loan sales (no
outstanding first mortgage securitizations)
—
Preponderance of private sales prior to 2006
Repurchase Reserves* ($ in millions)
Outstanding Counterparty Claims ($ in millions)
Outstanding Balance of Sold Loans ($ in millions)
1Q11
2Q11
3Q11
4Q11
1Q12
Beginning balance
101
87
80
69
72
Net reserve additions
10
15
20
20
17
Repurchase losses
(23)
(23)
(31)
(17)
(17)
Ending balance
87
80
69
72
71
2005 and prior
GSE
GNMA
Private
Total
$6,680
$273
$492
$7,445
2006
1,550
55
250
1,855
2007
2,509
80
215
2,804
2008
2,406
633
0.3
3,039
2009
9,462
3,563
0.7
13,026
2010 and later
26,338
5,884
0.3
32,222
Total
$48,945
$10,488
$958
$60,391
* Includes reps and warranty reserve ($55mm) and reserve for loans sold with
recourse ($17mm) Note: Numbers may not sum due to rounding
|
 26
©
Fifth Third Bank | All Rights Reserved
Troubled debt restructurings overview
Successive improvement in vintage performance during
2008 and 2009 as volume of modification increased
Fifth Third’s mortgage portfolio TDRs have redefaulted
at a lower rate than GSE composites
Of $1.8B in consumer TDRs, $1.6B were on accrual
status and $201mm were nonaccruals
—
$1.2B of TDRs are current and have been on the
books 6 or more months; within that, ~$1B of
TDRs are current and have been on the books for
more than a year
As current TDRs season, their default propensity
declines significantly
—
We see much lower defaults on current loans after
a vintage approaches 12 months since
modification
TDR performance has improved in newer vintages
Redefault benchmarks
Source: Fifth Third and OCC/OTS data through 3Q11
Mortgage TDR 60+ redefault trend by vintage*
Mortgage TDR 60+ redefault rate: Fifth Third comparison
(January 1, 2008 through December 2011)*
$1.3B current consumer TDRs (%)
* Fifth Third data includes changes made to align with OCC/OTS methodology (i.e.
excludes government loans, closed loans and OREO from calculations) |
 27
©
Fifth Third Bank | All Rights Reserved
Total
Exposure
Funded
Exposure
Total
Exposure
Funded
Exposure
Total
Exposure
Funded
Exposure
Total
Exposure
Funded
Exposure
(amounts in $mm)
Peripheral Europe
-
-
11
-
168
124
179
124
Other Eurozone
-
-
44
34
1,275
742
1,319
776
Total Eurozone
-
-
55
34
1,443
866
1,498
900
Other Europe
-
-
23
18
820
496
843
514
Total Europe
-
-
77
52
2,263
1,362
2,340
1,414
Sovereigns
Financial Institutions
Non-Financial Entities
Total
European exposure
Total exposure includes funded and unfunded commitments, net of collateral; funded
exposure excludes unfunded exposure Peripheral Europe includes Greece,
Ireland, Italy, Portugal and Spain Eurozone includes countries participating
in the European common currency (Euro)
Other Europe includes European countries not part of the Euro (primarily the United
Kingdom and Switzerland) Data above includes exposure to U.S. subsidiaries of
Europe-domiciled companies Note: Numbers may not sum due to
rounding •
International exposure primarily related to trade finance and financing activities of
U.S. companies with foreign parent or overseas activities of U.S.
customers •
No European sovereign exposure (total international sovereign exposure $3mm)
•
Total exposure to European financial institutions <$80mm
•
Total exposure to five peripheral Europe countries <$200mm
•
$900mm in funded exposure to Eurozone-related companies (~1% of total loan
portfolio) |
 28
©
Fifth Third Bank | All Rights Reserved
Regulation G Non-GAAP reconciliation
Fifth Third Bancorp and Subsidiaries
Regulation G Non-GAAP Reconcilation
$ and shares in millions
(unaudited)
March
December
September
June
March
December
September
June
March
December
2012
2011
2011
2011
2011
2010
2010
2010
2010
2009
Income before income taxes (U.S. GAAP)
$603
$418
$530
$506
$377
417
$
303
$
242
$
(22)
$
(214)
$
Add:
Provision expense (U.S. GAAP)
91
55
87
113
168
166
457
325
590
776
Pre-provision net revenue (a)
694
473
617
619
545
583
760
567
568
562
Annualized PPNR (c)
2,791
1,877
2,448
2,483
2,210
2,313
3,015
2,274
2,304
2,230
Net income available to common shareholders (U.S. GAAP)
421
Add:
Intangible amortization, net of tax
3
Tangible net income available to common shareholders
424
Tangible net income available to common shareholders (annualized) (b)
1,705
Average Bancorp shareholders' equity (U.S. GAAP)
13,366
Less:
Average preferred stock
398
Average goodwill
2,417
Average intangible assets
38
Average tangible common equity (c)
10,513
Total Bancorp shareholders' equity (U.S. GAAP)
13,560
Less:
Preferred stock
(398)
Goodwill
(2,417)
Intangible assets
(36)
Tangible common equity, including unrealized gains / losses (d)
10,709
Less: Accumulated other comprehensive income / loss
(468)
Tangible common equity, excluding unrealized gains / losses (e)
10,241
Total assets (U.S. GAAP)
116,747
Less:
Goodwill
(2,417)
Intangible assets
(36)
Tangible assets, including unrealized gains / losses (f)
114,294
Less: Accumulated other comprehensive income / loss, before tax
(720)
Tangible assets, excluding unrealized gains / losses (g)
113,574
Common shares outstanding (h)
920
Net charge-offs
220
239
262
304
367
356
446
434
582
708
Annualized net charge-offs (i)
885
948
1,039
1,219
1,488
1,412
1,769
1,741
2,360
2,809
Average interest earning assets (j)
100,492
Ratios:
Return on average tangible common equity (b) / (c)
16.2%
Tangible common equity (excluding unrealized gains/losses) (e) / (g)
9.02%
Tangible common equity (including unrealized gains/losses) (d) / (f)
9.37%
Tangible book value per share (d) / (h)
11.64
Pre-provision net revenue / net charge-offs (a) / (i)
315%
198%
235%
204%
149%
164%
170%
131%
98%
79%
Pre-provision net revenue / avg. int. earning assets (a) / (j)
2.8%
For the Three Months Ended |
 29
©
Fifth Third Bank | All Rights Reserved
Regulation G Non-GAAP reconciliation
Fifth Third Bancorp and Subsidiaries
Regulation G Non-GAAP Reconcilation
$ and shares in millions
(unaudited)
March
December
September
June
March
December
September
June
March
December
2012
2011
2011
2011
2011
2010
2010
2010
2010
2009
Total Bancorp shareholders' equity (U.S. GAAP)
$13,560
$13,201
$13,029
$12,572
$12,163
$14,051
$13,884
$13,701
$13,408
$13,497
Goodwill and certain other intangibles
(2,518)
(2,514)
(2,514)
(2,536)
(2,546)
(2,546)
(2,525)
(2,537)
(2,556)
(2,565)
Unrealized gains
(468)
(470)
(542)
(396)
(263)
(314)
(432)
(440)
(288)
(240)
Qualifying trust preferred securities
2,248
2,248
2,273
2,312
2,763
2,763
2,763
2,763
2,763
2,763
Other
38
38
20
20
12
11
8
(25)
(30)
(27)
Tier I capital
12,860
12,503
12,266
11,972
12,129
13,965
13,698
13,462
13,297
13,428
Less:
Preferred stock
(398)
(398)
(398)
(398)
(398)
(3,654)
(3,642)
(3,631)
(3,620)
(3,609)
Qualifying trust preferred securities
(2,248)
(2,248)
(2,273)
(2,312)
(2,763)
(2,763)
(2,763)
(2,763)
(2,763)
(2,763)
Qualifying noncontrolling interest in consolidated subsidiaries
(50)
(50)
(30)
(30)
(30)
(30)
(30)
-
-
-
Tier I common equity (a)
10,164
9,807
9,565
9,232
8,938
7,518
7,263
7,068
6,914
7,056
Unrealized gains
468
Disallowed deferred tax assets
-
Disallowed MSRs
78
Other
11
Less:
10% of individual deferred tax assets, MSRs, investment in financial entitie
-
15% of aggregate deferred tax assets, MSRs, investment in financial entiti
-
Tier 1 common equity, Basel III proforma (b)
10,721
Risk-weighted assets, determined in accordance with
prescribed regulatory requirements (c)
105,412
104,945
102,562
100,320
99,392
100,561
98,904
98,604
99,281
100,933
Regulatory deductions not deducted from Tier 1 common equity,
risk-weighted at 250%
1,582
Risk-weighted assets, Basel III proforma (d)
106,994
Ratios:
Tier I common equity (a) / (c)
9.64%
9.35%
9.33%
9.20%
8.99%
7.48%
7.34%
7.17%
6.96%
6.99%
Tier I common equity, Basel III proforma (b) / (d)
10.02%
For the Three Months Ended
Add: |