Attached files
| file | filename |
|---|---|
| 8-K - ESSEX PROPERTY TRUST INC 8-K 5-8-2012 - ESSEX PROPERTY TRUST, INC. | form8k.htm |
EXHIBIT 99.1

Baird Growth Stock Conference
Via - Sunnyvale, CA
May 8-10, 2012

Table of Contents
Pages
Section I. Overview: Top Performing REIT 3-7
Section II. Financial Information 8-10
Section III. Investment Strategy: West Coast Focus 11-16
Section IV. Value Creation Platforms 17-22
2
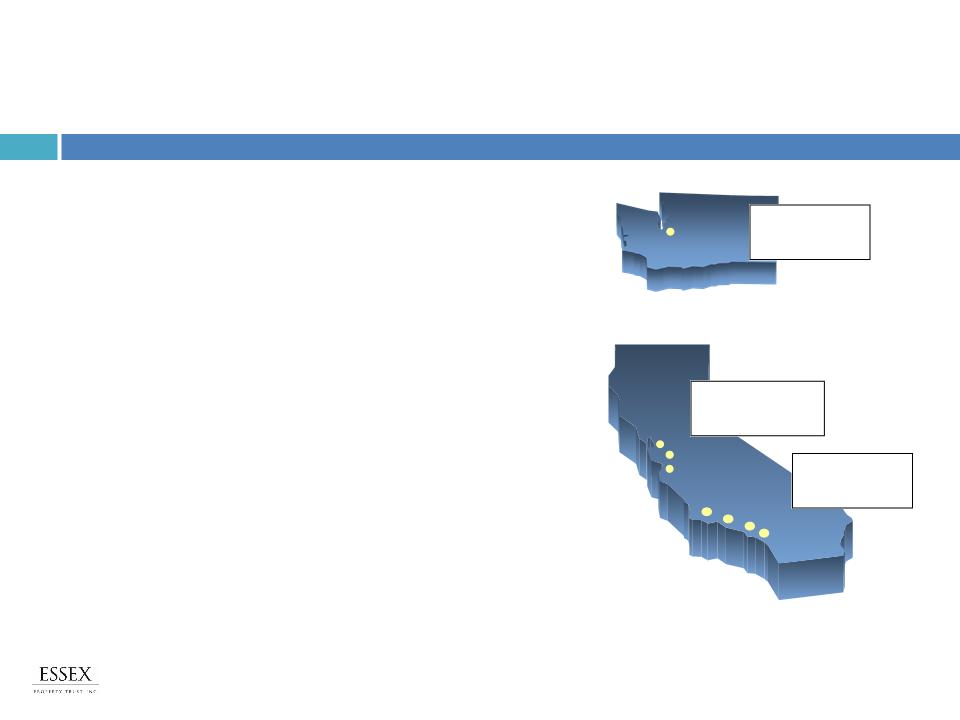
About Essex Property Trust
Multifamily Real Estate Investment Trust (REIT)
§ Supply-constrained coastal markets in California
and Washington
and Washington
§ Founded in 1971
§ IPO in 1994 at $19.50/sh (today stock is $157/sh)
§ 158 apartment communities with +32,600 units
§ $8.0 billion total market capitalization(1)
Strategy
§ Drive rent growth on high occupancy
§ Add value through redevelopment
§ Acquire and develop West Coast properties in areas
with high growth prospects
with high growth prospects
§ Maintain strong balance sheet and financial
flexibility
flexibility
Management Team
§ Top executives share an average tenure of over 20
years
years
Overview
Southern CA
50% of NOI
50% of NOI
Northern CA
33% of NOI
33% of NOI
Seattle
17% of NOI
(1) As of 4/30/12.
3
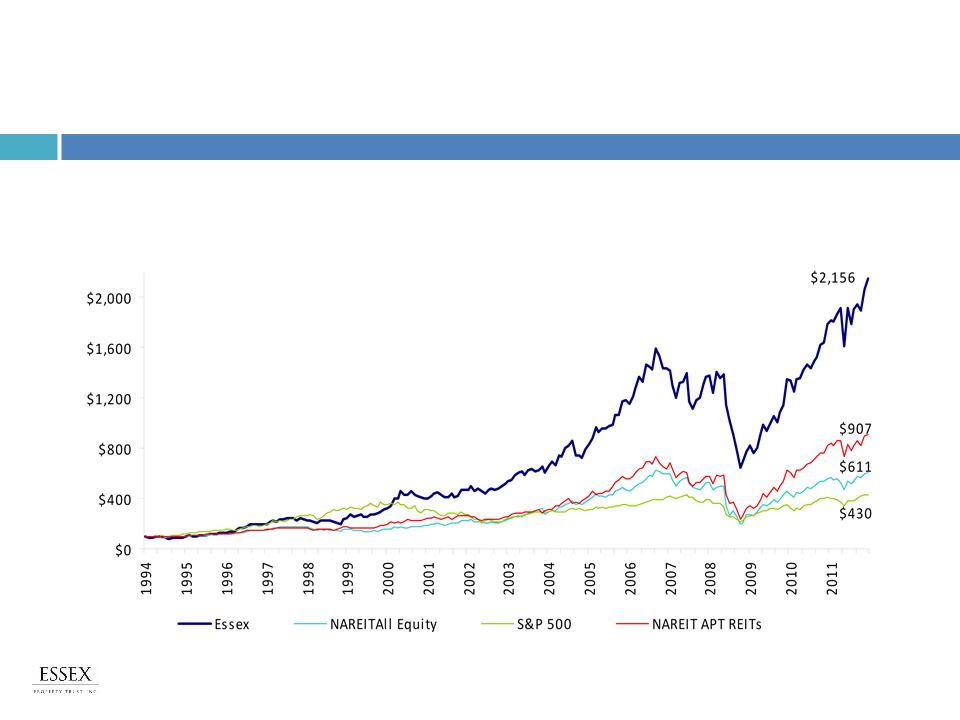
STRONG TRACK RECORD
Total Return Since IPO (2)
Performance Record
Essex Outperforms Peers
(1) As of 5/2/12.
(2) Source: NAREIT. Represents the value of a $100 investment and reinvestment of all dividends. As of April 30, 2012.
§ 19% compound annual total return since IPO
§ 27 % total return in 2011 - sector leading
§ 14% year-to-date total return (1)
4
Overview
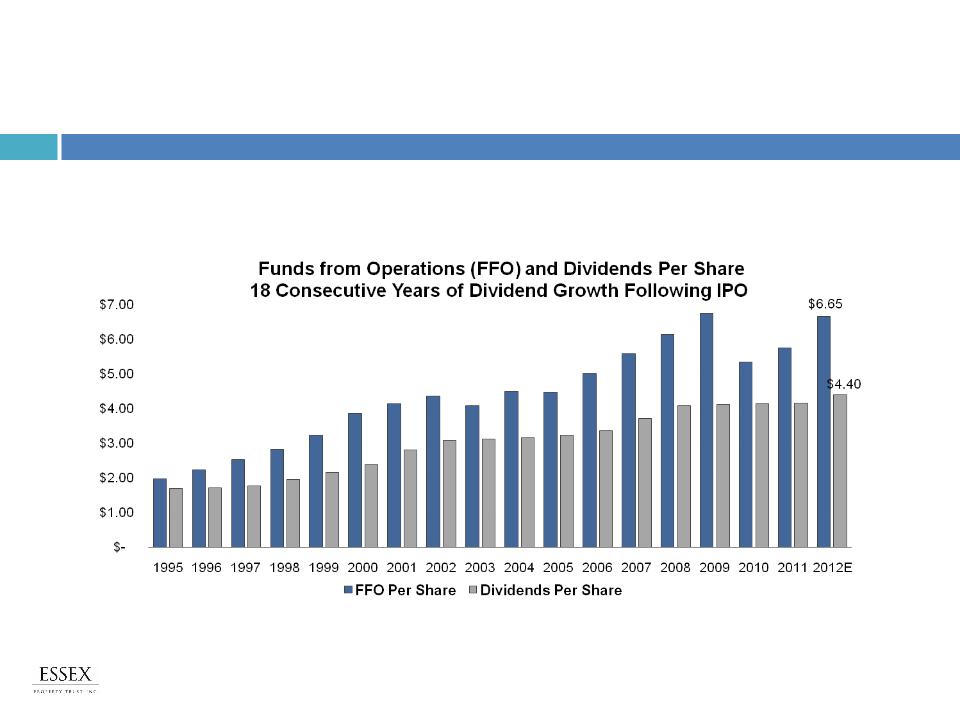
Long Track Record of Consistent Financial Performance
5
Overview
§ 7% Compound Annual Growth in FFO per share since IPO
§ 6% Compound Annual Dividend Growth per share since IPO
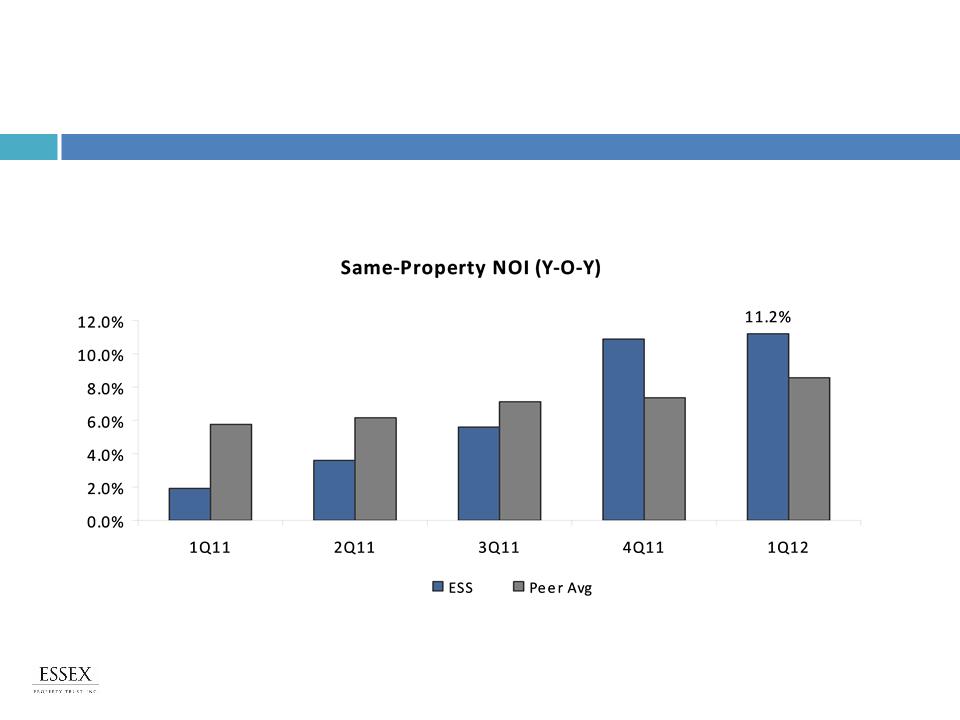
Rents and Net Operating Income (NOI) Accelerating
Source: Peer group includes 11 multifamily REITs for 2011 and 7 multifamily REITs that have reported 1Q12 results
6
§ Rents and NOI are accelerating in all our markets
Overview
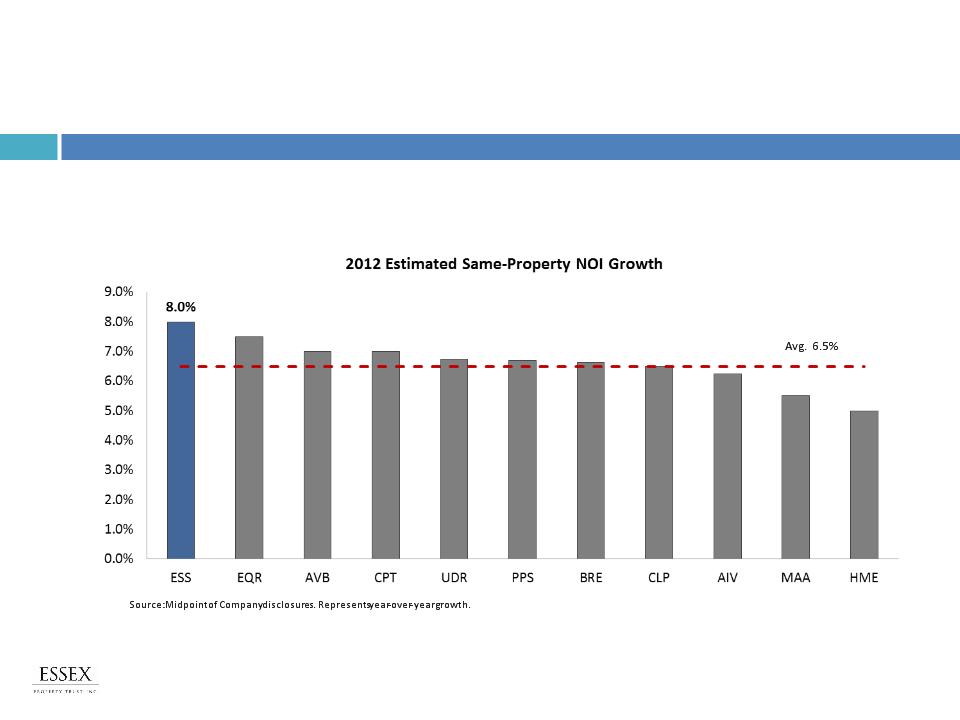
§ Northern California and Seattle continue to outperform
§ Southern California continues slow-steady recovery
Essex Projected to Lead NOI Growth in 2012
7
Overview

Financial Information
Reveal (formerly Millennium) - Woodland Hills, CA
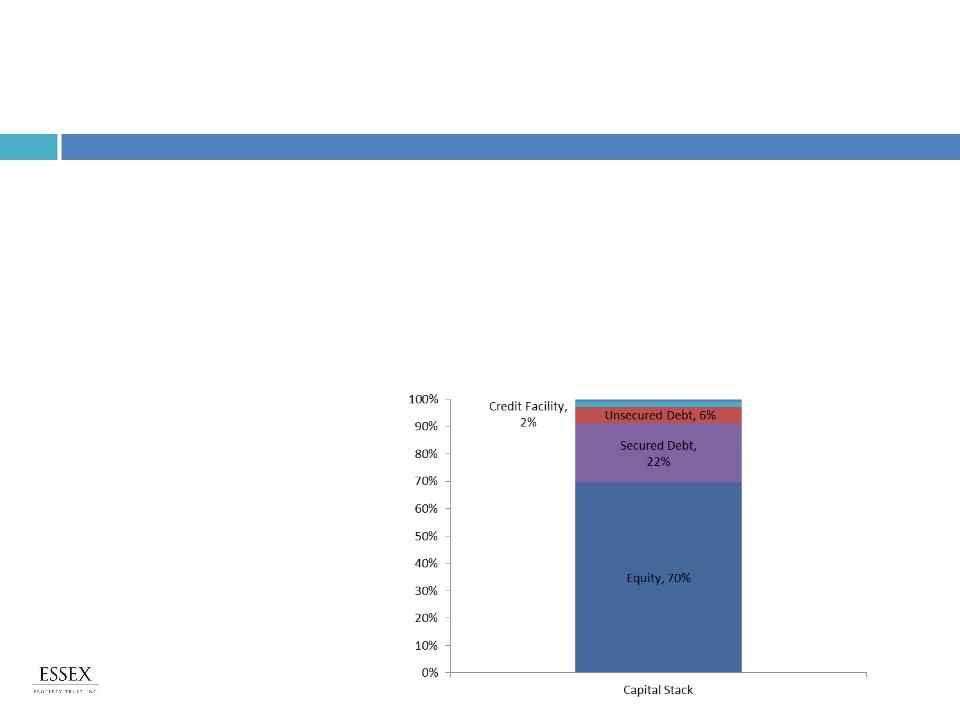
Conservatively Proportioned & Flexible Balance Sheet
§ Leverage: 30% on a debt to total market capitalization basis
§ One of the lowest within the multifamily peer group
§ Debt: Debt to adjusted EBITDA is expected to be approximately 7.0X by year-end 2012
§ Liquidity: Nearly $400 million in available liquidity from cash on hand, marketable securities, and unused
balance on our line of credit
balance on our line of credit
§ NOI: Unencumbered NOI was 44% at year-end 2011 versus 35% at year-end 2010
§ Expect to be at +50% by year end 2012.
§ Debt Maturity: Limited near term with less than 15% of debt coming due over the next 3 years
§ Investment Grade Ratings:
§ S&P: BBB
§ Moody’s: Baa2
§ Fitch: BBB
Source: Company filings as of 3/31/12
Preferred Stock, 1%
9
Financial Information

FFO Per Share Guidance
$6.52-$6.77
Same Property Revenue Growth (Midpoint)
6.0%
Same Property NOI Growth of the Consolidated portfolio (Midpoint) *
8.0%
Market Expectations
2012
2012
2012
Market
Market
Market
Job Growth
Rent Growth
Occupancy
Southern California
1.1%
5.7%
95.5%
Northern California
1.9%
8.6%
96.8%
Seattle Metro
2.0%
9.0%
95.5%
Weighted Average
1.4%
7.3%
96.0%
US Economic Assumptions
GDP Growth of 2.6%
Job Growth of 1.3%
Target Acquisitions
$300 million - $500 million
* Excludes joint ventures which have greater exposure to Seattle and Northern California
2012 Guidance
10
Financial Information

West Coast Fundamentals
II. Investment Strategy
Anavia - Anaheim, CA

Why Focus on the West Coast
Strong Job Growth
§ Tech jobs leading
Favorable Demographics
§ Strong Demand From Echo Boomers (age 20-34) and Baby Boomers
Rents Rebound from Recessionary Lows
§ Rents declined further and recovered later relative to other major U.S. metros
Headwinds to Homeownership
§ High cost of for-sale housing in coastal areas
§ Lending standards tightened
Low Housing Supply
§ Below 1% annual addition to residential stock
Investment Strategy
Via - Sunnyvale, CA
12
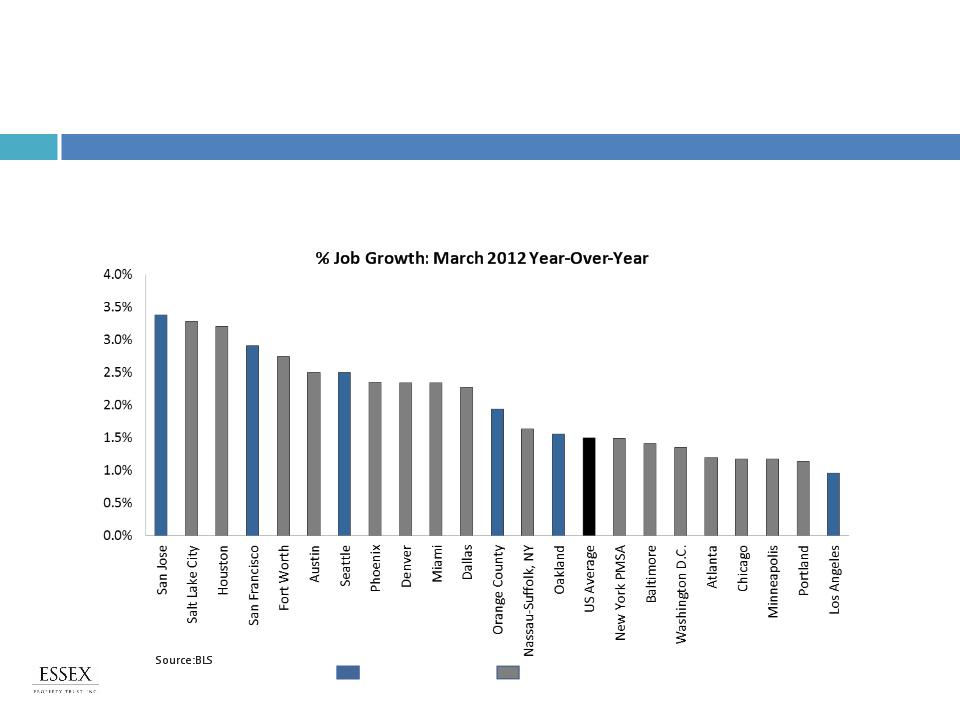
Job Growth: NOT Evenly Distributed
§ Job growth in many Essex markets outpaces U.S. average
§ LA job growth improving and expected to be 1% in 2012
Investment Strategy
13
Essex Markets
Other Markets
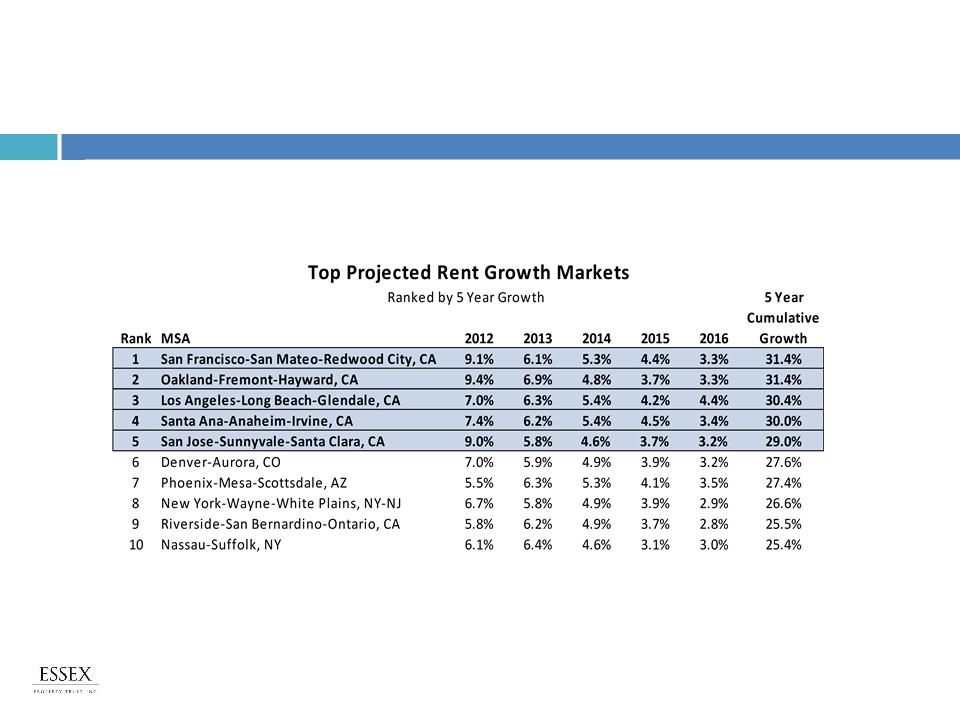
Strong Projected Rent Growth: Essex in Top 5 Markets
Source: Axiometrics
§ Approximately 65% of Essex’s NOI is located in the top five projected rent growth markets in
the nation over the next five years
the nation over the next five years
14
Investment Strategy
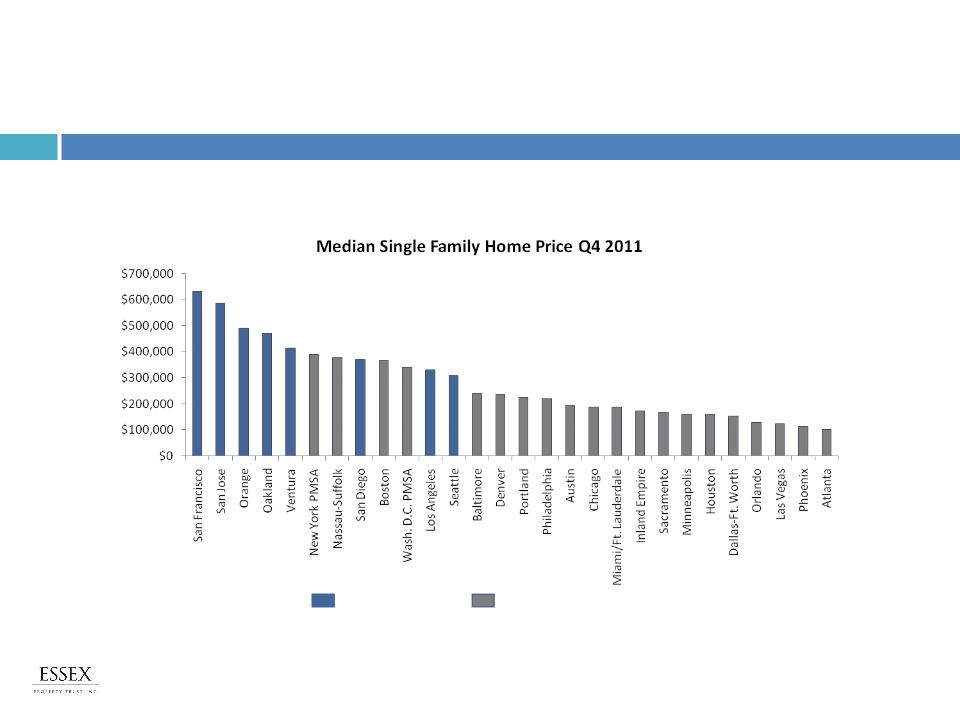
Single-Family Prices Restrict Homeownership
§ Despite the fall in home prices since 2008, prices remain high in Essex markets
Investment Strategy
|
Sources: National Association of Realtors, Dataquick, Essex
|
Essex Markets
Other Markets
15
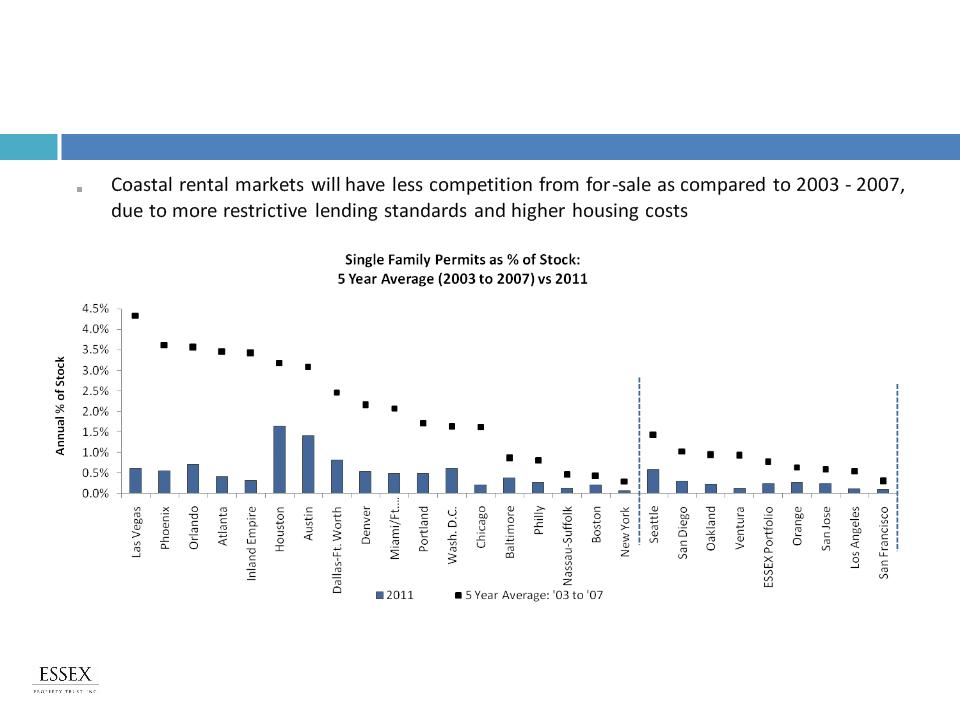
Supply: For-Sale Supply Risk Low
|
Source: U.S. Census
|
Essex Portfolio
16
16
Investment Strategy

Value Creation Platforms
Bella Villagio - San Jose, CA
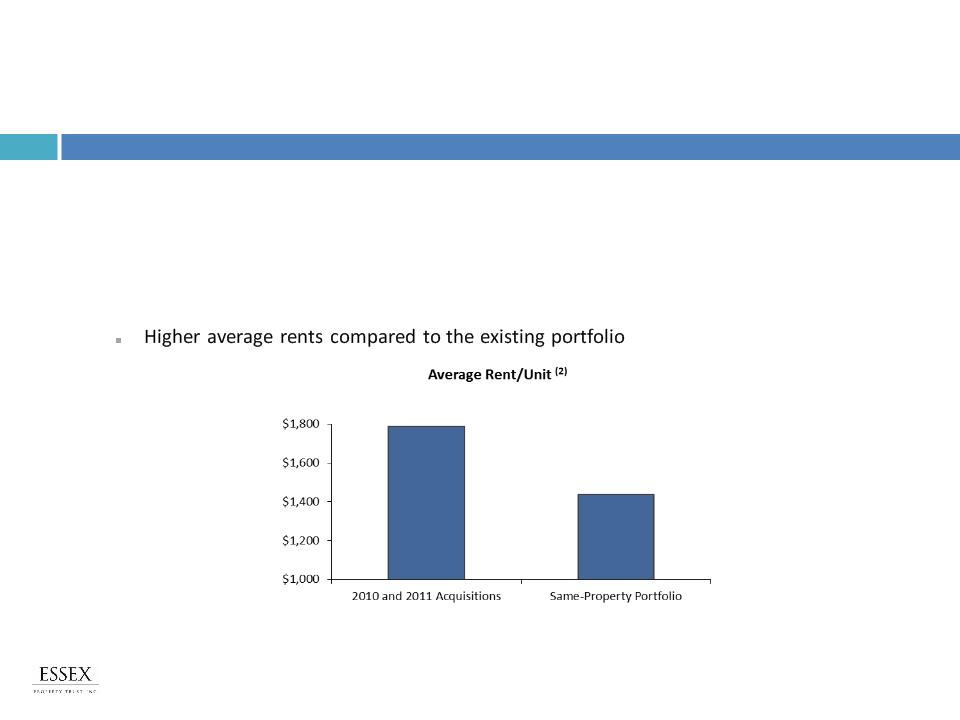
§ Acquired $1.2 billion of assets since the beginning of 2010, representing a 30%
expansion of gross asset value (1)
expansion of gross asset value (1)
§ Estimated 5.5% yield in 2012, expected to grow to 6.25% in 2013
§ Improved the Net Asset Value, Cash Flow and Growth Prospects of the Company
§ Upgraded the Quality of the Portfolio
Active Acquirer
Core Competencies: Acquisitions
(2) Represents the consolidated same property portfolio as of 12/31/11 and the consolidated acquisitions as of 12/31/11.
(1) Includes joint ventures at 100%.
18
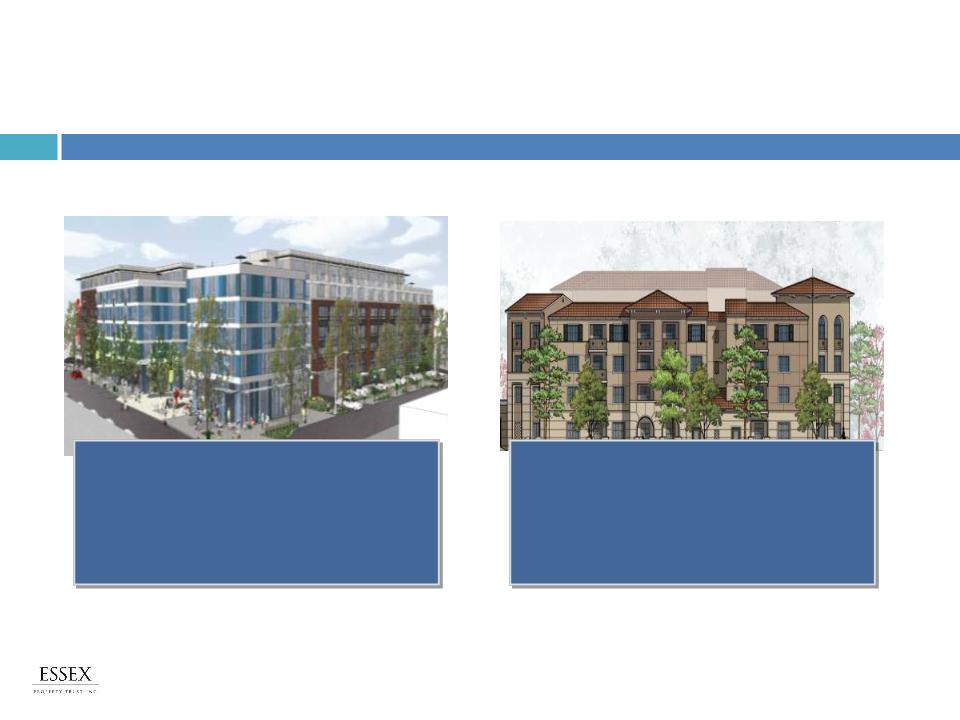
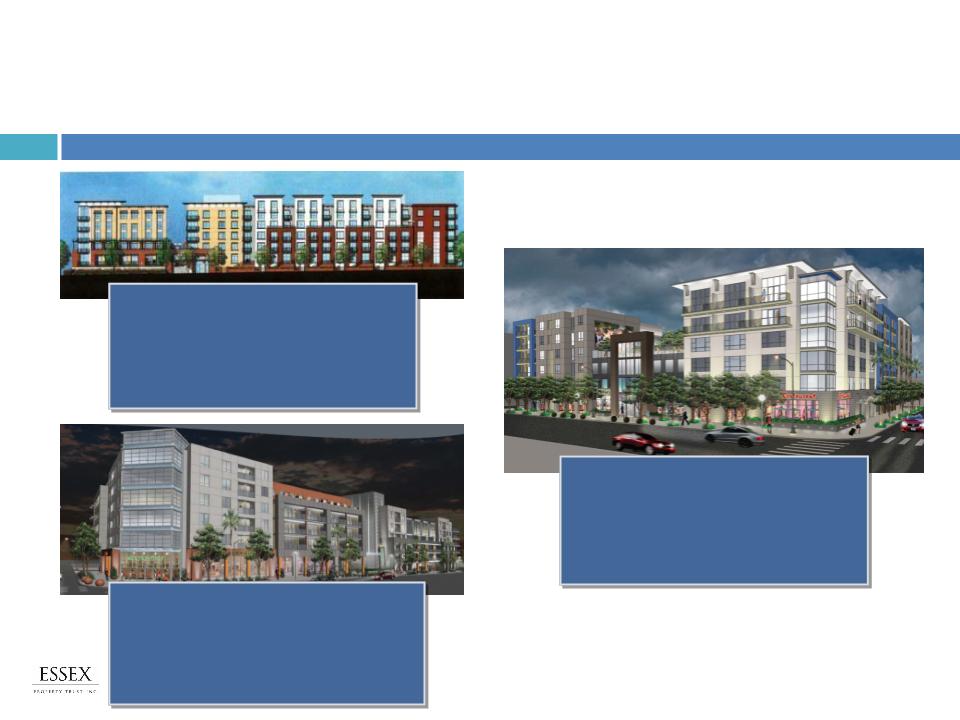
5 Developments Under Construction - $516 Million
Core Competencies: Development
Queen Anne
275 units
$79.1 million estimated total cost
November 2012 estimated completion date
50% owned by ESS
Epic
San Jose, CA
Phase I - 280 units
Phase II & III - 480 units
$192 million estimated total cost (Ph I and II)
May 2013 estimated completion date
55% owned by ESS
19
5 Developments Under Construction - $516 Million
Core Competencies: Development
West Dublin
Dublin, CA
309 Units
$94.5 million estimated total cost
June 2013 estimated completion date
55% owned by ESS
Santa Monica
West Hollywood, CA
184 Units
$75.4 million estimated total cost
July 2014 estimated completion date
50% owned by ESS
Fountain at La Brea
West Hollywood, CA
187 Units
$75.0 million estimated total cost
February 2014 estimated completion date
50% owned by ESS
20
West Dublin -
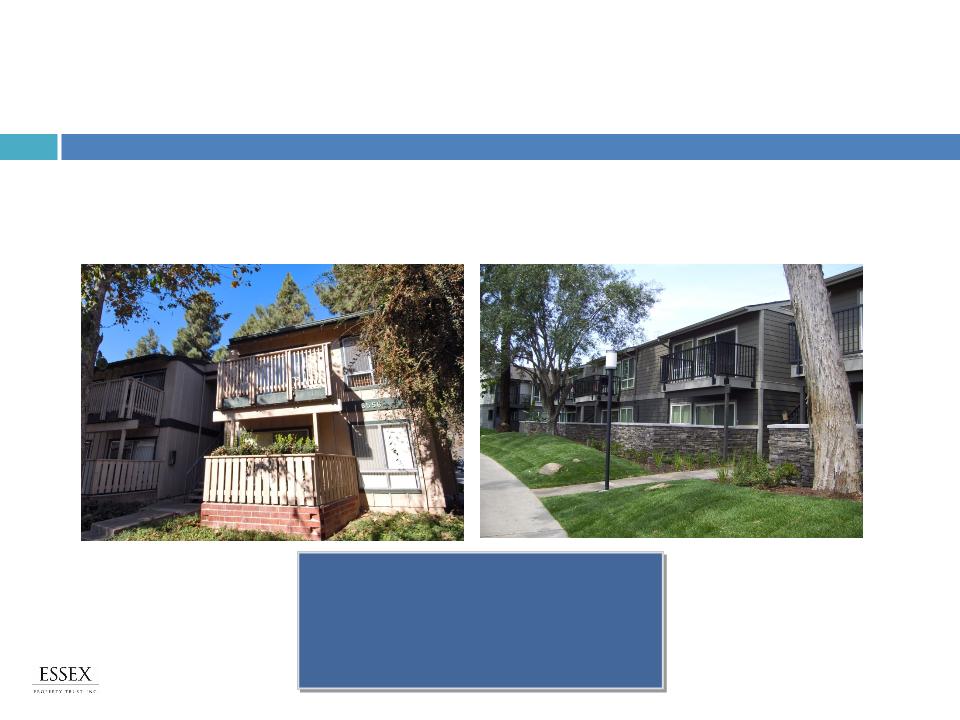
Redevelopment and Selective Repositioning
§ Capitalize on the strategy of owning Class B quality assets in A locations, which leads to
greater renovation potential
greater renovation potential
§ Focus on rent justified improvements to maximize NOI and value
Before
After
The Bluffs II
San Diego, CA
224 units
$9.7 million renovation cost
$43,300 cost per unit
9-10% estimated return
21
Core Competencies: Redevelopment
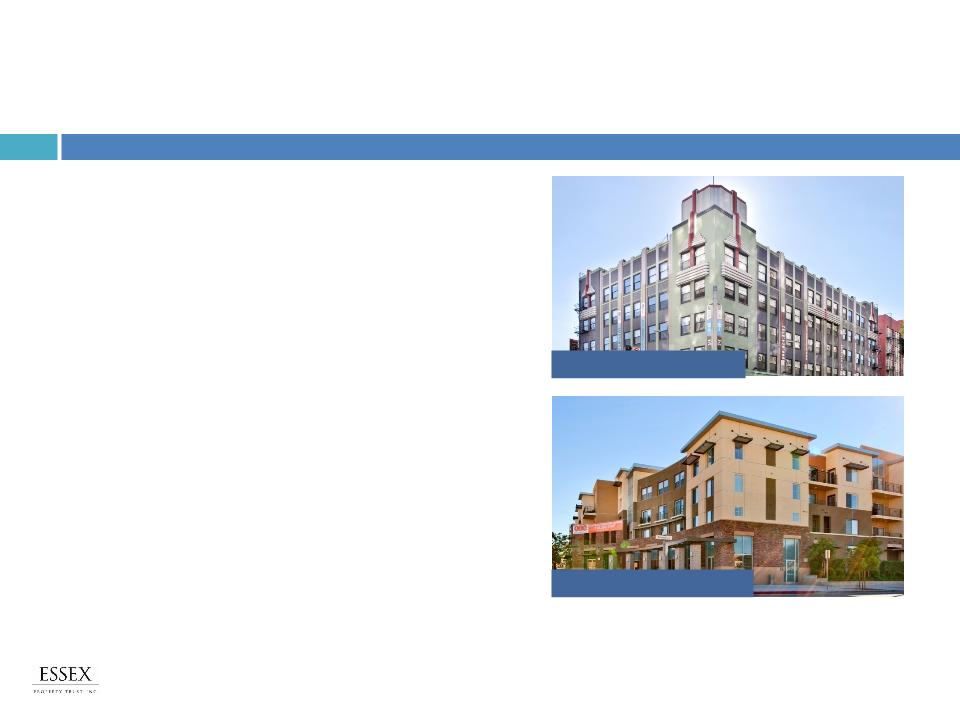
Key Strengths
§ Attractive market fundamentals in West
Coast markets
Coast markets
§ Strong growth prospects
§ FFO per diluted share projected to grow
18% for 2012
18% for 2012
§ Strong balance sheet with ample financial
flexibility to take advantage of attractive
opportunities as they arise
flexibility to take advantage of attractive
opportunities as they arise
§ Proven management team with superior
results
results
416 on Broadway - Glendale, CA
Santee Court - Los Angeles, CA
22

Safe Harbor Disclosure
Certain statements in this presentation, which are not historical facts, may be considered forward-looking
statements within the meaning of the federal securities laws. The forward looking statements, some of which
can be identified by terms and phrases such as “forecast”, “estimate”, “expect”, “anticipate”, “should”,
“could”, “may”, and similar expressions, reflect the current views of Essex Property Trust, Inc. (“Essex” or the
“Company”) and its affiliates with respect to future events and are subject to risks and uncertainties. Such
forward-looking statements involve the risk that actual results could be materially different from those
described in such forward-looking statements. Factors that could cause actual results to be materially different
are discussed under the caption “Risk Factors” in Item 1A of the Company’s Report on Form 10-K for the year
ended December 31, 2011. All forward-looking statements and reasons why results may differ included in this
presentation are made of the date hereof, and we assume no obligation to update any such forward-looking
statements or reasons why actual results may differ.
23

For additional information, please contact the Company’s
Investor Relations department at (650) 849-1600.
Investor Relations department at (650) 849-1600.
Fourth & U - Berkeley, CA
416 on Broadway - Glendale, CA
Joule - Seattle, WA
Via - Sunnyvale, CA
Axis 2300 - Irvine, CA
Arbors at Park Rose - Oxnard, CA