Attached files
| file | filename |
|---|---|
| 8-K - 8-K - Thompson Creek Metals Co Inc. | a12-11095_98k.htm |
Exhibit 99.1
|
|
First Quarter 2012 Earnings Call May 7, 2012 |
|
|
Cautionary Statements This document contains “forward-looking statements” within the meaning of the United States Private Securities Litigation Reform Act of 1995, Section 27A of the Securities Act of 1933, as amended, Section 21E of the Securities Act of 1934, as amended and applicable Canadian securities legislation. These forward-looking statements generally are identified by the words "believe," "project," "expect," "anticipate," "estimate," "intend," "strategy," "future," "opportunity," "plan," "may," "should," "will," "would," "will be," "will continue," "will likely result," and similar expressions. Our forward looking statements include, without limitation: estimates of future capital expenditures and other cash needs for operations, including with respect to the development of Mt. Milligan, and expectations as to the funding thereof; statements as to the projected development of Mt. Milligan and other projects, including expected production commencement dates; statements as to the expected mill capacity at Endako and ; statements regarding future earnings, and the sensitivity of earnings to molybdenum prices; estimates of future production costs and other expenses for specific operations and on a consolidated basis; estimates of future mineral production and sales for specific operations and on a consolidated basis; estimates of mineral reserves and resources, including estimated mine life and annual production; statements with respect to the future financial or operating performance of Thompson Creek or its subsidiaries and its projects; and statements with respect to the costs and timing of future exploration projects and the development of new deposits including the Berg property and the Davidson property. Where we express an expectation or belief as to future events or results, such expectation or belief is expressed in good faith and believed to have a reasonable basis. However, our forward-looking statements are based on current expectations and assumptions that are subject to risks and uncertainties which may cause actual results to differ materially from future results expressed, projected or implied by those forward-looking statements. Important factors that could cause actual results and events to differ from those described in such forward-looking statements can be found in the section entitled ‘‘Risk Factors’’ in Thompson Creek’s 2011 Form 10-K, Quarterly Report on Form 10-Q for the three months ended March 31, 2012,, and other documents filed on EDGAR at www.sec.gov and on SEDAR at www.sedar.com. Although we have attempted to identify those factors that could cause actual results or events to differ from those described in such forward-looking statements, there may be other factors that cause results or events to differ from those anticipated, estimated or intended. Many of these factors are beyond our ability to control or predict. Given these uncertainties, the reader is cautioned not to place undue reliance on our forward-looking statements. We undertake no obligation to update or revise publicly any forward-looking statements, whether as a result of new information, future events, or otherwise. Cautionary Note to United States Investors Concerning Estimates of Measured, Indicated and Inferred Mineral Resources: This presentation uses the terms “Measured”, “Indicated” and “Inferred” Resources. United States investors are advised that while such terms are recognized and required by Canadian regulations, the United States Securities and Exchange Commission does not recognize them. “Inferred Mineral Resources” have a great amount of uncertainty as to their existence, and as to their economic and legal feasibility. It cannot be assumed that all or any part of an Inferred Mineral Resource will ever be upgraded to a higher category. Under Canadian rules, estimates of Inferred Mineral Resources may not form the basis of feasibility or other economic studies. United States investors are cautioned not to assume that all or any part of Measured or Indicated Mineral Resources will ever be converted into Mineral Reserves. United States investors are also cautioned not to assume that all or any part of an Inferred Mineral Resource exists, or is economically or legally mineable. All currency figures in US$, except where noted.2 |
|
|
Company All Incidence Recordable Rate (AIRR) 1 2007 – 2012 YTD (March) 1 Includes lost time and reportable incidents. 3 |
|
|
First Quarter 2012 Financials 1 Non-GAAP measure. Excludes $0.1 million non-cash loss related to warrants. 2 Non-GAPP measure. Excludes $66.0 million non-cash gain related to warrants. 3 Non-GAAP measure. See Form 10-Q for the year ended March 31, 2012 additional information. 4 Includes capital leases. 4 Revenue $113.6 $206.7 Operating (Loss) Income $(16.5) $75.9 Operating Cash Flow $3.1 $76.6 Net Income $1.1 $128.9 Adjusted Net Income $1.21 $62.92 Net Income per share Basic $0.01/sh $0.78/sh Diluted $0.01/sh $0.73/sh Adjusted Net Income per share Basic $0.01/sh1 $0.38/sh2 Diluted $0.01/sh1 $0.36/sh2 Molybdenum Production 4.4 M lbs 10.3 M lbs Production Cash Costs3 $ 12.95/lb $5.37/lb Average Realized Price $ 14.74/lb $17.37/lb Cash + S-T Investments (03/31/12) $162.7 Total debt (03/31/12)4 $373.2 1 Non-GAAP measure. Excludes $0.1 million non-cash loss related to warrants. 2 Non-GAPP measure. Excludes $66.0 million non-cash gain related to warrants. 3 Non-GAAP measure. See Form 10-Q for the year ended March 31, 2012 additional information. 4 Includes capital leases. |
|
|
1 Molybdenum oxide production costs (US$/lb Mo) include all stripping costs and excludes Endako start-up and commissioning costs. Guidance numbers for Endako assume an exchange rate of US$1 = C$1 for Endako costs. Molybdenum Production & Cash Costs 5 Thompson Creek Mine 25.1 21.4 3.4 16 – 17 19 – 22 Endako Mine (75% share) 7.5 7.0 1.0 10 – 11 11 – 12 Total Production 32.6 28.3 4.4 26 – 28 30 – 34 Total Cash Cost $6.07 $7.94 $12.95 $7.75–$9.00 $6.75–$7.75 Components: Thompson Creek Mine $5.20 $6.66 $10.34 $7.50–$8.50 $6.00–$7.00 Endako Mine $8.89 $11.86 $21.87 $8.25–$9.25 $8.00–$9.00 1 Molybdenum oxide production costs (US$/lb Mo) include all stripping costs and excludes Endako start-up and commissioning costs. Guidance numbers for Endako assume an exchange rate of US$1 = C$1 for Endako costs. |
|
|
1 Includes Q1 expenditures. 2 Includes amounts for equipment purchased under capital leases, as well as commissioning and first-fill parts to start the mill. Cash Capital Expenditures 6 Full year Operations Capex $65 $7 $35 – $40 $15 - $20 Endako Expansion Capex (TC Share) $221 $40 $83 $0 Mt. Milligan2 $409 $141 $750 – $825 $190 - $245 Total $695 $188 $868 – $948 $205 - $265 1 Includes Q1 expenditures. 2 Includes amounts for equipment purchased under capital leases, as well as commissioning and first-fill parts to start the mill. |
|
|
Project Expenditures and Cash Resources 1 Includes working capital of approximately $30 million (first fills, spare parts, & commissioning parts) and a contingency of $137 million at the high estimate ($7 million of contingency at the low estimate). Assumes an independent third party lease arrangement for the permanent camp. 2 Assumes CAD/USD exchange rate of C$1.000 : US$1.000. 3 Minimum liquidity after Endako completion date is currently defined as (i) the amount of cash on hand and (ii) availability under the R/C and (iii) expected payment from Royal Gold that will be received in the next quarter. Note: Capex estimates are on a cash basis and exclude accrual amounts. 7 Endako -TC share (C$) C$457 C$43 C$43 Mt. Milligan (C$)1 C$593 C$799 C$929 Total Project Capex (C$) C$1,050 C$842 C$972 Total Project Capex (US$)2 $842 $972 Maintenance Capex (US$) $43 $53 Total Remaining Capital Expenditures (US$) $885 $1,025 Cash on hand $163 Availability under R/C Facility 276 Less: min. liquidity requirement under R/C facility3 (75) Equipment financing 124 Remaining proceeds from Royal Gold 172 Total in-place funding $660 Funding shortfall ($225) ($365) 1 Includes working capital of approximately $30 million (first fills, spare parts, & commissioning parts) and a contingency of $137 million at the high estimate ($7 million of contingency at the low estimate). Assumes an independent third party lease arrangement for the permanent camp. 2 Assumes CAD/USD exchange rate of C$1.000 : US$1.000. 3 Minimum liquidity after Endako completion date is currently defined as (i) the amount of cash on hand and (ii) availability under the R/C and (iii) expected payment from Royal Gold that will be received in the next quarter. Note: Capex estimates are on a cash basis and exclude accrual amounts. |
|
|
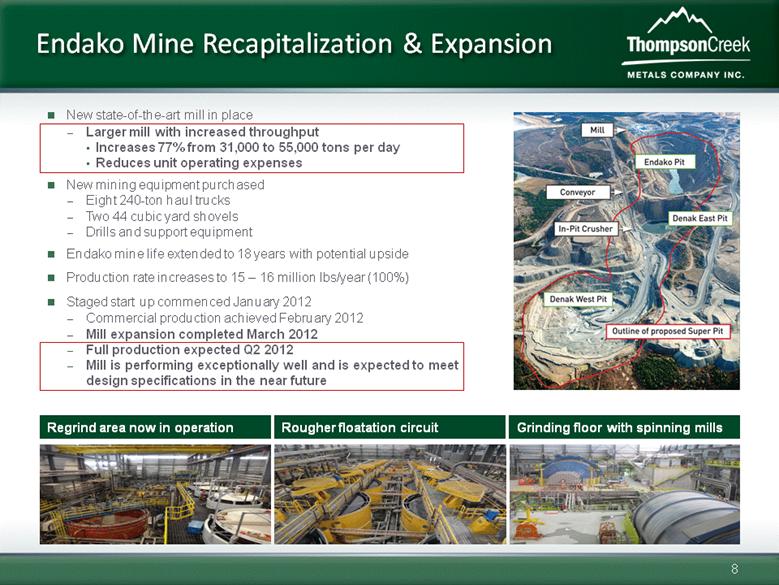
New state-of-the-art mill in place Larger mill with increased throughput Increases 77% from 31,000 to 55,000 tons per day Reduces unit operating expenses New mining equipment purchased Eight 240-ton haul trucks Two 44 cubic yard shovels Drills and support equipment Endako mine life extended to 18 years with potential upside Production rate increases to 15 – 16 million lbs/year (100%) Staged start up commenced January 2012 Commercial production achieved February 2012 Mill expansion completed March 2012 Full production expected Q2 2012 Mill is performing exceptionally well and is expected to meet design specifications in the near future Endako Mine Recapitalization & Expansion Regrind area now in operation Rougher floatation circuit Grinding floor with spinning mills 8 |
|
|
Mt. Milligan – A Cornerstone Asset Mt. Milligan overview1 Terrane assets Heritage Thompson Creek assets Diversification into copper and gold Substantial production potential through conventional mining methods Robust economics given low cash cost profile of deposit Located in British Columbia, a mining friendly jurisdiction Recently completed Endako mill expansion allows us to leverage Endako commissioning and project team experience 1 The Mt. Milligan mineral reserve estimates are based on a 43-101 technical report prepared for Thompson Creek’s wholly owned subsidiary, Terrane, entitled “Technical Report – Feasibility Update Mt. Milligan Property – Northern BC” and dated October 13, 2009. 9 Cu Annual Production Estimate - LOM 81 million lbs Cu (higher years 1-6) Au Annual Production Estimate - LOM 194,000 oz Au (higher years 1-6) Estimated Cash Costs, Net By-Products <$0.50/lb Cu (at $690/oz Au) Proven and Probable Mineral Reserves 2.1 billion lbs Cu - average grade of 0.20% 6.0 million oz Au - average grade of 0.011 oz/t Measured + Indicated Mineral Resources 716 million lbs Cu - average grade of 0.15% 1.5 million oz Au - average grade of 0.006 oz/t 22-year mine life (Based on Proven and Probably Reserves) |
|
|
...with Robust Economics Reserve calculation utilized conservative metals pricing of $1.60/lb Cu and $690/oz Au Current resource is open at depth and possibly extends laterally Multiple drill ready exploration targets within 3km Similar geophysical and geochemical signature to the known deposits We ultimately expect that Mt. Milligan’s production and revenues will approach the scale of our current operations 1 Estimated cash costs include operating costs, refining/smelting costs, and transportation. Cash operating costs and estimated annual production in concentrate are based upon the 2008 Terrane Metals Corp. Feasibility Study. Assumes average annual production of 89 million lbs of copper in concentrate (85.4 million lbs of payable copper) and 262,000 oz of gold in concentrate (256,760 oz of payable gold) for years 1-6 of full production. Exchange rate is assumed at parity (C$1.00 = US$ 1.00). 2 Bloomberg pricing as of 4/30/12: Cu - $3.83/lb; Au - 60% @ $1,665/oz and 40% @ $435/oz (per Amended and Restated Gold Stream Agreement with Royal Gold). 2 Significant annual cash flow potential (US$ millions) 1 Upside Potential 10 |
|
|
Mt. Milligan Project Development Update Milestones achieved through March 2012 Site access road completed in 2010 Winter works on dam completed in early 2011 Major site earthworks completed July 2011 Initial dam construction completed September 2011 Construction camp completed to house 1,071 workers in early 2012 Critical concrete foundation pours completed February 2012 SAG & Ball Mill pedestals completed March 2012 Progress through March 2012 All but one major contract has been awarded Major concrete pours are 60% completed Steel erection for concentrator has commenced (80% of steel on site) Tailings facility construction on schedule EPCM progress to date Engineering – 95% Procurement – 95% Construction – 44% Overall Progress – 62% Mt. Milligan remains on schedule, with commissioning and start-up scheduled for Q3 2013 and full gold and copper production expected in Q4 2013. Shovel being constructed 11 |

|
|
~70% of project capex spent or contractually committed Contingency represents 46% of non-fixed cost remaining Illustrative bridge to high end of Mt. Milligan capital budget (US$ millions, except as indicated) A Clear Path to Project Completion 12 ~$1.5bn |

|
|
Mt. Milligan Development Update (cont’d) Primary crusher Grinding bay west site Tailing storage facility trench development View of concentrator building 13 |
|
|
Mt. Milligan Project De-risking Actions All major permits needed for construction have been obtained Enhanced internal & external staffing to control, audit and manage project spending Project control, contract management, procurement, accounting, audit team 95% of engineering is complete Early procurement of critical items All major mining and milling equipment is procured and is either on site or en route 80% of steel on site Scope, Engineering & Procurement Construction of Critical Areas Tailing Storage Facility (TSF) was fully designed in June 2010 with all critical areas of the dam base completed Plant Development Power line to site complete, tested & tied into BC Hydro 60% of concrete is complete and on schedule SAG grinding area is under cover and ready for installation of mill Permitting & Controls Schedule Schedule issued February 2011 with no changes Mine operations supports construction of TSF in Q2/Q3 2012, allowing for one year of activity to achieve operational efficiency and effectiveness Labor/Productivity Mechanical/Electrical contractors – lump sum – contractors assume risk for cost overruns EPCM – to date have maintained critical personnel with completion payments as incentive TCM has changed its work schedules, enhanced completion bonuses and planned permanent camp to attract operations personnel 14 |

|
|
Mt. Milligan Future Critical Milestones 15 Q112 Q212 Q312 Q412 Q113 Q213 Q313 Q413 Process building grinding area enclosed (3 sides) Mechanical mill installation begins 230kV permanent power energized and available onsite Delivery and assembly of major mining equipment Mining equipment fleet ready Pre-stripping initiated Pebble crushing building - foundation complete Truck shop complete SAG & ball mill installation complete Process plant mechanical/pre-commissioning complete Commissioning started First feed Full commercial production |
|
|
Market Trends |
|
|
Moly Supply/Demand Fundamentals Remain Favorable Climax mine is the only new primary mine likely to start up in the near term as rising capital costs and permitting hinder other primary mines (expected to produce in 2012) New by-product sources delayed until 2014 and beyond with Sierra Gorda likely starting up in 2015 Chinese net exports recently playing less of a role in moly trade Supply considerations Demand drivers China/India/Brazil’s industrialization drive growth Increased intensity of use: oil and gas, oil refining, autos, aerospace, desalination, and power generation Estimated 4-6% annual demand growth rate outpacing growth of supply sources through 2020 Molybdenum demand Source: CRU and other industry sources (CRU data only for 2005 to 2010); Company estimates Drummed molybdic oxide (US$ / lb) Source: Bloomberg, as reported by Metal Bulletin. As of May 4, 2012 17 |
|
|
18 US apparent steel consumption (Mt) North America stainless steel inventories (000 tons)1 Source: MSCI. As of April 17, 2012 1 North America includes U.S. and Canada 2011-2015E CAGR: 5% Source: Metal Strategies. As of May 2, 2012 U.S. weekly active rig count U.S. steel production capacity utilization Source: Bloomberg, as reported by American Iron & Steel Institute. As of April 30, 2012 Source: Baker Hughes. As of May 4, 2012 Key End-Markets Are Strengthening 81% 200 400 600 800 1,000 2005 2006 2007 2009 2010 2012 |
|
|
Copper Gold 19 Copper prices have continued to be strong Supply growth expected to be constrained New supply predominately located in higher risk jurisdictions Declining copper head grades reducing potential supply Demand growth supported by industrialization in emerging markets, in particular in China and India as well as recovery in Europe and United States Gold and other precious metals continue to enjoy strong pricing environments Demand/supply fundamentals remain positive driven by macro-economic trends and increased uncertainty Central banks are net buyers of gold to diversify their reserve holdings Investor diversification away from reserve currencies (USD, EUR, GBP and JPY) Physical gold ETF and Asian demand continue to support gold prices 3-Month LME copper ($/Ibs) COMEX spot gold ($/oz) Source: Bloomberg, as reported by LME. As of May 4, 2012 Source: Bloomberg, as reported by COMEX. As of May 4, 2012 Copper and Gold Production Will Diversify Exposure |
|
|
APPENDIX |
|
|
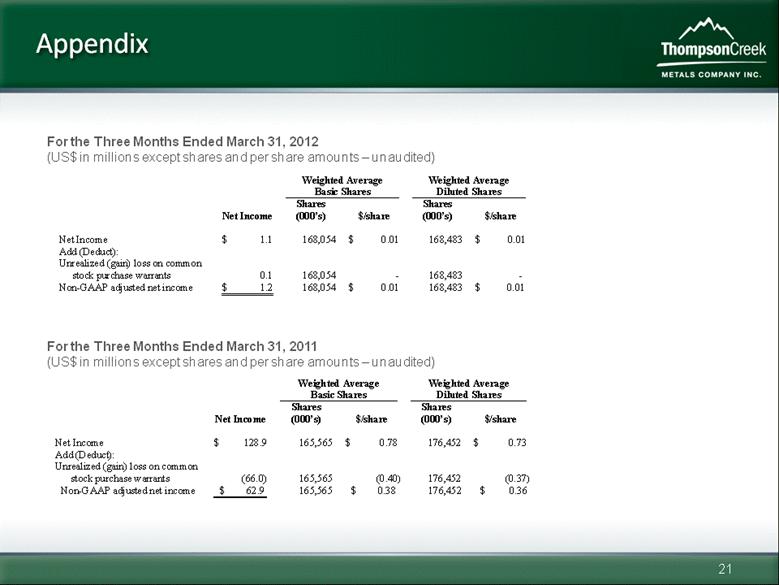
21 Appendix For the Three Months Ended March 31, 2012 (US$ in millions except shares and per share amounts – unaudited) For the Three Months Ended March 31, 2011 (US$ in millions except shares and per share amounts – unaudited) Weighted Average Basic Shares Weighted Average Diluted Shares Net Income Shares (000’s) $/share Shares (000’s) $/share Net Income $ 128.9 165,565 $ 0.78 176,452 $ 0.73 Add (Deduct): Unrealized (gain) loss on common stock purchase warrants (66.0) 165,565 (0.40 ) 176,452 (0.37 ) Non - GAAP adjusted net income $ 62.9 165,565 $ 0.38 176,452 $ 0.36 Weighted A verage Basic Shares Weighted Average Diluted Shares Net Income Shares (000’s) $/share Shares (000’s) $/share Net Income $ 1.1 16 8,054 $ 0. 01 1 68,483 $ 0. 01 Add (Deduct): Unrealized (gain) loss on common stock purchase warrants 0.1 16 8,054 - 1 68,483 - Non - GAAP adjusted net income $ 1.2 16 8,054 $ 0. 01 1 68,483 $ 0.01 |
|
|
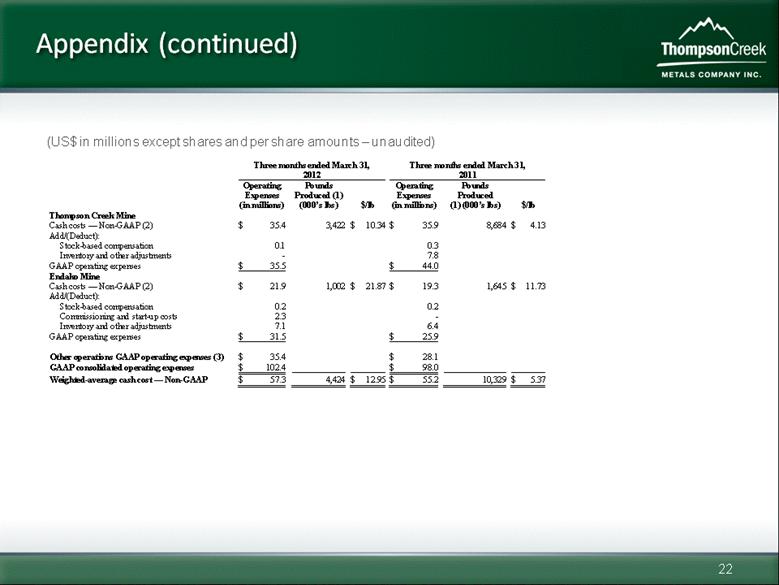
22 Appendix (continued) (US$ in millions except shares and per share amounts – unaudited) Three months ended March 31, 2012 Three months ended March 31, 2011 Operating Expenses (in millions) Pounds Produced (1) (000’s lbs) $/lb Operating Expenses (in millions) Pounds Produced (1) (000’s lbs) $/lb Thompson Creek Mine C ash costs — Non-GAAP (2) $ 35.4 3,422 $ 10.34 $ 35.9 8,684 $ 4.13 Add/(Deduct): Stock-based compensation 0. 1 0. 3 Inventory and other adjustments-7.8 GAAP operating expenses $ 35.5 $ 44.0 Endako Mine Cash costs — Non-GAAP (2) $ 21.9 1,002 $ 21.87 $ 19.3 1,645 $ 11.73 Add/(Deduct): Stock-based compensation 0.2 0.2 Commissioning and start-up costs 2.3-Inventory and other adjustments 7.1 6.4 GAAP operating expenses $ 31.5 $ 25.9 Other operations GAAP operating expenses (3) $ 35.4 $ 28.1 GAAP consolidated operating expenses $ 102.4 $ 98.0 Weighted-average cash cost — Non-GAAP $ 57 .3 4,424 $ 12.95 $ 55.2 10,329 $ 5.37 |
|
|
THOMPSON CREEK METALS COMPANY NYSE:TC TSX:TCM www.thompsoncreekmetals.com Pamela Solly Director, Investor Relations Phone: (303) 762-3526 Email: psolly@tcrk.com |