Attached files
| file | filename |
|---|---|
| 8-K - FORM 8-K - FAIRPOINT COMMUNICATIONS INC | d348321d8k.htm |
 May 2012
Investor Presentation
Exhibit 99.1 |
 2
Notices and Safe Harbors
The information contained herein is current only as of the date hereof; however, unless
otherwise indicated, financial information contained herein is as of March 31,
2012. The business, prospects, financial condition or performance of FairPoint Communications, Inc. (“FairPoint”) and its subsidiaries
described herein may have changed since that date. FairPoint does not intend to update
or otherwise revise the information contained herein. FairPoint makes no
representation or warranty, express or implied, as to the completeness of the information contained herein. If any other
information is given or any other representations are made, they should not be relied upon as
having been authorized by FairPoint. Market data used throughout this presentation is based on surveys and studies conducted by
third parties, as well as industry and general publications. FairPoint has no
obligation (express or implied) to update any or all of the information or to advise you of any changes; nor does FairPoint make any
express or implied warranties or representations as to the completeness or accuracy nor does
it accept responsibility for errors. Some statements herein are known as “forward-looking statements” within the
meaning of Section 27A of the Securities Act of 1933, as amended, and Section 21E of
the Securities Exchange Act of 1934, as amended. These forward-looking statements include, but are not limited to, statements about
our plans, objectives, expectations and intentions and other statements contained herein that
are not historical facts. When used herein, the words “expects,”
“anticipates,” “intends,” “plans,” “believes,” “seeks,” “estimates” and similar expressions are generally intended to identify forward- looking
statements. Because these forward-looking statements involve known and unknown risks and
uncertainties, there are important factors that could cause actual results, events or
developments to differ materially from those expressed or implied by these forward-looking statements, including our
plans, objectives, expectations and intentions and other factors. You should not place undue
reliance on such forward-looking statements, which are based on the information
currently available to us and speak only as of the date hereof. FairPoint does not undertake any obligation to publicly update
or revise any forward-looking statements, whether as a result of new information, future
events or otherwise. Throughout this presentation, reference is made to Consolidated EBITDAR or EBITDAR and
Unlevered Free Cash Flow. EBITDAR and Unlevered Free Cash Flow are non-GAAP
financial measures. Management believes that EBITDAR and Unlevered Free Cash Flow may be useful in assessing our
operating performance and our ability to meet our debt service requirements. EBITDAR and
Unlevered Free Cash Flow, as used herein, however, are not necessarily comparable to
similarly titled measures of other companies. Furthermore, EBITDAR and Unlevered Free Cash Flow have limitations as
analytical tools and should not be considered in isolation from, or as an alternative to, net
income or loss, operating income, cash flow or other combined income or cash flow data
prepared in accordance with GAAP. Because of these limitations, EBITDAR, Unlevered Free Cash Flow and related
ratios should not be considered as measures of discretionary cash available to invest in
business growth or reduce indebtedness. We compensate for these limitations by
relying primarily on our GAAP results using EBITDAR and Unlevered Free Cash Flow only supplementally.
We provide guidance as to certain financial information herein, which consists of
forward-looking statements. Our guidance is not prepared with a view toward
compliance with the published guidelines of the American Institute of Certified Public Accountants, and neither our independent registered
public accounting firm nor any other independent expert or outside party compiles or examines
the guidance and, accordingly, no such person expresses any opinion or any other form
of assurance with respect thereto. Guidance is based upon a number of assumptions and estimates that, while
presented with numerical specificity, are inherently subject to significant business, economic
and competitive uncertainties and contingencies, many of which are beyond our control
and are based upon specific assumptions with respect to future business decisions, some of which will change. We
generally state possible outcomes as high and low ranges which are intended to provide a
sensitivity analysis as variables are changed but are not intended to represent our
actual results which could fall outside of the suggested ranges. The principal reason that we release this data is to provide a
basis for our management to discuss our business outlook with analysts and investors.
Notwithstanding this, we do not accept any responsibility for any projections or
reports published by any such outside analysts or investors. Guidance is necessarily speculative in nature, and it can be expected
that some or all of the assumptions or the guidance furnished by us will not materialize or
will vary significantly from actual results. Accordingly, our guidance is only an
estimate of what management believes is realizable as of the date hereof. Actual results may vary from the guidance and the
variations may be material. Investors should also recognize that the reliability of any
forecasted financial data diminishes the farther in the future that the data is
forecast. In light of the foregoing, investors are urged to put the guidance in context and not to place undue reliance on it. Any inability to
successfully implement our operating strategy or the occurrence of any of the events or
circumstances discussed therein could result in the actual operating results
being different than the guidance, and such differences may be material.
|
 3
Company Overview
•
Operate in 18 states with over 1.3M access
line equivalents
1
80% northern New England (NNE)
20% Telecom Group (TG)
•
NNE: 3 contiguous states with ubiquitous
next-generation network
•
Telecom Group: RLECs in 15 other states
with fewer competitors
•
Broadband, voice, video and high-capacity
bandwidth offerings
•
Extensive capital investment to date
15,000 fiber route miles
85% avg. broadband availability in NNE
90% avg. broadband availability in TG
•
$1B annual revenue and ~3,500 employees
Service Territory
Telecom Group
Northern New England
Access Line Equivalents
as of March 31, 2012
Northern
New
England
Telecom
Group
Total
Switched access lines:
Residential
502,845
128,879
631,724
Business
261,184
47,894
309,078
Wholesale
2
72,233
NM
72,233
Total switched access lines
836,262
176,773
1,013,035
Broadband subscribers
234,020
84,490
318,510
Total access line equivalents
1,070,282
261,263
1,331,545
(1)
Switched access lines plus broadband subscribers as of March 31, 2012
(2)
UNE-P and Resale lines. Excludes UNE-L and Special Access circuits
|
 4
Path to Increasing Shareholder Value
Execute
Human
Resource
Strategy
Transform
and Grow
Revenue
Change
Regulatory
Environment
Improve
Operations
Four Pillar Strategy for
Increasing Free Cash Flow |
 5
Established Track Record for Three Pillars |
 6
Operational Improvements
FairPoint continues to make significant operational
improvements
•
Industry leading broadband growth
7.1% YoY growth
•
Slowdown in voice access line loss, especially in
business
8.1% YoY total voice line loss
4.0% YoY business voice line loss
0.7% business voice line loss in 1Q12
•
Fiber-to-the-Tower initiative
800+ towers served with fiber
Opportunities for further expansion
•
Enabled workforce reduction
14% reduction since 2Q11
$40 million in annual savings
•
Service quality has improved
Call center volumes decreased
Installation intervals shortened
•
Service quality penalties down
Business Voice Line Loss (YoY)
Broadband Subscribers
270k
280k
290k
300k
310k
320k
330k
3Q10
4Q10
1Q11
2Q11
3Q11
4Q11
1Q12
-8.5%
-8.3%
-7.8%
-6.9%
-6.3%
-5.1%
-4.0%
-10.0%
-9.0%
-8.0%
-7.0%
-6.0%
-5.0%
-4.0%
-3.0%
-2.0%
3Q10
4Q10
1Q11
2Q11
3Q11
4Q11
1Q12 |
 7
Continuous Improvement through
Coordination & Collaboration
Operational
Improvement
Optimize &
Enhance Systems
(IT Functions)
Productivity Gain
(HR Strategy) |
 8
Regulatory Progress
•
Regulators and legislators in Maine, New Hampshire and Vermont are responding to
FairPoint’s message of the need for a level playing field
•
Improvement in service quality and recognition of need for strong communications
infrastructure provider promotes the concept of a level playing field
•
Benefits include:
Increased competitiveness with unregulated providers
Fewer
service
quality
metrics
and
lowered
caps
in
retail
service
quality
penalties
Reduction in regulatory administrative burden
•Regulatory reform
required to fulfill
mission
•26% of Business
Market
Level Playing
Field
Sustainable
Growing Revenue
•Business
•Broadband
•Ethernet/Transport
•Strong provider of
last resort
•Extension of
broadband to
unserved and
underserved regions
Strong
Communications
Infrastructure |
 9
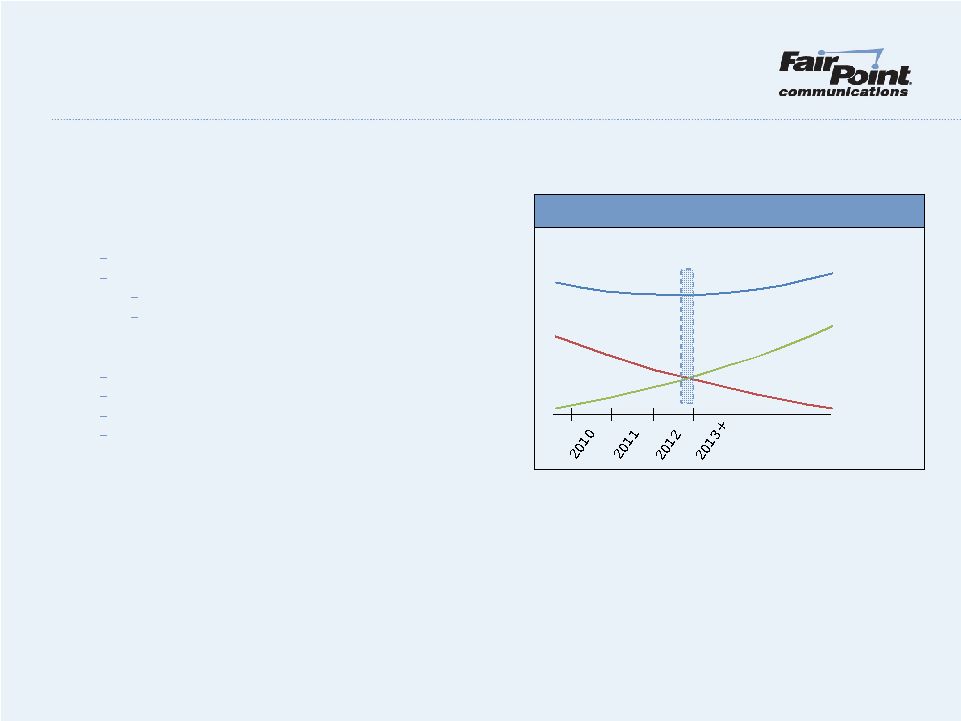
Revenue Transformation
FairPoint plans to change the composition of its
revenue base in order to stabilize and then
grow our top line
•
Residential voice
Revenue churn arising from:
copper to fiber
TDM to IP
•
Broadband (business and residential)
SMB products and services
Carrier Ethernet Service
Other high-capacity/transport and management
services
Revenue Transformation
Total
Revenue
Growth
Products
Residential
Voice
Low market share, especially in business
market, creates opportunity for organic
growth in northern New England
Next-generation network on 14k fiber route
miles in northern New England provides
platform for growth
Legacy products in decline
Growth-oriented products |
 10
Human Resource Strategy
FairPoint must align its human resource
assets with the changing telecom landscape
•
14% workforce reduction since 2Q11
Lump sum pension distributions of $48 million
•
3,454 employees as of March 31, 2012
1,257 management
2,197 union
•
1,919 union employees covered by
collective bargaining agreements with the
CWA and IBEW in northern New England
Contracts expire August 2014
•
Increased labor relations competencies
with telecommunications focus
•
Pension & OPEB liabilities arise from
northern New England union contracts
GAAP figures represent status quo into
perpetuity and reflect continuation of past
practices
Pension and OPEB are highly sensitive to the
discount rate assumption (i.e. interest rates)
OPEB liability is highly sensitive to the medical
cost trend assumption
Pension & OPEB Sensitivity
1
(1)
Based upon liability at December 31, 2011
Pension & OPEB GAAP Liability
($ in millions)
Pension
OPEB
Impact on liability given 1%
change in the discount rate
assumption
19%
23%
Impact on liability given 1%
increase in healthcare cost trend
assumption
N/A
$134.1
Impact on liability given 1%
decrease in healthcare cost trend
assumption
N/A
($101.1)
($ in millions)
2010
2011
1Q12
Pension
Plan assets
$176.5
$160.3
$146.0
Projected benefit obligation
$265.8
$318.3
$303.3
Key assumptions:
Discount rate
5.56%
4.63%
4.61%
OPEB
Plan assets
$0.2
$1.0
$1.0
Projected benefit obligation
$344.9
$533.2
$545.6
Key assumptions:
Discount rate
5.65%
4.66%
4.66%
Healthcare cost trend (<65 years)
7.70%
8.40%
8.40%
Healthcare cost trend (>65 years)
8.20%
8.40%
8.40% |
 11
Tactical Outlook |
 12
As of March 31, 2012:
•
$36 million unrestricted cash
$63 million of revolver availability, after
$12 million letters of credit
•
•
•
2012: $190 million + $20 million carryover
2013: $170 million
2014: $150 million
2015: $150 million
Capital Structure
Capital Structure Summary
Liquidity of $99 million
Leverage of 3.96x vs. 4.75x covenant
Interest coverage of 3.77x vs. 3.25x covenant
Covenant limiting capital expenditures to:
as of March 31, 2012
(in millions)
Cash and cash equivalents (unrestricted)
$36
Gross debt
1
$998
Revolver
2
$75
Amortization schedule:
2011
$0
2012
$10
2013
$10
2014
$25
2015
$38
January 24, 2016
$918
L+450, with LIBOR floor of 200
No dividends if leverage > 2.0x
Interest coverage and leverage covenants
Common stock outstanding
3
26.2
Warrants
(7
yr,
$48.81
strike)
3.6
(1)
Excludes letters of credit of $12 million and capital lease obligations of $4 million
(2)
Undrawn as of March 31, 2012, except for outstanding letters of credit of $12 million, which
reduces revolver availability
(3)
Includes management restricted stock and common stock held in reserve for certain
pre-petition claims
|
 13
2012 Guidance:
•
Unlevered
Free
Cash
Flow
of
$90
to
$100
million
(after
pension
&
OPEB)
•
Continued focus on improving EBITDAR
•
Disciplined capital spending
•
Interest of approximately $68 million
•
Debt amortization of $10 million
Financial Results and Guidance
2011 Financial Highlights
($ in millions)
2Q11
3Q11
4Q11
1Q12
LTM
Revenue
$262.6
$257.9
$254.2
$248.5
$1,023.2
Consolidated EBITDAR
1
70.5
60.5
70.0
55.3
256.3
Capital expenditures
52.1
35.2
35.1
26.3
148.7
Unlevered Free Cash Flow
2
$18.4
$25.3
$34.9
$29.1
$107.6
Cash on hand
$13.1
$9.9
$17.4
$35.8
$35.8
(1)
As defined in FairPoint’s credit facility. Consolidated EBITDAR is a non-GAAP
financial measure. For a reconciliation of Net Income (Loss) to Consolidated
EBITDAR, see our first quarter 2012 earnings release furnished May 2, 2012 on Form 8-K
(2)
Unlevered Free Cash Flow means Consolidated EBITDAR minus capital expenditures.
Unlevered Free Cash Flow is a non-GAAP financial measure. For a
reconciliation of Net Income (Loss) to Unlevered Free Cash Flow, see our first quarter 2012
earnings release furnished May 2, 2012 on Form 8-K
|
 14
Summary
•
Operational improvements create foundation for transformation
Broadband, FTTT and service quality improvements
Productivity enhancements and 14% workforce reduction
Focusing on productivity gains arising from process and systems enhancements
•
Regulators and legislators are supportive of FairPoint’s need for a level playing
field Deregulation in Maine
Incentive Regulation Plan in Vermont
•
Transforming revenue by adding sustainable, growth-oriented revenues on our
next-generation network in northern New England
3 contiguous states with network ubiquity
14,000 fiber route miles
26% business market share
•
Focus on increasing free cash flow to enhance shareholder value
|