Attached files
| file | filename |
|---|---|
| EX-99.1 - EX-99.1 - PennyMac Mortgage Investment Trust | a12-11300_1ex99d1.htm |
| 8-K - 8-K - PennyMac Mortgage Investment Trust | a12-11300_18k.htm |
Exhibit 99.2
|
|
PennyMac Mortgage Investment Trust May 3, 2012 First Quarter 2012 Earnings Report |

|
|
1Q12 Earnings Report 2 This presentation contains forward-looking statements within the meaning of Section 21E of the Securities Exchange Act of 1934, as amended, regarding management’s beliefs, estimates, projections and assumptions with respect to, among other things, the Company’s financial results, future operations, business plans and investment strategies, as well as industry and market conditions, all of which are subject to change. Words like “believe,” “expect,” “anticipate,” “promise,” “plan,” and other expressions or words of similar meanings, as well as future or conditional verbs such as “will,” “would,” “should,” “could,” or “may” are generally intended to identify forward-looking statements. Actual results and operations for any future period may vary materially from those projected herein, from past results discussed herein, or illustrative examples provided herein. Factors which could cause actual results to differ materially from historical results or those anticipated include, but are not limited to: changes in general business, economic, market and employment conditions from those expected; continued declines in residential real estate and disruption in the U.S. housing market; the availability of, and level of competition for, attractive risk-adjusted investment opportunities in residential mortgage loans and mortgage-related assets that satisfy our investment objectives and investment strategies; changes in our investment or operational objectives and strategies, including any new lines of business; the concentration of credit risks to which we are exposed; the availability, terms and deployment of short-term and long-term capital; unanticipated increases in financing and other costs, including a rise in interest rates; the performance, financial condition and liquidity of borrowers; increased rates of delinquency or decreased recovery rates on our investments; increased prepayments of the mortgage and other loans underlying our investments; changes in regulations or the occurrence of other events that impact the business, operation or prospects of government sponsored enterprises; changes in government support of homeownership; changes in governmental regulations, accounting treatment, tax rates and similar matters; and our ability to satisfy complex rules in order to qualify as a REIT for U.S. federal income tax purposes. You should not place undue reliance on any forward-looking statement and should consider all of the uncertainties and risks described above, as well as those more fully discussed in reports and other documents filed by the Company with the Securities and Exchange Commission from time to time. The Company undertakes no obligation to publicly update or revise any forward-looking statements or any other information contained herein, and the statements made in this presentation are current as of the date of this presentation only. Forward-Looking Statements |
|
|
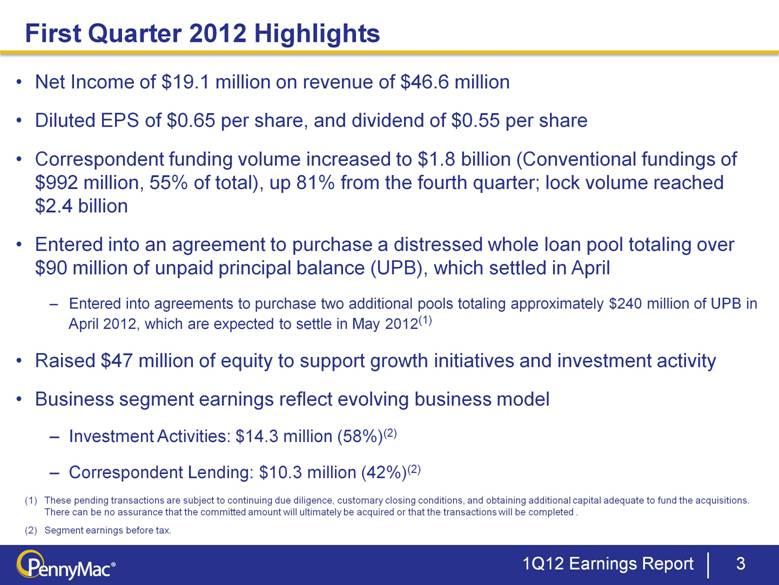
1Q12 Earnings Report 3 First Quarter 2012 Highlights Net Income of $19.1 million on revenue of $46.6 million Diluted EPS of $0.65 per share, and dividend of $0.55 per share Correspondent funding volume increased to $1.8 billion (Conventional fundings of $992 million, 55% of total), up 81% from the fourth quarter; lock volume reached $2.4 billion Entered into an agreement to purchase a distressed whole loan pool totaling over $90 million of unpaid principal balance (UPB), which settled in April Entered into agreements to purchase two additional pools totaling approximately $240 million of UPB in April 2012, which are expected to settle in May 2012(1) Raised $47 million of equity to support growth initiatives and investment activity Business segment earnings reflect evolving business model Investment Activities: $14.3 million (58%)(2) (1) Correspondent Lending: $10.3 million (42%)(2) These pending transactions are subject to continuing due diligence, customary closing conditions, and obtaining additional capital adequate to fund the acquisitions. There can be no assurance that the committed amount will ultimately be acquired or that the transactions will be completed . (2) Segment earnings before tax. |
|
|
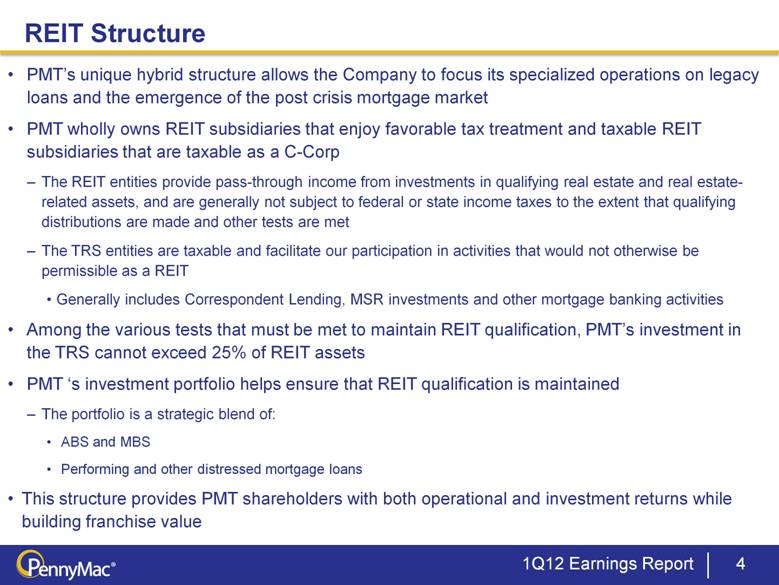
1Q12 Earnings Report 4 PMT’s unique hybrid structure allows the Company to focus its specialized operations on legacy loans and the emergence of the post crisis mortgage market PMT wholly owns REIT subsidiaries that enjoy favorable tax treatment and taxable REIT subsidiaries that are taxable as a C-Corp The REIT entities provide pass-through income from investments in qualifying real estate and real estate-related assets, and are generally not subject to federal or state income taxes to the extent that qualifying distributions are made and other tests are met The TRS entities are taxable and facilitate our participation in activities that would not otherwise be permissible as a REIT Generally includes Correspondent Lending, MSR investments and other mortgage banking activities Among the various tests that must be met to maintain REIT qualification, PMT’s investment in the TRS cannot exceed 25% of REIT assets PMT ‘s investment portfolio helps ensure that REIT qualification is maintained The portfolio is a strategic blend of: ABS and MBS Performing and other distressed mortgage loans This structure provides PMT shareholders with both operational and investment returns while building franchise value REIT Structure |
|
|
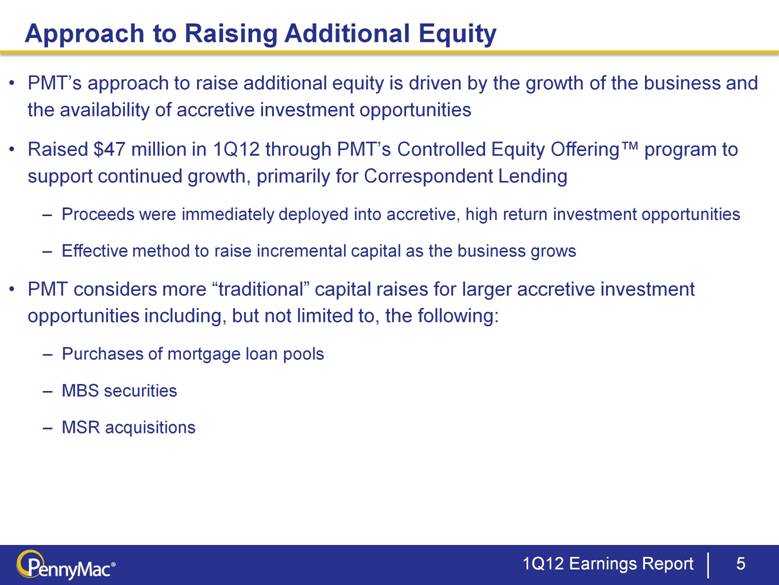
Approach to Raising Additional Equity PMT’s approach to raise additional equity is driven by the growth of the business and the availability of accretive investment opportunities Raised $47 million in 1Q12 through PMT’s Controlled Equity Offering™ program to support continued growth, primarily for Correspondent Lending Proceeds were immediately deployed into accretive, high return investment opportunities Effective method to raise incremental capital as the business grows PMT considers more “traditional” capital raises for larger accretive investment opportunities including, but not limited to, the following: Purchases of mortgage loan pools MBS securities MSR acquisitions 1Q12 Earnings Report 5 |
|
|
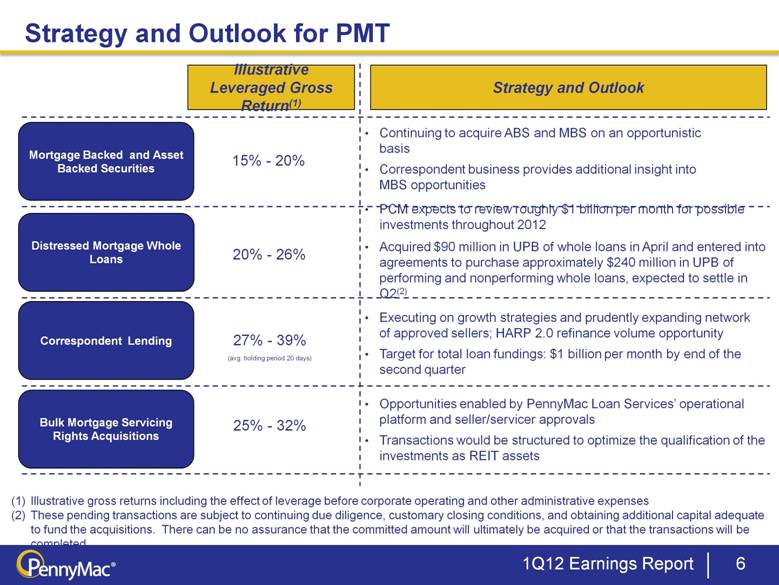
6 Illustrative Leveraged Gross Return(1) 20% - 26% 15% - 20% 27% - 39% (avg. holding period 20 days) 25% - 32% Strategy and Outlook Strategy and Outlook for PMT Continuing to acquire ABS and MBS on an opportunistic basis Correspondent business provides additional insight into MBS opportunities PCM expects to review roughly $1 billion per month for possible investments throughout 2012 Acquired $90 million in UPB of whole loans in April and entered into agreements to purchase approximately $240 million in UPB of performing and nonperforming whole loans, expected to settle in Q2(2) Executing on growth strategies and prudently expanding network of approved sellers; HARP 2.0 refinance volume opportunity Target for total loan fundings: $1 billion per month by end of the second quarter Opportunities enabled by PennyMac Loan Services’ operational platform and seller/servicer approvals Transactions would be structured to optimize the qualification of the investments as REIT assets 1Q12 Earnings Report (1) Illustrative gross returns including the effect of leverage before corporate operating and other administrative expenses (2) These pending transactions are subject to continuing due diligence, customary closing conditions, and obtaining additional capital adequate to fund the acquisitions. There can be no assurance that the committed amount will ultimately be acquired or that the transactions will be completed . |
|
|
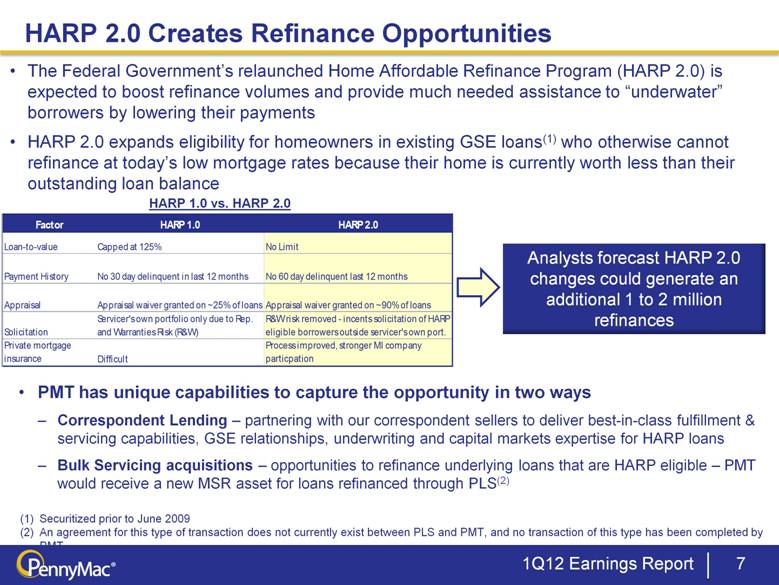
PMT has unique capabilities to capture the opportunity in two ways Correspondent Lending – partnering with our correspondent sellers to deliver best-in-class fulfillment & servicing capabilities, GSE relationships, underwriting and capital markets expertise for HARP loans Bulk Servicing acquisitions – opportunities to refinance underlying loans that are HARP eligible – PMT would receive a new MSR asset for loans refinanced through PLS(2) 1Q12 Earnings Report 7 The Federal Government’s relaunched Home Affordable Refinance Program (HARP 2.0) is expected to boost refinance volumes and provide much needed assistance to “underwater” borrowers by lowering their payments HARP 2.0 expands eligibility for homeowners in existing GSE loans(1) who otherwise cannot refinance at today’s low mortgage rates because their home is currently worth less than their outstanding loan balance (1) Securitized prior to June 2009 (2) An agreement for this type of transaction does not currently exist between PLS and PMT, and no transaction of this type has been completed by PMT HARP 1.0 vs. HARP 2.0 Analysts forecast HARP 2.0 changes could generate an additional 1 to 2 million refinances HARP 2.0 Creates Refinance Opportunities Factor HARP 1.0 HARP 2.0 Loan-to-value Capped at 125% No Limit Payment History No 30 day delinquent in last 12 months No 60 day delinquent last 12 months Appraisal Appraisal waiver granted on ~25% of loans Appraisal waiver granted on ~90% of loans Solicitation Servicer's own portfolio only due to Rep. and Warranties Risk (R&W) R&W risk removed - incents solicitation of HARP eligible borrowers outside servicer's own port. Private mortgage insurance Difficult Process improved, stronger MI company particpation |
|
|
Financial Results |

|
|
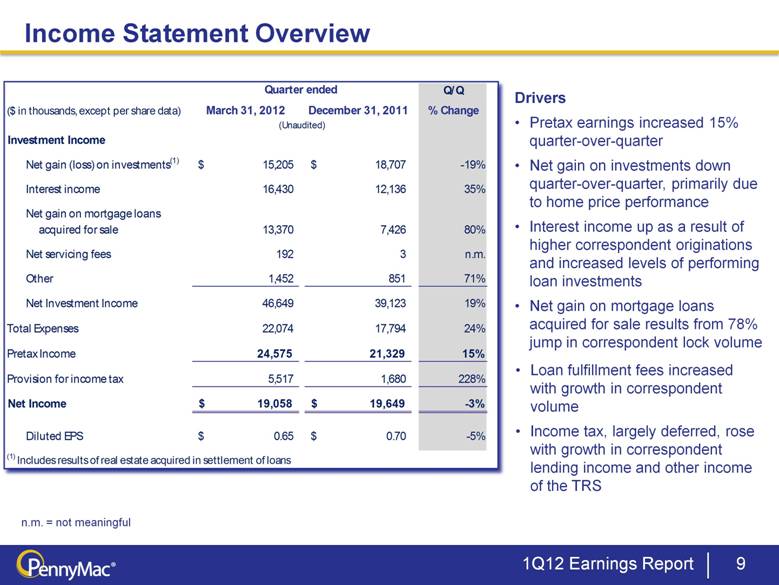
1Q12 Earnings Report 9 Income Statement Overview Drivers Pretax earnings increased 15% quarter-over-quarter Net gain on investments down quarter-over-quarter, primarily due to home price performance Interest income up as a result of higher correspondent originations and increased levels of performing loan investments Net gain on mortgage loans acquired for sale results from 78% jump in correspondent lock volume Loan fulfillment fees increased with growth in correspondent volume Income tax, largely deferred, rose with growth in correspondent lending income and other income of the TRS n.m. = not meaningful Q/Q ($ in thousands, except per share data) March 31, 2012 December 31, 2011 % Change (Unaudited) Investment Income Net gain (loss) on investments(1) 15,205 $ 18,707 $ -19% Interest income 16,430 12,136 35% Net gain on mortgage loans acquired for sale 13,370 7,426 80% Net servicing fees 192 3 n.m. Other 1,452 851 71% Net Investment Income 46,649 39,123 19% Total Expenses 22,074 17,794 24% Pretax Income 24,575 21,329 15% Provision for income tax 5,517 1,680 228% Net Income 19,058 $ 19,649 $ -3% Diluted EPS 0.65 $ 0.70 $ -5% (1) Includes results of real estate acquired in settlement of loans Quarter ended |
|
|
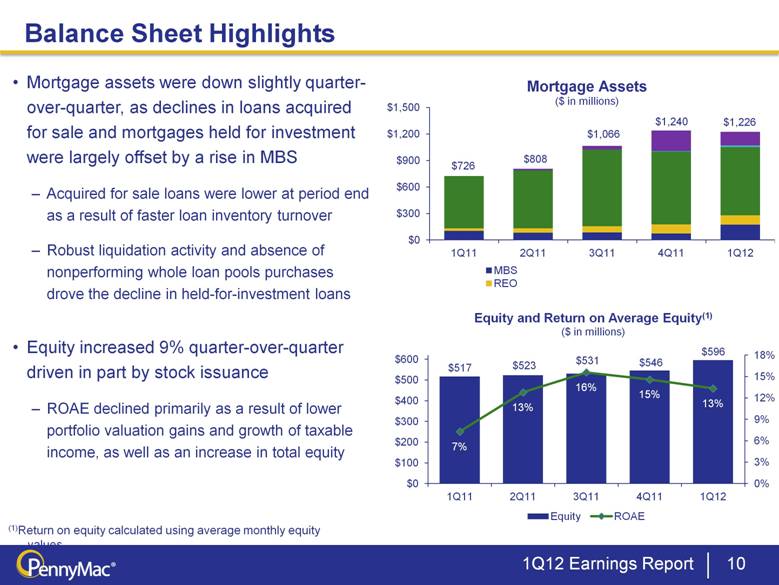
1Q12 Earnings Report 10 Balance Sheet Highlights (1)Return on equity calculated using average monthly equity values. Mortgage assets were down slightly quarter-over-quarter, as declines in loans acquired for sale and mortgages held for investment were largely offset by a rise in MBS Acquired for sale loans were lower at period end as a result of faster loan inventory turnover Robust liquidation activity and absence of nonperforming whole loan pools purchases drove the decline in held-for-investment loans Equity increased 9% quarter-over-quarter driven in part by stock issuance ROAE declined primarily as a result of lower portfolio valuation gains and growth of taxable income, as well as an increase in total equity |
|
|
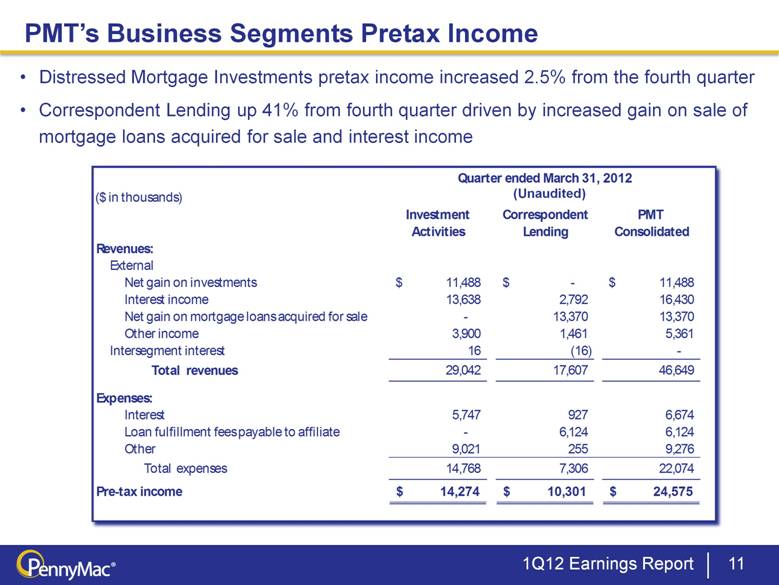
1Q12 Earnings Report 11 PMT’s Business Segments Pretax Income Distressed Mortgage Investments pretax income increased 2.5% from the fourth quarter Correspondent Lending up 41% from fourth quarter driven by increased gain on sale of mortgage loans acquired for sale and interest income (Unaudited) Quarter ended March 31, 2012 ($ in thousands) Investment Correspondent PMT Activities Lending Consolidated Revenues: External Net gain on investments 11,488 $ - $ 11,488 $ Interest income 13,638 2,792 16,430 Net gain on mortgage loans acquired for sale - 13,370 13,370 Other income 3,900 1,461 5,361 Intersegment interest 16 (16) - Total revenues 29,042 17,607 46,649 Expenses: Interest 5,747 927 6,674 Loan fulfillment fees payable to affiliate - 6,124 6,124 Other 9,021 255 9,276 Total expenses 14,768 7,306 22,074 Pre-tax income 14,274 $ 10,301 $ 24,575 $ |
|
|
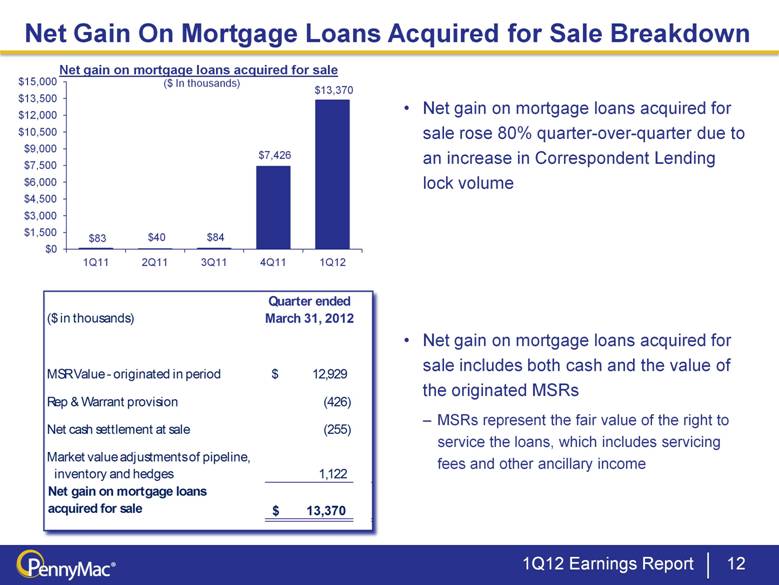
Net Gain On Mortgage Loans Acquired for Sale Breakdown 1Q12 Earnings Report 12 Net gain on mortgage loans acquired for sale rose 80% quarter-over-quarter due to an increase in Correspondent Lending lock volume Net gain on mortgage loans acquired for sale includes both cash and the value of the originated MSRs MSRs represent the fair value of the right to service the loans, which includes servicing fees and other ancillary income Net gain on mortgage loans acquired for sale ($ In thousands) Quarter ended ($ in thousands) March 31, 2012 MSR Value - originated in period 12,929 $ Rep & Warrant provision (426) Net cash settlement at sale (255) Market value adjustments of pipeline, inventory and hedges 1,122 Net gain on mortgage loans acquired for sale 13,370 $ |
|
|
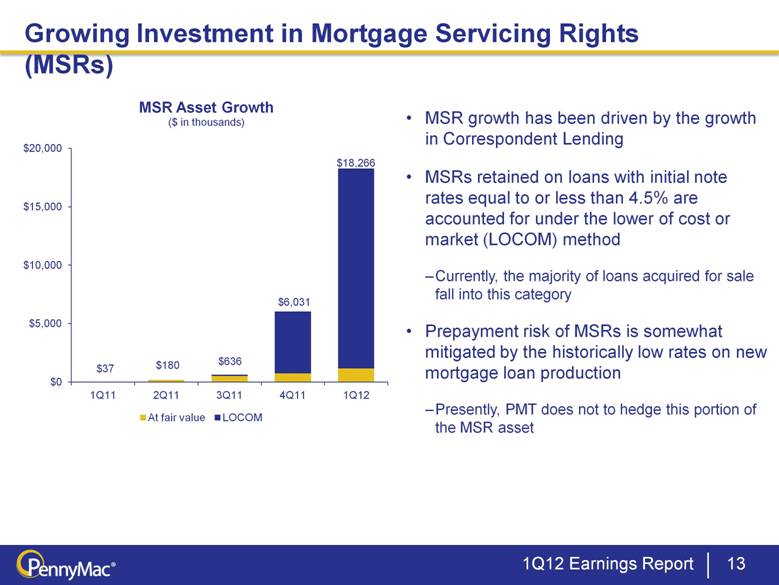
1Q12 Earnings Report 13 Growing Investment in Mortgage Servicing Rights (MSRs) MSR growth has been driven by the growth in Correspondent Lending MSRs retained on loans with initial note rates equal to or less than 4.5% are accounted for under the lower of cost or market (LOCOM) method Currently, the majority of loans acquired for sale fall into this category Prepayment risk of MSRs is somewhat mitigated by the historically low rates on new mortgage loan production Presently, PMT does not to hedge this portion of the MSR asset |
|
|
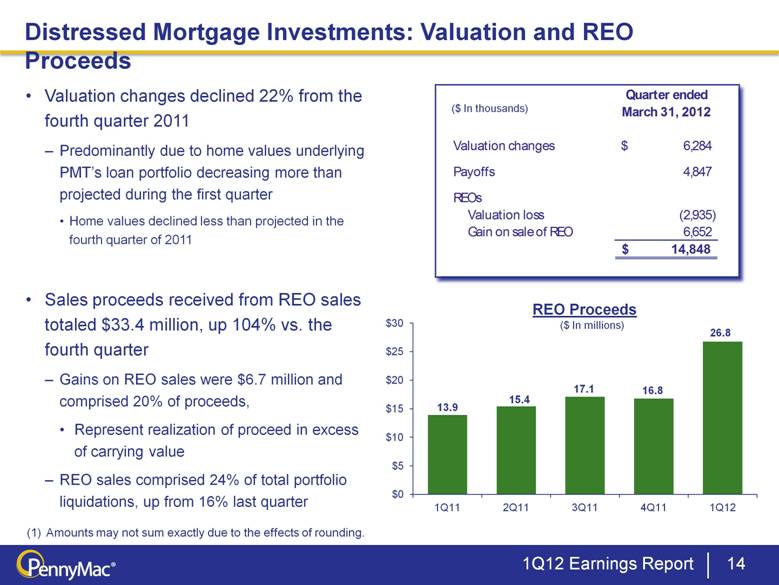
1Q12 Earnings Report 14 Distressed Mortgage Investments: Valuation and REO Proceeds Valuation changes declined 22% from the fourth quarter 2011 Predominantly due to home values underlying PMT’s loan portfolio decreasing more than projected during the first quarter Home values declined less than projected in the fourth quarter of 2011 Sales proceeds received from REO sales totaled $33.4 million, up 104% vs. the fourth quarter Gains on REO sales were $6.7 million and comprised 20% of proceeds, Represent realization of proceed in excess of carrying value REO sales comprised 24% of total portfolio liquidations, up from 16% last quarter REO Proceeds Amounts may not sum exactly due to the effects of rounding. ($ In thousands) ($ In millions) Quarter ended March 31, 2012 Valuation changes 6,284 $ Payoffs 4,847 REOs Valuation loss (2,935) Gain on sale of REO 6,652 14,848 $ |
|
|
Correspondent Lending |

|
|
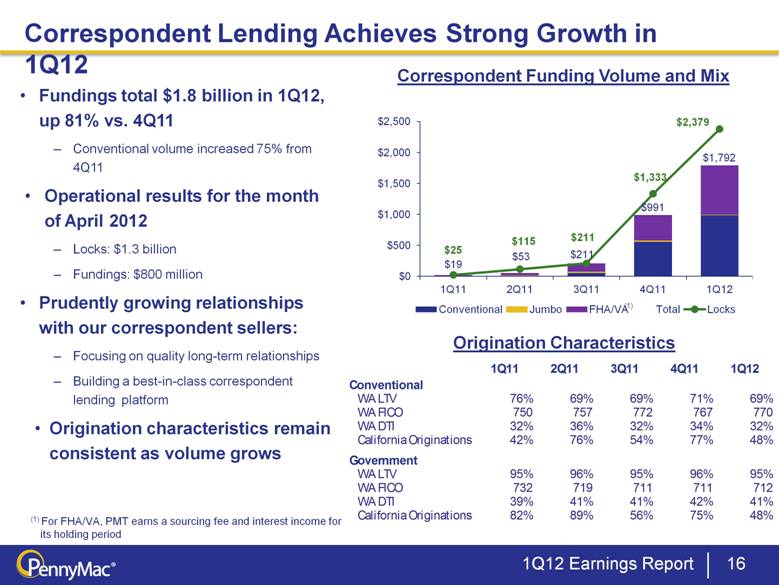
Fundings total $1.8 billion in 1Q12, up 81% vs. 4Q11 Conventional volume increased 75% from 4Q11 Operational results for the month of April 2012 Locks: $1.3 billion Fundings: $800 million Prudently growing relationships with our correspondent sellers: Focusing on quality long-term relationships Building a best-in-class correspondent lending platform Origination characteristics remain consistent as volume grows Correspondent Funding Volume and Mix Origination Characteristics 1Q12 Earnings Report 16 Correspondent Lending Achieves Strong Growth in 1Q12 (1) For FHA/VA, PMT earns a sourcing fee and interest income for its holding period (1) 1Q11 2Q11 3Q11 4Q11 1Q12 Conventional WA LTV 76% 69% 69% 71% 69% WA FICO 750 757 772 767 770 WA DTI 32% 36% 32% 34% 32% California Originations 42% 76% 54% 77% 48% Government WA LTV 95% 96% 95% 96% 95% WA FICO 732 719 711 711 712 WA DTI 39% 41% 41% 42% 41% California Originations 82% 89% 56% 75% 48% |
|
|
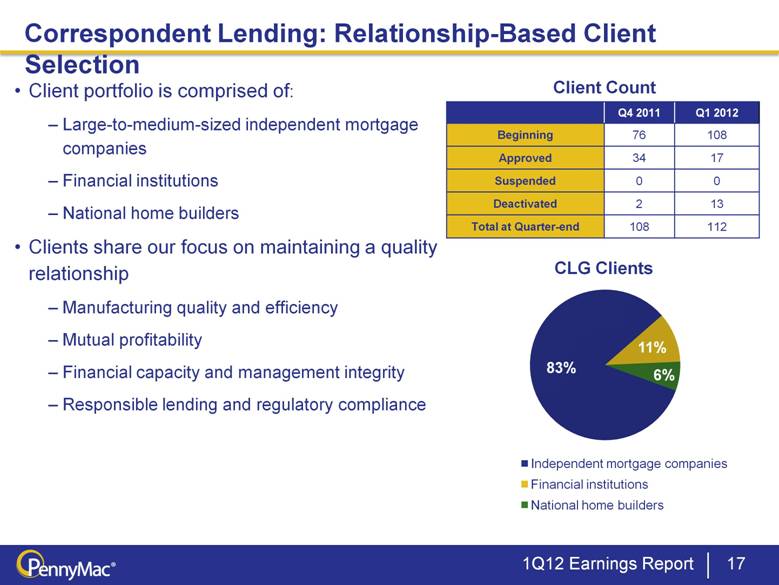
Client portfolio is comprised of: Large-to-medium-sized independent mortgage companies Financial institutions National home builders Clients share our focus on maintaining a quality relationship Manufacturing quality and efficiency Mutual profitability Financial capacity and management integrity Responsible lending and regulatory compliance 1Q12 Earnings Report 17 Correspondent Lending: Relationship-Based Client Selection Q4 2011 Q1 2012 Beginning 76 108 Approved 34 17 Suspended 0 0 Deactivated 2 13 Total at Quarter-end 108 112 Client Count |
|
|
Distressed Mortgage Investment |

|
|
1Q12 Earnings Report 19 Whole Loan Portfolio Acquisitions Volume of whole loan pools available for purchase remained steady throughout the first quarter PCM reviewed nearly $5.0 billion in UPB of whole loans PMT entered into an agreement to acquire approximately $90 million UPB of distressed whole loans which settled in the second quarter Agreements to purchase an additional $240 million UPB of performing and nonperforming whole loans have been entered into thus far in 2Q12(1) Flow of distressed whole loans for review is expected to remain steady We estimate that over $400 billion nonperforming residential loans remain on U.S. banks’ balance sheets Clarity created by the large banks’ settlement with the Department of Justice and states’ attorneys general may result in more pools coming to market These pending transactions are subject to continuing due diligence, customary closing conditions, and obtaining additional capital adequate to fund the acquisitions. There can be no assurance that the committed amount will ultimately be acquired or that the transactions will be completed . |
|
|
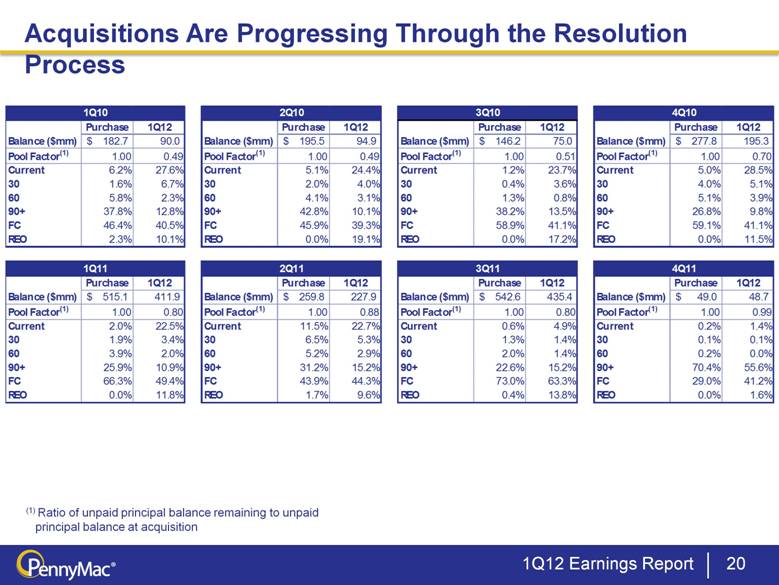
1Q12 Earnings Report 20 Acquisitions Are Progressing Through the Resolution Process (1) Ratio of unpaid principal balance remaining to unpaid principal balance at acquisition Purchase 1Q12 Purchase 1Q12 Purchase 1Q12 Purchase 1Q12 Balance ($mm) 182.7 $ 90.0 Balance ($mm) 195.5 $ 94.9 Balance ($mm) 146.2 $ 75.0 Balance ($mm) 277.8 $ 195.3 Pool Factor(1) 1.00 0.49 Pool Factor(1) 1.00 0.49 Pool Factor(1) 1.00 0.51 Pool Factor(1) 1.00 0.70 Current 6.2% 27.6% Current 5.1% 24.4% Current 1.2% 23.7% Current 5.0% 28.5% 30 1.6% 6.7% 30 2.0% 4.0% 30 0.4% 3.6% 30 4.0% 5.1% 60 5.8% 2.3% 60 4.1% 3.1% 60 1.3% 0.8% 60 5.1% 3.9% 90+ 37.8% 12.8% 90+ 42.8% 10.1% 90+ 38.2% 13.5% 90+ 26.8% 9.8% FC 46.4% 40.5% FC 45.9% 39.3% FC 58.9% 41.1% FC 59.1% 41.1% REO 2.3% 10.1% REO 0.0% 19.1% REO 0.0% 17.2% REO 0.0% 11.5% Purchase 1Q12 Purchase 1Q12 Purchase 1Q12 Purchase 1Q12 Balance ($mm) 515.1 $ 411.9 Balance ($mm) 259.8 $ 227.9 Balance ($mm) 542.6 $ 435.4 Balance ($mm) 49.0 $ 48.7 Pool Factor(1) 1.00 0.80 Pool Factor(1) 1.00 0.88 Pool Factor(1) 1.00 0.80 Pool Factor(1) 1.00 0.99 Current 2.0% 22.5% Current 11.5% 22.7% Current 0.6% 4.9% Current 0.2% 1.4% 30 1.9% 3.4% 30 6.5% 5.3% 30 1.3% 1.4% 30 0.1% 0.1% 60 3.9% 2.0% 60 5.2% 2.9% 60 2.0% 1.4% 60 0.2% 0.0% 90+ 25.9% 10.9% 90+ 31.2% 15.2% 90+ 22.6% 15.2% 90+ 70.4% 55.6% FC 66.3% 49.4% FC 43.9% 44.3% FC 73.0% 63.3% FC 29.0% 41.2% REO 0.0% 11.8% REO 1.7% 9.6% REO 0.4% 13.8% REO 0.0% 1.6% 2Q11 1Q11 3Q11 4Q11 1Q10 2Q10 3Q10 4Q10 |
|
|
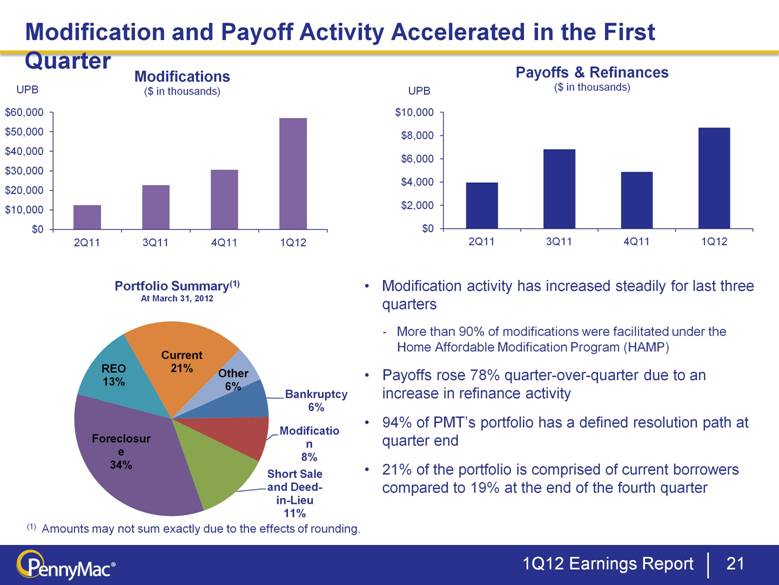
1Q12 Earnings Report 21 Modification and Payoff Activity Accelerated in the First Quarter Modification activity has increased steadily for last three quarters More than 90% of modifications were facilitated under the Home Affordable Modification Program (HAMP) Payoffs rose 78% quarter-over-quarter due to an increase in refinance activity 94% of PMT’s portfolio has a defined resolution path at quarter end 21% of the portfolio is comprised of current borrowers compared to 19% at the end of the fourth quarter (1) Amounts may not sum exactly due to the effects of rounding. |
|
|
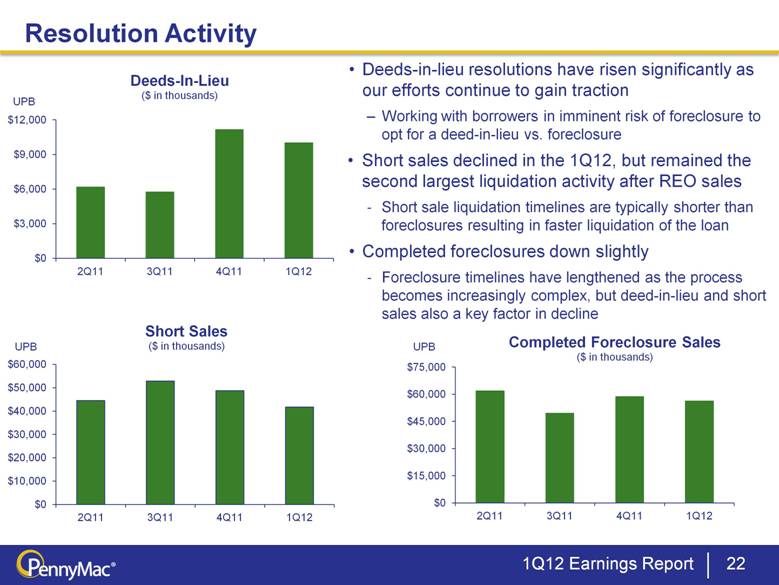
1Q12 Earnings Report 22 Resolution Activity Deeds-in-lieu resolutions have risen significantly as our efforts continue to gain traction Working with borrowers in imminent risk of foreclosure to opt for a deed-in-lieu vs. foreclosure Short sales declined in the 1Q12, but remained the second largest liquidation activity after REO sales Short sale liquidation timelines are typically shorter than foreclosures resulting in faster liquidation of the loan Completed foreclosures down slightly Foreclosure timelines have lengthened as the process becomes increasingly complex, but deed-in-lieu and short sales also a key factor in decline |
|
|
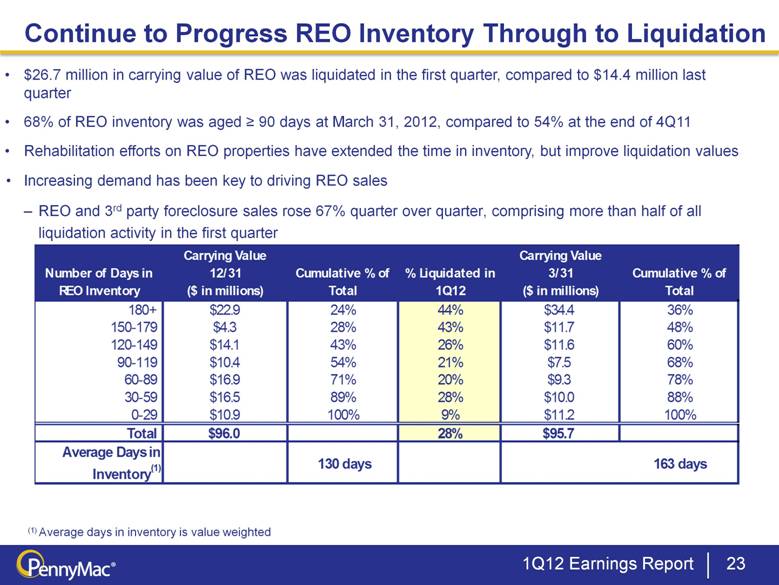
1Q12 Earnings Report 23 Continue to Progress REO Inventory Through to Liquidation $26.7 million in carrying value of REO was liquidated in the first quarter, compared to $14.4 million last quarter 68% of REO inventory was aged > 90 days at March 31, 2012, compared to 54% at the end of 4Q11 Rehabilitation efforts on REO properties have extended the time in inventory, but improve liquidation values Increasing demand has been key to driving REO sales REO and 3rd party foreclosure sales rose 67% quarter over quarter, comprising more than half of all liquidation activity in the first quarter (1) Average days in inventory is value weighted Number of Days in REO Inventory Carrying Value 12/31 ($ in millions) Cumulative % of Total % Liquidated in 1Q12 Carrying Value 3/31 ($ in millions) Cumulative % of Total 180+ $22.9 24% 44% $34.4 36% 150-179 $4.3 28% 43% $11.7 48% 120-149 $14.1 43% 26% $11.6 60% 90-119 $10.4 54% 21% $7.5 68% 60-89 $16.9 71% 20% $9.3 78% 30-59 $16.5 89% 28% $10.0 88% 0-29 $10.9 100% 9% $11.2 100% Total $96.0 28% $95.7 Average Days in Inventory(1) 130 days 163 days |
|
|
1Q12 Earnings Report 24 Cash Flow from Distressed Investments Cash proceeds from the liquidation of distressed mortgage loans and REO totaled $68.4 million for the first quarter of 2012 Repayments of mortgage loans at fair value -- $26.2 million Repayments of mortgage loans under forward purchase agreements at fair value -- $8.7 million Sales of real estate acquired in settlement of loans -- $26.8 million Sales of real estate acquired in settlement of loans under forward purchase agreements -- $6.8 million Strong operational performance from our distressed mortgage portfolio results in healthy quarterly cash flows available for distribution, debt service and reinvestment |
|
|
1Q12 Earnings Report 25 For questions or comments please contact us at: PennyMac Mortgage Investment Trust 6101 Condor Drive Moorpark, CA 93021 IR Contacts: Kevin Chamberlain Managing Director, Corporate Communications Christopher Oltmann Director, Investor Relations chris.oltmann@pnmac.com or InvestorRelations@pnmac.com Phone: 818-224-7442 Website: www.PennyMac-REIT.com Contact Us |

|
|
PennyMac Mortgage Investment Trust May 3, 2012 First Quarter 2012 Earnings Report |