Attached files
| file | filename |
|---|---|
| 8-K - EARNINGS RELEASE AND FINANCIAL STATEMENTS - General Motors Co | form8-k1q2012earningsrelea.htm |
| EX-99.1 - EARNINGS PRESS RELEASE AND FINANCIAL HIGHLIGHTS - General Motors Co | gm2012q1earningspressrelea.htm |
General Motors Company Q1 2012 Results May 3, 2012 Exhibit 99.2
Forward Looking Statements In this presentation and in related comments by our management, our use of the words “expect,” “anticipate,” “possible,” “potential,” “target,” “believe,” “commit,” “intend,” “continue,” “may,” “would,” “could,” “should,” “project,” “projected,” “positioned,” “outlook” or similar expressions is intended to identify forward looking statements that represent our current judgment about possible future events. We believe these judgments are reasonable, but these statements are not guarantees of any events or financial results, and our actual results may differ materially due to a variety of important factors. Among other items, such factors may include: our ability to realize production efficiencies and to achieve reductions in costs as a result of our restructuring initiatives and labor modifications; our ability to maintain quality control over our vehicles and avoid material vehicle recalls; our suppliers’ ability to deliver parts, systems and components at such times to allow us to meet production schedules; our ability to maintain adequate financing sources, including as required to fund our planned significant investment in new technology; our ability to realize successful vehicle applications of new technology; and our ability to continue to attract new customers, particularly for our new products. GM's most recent annual report on Form 10-K provides information about these and other factors, which we may revise or supplement in future reports to the SEC. 1
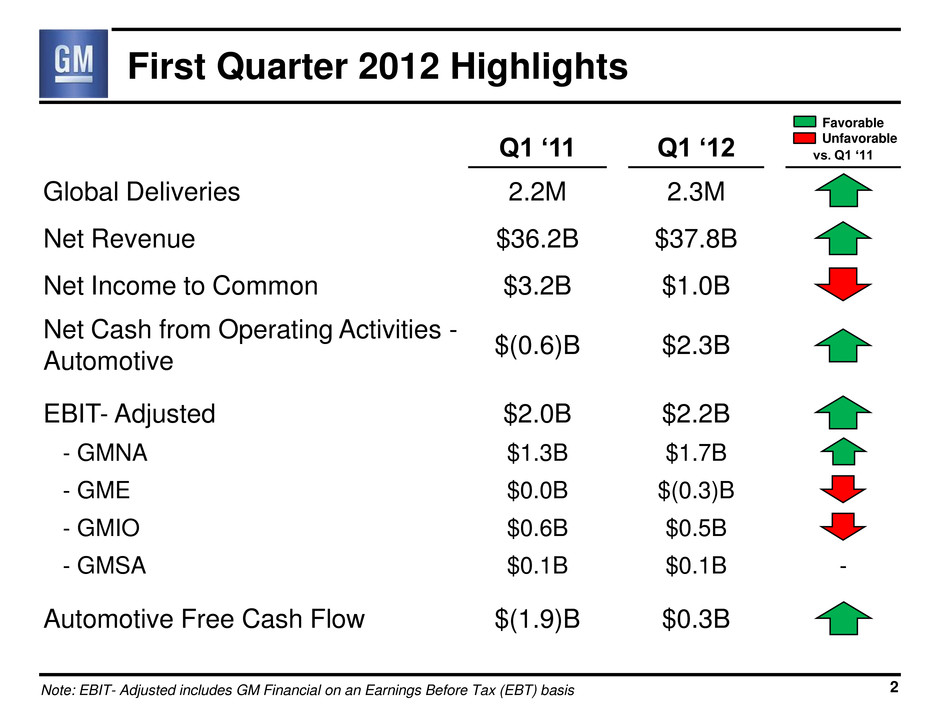
First Quarter 2012 Highlights 2 Q1 ‘11 Q1 ‘12 vs. Q1 ‘11 Global Deliveries 2.2M 2.3M Net Revenue $36.2B $37.8B Net Income to Common $3.2B $1.0B Net Cash from Operating Activities - Automotive $(0.6)B $2.3B EBIT- Adjusted $2.0B $2.2B - GMNA $1.3B $1.7B - GME $0.0B $(0.3)B - GMIO $0.6B $0.5B - GMSA $0.1B $0.1B - Automotive Free Cash Flow $(1.9)B $0.3B Favorable Unfavorable Note: EBIT- Adjusted includes GM Financial on an Earnings Before Tax (EBT) basis
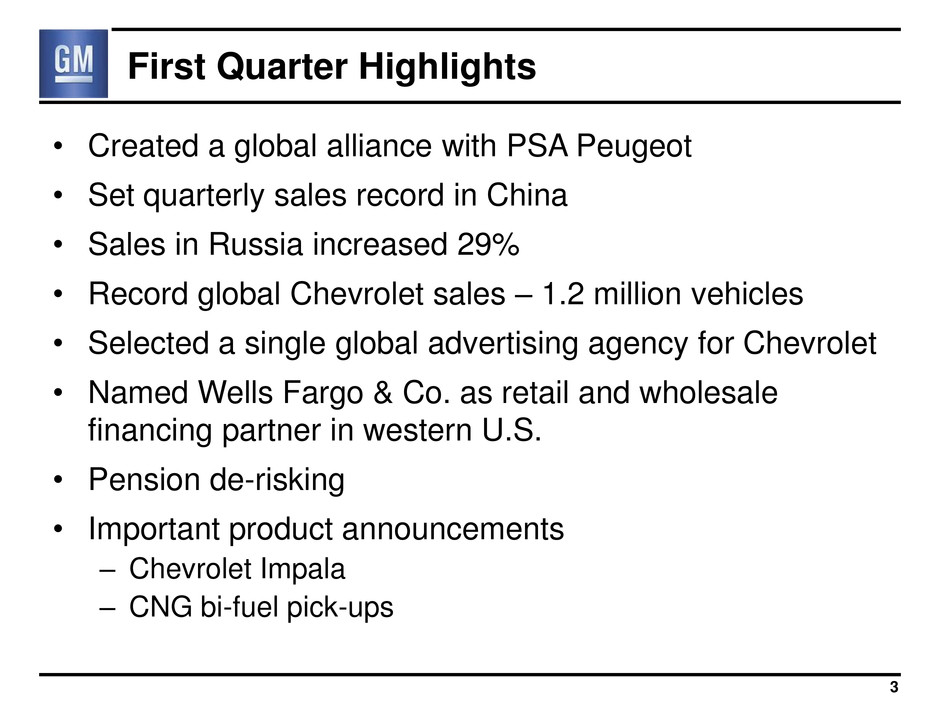
First Quarter Highlights • Created a global alliance with PSA Peugeot • Set quarterly sales record in China • Sales in Russia increased 29% • Record global Chevrolet sales – 1.2 million vehicles • Selected a single global advertising agency for Chevrolet • Named Wells Fargo & Co. as retail and wholesale financing partner in western U.S. • Pension de-risking • Important product announcements – Chevrolet Impala – CNG bi-fuel pick-ups 3
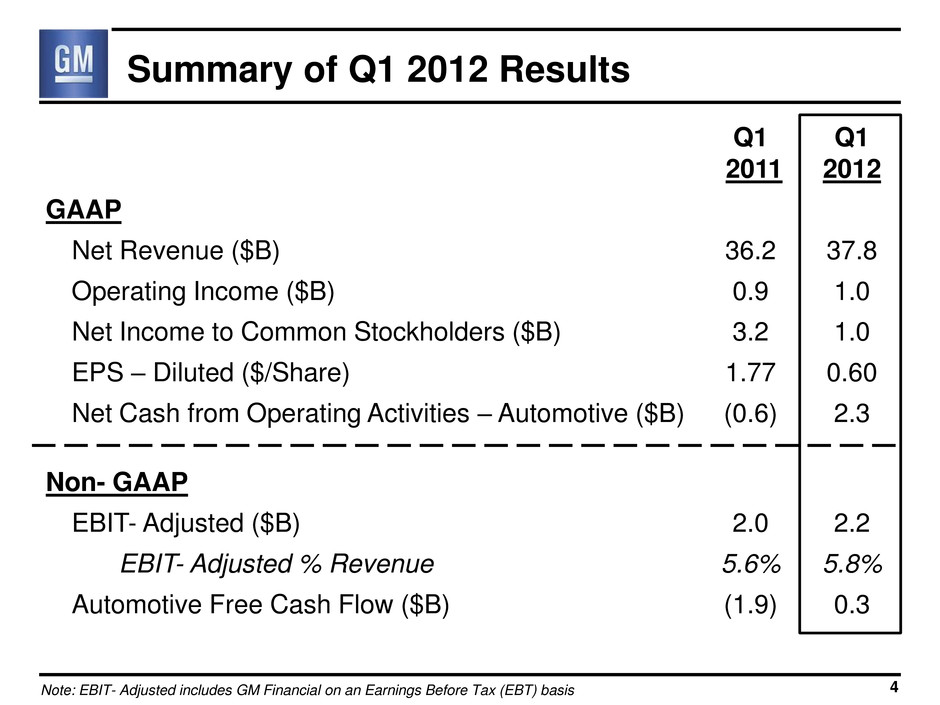
Q1 2011 Q1 2012 GAAP Net Revenue ($B) 36.2 37.8 Operating Income ($B) 0.9 1.0 Net Income to Common Stockholders ($B) 3.2 1.0 EPS – Diluted ($/Share) 1.77 0.60 Net Cash from Operating Activities – Automotive ($B) (0.6) 2.3 Non- GAAP EBIT- Adjusted ($B) 2.0 2.2 EBIT- Adjusted % Revenue 5.6% 5.8% Automotive Free Cash Flow ($B) (1.9) 0.3 Summary of Q1 2012 Results 4 Note: EBIT- Adjusted includes GM Financial on an Earnings Before Tax (EBT) basis
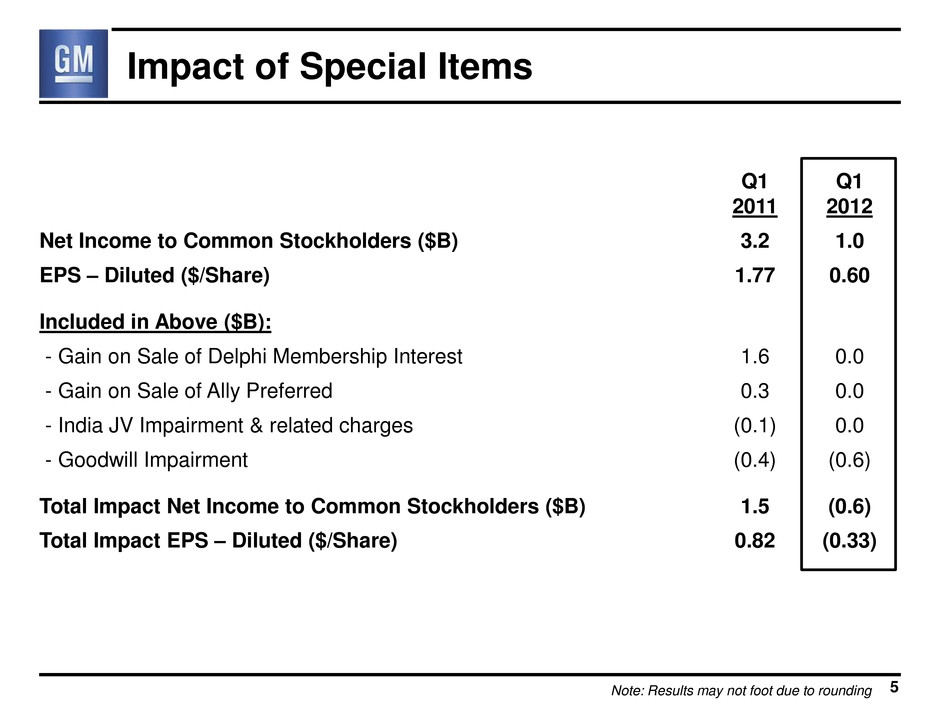
5 Q1 2011 Q1 2012 Net Income to Common Stockholders ($B) 3.2 1.0 EPS – Diluted ($/Share) 1.77 0.60 Included in Above ($B): - Gain on Sale of Delphi Membership Interest 1.6 0.0 - Gain on Sale of Ally Preferred 0.3 0.0 - India JV Impairment & related charges (0.1) 0.0 - Goodwill Impairment (0.4) (0.6) Total Impact Net Income to Common Stockholders ($B) 1.5 (0.6) Total Impact EPS – Diluted ($/Share) 0.82 (0.33) Note: Results may not foot due to rounding Impact of Special Items
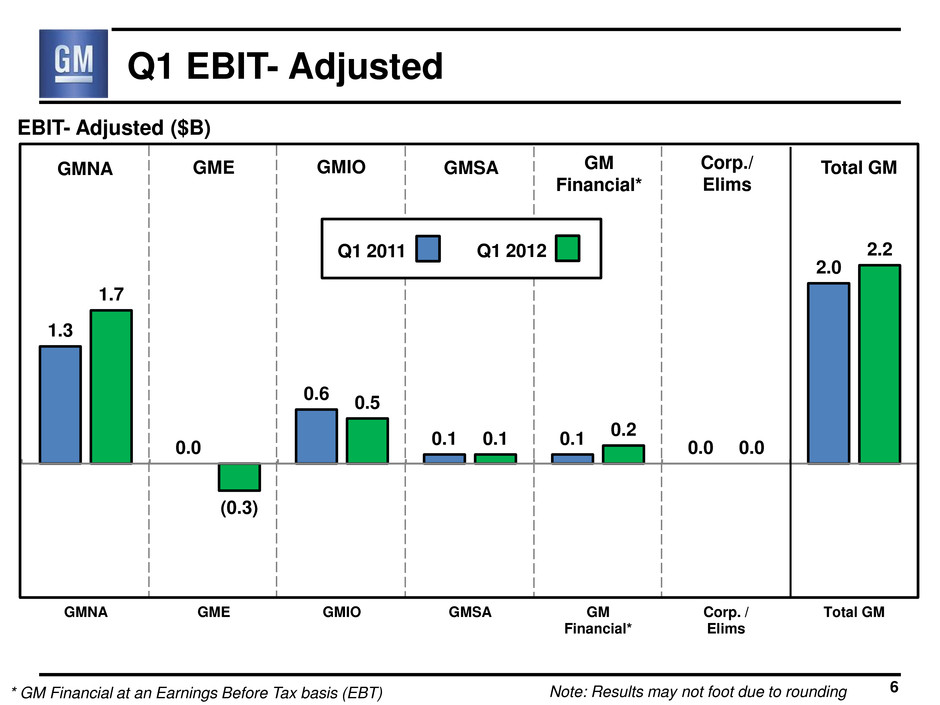
1.3 0.0 0.6 0.1 0.1 0.0 2.0 1.7 (0.3) 0.5 0.1 0.2 0.0 2.2 GMNA GME GMIO GMSA GM Financial* Corp. / Elims Total GM EBIT- Adjusted ($B) GMNA GME GMIO GMSA GM Financial* Corp./ Elims Total GM Q1 2011 Q1 2012 Note: Results may not foot due to rounding 6 Q1 EBIT- Adjusted * GM Financial at an Earnings Before Tax basis (EBT)

0.0 1.0 2.0 3.0 4.0 Q1 2011 Q2 2011 Q3 2011 Q4 2011 Q1 2012 Earnings Before Interest & Taxes - Adjusted ($B) Revenue ($B) 36.2 39.4 36.7 38.0 37.8 Oper. Inc % Rev 2.6% 6.2% 4.9% 1.2% 2.6% EBIT- Adj. % Rev 5.6% 7.5% 6.1% 2.9% 5.8% Production (000’s) 2,327 2,400 2,221 2,319 2,424 Global Share 11.4% 12.3% 12.1% 11.6% 11.3% 2.0 Note: EBIT- Adjusted includes GM Financial on an Earnings Before Tax (EBT) basis 7 3.0 2.2 1.1 2.2
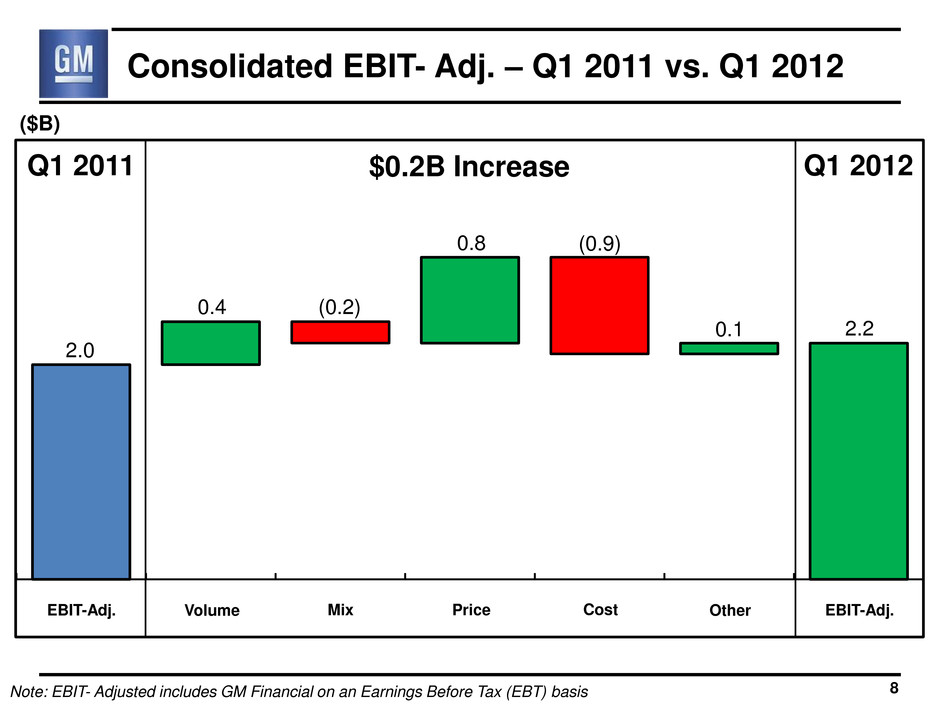
Consolidated EBIT- Adj. – Q1 2011 vs. Q1 2012 Q1 2011 Q1 2012 $0.2B Increase 8 Note: EBIT- Adjusted includes GM Financial on an Earnings Before Tax (EBT) basis EBIT-Adj. EBIT-Adj. Volume Price Cost Other Mix (0.2) 0.8 (0.9) 0.1 2.0 2.2 0.4 ($B)
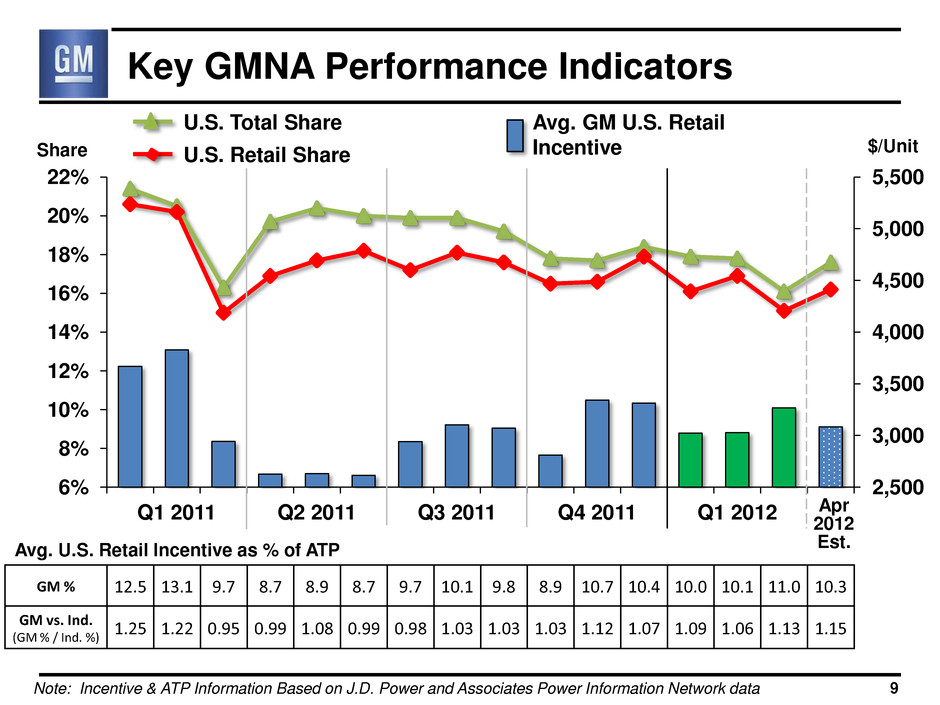
2,500 3,000 3,500 4,000 4,500 5,000 5,500 6% 8% 10% 12% 14% 16% 18% 20% 22% Q1 2011 Q2 2011 Q3 2011 Q4 2011 Q1 2012 Key GMNA Performance Indicators Avg. U.S. Retail Incentive as % of ATP GM % 12.5 13.1 9.7 8.7 8.9 8.7 9.7 10.1 9.8 8.9 10.7 10.4 10.0 10.1 11.0 10.3 GM vs. Ind. (GM % / Ind. %) 1.25 1.22 0.95 0.99 1.08 0.99 0.98 1.03 1.03 1.03 1.12 1.07 1.09 1.06 1.13 1.15 Share $/Unit U.S. Retail Share U.S. Total Share Avg. GM U.S. Retail Incentive Note: Incentive & ATP Information Based on J.D. Power and Associates Power Information Network data Apr 2012 Est. 9
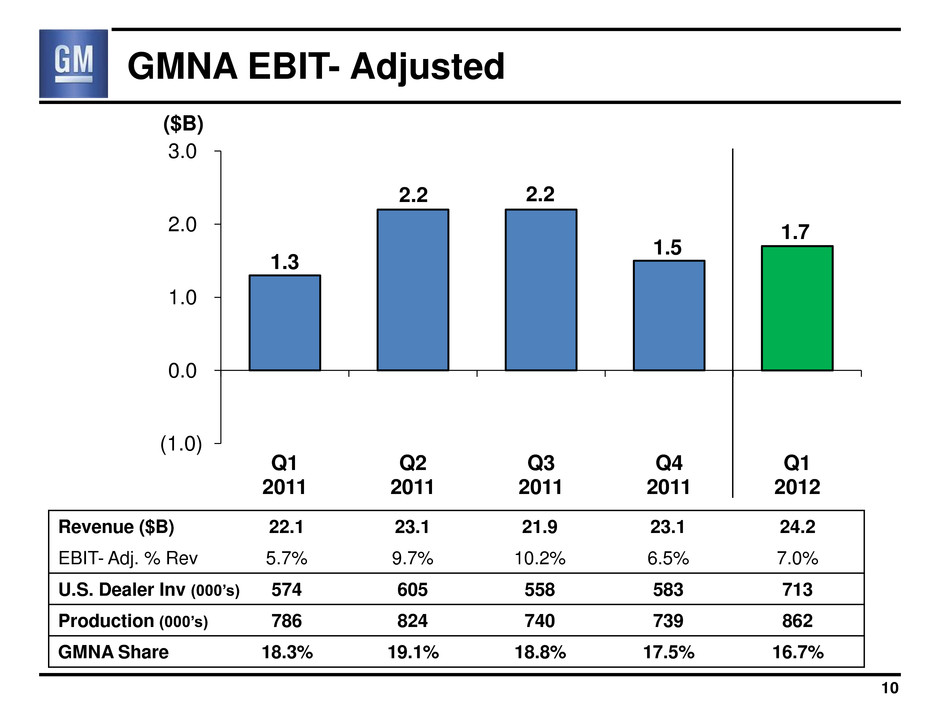
(1.0) 0.0 1.0 2.0 3.0 Q1 2011 Q2 2011 Q3 2011 Q4 2011 Q1 2012 GMNA EBIT- Adjusted ($B) Revenue ($B) 22.1 23.1 21.9 23.1 24.2 EBIT- Adj. % Rev 5.7% 9.7% 10.2% 6.5% 7.0% U.S. Dealer Inv (000’s) 574 605 558 583 713 Production (000’s) 786 824 740 739 862 GMNA Share 18.3% 19.1% 18.8% 17.5% 16.7% 1.3 10 2.2 2.2 1.5 1.7
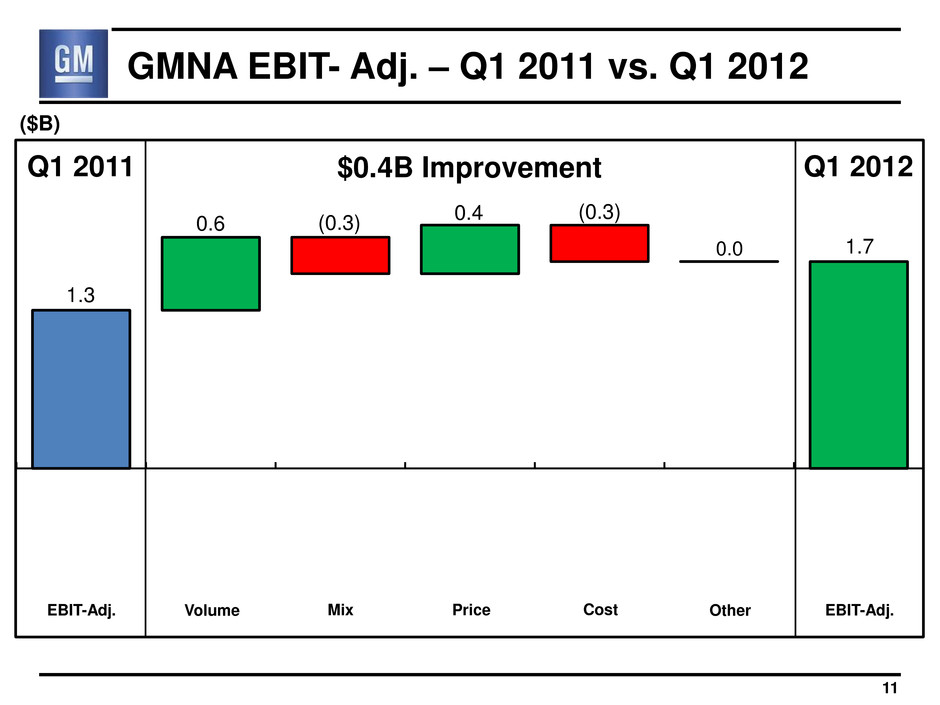
GMNA EBIT- Adj. – Q1 2011 vs. Q1 2012 Q1 2011 Q1 2012 $0.4B Improvement 0.4 0.6 (0.3) 0.0 1.3 1.7 11 (0.3) EBIT-Adj. EBIT-Adj. Volume Price Cost Other Mix ($B)
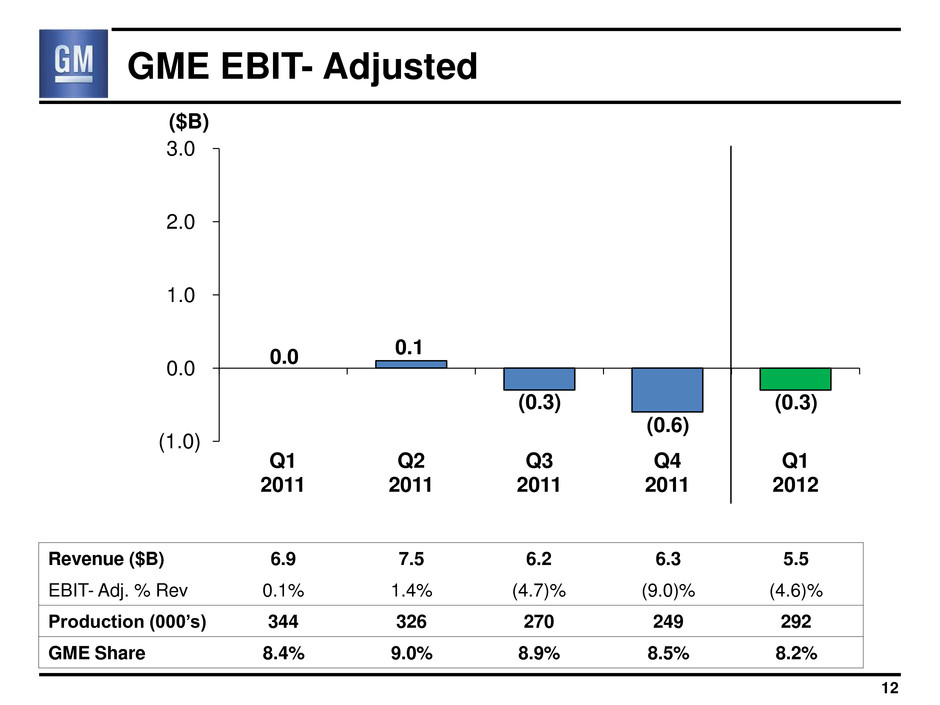
(1.0) 0.0 1.0 2.0 3.0 Q1 2011 Q2 2011 Q3 2011 Q4 2011 Q1 2012 GME EBIT- Adjusted ($B) Revenue ($B) 6.9 7.5 6.2 6.3 5.5 EBIT- Adj. % Rev 0.1% 1.4% (4.7)% (9.0)% (4.6)% Production (000’s) 344 326 270 249 292 GME Share 8.4% 9.0% 8.9% 8.5% 8.2% 0.0 12 0.1 (0.3) (0.6) (0.3)
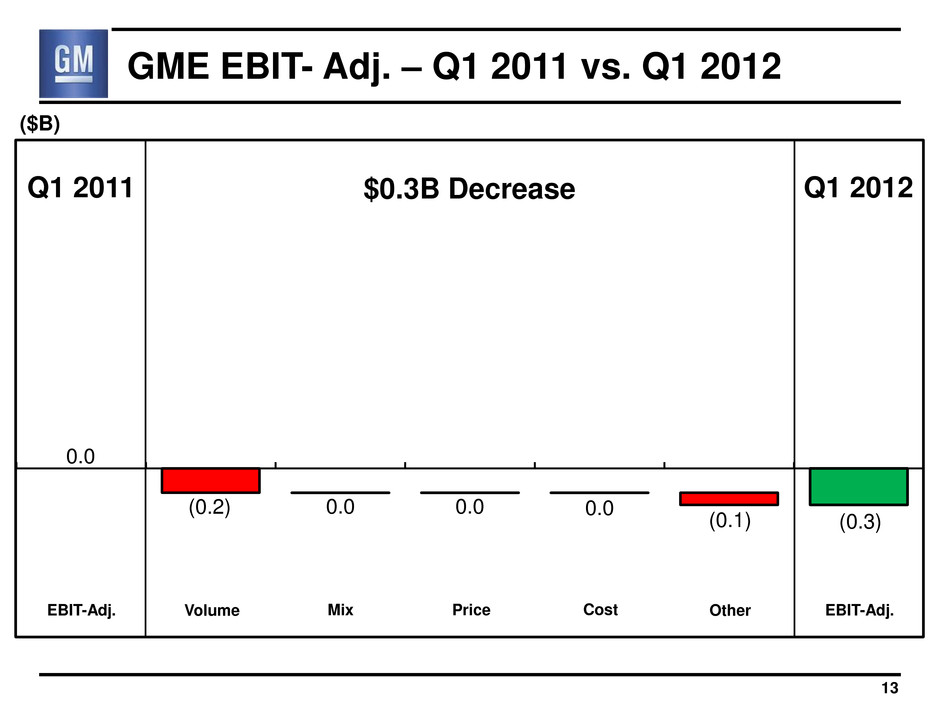
GME EBIT- Adj. – Q1 2011 vs. Q1 2012 Q1 2011 Q1 2012 $0.3B Decrease 0.0 (0.2) 0.0 (0.1) 0.0 (0.3) 13 0.0 EBIT-Adj. EBIT-Adj. Volume Price Cost Other Mix ($B)
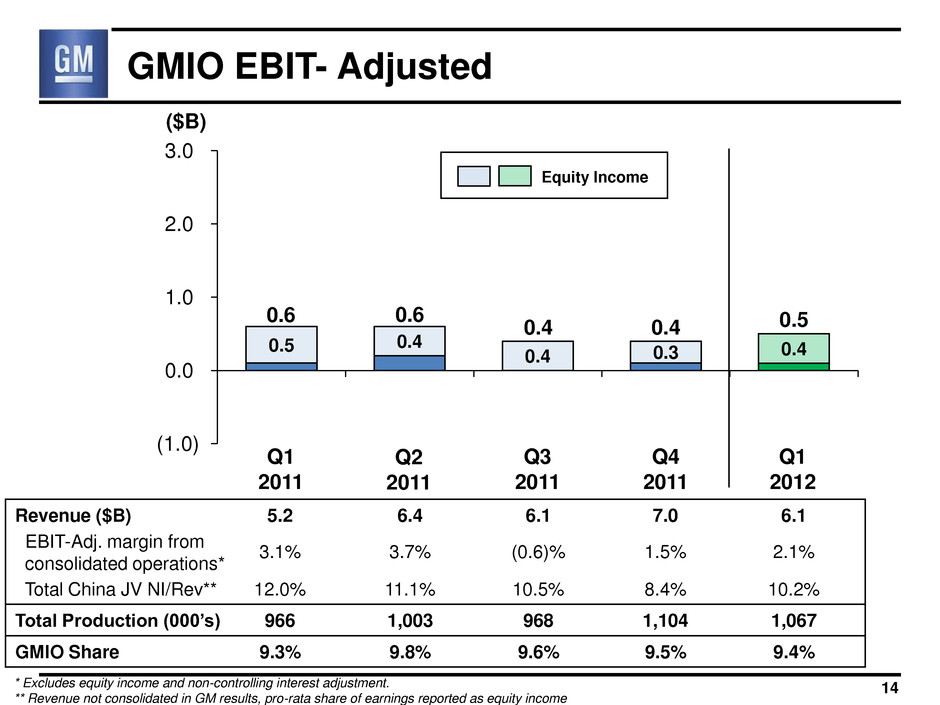
0.5 0.4 0.4 0.3 0.4 (1.0) 0.0 1.0 2.0 3.0 GMIO EBIT- Adjusted ($B) Revenue ($B) EBIT-Adj. margin from consolidated operations* Total China JV NI/Rev** 5.2 3.1% 12.0% 6.4 3.7% 11.1% 6.1 (0.6)% 10.5% 7.0 1.5% 8.4% 6.1 2.1% 10.2% Total Production (000’s) 966 1,003 968 1,104 1,067 GMIO Share 9.3% 9.8% 9.6% 9.5% 9.4% 0.6 14 0.6 Q1 2011 Q2 2011 Q3 2011 Q4 2011 Q1 2012 * Excludes equity income and non-controlling interest adjustment. ** Revenue not consolidated in GM results, pro-rata share of earnings reported as equity income 0.4 Equity Income 0.4 0.5
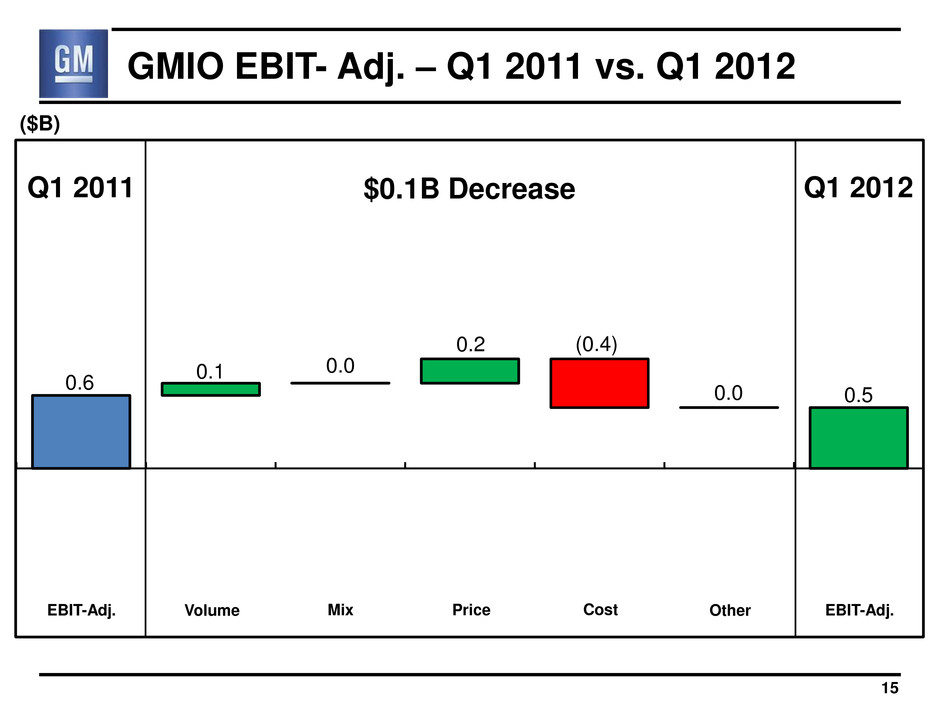
GMIO EBIT- Adj. – Q1 2011 vs. Q1 2012 Q1 2011 Q1 2012 $0.1B Decrease 0.2 0.1 (0.4) 0.0 0.6 0.5 15 0.0 EBIT-Adj. EBIT-Adj. Volume Price Cost Other Mix ($B)
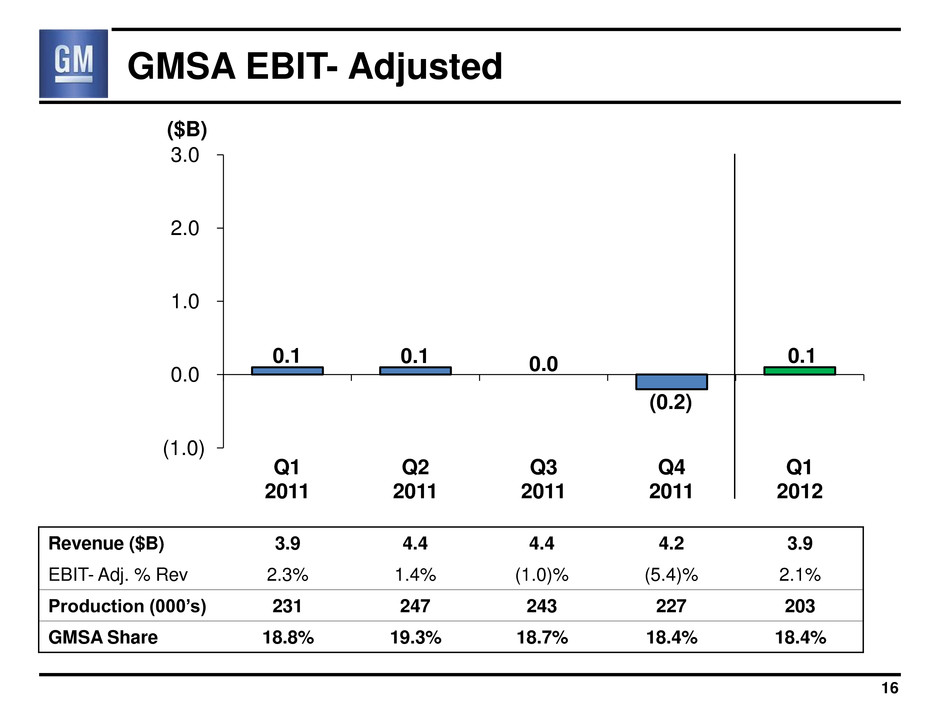
(1.0) 0.0 1.0 2.0 3.0 Q1 2011 Q2 2011 Q3 2011 Q4 2011 Q1 2012 GMSA EBIT- Adjusted ($B) Revenue ($B) 3.9 4.4 4.4 4.2 3.9 EBIT- Adj. % Rev 2.3% 1.4% (1.0)% (5.4)% 2.1% Production (000’s) 231 247 243 227 203 GMSA Share 18.8% 19.3% 18.7% 18.4% 18.4% 0.1 0.1 0.0 16 (0.2) 0.1
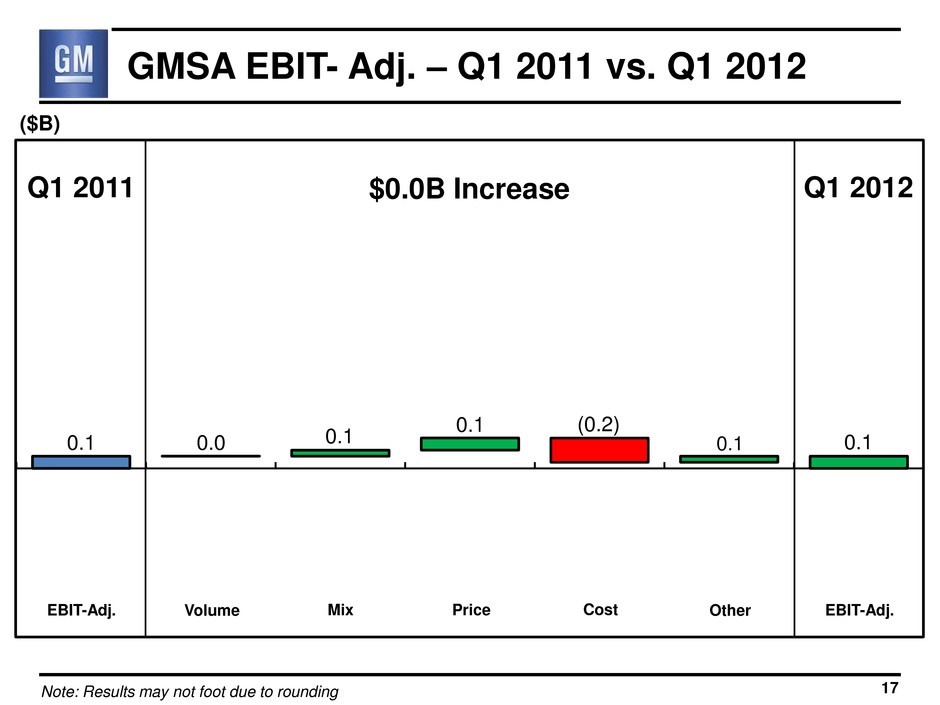
GMSA EBIT- Adj. – Q1 2011 vs. Q1 2012 Q1 2011 Q1 2012 $0.0B Increase 0.1 0.0 (0.2) 0.1 0.1 0.1 17 0.1 EBIT-Adj. EBIT-Adj. Volume Price Cost Other Mix ($B) Note: Results may not foot due to rounding
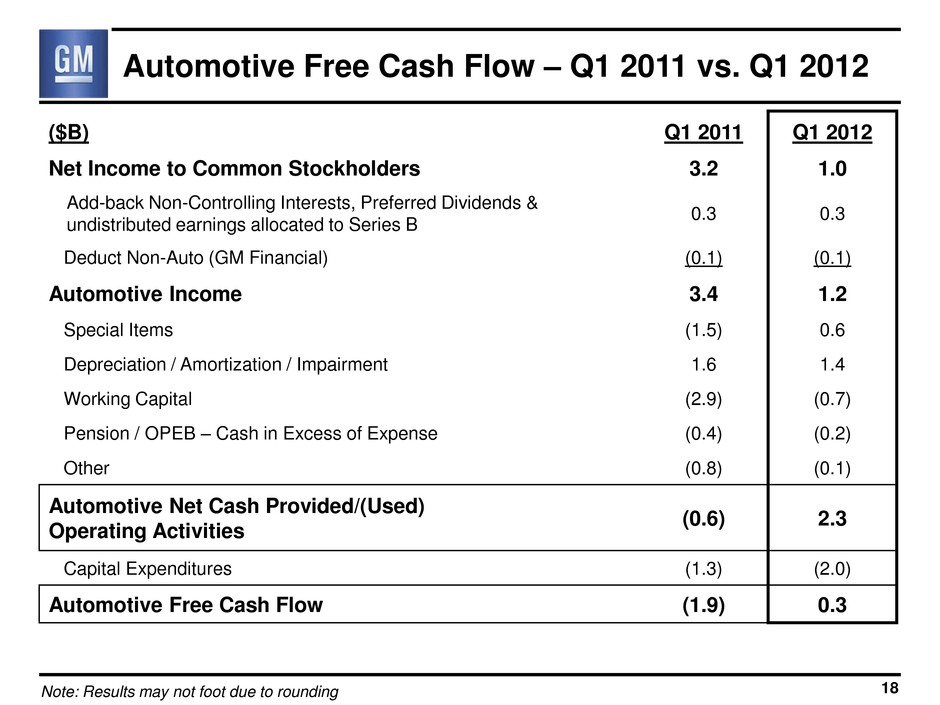
Automotive Free Cash Flow – Q1 2011 vs. Q1 2012 ($B) Q1 2011 Q1 2012 Net Income to Common Stockholders 3.2 1.0 Add-back Non-Controlling Interests, Preferred Dividends & undistributed earnings allocated to Series B 0.3 0.3 Deduct Non-Auto (GM Financial) (0.1) (0.1) Automotive Income 3.4 1.2 Special Items (1.5) 0.6 Depreciation / Amortization / Impairment 1.6 1.4 Working Capital (2.9) (0.7) Pension / OPEB – Cash in Excess of Expense (0.4) (0.2) Other (0.8) (0.1) Automotive Net Cash Provided/(Used) Operating Activities (0.6) 2.3 Capital Expenditures (1.3) (2.0) Automotive Free Cash Flow (1.9) 0.3 18 Note: Results may not foot due to rounding
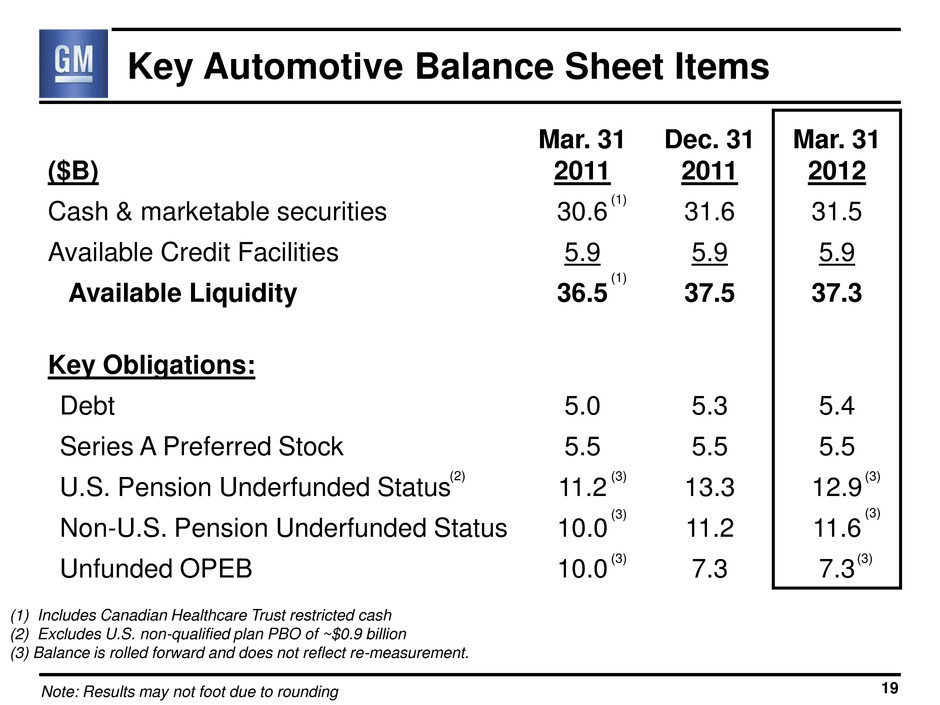
Key Automotive Balance Sheet Items ($B) Mar. 31 2011 Dec. 31 2011 Mar. 31 2012 Cash & marketable securities 30.6 31.6 31.5 Available Credit Facilities 5.9 5.9 5.9 Available Liquidity 36.5 37.5 37.3 Key Obligations: Debt 5.0 5.3 5.4 Series A Preferred Stock 5.5 5.5 5.5 U.S. Pension Underfunded Status 11.2 13.3 12.9 Non-U.S. Pension Underfunded Status 10.0 11.2 11.6 Unfunded OPEB 10.0 7.3 7.3 (1) Includes Canadian Healthcare Trust restricted cash (2) Excludes U.S. non-qualified plan PBO of ~$0.9 billion (3) Balance is rolled forward and does not reflect re-measurement. 19 (3) Note: Results may not foot due to rounding (3) (3) (3) (3) (3) (2) (1) (1)
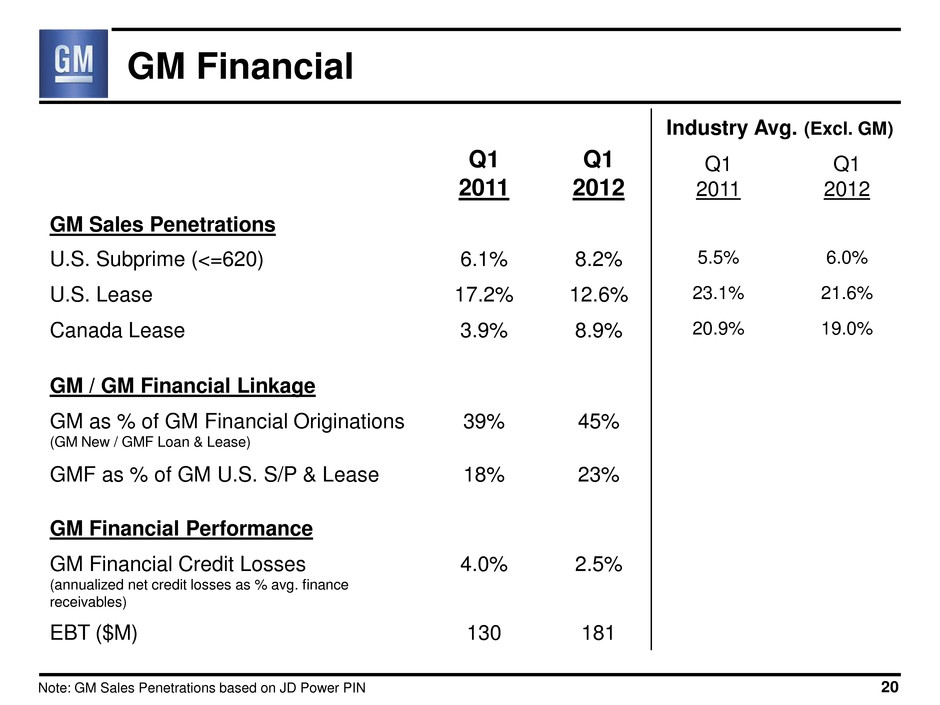
GM Financial Q1 2011 Q1 2012 Industry Avg. (Excl. GM) Q1 2011 Q1 2012 GM Sales Penetrations U.S. Subprime (<=620) 6.1% 8.2% 5.5% 6.0% U.S. Lease 17.2% 12.6% 23.1% 21.6% Canada Lease 3.9% 8.9% 20.9% 19.0% GM / GM Financial Linkage GM as % of GM Financial Originations (GM New / GMF Loan & Lease) 39% 45% GMF as % of GM U.S. S/P & Lease 18% 23% GM Financial Performance GM Financial Credit Losses (annualized net credit losses as % avg. finance receivables) 4.0% 2.5% EBT ($M) 130 181 20 Note: GM Sales Penetrations based on JD Power PIN
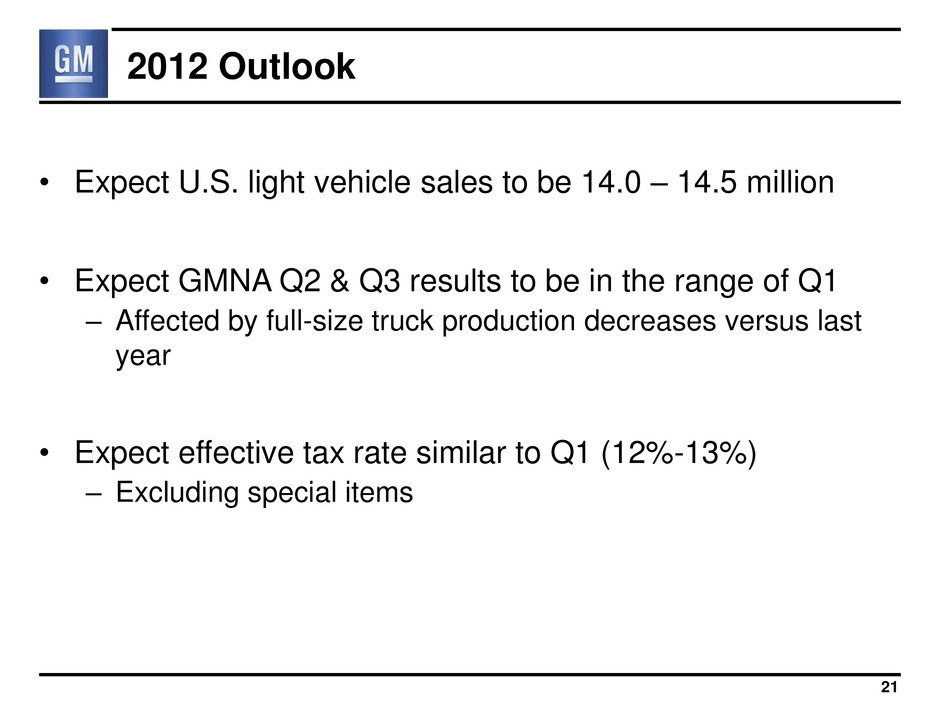
• Expect U.S. light vehicle sales to be 14.0 – 14.5 million • Expect GMNA Q2 & Q3 results to be in the range of Q1 – Affected by full-size truck production decreases versus last year • Expect effective tax rate similar to Q1 (12%-13%) – Excluding special items 21 2012 Outlook
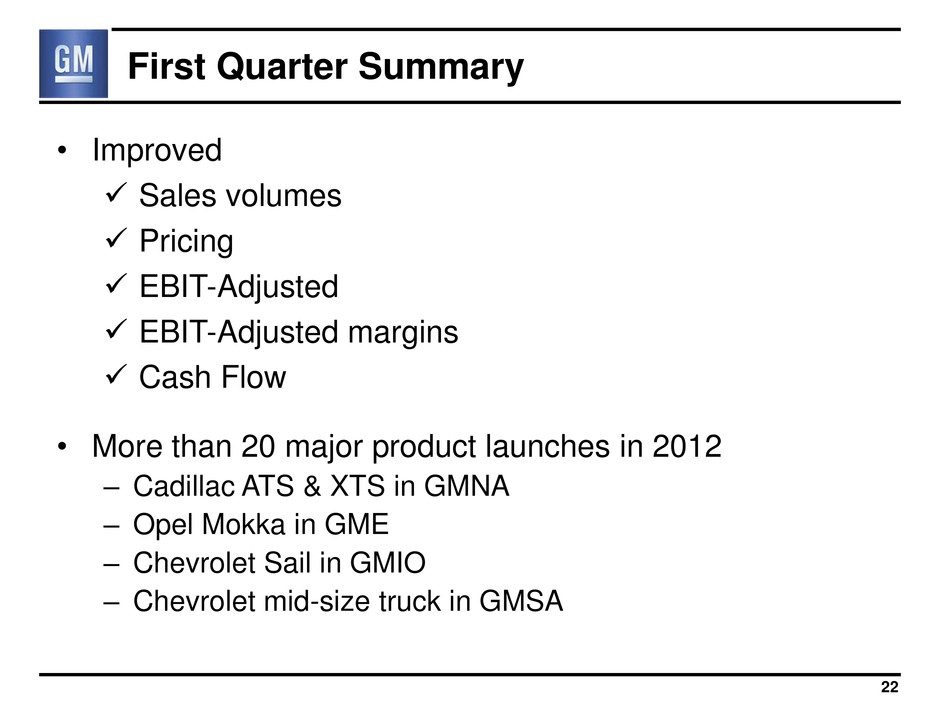
First Quarter Summary • Improved Sales volumes Pricing EBIT-Adjusted EBIT-Adjusted margins Cash Flow • More than 20 major product launches in 2012 – Cadillac ATS & XTS in GMNA – Opel Mokka in GME – Chevrolet Sail in GMIO – Chevrolet mid-size truck in GMSA 22
General Motors Company Select Supplemental Financial Information
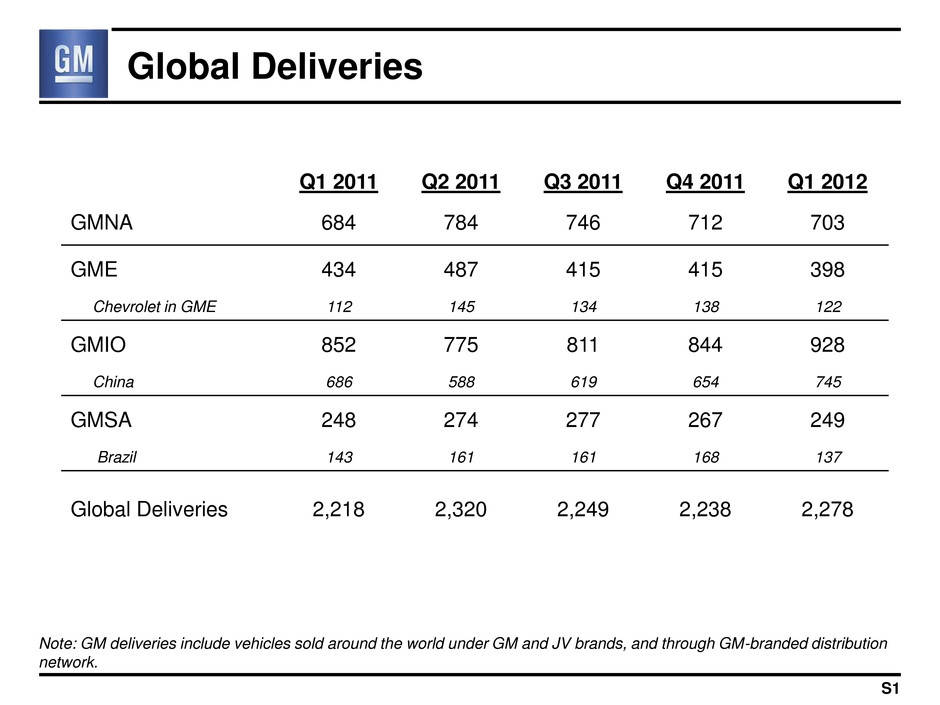
Global Deliveries Note: GM deliveries include vehicles sold around the world under GM and JV brands, and through GM-branded distribution network. S1 Q1 2011 Q2 2011 Q3 2011 Q4 2011 Q1 2012 GMNA 684 784 746 712 703 GME 434 487 415 415 398 Chevrolet in GME 112 145 134 138 122 GMIO 852 775 811 844 928 China 686 588 619 654 745 GMSA 248 274 277 267 249 Brazil 143 161 161 168 137 Global Deliveries 2,218 2,320 2,249 2,238 2,278
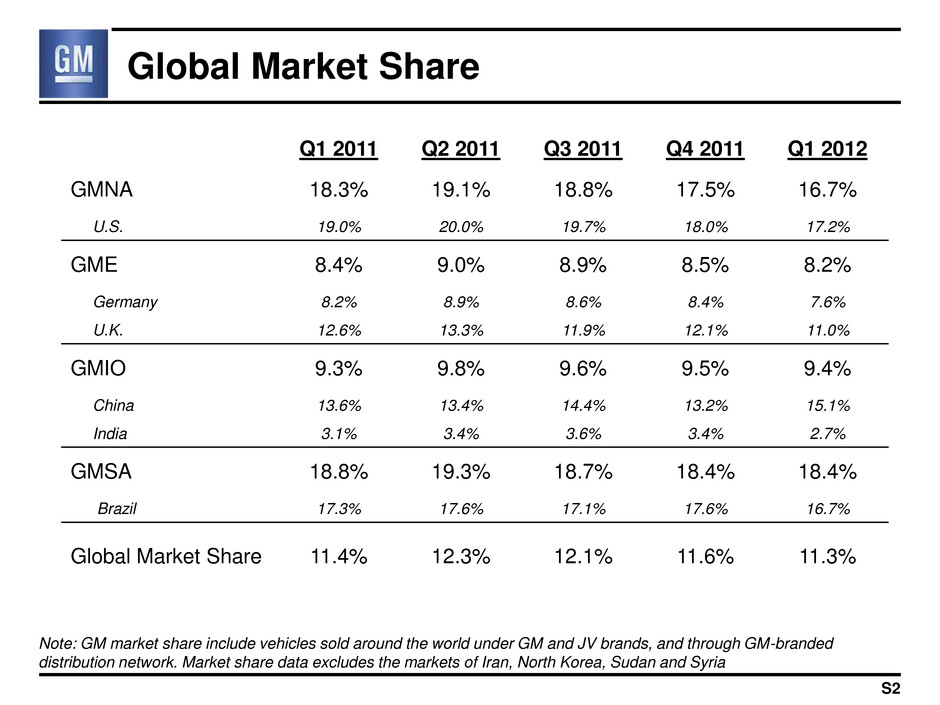
Global Market Share Note: GM market share include vehicles sold around the world under GM and JV brands, and through GM-branded distribution network. Market share data excludes the markets of Iran, North Korea, Sudan and Syria S2 Q1 2011 Q2 2011 Q3 2011 Q4 2011 Q1 2012 GMNA 18.3% 19.1% 18.8% 17.5% 16.7% U.S. 19.0% 20.0% 19.7% 18.0% 17.2% GME 8.4% 9.0% 8.9% 8.5% 8.2% Germany 8.2% 8.9% 8.6% 8.4% 7.6% U.K. 12.6% 13.3% 11.9% 12.1% 11.0% GMIO 9.3% 9.8% 9.6% 9.5% 9.4% China 13.6% 13.4% 14.4% 13.2% 15.1% India 3.1% 3.4% 3.6% 3.4% 2.7% GMSA 18.8% 19.3% 18.7% 18.4% 18.4% Brazil 17.3% 17.6% 17.1% 17.6% 16.7% Global Market Share 11.4% 12.3% 12.1% 11.6% 11.3%
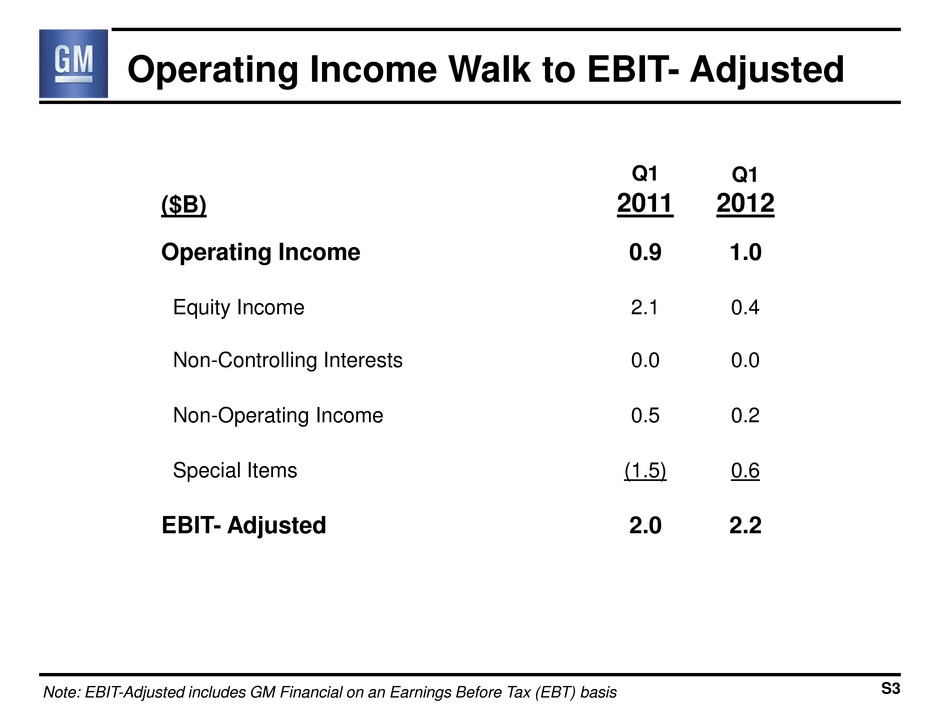
Operating Income Walk to EBIT- Adjusted ($B) Q1 2011 Q1 2012 Operating Income 0.9 1.0 Equity Income 2.1 0.4 Non-Controlling Interests 0.0 0.0 Non-Operating Income 0.5 0.2 Special Items (1.5) 0.6 EBIT- Adjusted 2.0 2.2 Note: EBIT-Adjusted includes GM Financial on an Earnings Before Tax (EBT) basis S3
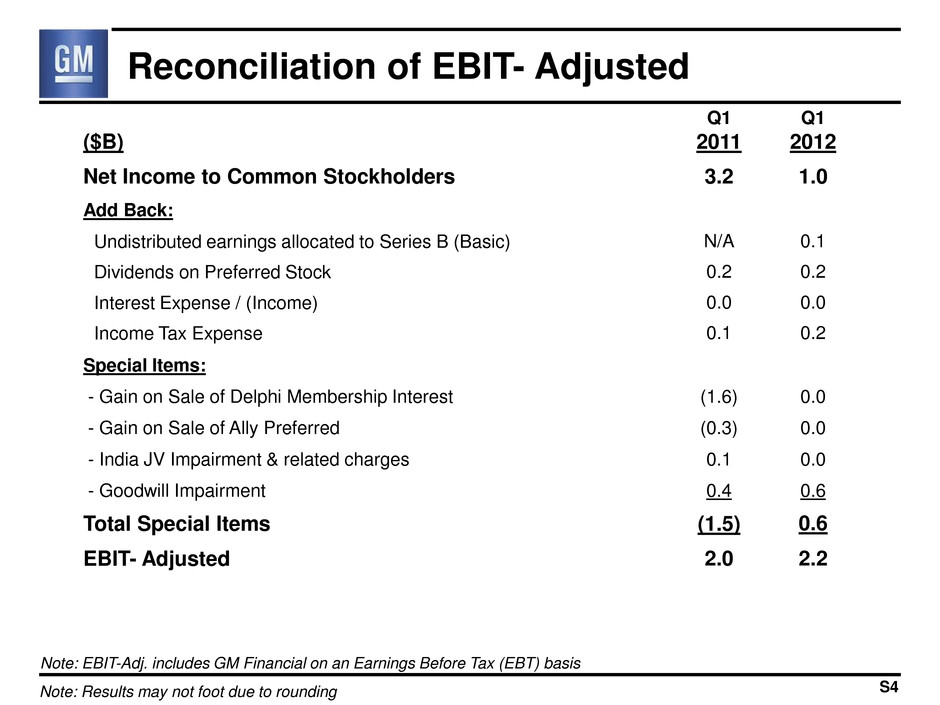
Reconciliation of EBIT- Adjusted ($B) Q1 2011 Q1 2012 Net Income to Common Stockholders 3.2 1.0 Add Back: Undistributed earnings allocated to Series B (Basic) N/A 0.1 Dividends on Preferred Stock 0.2 0.2 Interest Expense / (Income) 0.0 0.0 Income Tax Expense 0.1 0.2 Special Items: - Gain on Sale of Delphi Membership Interest (1.6) 0.0 - Gain on Sale of Ally Preferred (0.3) 0.0 - India JV Impairment & related charges 0.1 0.0 - Goodwill Impairment 0.4 0.6 Total Special Items (1.5) 0.6 EBIT- Adjusted 2.0 2.2 Note: Results may not foot due to rounding S4 Note: EBIT-Adj. includes GM Financial on an Earnings Before Tax (EBT) basis
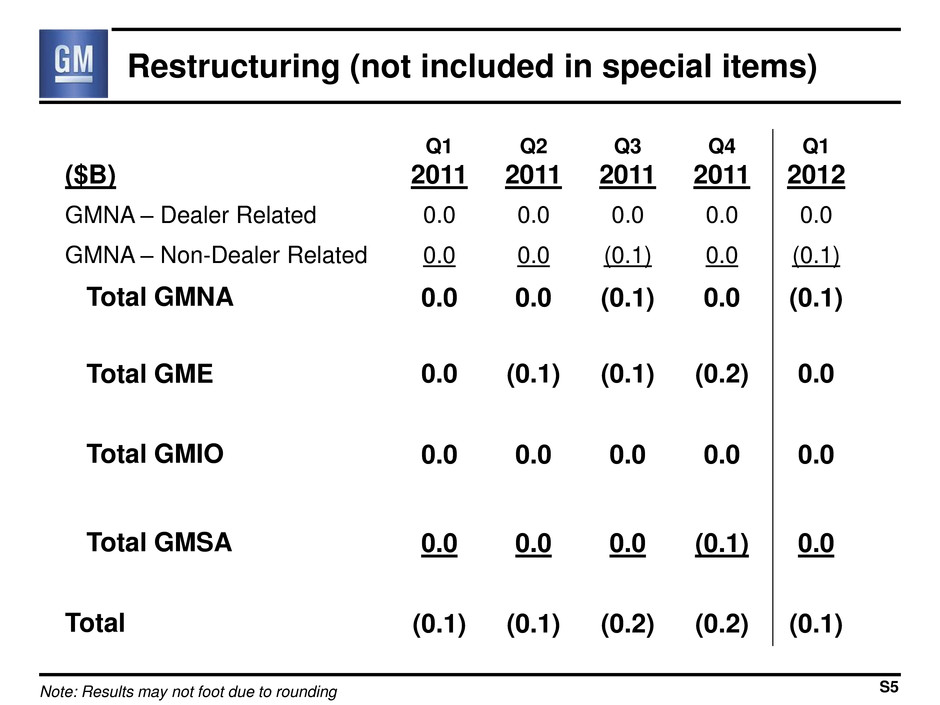
Restructuring (not included in special items) ($B) Q1 2011 Q2 2011 Q3 2011 Q4 2011 Q1 2012 GMNA – Dealer Related 0.0 0.0 0.0 0.0 0.0 GMNA – Non-Dealer Related 0.0 0.0 (0.1) 0.0 (0.1) Total GMNA 0.0 0.0 (0.1) 0.0 (0.1) Total GME 0.0 (0.1) (0.1) (0.2) 0.0 Total GMIO 0.0 0.0 0.0 0.0 0.0 Total GMSA 0.0 0.0 0.0 (0.1) 0.0 Total (0.1) (0.1) (0.2) (0.2) (0.1) S5 Note: Results may not foot due to rounding
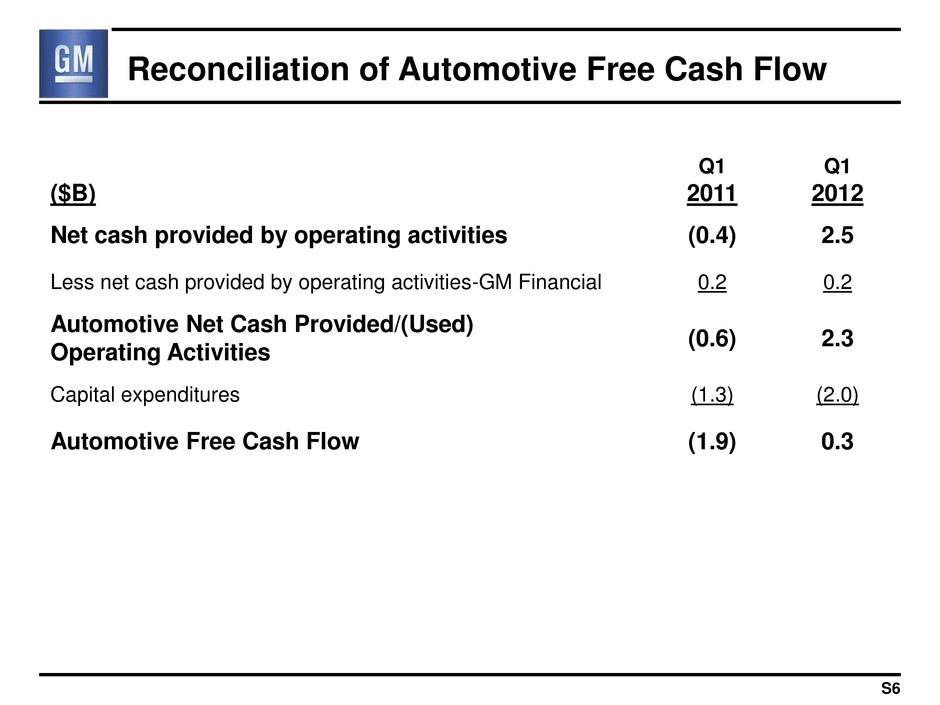
Reconciliation of Automotive Free Cash Flow ($B) Q1 2011 Q1 2012 Net cash provided by operating activities (0.4) 2.5 Less net cash provided by operating activities-GM Financial 0.2 0.2 Automotive Net Cash Provided/(Used) Operating Activities (0.6) 2.3 Capital expenditures (1.3) (2.0) Automotive Free Cash Flow (1.9) 0.3 S6
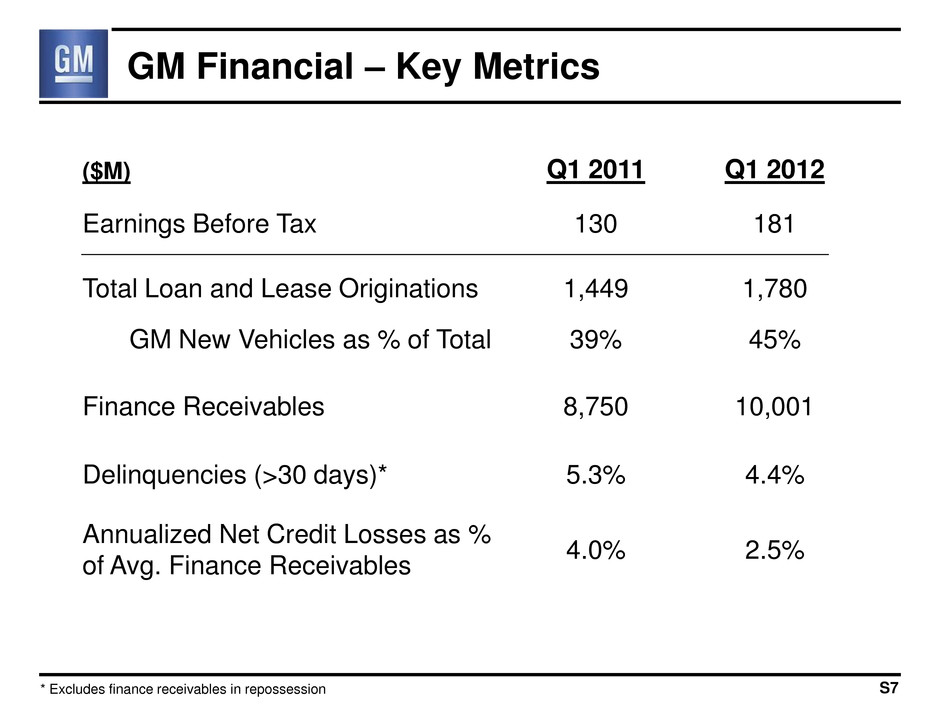
GM Financial – Key Metrics ($M) Q1 2011 Q1 2012 Earnings Before Tax 130 181 Total Loan and Lease Originations 1,449 1,780 GM New Vehicles as % of Total 39% 45% Finance Receivables 8,750 10,001 Delinquencies (>30 days)* 5.3% 4.4% Annualized Net Credit Losses as % of Avg. Finance Receivables 4.0% 2.5% S7 * Excludes finance receivables in repossession
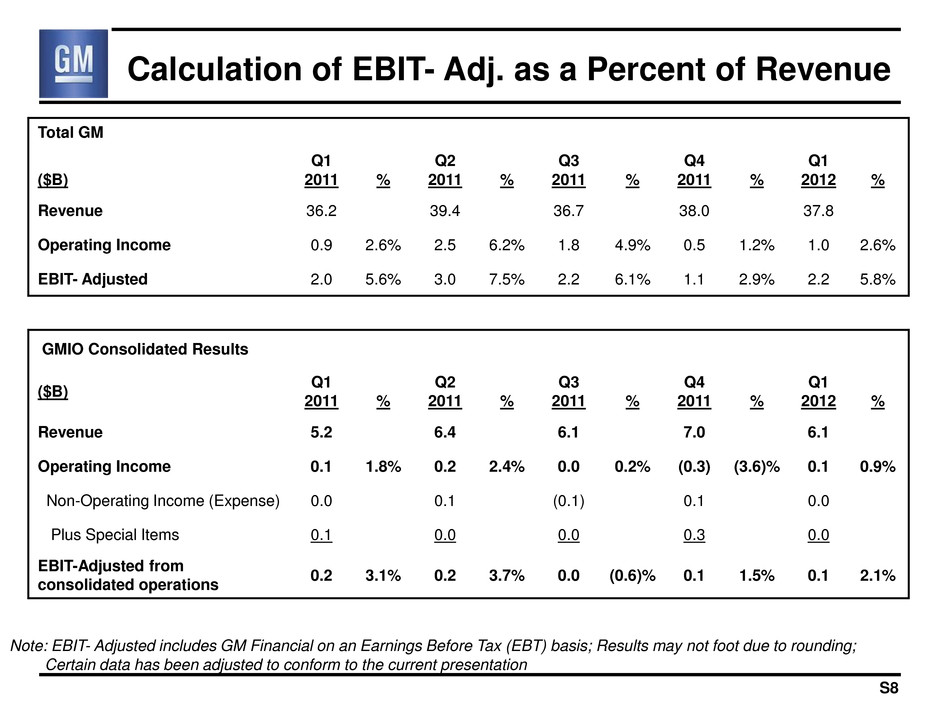
Calculation of EBIT- Adj. as a Percent of Revenue Total GM ($B) Q1 2011 % Q2 2011 % Q3 2011 % Q4 2011 % Q1 2012 % Revenue 36.2 39.4 36.7 38.0 37.8 Operating Income 0.9 2.6% 2.5 6.2% 1.8 4.9% 0.5 1.2% 1.0 2.6% EBIT- Adjusted 2.0 5.6% 3.0 7.5% 2.2 6.1% 1.1 2.9% 2.2 5.8% GMIO Consolidated Results ($B) Q1 2011 % Q2 2011 % Q3 2011 % Q4 2011 % Q1 2012 % Revenue 5.2 6.4 6.1 7.0 6.1 Operating Income 0.1 1.8% 0.2 2.4% 0.0 0.2% (0.3) (3.6)% 0.1 0.9% Non-Operating Income (Expense) 0.0 0.1 (0.1) 0.1 0.0 Plus Special Items 0.1 0.0 0.0 0.3 0.0 EBIT-Adjusted from consolidated operations 0.2 3.1% 0.2 3.7% 0.0 (0.6)% 0.1 1.5% 0.1 2.1% Note: EBIT- Adjusted includes GM Financial on an Earnings Before Tax (EBT) basis; Results may not foot due to rounding; Certain data has been adjusted to conform to the current presentation S8
