Attached files
| file | filename |
|---|---|
| 8-K - FORM 8-K - CAPITAL SENIOR LIVING CORP | d345771d8k.htm |
| EX-99.1 - EX-99.1 - CAPITAL SENIOR LIVING CORP | d345771dex991.htm |
Exhibit 99.2
| Capital Senior Living Corporation |
| Forward-Looking Statements The forward-looking statements in this presentation are subject to certain risks and uncertainties that could cause results to differ materially, including, but not without limitation to, the Company's ability to complete the refinancing of certain of our wholly owned communities, realize the anticipated savings related to such financing, find suitable acquisition properties at favorable terms, financing, licensing, business conditions, risks of downturns in economic conditions generally, satisfaction of closing conditions such as those pertaining to licensures, availability of insurance at commercially reasonable rates and changes in accounting principles and interpretations among others, and other risks and factors identified from time to time in our reports filed with the Securities and Exchange Commission The Company assumes no obligation to update or supplement forward-looking statements in this presentation that become untrue because of new information, subsequent events or otherwise. 2 |
| Investment Highlights Value leader in providing quality seniors housing and care at reasonable prices Industry enjoys favorable demographic and supply/demand trends Substantially all private pay and need-driven business with strong cash flow generation Improving occupancy and revenue growth Executing on accretive growth initiatives through acquisitions and conversions to higher levels of care Solid Balance Sheet 3 |
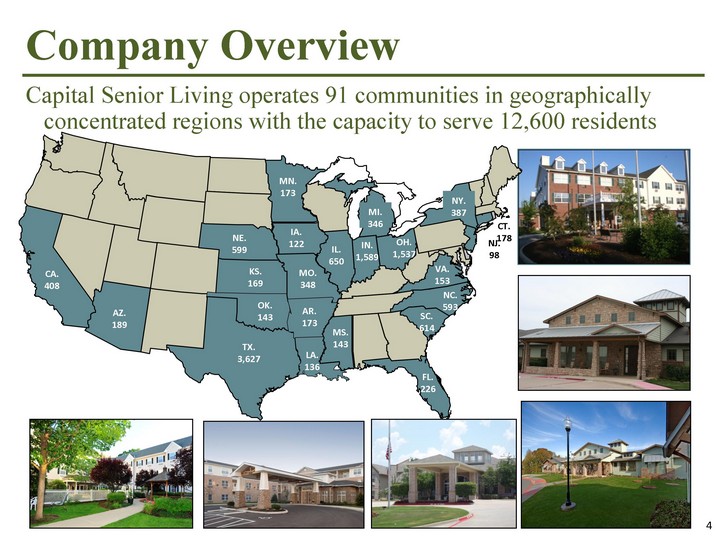
| Company Overview Capital Senior Living operates 91 communities in geographically concentrated regions with the capacity to serve 12,600 residents CA. 408 AR. 173 AZ. 189 CT. 178 FL. 226 IA. 122 IL. 650 IN. 1,589 KS. 169 LA. 136 MI. 346 MN. 173 MO. 348 MS. 143 NC. 593 SC. 614 NE. 599 NJ. 98 NY. 387 OH. 1,537 OK. 143 TX. 3,627 VA. 153 4 |
| Resident Demographics at CSU Communities Average age of resident: 85 years Average age of resident moving in: 82 years Average stay period: 2-3 years Percent of female residents: 80% Resident turnover is primarily attributed to death or need for higher care 5 |
| The Capital Advantage: Senior Living Options Average 120 units per IL community with large common areas and amenities Supportive services, wellness programs, social, recreational, and educational events Average monthly rate of $2,380 100% private pay Average length of resident stay is 34 months Independent Living - 56% of Resident Capacity 6 |
| The Capital Advantage: Senior Living Options Average 67 units per AL community 70% of communities offer AL units Assistance with activities of daily living such as medication reminders, bathing, dressing and grooming Average monthly rate of $3,670 Substantially all private pay Average length of resident stay is 26 months Assisted Living - 39% of Resident Capacity 7 |
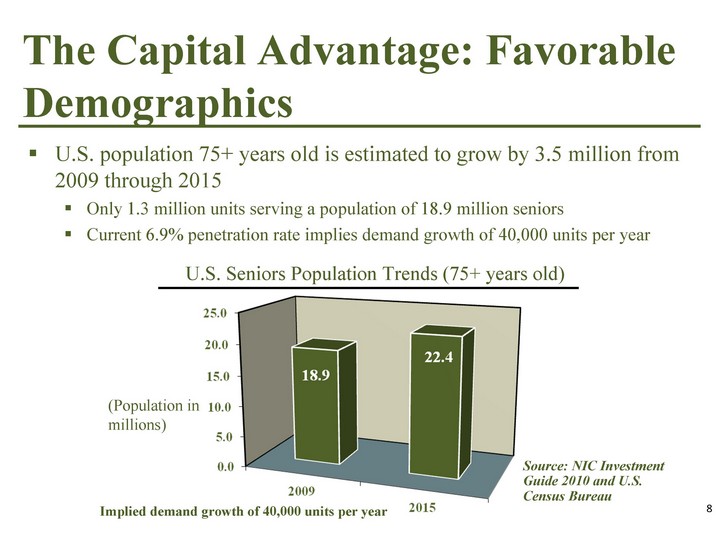
| The Capital Advantage: Favorable Demographics U.S. population 75+ years old is estimated to grow by 3.5 million from 2009 through 2015 Only 1.3 million units serving a population of 18.9 million seniors Current 6.9% penetration rate implies demand growth of 40,000 units per year (Population in millions) Source: NIC Investment Guide 2010 and U.S. Census Bureau U.S. Seniors Population Trends (75+ years old) Implied demand growth of 40,000 units per year 8 |
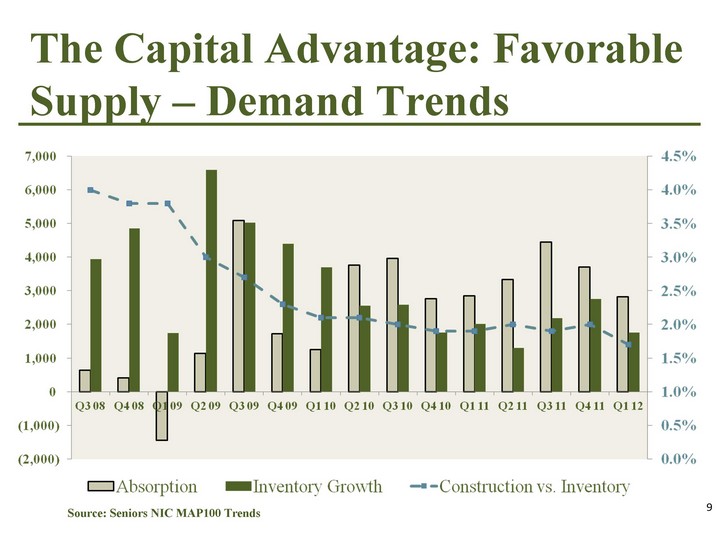
| The Capital Advantage: Favorable Supply - Demand Trends Source: Seniors NIC MAP100 Trends 9 |
| The Capital Advantage: Competitive Strengths Value leader in geographically concentrated regions Experienced on-site, regional, and corporate management Larger company economies of scale and proprietary systems that yield operating efficiencies in highly fragmented industry Strong institutional relationships (debt and equity) Solid reputation in industry and 95% resident satisfaction Employer of choice Solid balance sheet Strong Board of Directors 10 |

| The Capital Advantage: Strategy Focus on our core strengths Maximize the cash flow generated by our communities and our operations Enhance geographic concentration and maximize competitive strengths within each of our markets Increase levels of care through conversions to AL or MC units and acquisition of communities with levels of care Employ technology to enhance marketing, operations and care Capitalize on the fragmented nature of the senior living industry to strategically aggregate local and regional operators Attract and retain the best talent in the senior living industry 11 |
| 2012 Business Plan Focused on operations, marketing and growth to enhance shareholder value through: Organic growth Proactive expense management Accretive acquisitions and conversions Utilization of technology 12 |
| 2012 Business Plan : Organic Growth Increase average rents Each 3% increase generates $8.5M of revenue Improve occupancies Each 1% generates $3M of revenue, $2M of EBITDAR and $0.05 per share of CFFO Convert units to higher levels of care Incremental $6M of revenue and $3.6M of EBITDAR Cash flow enhancing renovations and refurbishments Internet marketing and web-site enhancements Implement software programs to optimize care plans and levels of care charges 13 |
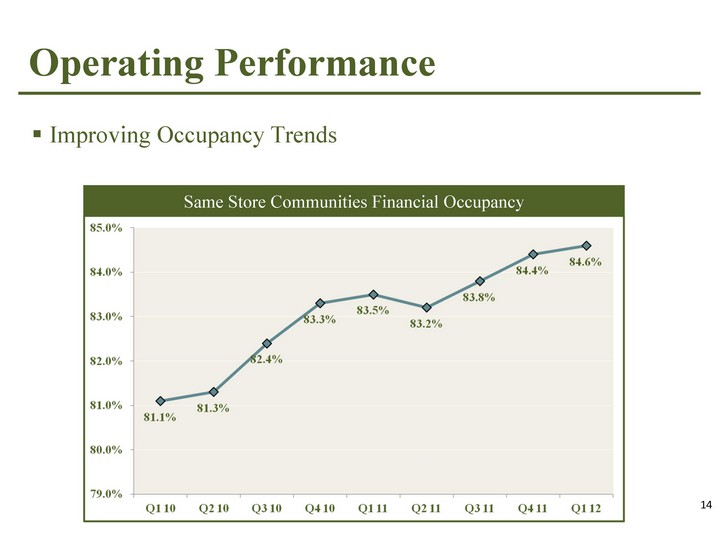
| Operating Performance 14 Improving Occupancy Trends Same Store Communities Financial Occupancy |
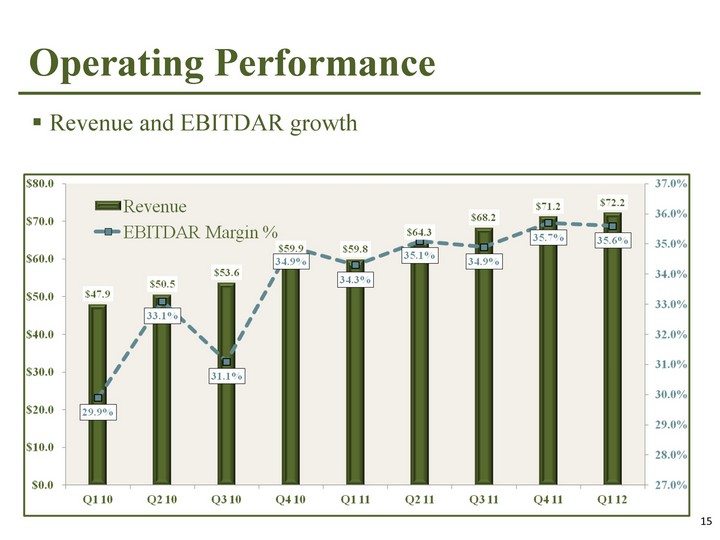
| Operating Performance 15 Revenue and EBITDAR growth |
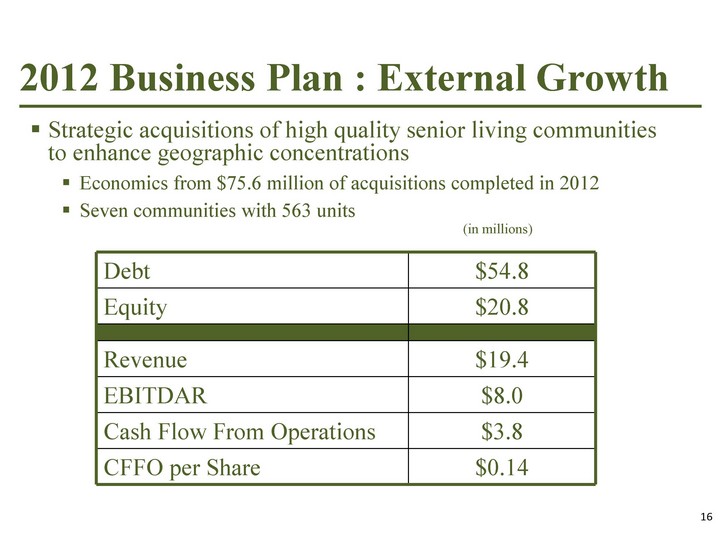
| 2012 Business Plan : External Growth Strategic acquisitions of high quality senior living communities to enhance geographic concentrations Economics from $75.6 million of acquisitions completed in 2012 Seven communities with 563 units Debt $54.8 Equity $20.8 Revenue $19.4 EBITDAR $8.0 Cash Flow From Operations $3.8 CFFO per Share $0.14 (in millions) 16 |
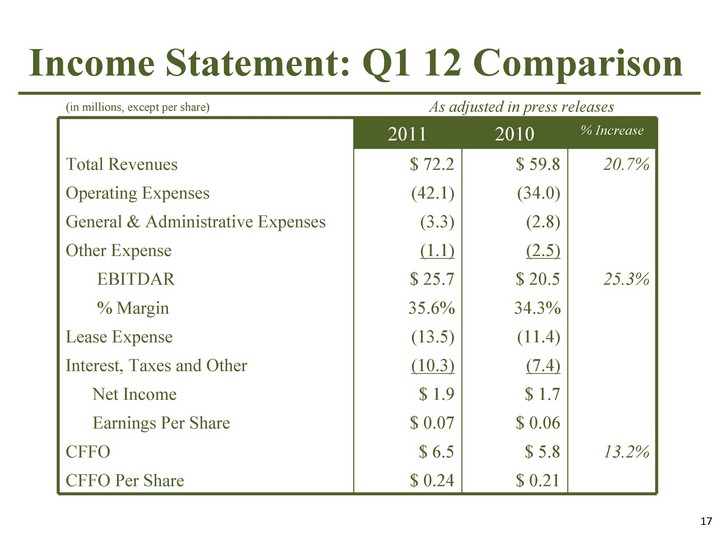
| Income Statement: Q1 12 Comparison 2011 2010 % Increase Total Revenues $ 72.2 $ 59.8 20.7% Operating Expenses (42.1) (34.0) General & Administrative Expenses (3.3) (2.8) Other Expense (1.1) (2.5) EBITDAR $ 25.7 $ 20.5 25.3% % Margin 35.6% 34.3% Lease Expense (13.5) (11.4) Interest, Taxes and Other (10.3) (7.4) Net Income $ 1.9 $ 1.7 Earnings Per Share $ 0.07 $ 0.06 CFFO $ 6.5 $ 5.8 13.2% CFFO Per Share $ 0.24 $ 0.21 As adjusted in press releases (in millions, except per share) 17 |
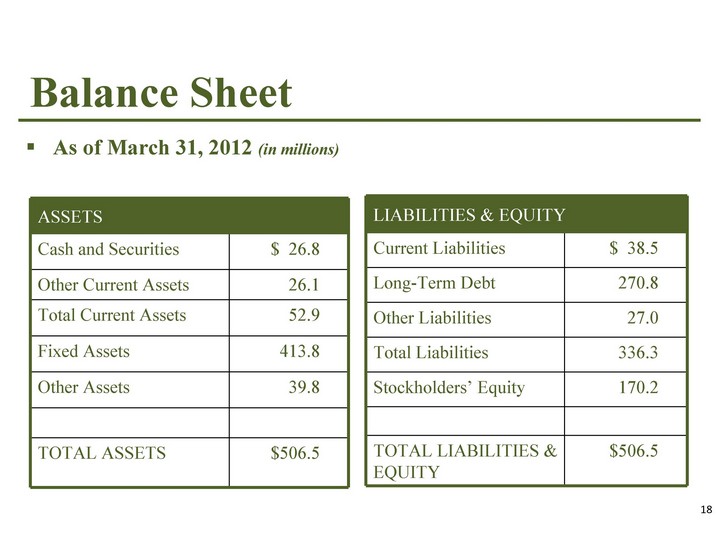
| Balance Sheet ASSETS ASSETS Cash and Securities $ 26.8 Other Current Assets 26.1 Total Current Assets 52.9 Fixed Assets 413.8 Other Assets 39.8 TOTAL ASSETS $506.5 LIABILITIES & EQUITY LIABILITIES & EQUITY Current Liabilities $ 38.5 Long-Term Debt 270.8 Other Liabilities 27.0 Total Liabilities 336.3 Stockholders' Equity 170.2 TOTAL LIABILITIES & EQUITY $506.5 As of March 31, 2012 (in millions) 18 |
| Investment Highlights Favorable demographics and attractive industry fundamentals Value leader in geographically concentrated regions Experienced management team with demonstrated ability to operate, acquire and create value Substantially all private pay with minimal federal regulation Accretive acquisitions in highly fragmented industry Conversions to higher levels of care with significant revenue and cash flow growth Strong cash flow generation Solid Balance Sheet 19 |

| Capital Senior Living Corporation |