Attached files
| file | filename |
|---|---|
| 8-K - FORM 8-K - ACI WORLDWIDE, INC. | d345913d8k.htm |
| EX-99.1 - PRESS RELEASE - ACI WORLDWIDE, INC. | d345913dex991.htm |
 May 3,
2012 March 31, 2012 Quarterly Results Presentation
ACI’s software underpins electronic
payments throughout retail and
wholesale banking, and commerce
all the time.
Exhibit 99.2 |
 2
This presentation contains forward-looking statements based on current
expectations that involve a number of risks and uncertainties. The
forward- looking statements are made pursuant to safe harbor provisions
of the Private Securities Litigation Reform Act of 1995. A discussion of
these forward-looking statements and risk factors that may affect
them is set forth at the end of this
presentation. The Company assumes no obligation to update any forward-
looking statement in this presentation, except as required by law.
Private Securities Litigation Reform Act of 1995
Safe Harbor For Forward-Looking Statements |
 3
Quarterly Overview
Phil Heasley
Chief Executive Officer |
 4
Q1 2012 in Review
•
Acquisition of S1 Corporation completed on February 13
–
Achieved $33 million in annual cost savings; 10% above plan
–
$24 million to be realized in FY 2012
•
Announced combined company product strategy on April 25
•
Acquisition of S1 contributes $705 million to 60-month backlog
•
Strong revenue growth due to 10% rise in organic revenues as well as S1
acquisition
•
Solid
Operating
Income
and
Adjusted
EBITDA
excluding
transaction
costs |
 5
Business Overview
Ralph Dangelmaier
President, Global Markets |
 Q1 2012
Overview Americas
•
New account with leading multi-national
institution; Wholesale Banking system and
Proactive Risk Manager/Anti-Money
Laundering solution for international
payments
•
New
account
with
Venezuelan
bank
–
S1
Payments
•
Regional U.S. Financial Institution
committed to BASE24-eps upgrade
•
A number of mobile deals for online
banking were completed late 2011, all
poised for go-lives
•
Leading retailer committed to ACI’s AOD
offering
Asia Pacific
•
Major re-commitment and add-on signing
by leading processor in Singapore
•
Key
new
account
with
State
-
owned
bank
in China for international payments
•
Key add-on wins in Indonesia and Thailand
EMEA
•
Significant add-on with Italian payments
processor
•
Two BASE24-eps migrations in Saudi
Arabia and Bahrain
•
Major infrastructure sale in Central
Europe
6 |
 7
S1 Acquisition Integration Update
•
Initial Customer Feedback
•
Americas -
Viewed as a more strategic partner with expanded
presence and wider breadth of product offering for customers
•
EMEA -
Expanded merchant retail and wholesale offerings, a more
strategic partner with a substantial presence in Africa
•
APAC -
Expanded wholesale and merchant retailer offerings; viewed
as a more strategic partner
•
Opportunity
to
cross-sell
additional
solutions
–
international
online
banking solution & international retailer solution
•
Combined company product strategy unveiled
•
Pipeline is strong across all geographies |
 8
Financial Review
Scott Behrens
Chief Financial Officer |
 Key
Takeaways from the Quarter Normal Q1 Seasonal Sales
•
Q1 2011 was a record sales quarter
•
Stronger add-on sales in Q1 2012
60-Month Backlog Growth of $700 million; 12-month growth of ~ $160 million
•
Backlog improvement driven by the addition of S1 backlog
Strong Revenue Quarter
•
Organic revenue growth of $10.6 million or 10%
•
S1
contributed
$22.5
million
in
revenue
for
the
period
Feb
13-
Mar
31
•
Q1 revenue impacted by $4.3 million of deferred revenue haircut
•
Monthly recurring revenue comprised 66% of the quarter’s revenue
9 |
 10
Key Takeaways from the Quarter (cont)
Operating Expense
•
Flat organic expenses
•
S1
contributed
$26.4
million
in
expenses
for
the
period
Feb
13-
Mar
31
•
$15.0 million of acquisition related one-time expenses including severance,
change-in-control, investment banker fees and other professional fees
Operating Income & Adjusted EBITDA
•
Operating Income of $13.4 million ex acquisition related one-time expenses
•
Adjusted EBITDA of $26.7 million ex acquisition related one-time expenses
Debt & Liquidity
Ended Q1 with $201 million in cash
YTD repurchased 185,800 shares of stock for approximately $7 million
Reduced Term Loan debt by approximately $3 million in Q1
As of March 2012, debt outstanding of $366.9 million ($170 million in revolver
and $196.9 million in term loan) |
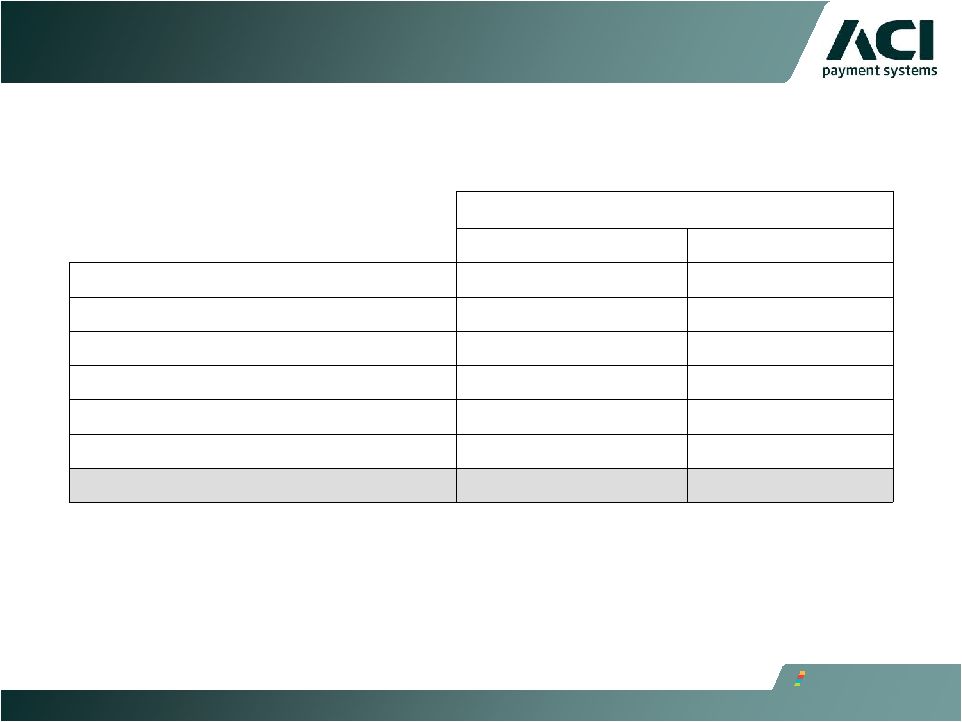
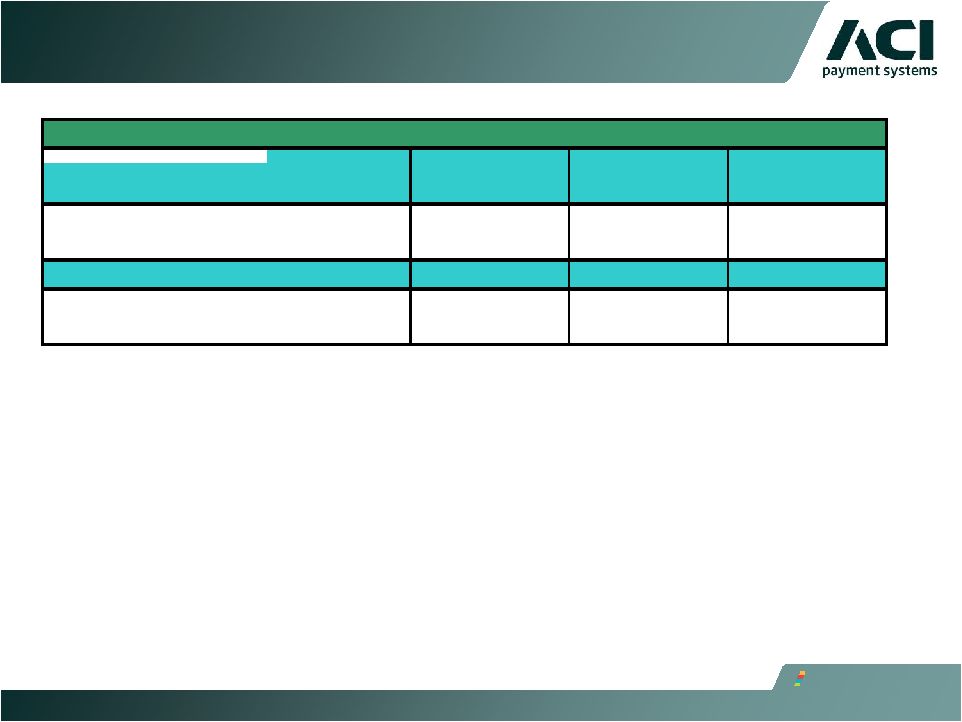  Backlog as a
Contributor of Quarterly Revenue •
Backlog from monthly recurring revenues and project go-lives
continues to drive current quarter GAAP revenue
•
Revenue from current quarter sales consistent with prior quarters
11
Revenue
Qtr Ended
Mar 12
Qtr Ended
Mar 11
% Growth or
Decline
Revenue from Backlog
$132,500
$99,121
33.7%
Revenue from Sales
5,125
5,422
-5.5%
Total Revenue
$137,625
$104,543
31.6%
Revenue from Backlog
96%
95%
Revenue from Sales
4%
5%
Revenue |
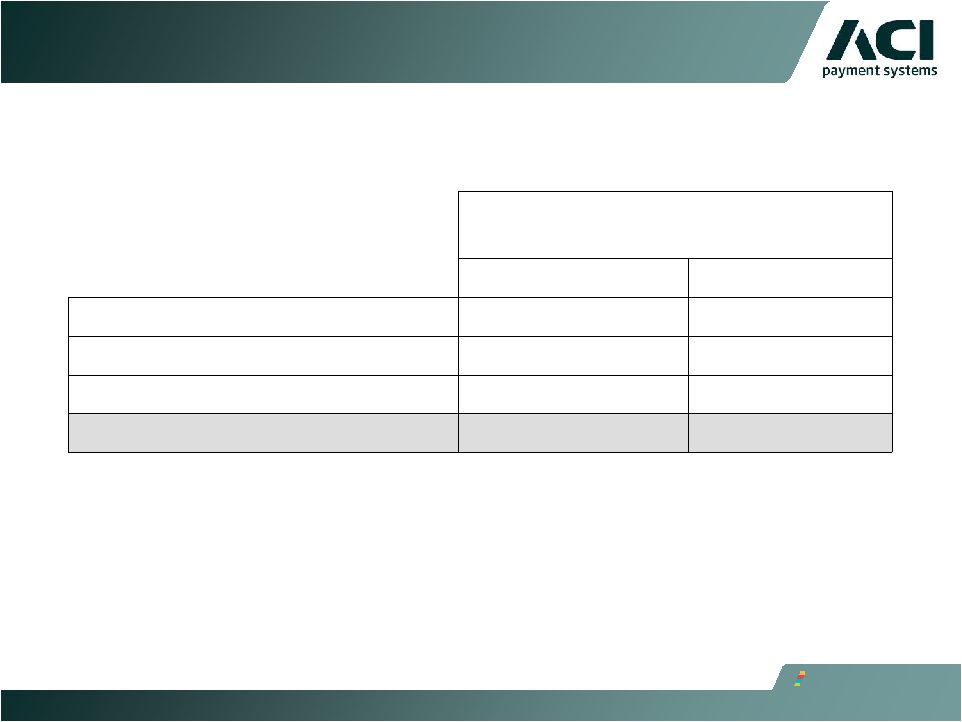
 Reaffirmation of
2012 Guidance 12
Key Metrics
2012 Low
2012 High
Revenue
$696
$706
Operating Income*
$99
$104
Adjusted EBITDA*
$165
$170
* Guidance excludes all S1 acquisition related one-time expenses
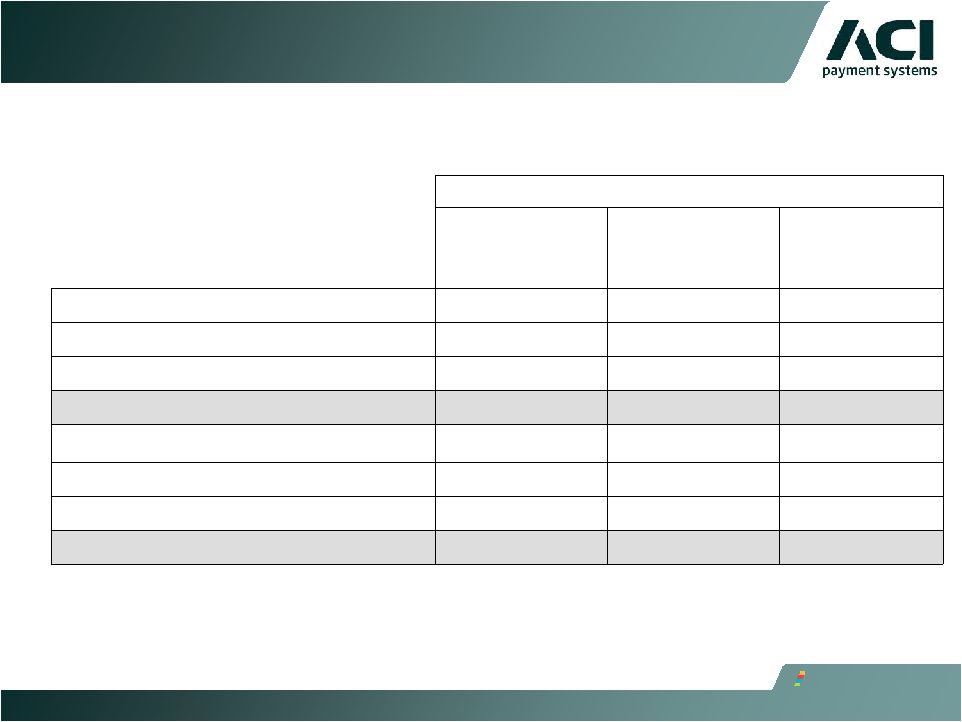
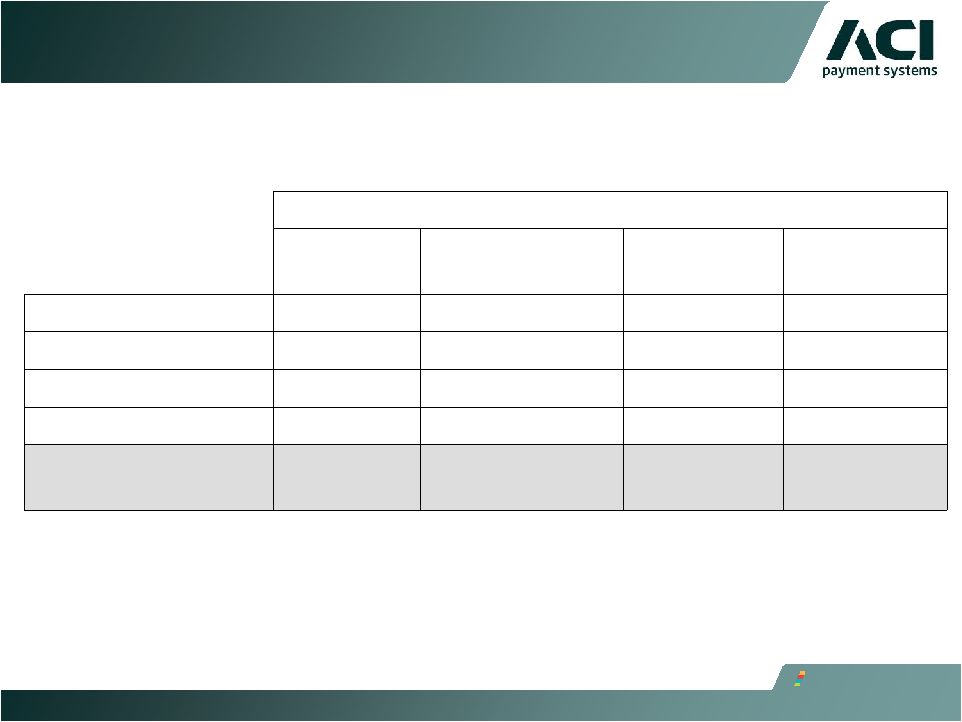
Original v Revised Purchase Accounting Assumptions
$ millions
Original
Assumption
Revised
Assumption
Margin
Impact
Deferred Revenue Haircut
20
20
($8)
67% in 2012;
33% in 2013
100% in 2012
Intangible amortization
$12
$6
$4
Synergy Savings
30
33
$2
75% in 2012;
100% in 2013
75% in 2012;
100% in 2013
Other Valuation Adjustment
$2
Net Benefit
Even |
 13
Appendix |
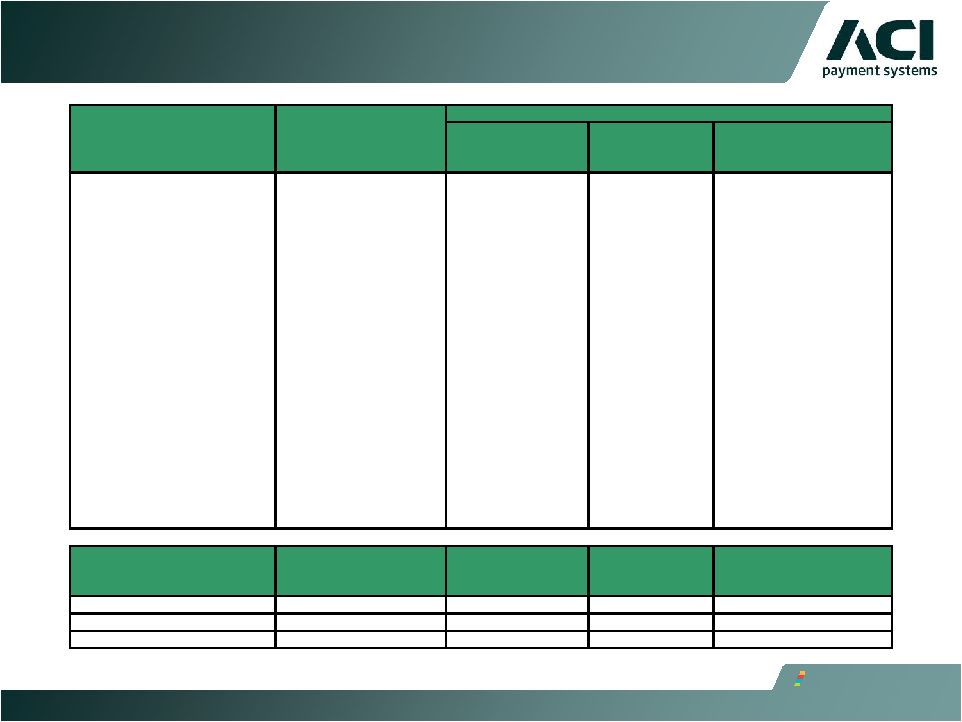 14
Historic Sales By Quarter 2010-2012
New Accounts / New
Applications
3/31/2010
$81,142
$5,758
$35,066
$40,318
7%
43%
50%
6/30/2010
$107,985
$1,224
$68,474
$38,287
1%
63%
35%
9/30/2010
$161,269
$11,290
$89,364
$60,615
7%
55%
38%
12/30/2010
$174,827
$43,988
$59,622
$71,217
25%
34%
41%
3/31/2011
$122,904
$13,695
$50,305
$58,904
11%
41%
48%
6/30/2011
$146,956
$19,730
$54,174
$73,052
13%
37%
50%
9/30/2011
$115,089
$17,356
$57,611
$40,123
15%
50%
35%
12/31/11
$171,385
$12,906
$104,460
$54,019
8%
61%
32%
3/31/2012
$108,462
$5,958
$58,602
$43,902
5%
54%
40%
New Accounts / New
Applications
MAR YTD 12
$108,462
$5,958
$58,602
$43,902
MAR YTD 11
$122,904
$13,695
$50,305
$58,904
Variance
($14,441)
($7,737)
$8,298
($15,002)
Quarter-End
Sales
Term Extension
Add-on Business
inc. Capacity
Upgrades &
Term Extension
Add-on Business
inc. Capacity
Upgrades &
Total Economic Value of
Sales
Sales Mix by Category |
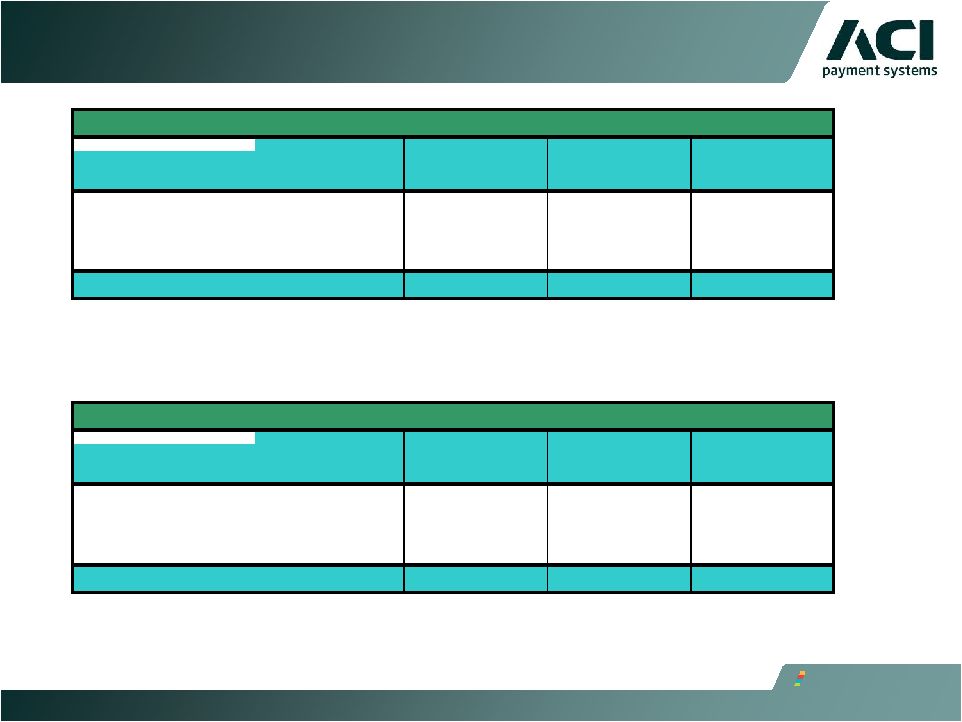   Sales By Region by
Geography and Type Channel
Qtr Ended
Mar 12
Qtr Ended
Mar 11
% Growth or
Decline
Americas
$71,196
$76,699
-7.2%
EMEA
25,024
38,490
-35.0%
Asia-Pacific
12,243
7,715
58.7%
Total Sales
$108,462
$122,904
-11.8%
Total Sales
Sales Type
Qtr Ended
Mar 12
Qtr Ended
Mar 11
% Growth or
Decline
New Account / New Application
$5,958
$13,695
-56.5%
Add-on Business
58,602
50,305
16.5%
Term Extension
43,902
58,905
-25.5%
Total Sales
$108,462
$122,904
-11.8%
Sales Type |
 Operating Free
Cash Flow ($ millions) 16
Quarter Ended March 31,
2012
2011
Net cash provided by operating activities
$(12.6)
$17.9
Adjustments:
Net after-tax payments associated with cash
settlement of S1 options
10.2
Net after-tax payments associated with S1
transaction costs
7.7
-
Net after-tax payments associated with
employee-related actions
0.6
1.5
Net after-tax payments associated with IBM IT
Outsourcing Transition
0.2
0.2
Less capital expenditures
(2.1)
(7.0)
Less Alliance technical enablement
expenditures
-
(0.3)
Operating Free Cash Flow*
$4.0
$12.3 |
 60-Month
Backlog ($ millions) 17
Quarter Ended
March 31,
December 31,
March 31,
2012
2011
2011
Americas
$1,405
$912
$895
EMEA
669
514
526
Asia/Pacific
243
191
192
Backlog 60-Month
$2,317
$1,617
$1,613
Deferred Revenue
$207
$166
$175
Other
2,110
1,451
1,438
Backlog 60-Month
$2,317
$1,617
$1,613 |
 Revenues by
Channel ($ millions) 18
Quarter Ended March 31,
2012
2011
Revenues:
United States
$58.8
$ 37.5
Americas International
15.4
14.8
Americas
$74.2
$52.3
EMEA
44.8
42.1
Asia/Pacific
18.6
10.1
Revenues
$137.6
$104.5 |
 Monthly Recurring
Revenue ($ millions) 19
Quarter Ended March 31,
2012
2011
Monthly Software License Fees
$25.5
$31.2
Maintenance Fees
42.1
33.5
Processing Services
21.3
12.6
Monthly Recurring Revenue
$88.9
$77.3 |
 Deferred Revenue
and Expense ($ millions) 20
Quarter Ended
March 31,
December 31,
March 31,
December 31,
2012
2011
2011
2010
Short Term Deferred
Revenue
$177.8
$133.0
$141.4
$121.9
Long Term Deferred
Revenue
29.5
32.7
33.2
31.0
Total Deferred Revenue
$207.3
$165.7
$174.6
$152.9
Total Deferred Expense
$13.3
$12.2
$12.0
$11.1 |
 Non-Cash
Compensation, Acquisition Intangibles and Software, and Acquisition-Related
Expenses 21
Quarter ended
March 31, 2012
Quarter ended
March 31, 2011
EPS Impact*
$ in Millions
EPS Impact*
$ in Millions
S1 acquisition-related one-time
expense
$0.26
$9.8
$0.00
$0.00
Amortization of acquisition-
related intangibles
0.04
1.5
0.03
1.0
Amortization of acquisition-
related software
0.04
1.6
0.03
1.0
Non-cash equity-based
compensation
0.10
3.7
0.04
1.5
Total:
$0.44
$16.6
$0.10
$3.5
* Tax Effected at 35% and using hypothetical diluted weighted average share count of 38.0
million for 2012 |
 Other Income /
Expense ($ millions) 22
Quarter Ended
March 31,
2012
December 31,
2011
March 31,
2011
December 31,
2010
Interest Income
$0.2
$0.7
$0.2
$0.2
Interest Expense
($1.9)
($1.0)
($0.6)
($0.5)
FX Gain / Loss
($0.6)
($0.8)
($0.2)
($0.1)
Other
$1.5
$0.1
($0.1)
$0.0
Total Other Income
(Expense)
($0.8)
($1.0)
($0.7)
($0.4) |
 Adjusted
EBITDA Quarter Ended
March 31, 2012
Quarter Ended
March 31, 2011
Net Income (Loss)
$(1.8)
$1.6
Income tax expense
(benefit)
(0.6)
5.2
Net Interest Expense
1.6
0.4
New Other Expense
(0.9)
0.3
Depreciation Expense
2.7
1.7
Amortization Expense
7.5
5.1
Non-Cash Compensation Expense
5.6
2.4
Adjusted EBITDA
$14.1
$16.7
Employee related actions
7.4
-
S1 acquisition related fees
4.1
-
One-time professional fees
1.1
-
Adjusted EBITDA excluding one-time
transaction expense
$26.7
$16.7
23 |
 Non -GAAP
Operating Income (loss) 24
Quarter Ended
March 31, 2012
Quarter Ended
March 31, 2011
Operating Income (Loss)
$(1.6)
$7.5
Plus
Accelerated share-based compensation
2.4
-
Employee related actions
7.4
-
S1 Acquisition related fees
4.1
-
One time professional fees
1.1
-
Non-GAAP Operating Income (loss)
$13.4
$7.5 |
 Non-GAAP
Financial Measures To supplement our financial results presented on a GAAP basis, we use
the non-GAAP measure indicated in the tables, which exclude certain business
combination accounting entries and expenses related to the acquisition of S1, as well
as other significant non-cash expenses such as depreciation, amortization
and
share-based
compensation,
that
we
believe
are
helpful
in
understanding
our
past
financial performance and our future results. The presentation of these non-GAAP
financial measures should be considered in addition to our GAAP results and are not
intended to be considered in isolation or as a substitute for the financial
information prepared and presented in accordance with GAAP. Management generally
compensates for limitations in the use of non-GAAP financial measures by relying
on comparable GAAP financial measures and providing investors with a reconciliation of
non-GAAP financial measures only in addition to and in conjunction with results
presented in accordance with GAAP. We believe that these non-GAAP financial measures
reflect an additional way of viewing aspects of our operations that, when viewed with
our GAAP results, provide a more complete understanding of factors and trends
affecting our business. •
Non-GAAP operating income, operating income (loss) plus deferred revenue that would have
been recognized in the normal course of business by S1 if not for GAAP purchase
accounting requirements and one-time expense related to the acquisition of
S1. Non-GAAP operating income should
be
considered
in
addition
to,
rather
than
as
a
substitute
for,
operating
income.
25 |
 Non-GAAP
Financial Measures •
Adjusted EBITDA, which is defined as net income (loss) plus income tax expense, net interest
income (expense), net other income (expense), depreciation, amortization and
non-cash compensation, as well as deferred revenue that would have been recognized
in the normal course of business by S1 if not for GAAP purchase accounting
requirements and one-time expense related to the acquisition of S1. Adjusted
EBITDA should be considered in addition to, rather than as a substitute for, operating
income. •
ACI is also presenting operating free cash flow, which is defined as net cash provided (used)
by operating activities, less net after-tax payments associated with cash
settlement of S1 stock options and S1 related transaction costs, net after-tax
payments associated with IBM IT outsourcing transition, capital expenditures and plus
or minus net proceeds from IBM. Operating free cash flow is considered a
non-GAAP financial measure as defined by SEC Regulation G. We utilize this non-
GAAP financial measure, and believe it is useful to investors, as an indicator of cash flow
available for debt repayment and other investing activities, such as capital
investments and acquisitions. We utilize operating free cash flow as a further
indicator of operating performance and for planning investing activities.
Operating free cash flow should be considered in addition to, rather than as a
substitute for, net cash provided by operating activities. A limitation of operating
free cash flow is that
it
does
not
represent
the
total
increase
or
decrease
in
the
cash
balance
for
the
period.
This
measure
also
does
not
exclude
mandatory
debt
service
obligations
and,
therefore,
does
not
represent the residual cash flow available for discretionary expenditures. We believe that
operating free cash flow is useful to investors to provide disclosures of our
operating results on the same basis as that used by our management
26 |
 Non-GAAP
Financial Measures •
ACI also includes backlog estimates which are all software license fees, maintenance fees and
services specified in executed contracts, as well as revenues from assumed contract
renewals to the extent that we believe recognition of the related revenue will occur
within the corresponding backlog period. We have historically included assumed renewals in
backlog
estimates
based
upon
automatic
renewal
provisions
in
the
executed
contract
and
our
historic
experience
with
customer renewal rates.
•
Backlog is considered a non-GAAP financial measure as defined by SEC Regulation G.
Our 60-month backlog estimate represents expected revenues from existing customers
using the following key assumptions: •
Maintenance fees are assumed to exist for the duration of the license term for those contracts
in which the committed maintenance term is less than the committed license term.
•
License and facilities management arrangements are assumed to renew at the end of their
committed term at a rate consistent with our historical experiences.
•
Non-recurring
license
arrangements
are
assumed
to
renew
as
recurring
revenue
streams.
•
Foreign currency exchange rates are assumed to remain constant over the 60-month backlog
period for those contracts stated in currencies other than the U.S. dollar.
•
Our pricing policies and practices are assumed to remain constant over the 60-month
backlog period. •
Estimates
of
future
financial
results
are
inherently
unreliable.
Our
backlog
estimates
require
substantial
judgment
and
are
based on a number of assumptions as described above. These assumptions may turn out to be
inaccurate or wrong, including
for
reasons
outside
of
management’s
control.
For
example,
our
customers
may
attempt
to
renegotiate
or
terminate their contracts for a number of reasons, including mergers, changes in their
financial condition, or general changes in economic conditions in the customer’s
industry or geographic location, or we may experience delays in the development or
delivery of products or services specified in customer contracts which may cause the actual renewal rates
and amounts to differ from historical experiences. Changes in foreign currency exchange
rates may also impact the amount of revenue actually recognized in future
periods. Accordingly, there can be no assurance that contracts included in
backlog estimates will actually generate the specified revenues or that the actual revenues will be generated within the
corresponding 60-month period.
•
Backlog should be considered in addition to, rather than as a substitute for, reported revenue
and deferred revenue. 27 |
 Forward-Looking Statements
This presentation contains forward-looking statements based on current expectations that
involve a number of risks and uncertainties. Generally, forward-looking statements
do not relate strictly to historical or current facts and may include words or phrases
such as “believes,”
“
will,”
“expects,”
“anticipates,”
“intends,”
and words and phrases of similar
impact. The forward-looking statements are made pursuant to safe harbor provisions
of the Private Securities Litigation Reform Act of 1995.
Forward-looking statements in this presentation include, but are not limited to,
statements regarding:
•
Annual cost savings expected from the S1 acquisition;
•
Strength of our pipeline across all geographies;
•
The company’s 12-month and 60-month backlog estimates and assumptions, including
our belief that backlog from monthly recurring revenues and project go-lives will
continue to drive current quarter GAAP revenue and lead to predictable quarterly
performance; and
•
Expectations regarding 2012 financial guidance related to revenue, operating income
and operating EBITDA.
28 |
 Forward-Looking Statements
•
All of the foregoing forward-looking statements are expressly qualified by the risk factors
discussed in our filings with the Securities and Exchange Commission. Such factors
include but are not limited to, risks related to the global financial crisis and the
continuing decline in the global economy, restrictions and other financial covenants in
our credit facility, volatility and disruption of the capital and credit markets and
adverse changes in the global economy, risks related to the expected benefits to be achieved in
the transaction with S1, , consolidations and failures in the financial services
industry, the accuracy of management’s backlog estimates, the cyclical nature of
our revenue and earnings and the accuracy of forecasts due to the concentration of
revenue generating activity during the final weeks of each quarter, impairment of our
goodwill or intangible assets, exposure to unknown tax liabilities, volatility in our stock
price, risks from operating internationally, including fluctuations in currency exchange rates,
increased competition, our offshore software development activities, customer reluctance
to switch to a new vendor, the performance of our strategic product, BASE24-eps, the
maturity of certain products, our strategy to migrate customers to our next generation
products, ratable or deferred recognition of certain revenue associated with customer
migrations and the maturity of certain of our products, demand for our products, failure
to obtain renewals of customer contracts or to obtain such renewals on favorable terms, delay or
cancellation of customer projects or inaccurate project completion estimates, business
interruptions or failure
of
our
information
technology
and
communication
systems,
our
alliance
with
International
Business
Machines Corporation (“IBM”), our outsourcing agreement with IBM, the complexity of
our products and services
and
the
risk
that
they
may
contain
hidden
defects
or
be
subjected
to
security
breaches
or
viruses,
compliance of our products with applicable legislation, governmental regulations and industry
standards, our compliance with privacy regulations, the protection of our intellectual
property in intellectual property litigation, future acquisitions, strategic
partnerships and investments and litigation, the risk that expected synergies,
operational
efficiencies
and
cost
savings
from
the
S1
acquisition
may
not
be
fully
realized
or
realized within the expected time frame. For a detailed discussion of these risk factors,
parties that are relying
on
the
forward-looking
statements
should
review
our
filings
with
the
Securities
and
Exchange
Commission, including our most recently filed Annual Report on Form 10-K, Registration
Statement on Form S-4, and subsequent reports on Form 8-K.
29 |
 ACI’s
software underpins electronic payments throughout retail and
wholesale banking, and commerce all
the time, without fail.
www.aciworldwide.com |