Attached files
| file | filename |
|---|---|
| 8-K - LNB BANCORP, INC. 8-K - LNB BANCORP INC | a50260778.htm |
Exhibit 99.1

Forward Looking StatementsThis presentation contains forward-looking statements relating to the financial condition, results of operations and business of LNB Bancorp, Inc., including certain plans, expectations, goals and statements which are subject to numerous assumptions, risks and uncertainties. Actual results could differ materially from those indicated by such statements for a variety of reasons. Among the important factors that could cause actual results to differ materially from those indicated are movements in interest rates, changes in the mix of the Company’s business, competitive pressures, changes in general economic conditions, the nature, extent and timing of governmental actions and reforms and the risk factors detailed in the Company’s 2011 Annual Report on Form 10-K and subsequent current and periodic reports and registration statements filed with the Securities and Exchange Commission. All forward-looking statements included in this presentation are based on information available as of the date hereof. LNB Bancorp, Inc. undertakes no obligation to update these forward-looking statements to reflect events or circumstances after the date of this presentation.
A Community Bank of Scale (LNBB: NASDAQ) Other Placeholder: Total assets of $1.2 billion20 banking offices serving the northeast Ohio market. Founded in 1905.Deep and experienced management team with experience in regional and community banking, and non-bank financial servicesStrong core earnings base with consistent growth trends.Experienced, motivated lenders in markets/ business lines with strong upside potentialRobust infrastructure with excess capacity
A Successful Business Model Other Placeholder: Stable core earnings with improving trendsDiverse fee income stream:TrustMortgage BankingIndirect LoansService chargesUnique high quality multi-state Indirect Auto businessAggressive management of credit qualityHighly efficient operations
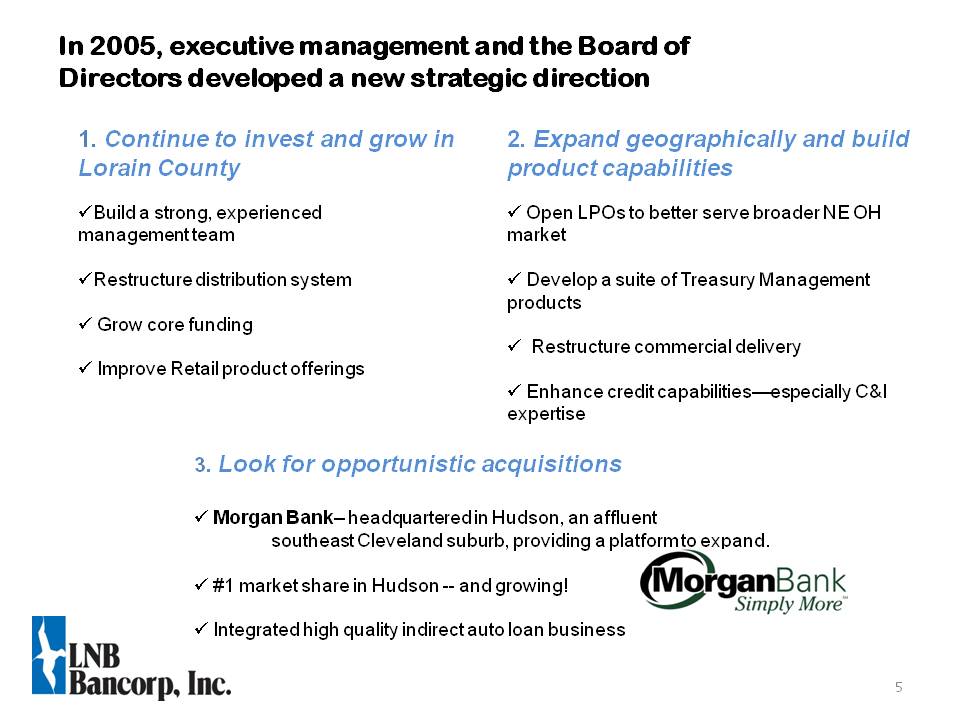
1. Continue to invest and grow in Lorain CountyBuild a strong, experienced management team Restructure distribution system Grow core funding Improve Retail product offerings In 2005, executive management and the Board of Directors developed a new strategic direction 2. Expand geographically and build product capabilities Open LPOs to better serve broader NE OH market Develop a suite of Treasury Management products Restructure commercial delivery Enhance credit capabilities—especially C&I expertise 3. Look for opportunistic acquisitions Morgan Bank– headquartered in Hudson, an affluent southeast Cleveland suburb, providing a platform to expand. #1 market share in Hudson -- and growing! Integrated high quality indirect auto loan business
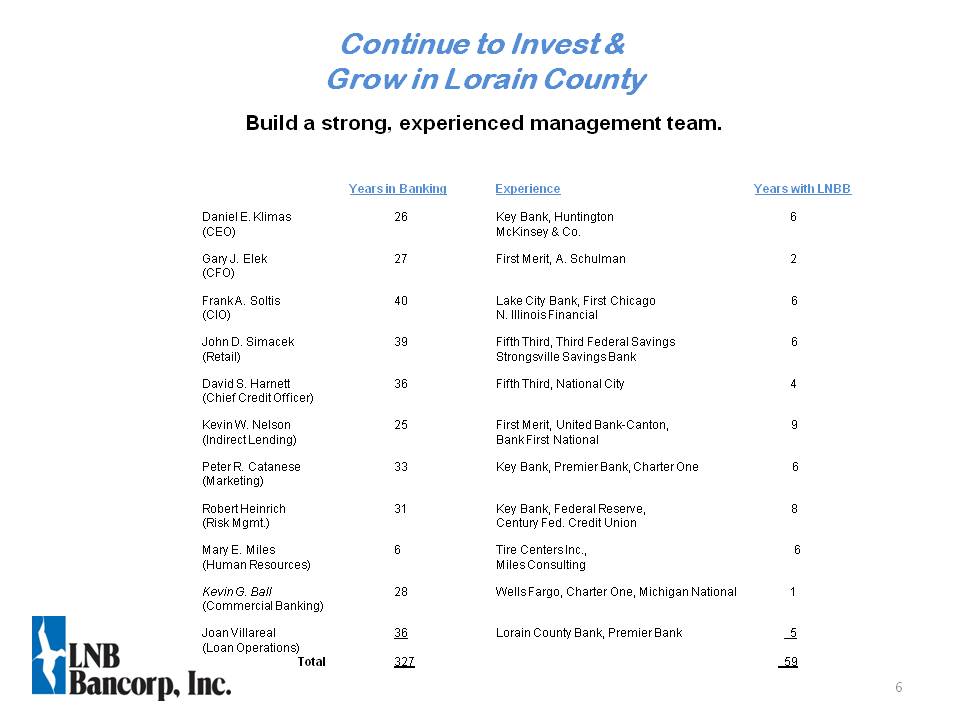
Build a strong, experienced management team. Continue to Invest & Grow in Lorain County Years in Banking Experience Years with LNBBDaniel E. Klimas 26 Key Bank, Huntington 6(CEO) McKinsey & Co.Gary J. Elek 27 First Merit, A. Schulman 2(CFO)Frank A. Soltis 40 Lake City Bank, First Chicago 6(CIO) N. Illinois FinancialJohn D. Simacek 39 Fifth Third, Third Federal Savings 6(Retail) Strongsville Savings BankDavid S. Harnett 36 Fifth Third, National City 4(Chief Credit Officer)Kevin W. Nelson 25 First Merit, United Bank-Canton, 9(Indirect Lending) Bank First NationalPeter R. Catanese 33 Key Bank, Premier Bank, Charter One 6(Marketing) Robert Heinrich 31 Key Bank, Federal Reserve, 8(Risk Mgmt.) Century Fed. Credit UnionMary E. Miles 6 Tire Centers Inc., 6(Human Resources) Miles ConsultingKevin G. Ball 28 Wells Fargo, Charter One, Michigan National 1(Commercial Banking)Joan Villareal 36 Lorain County Bank, Premier Bank 5 (Loan Operations) Total 327 59
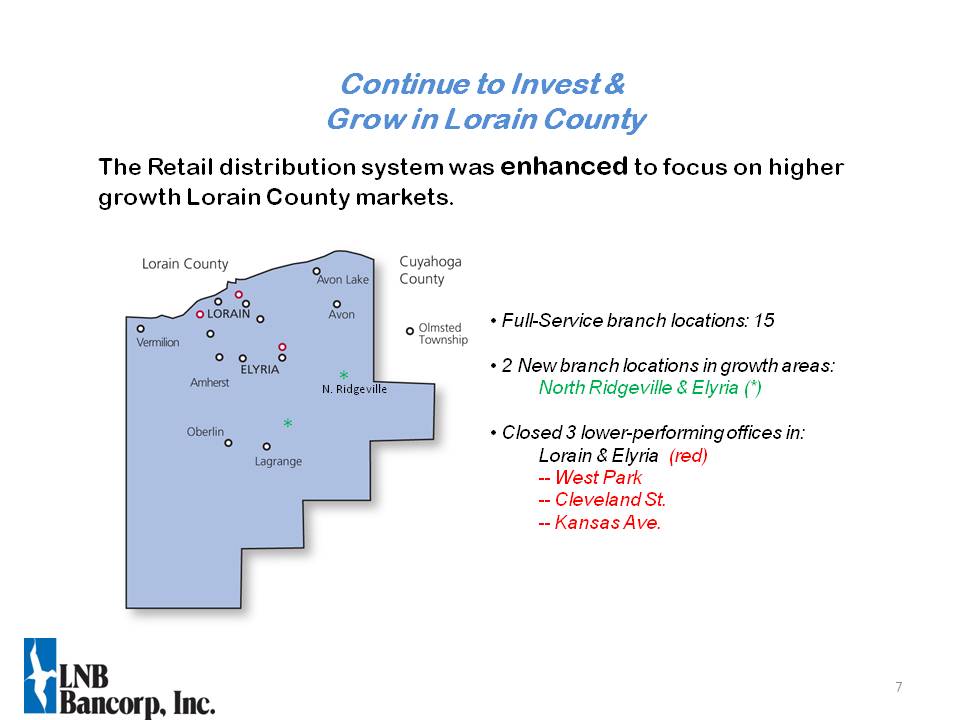
Full-Service branch locations: 15 2 New branch locations in growth areas:North Ridgeville & Elyria (*) Closed 3 lower-performing offices in:Lorain & Elyria (red)-- West Park-- Cleveland St.-- Kansas Ave. The Retail distribution system was enhanced to focus on higher growth Lorain County markets. * * N. Ridgeville Continue to Invest & Grow in Lorain County
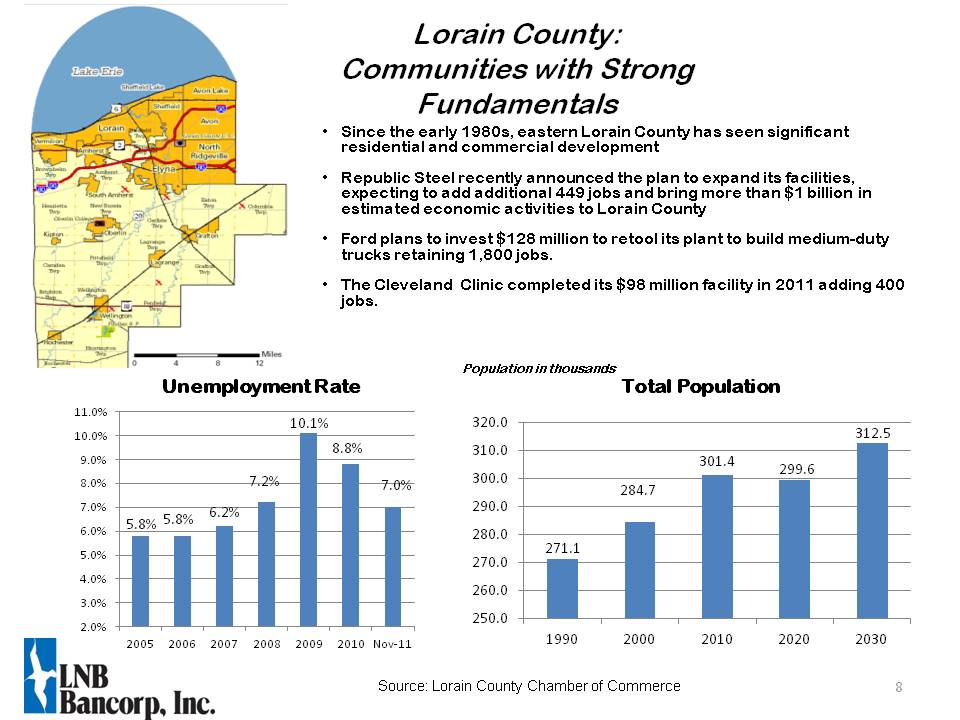
Lorain County:Communities with Strong Fundamentals Population in thousands Total Population Source: Lorain County Chamber of Commerce Since the early 1980s, eastern Lorain County has seen significant residential and commercial development Republic Steel recently announced the plan to expand its facilities, expecting to add additional 449 jobs and bring more than $1 billion in estimated economic activities to Lorain County Ford plans to invest $128 million to retool its plant to build medium-duty trucks retaining 1,800 jobs. The Cleveland Clinic completed its $98 million facility in 2011 adding 400 jobs. Unemployment Rate
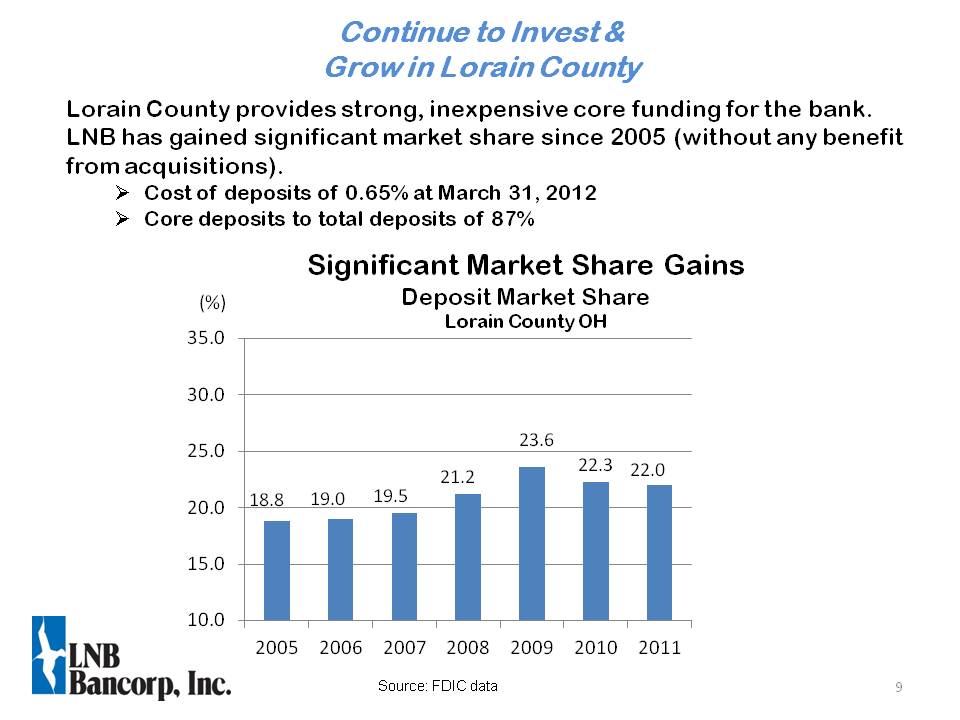
Lorain County provides strong, inexpensive core funding for the bank. LNB has gained significant market share since 2005 (without any benefit from acquisitions).Cost of deposits of 0.65% at March 31, 2012Core deposits to total deposits of 87% (%) Source: FDIC data Continue to Invest & Grow in Lorain County
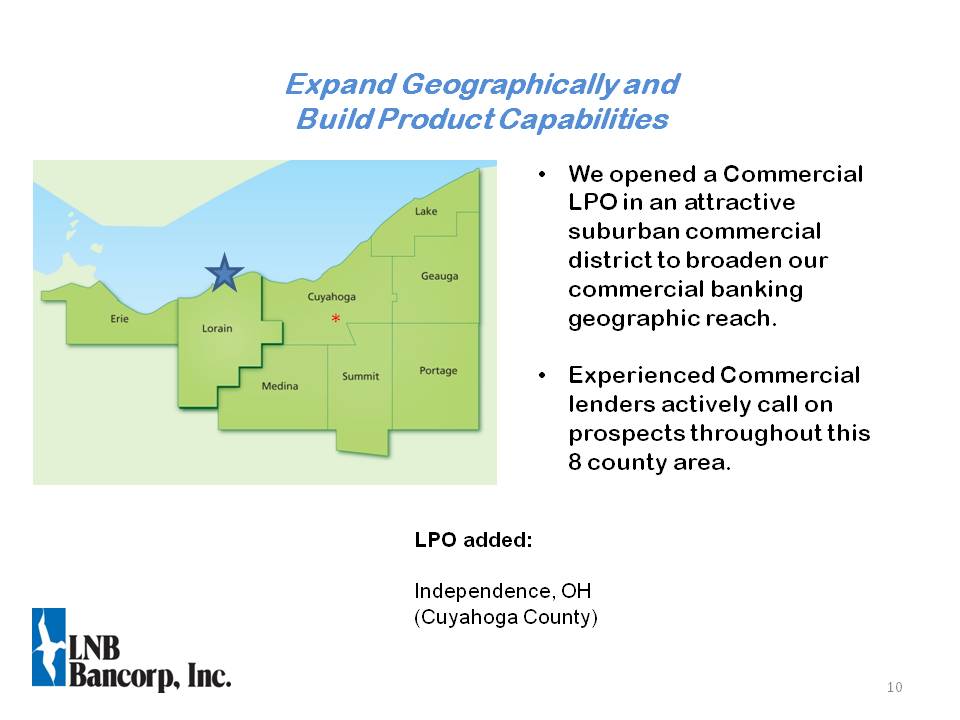
We opened a Commercial LPO in an attractive suburban commercial district to broaden our commercial banking geographic reach. Experienced Commercial lenders actively call on prospects throughout this 8 county area. LPO added:Independence, OH (Cuyahoga County) * Expand Geographically and Build Product Capabilities
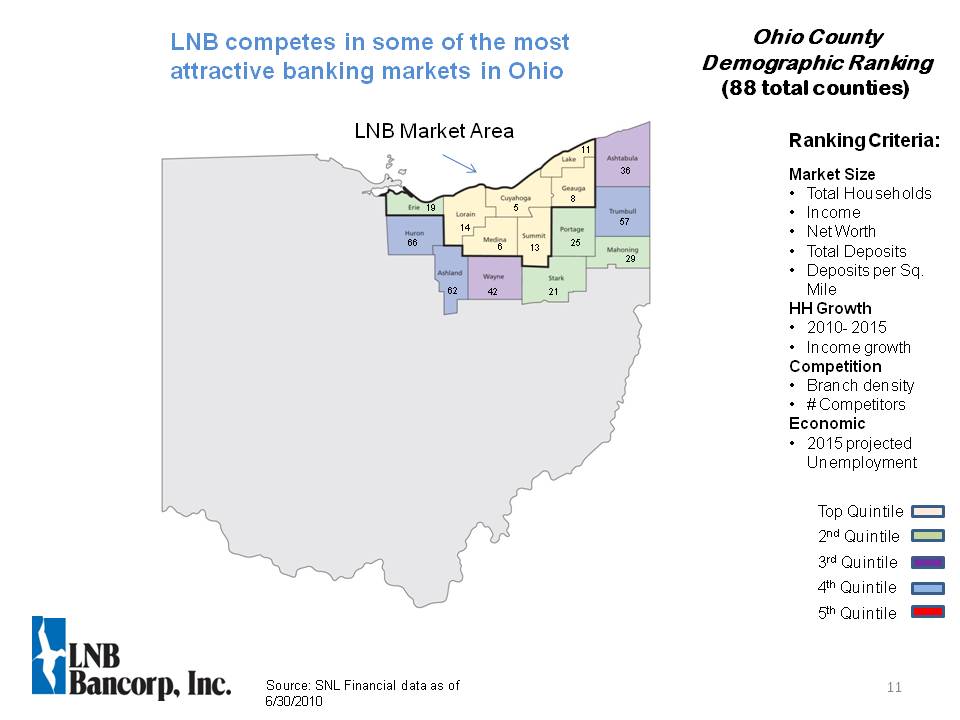
Ohio County Demographic Ranking (88 total counties) Source: SNL Financial data as of 6/30/2010 Top Quintile 2nd Quintile 3rd Quintile 4th Quintile 5th Quintile Ranking Criteria: Market Size Total Households Income Net Worth Total Deposits Deposits per Sq. Mile HH Growth 2010- 2015 Income growth Competition Branch density # Competitors Economic 2015 projected Unemployment LNB Market Area 36 57 29 21 25 8 5 13 6 14 42 62 66 19 11 LNB competes in some of the most attractive banking markets in Ohio
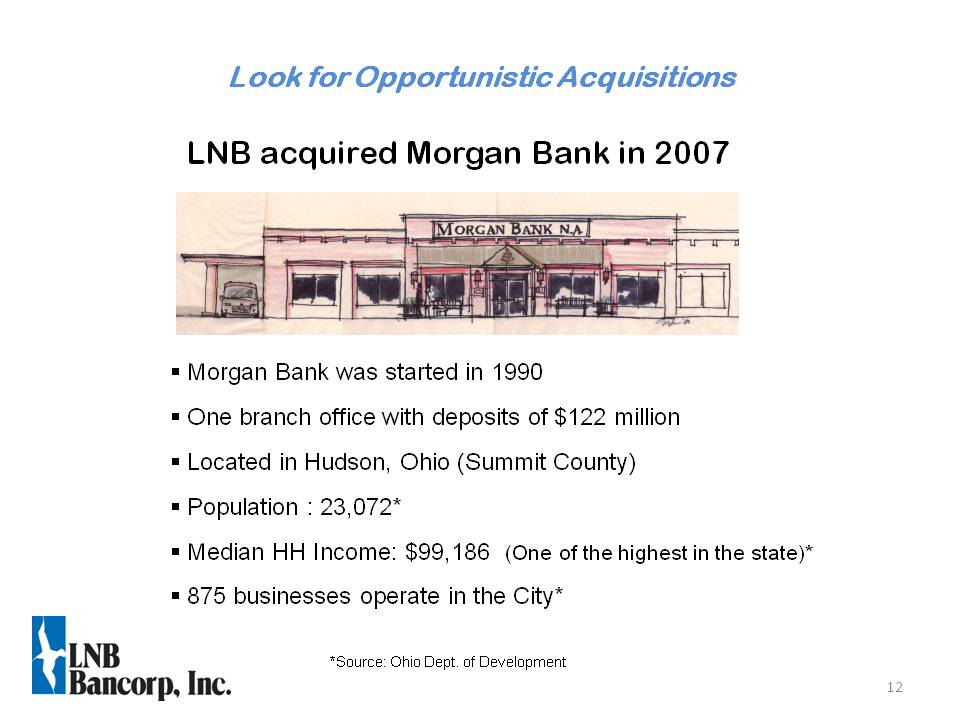
LNB acquired Morgan Bank in 2007 Morgan Bank was started in 1990 One branch office with deposits of $122 million Located in Hudson, Ohio (Summit County) Population : 23,072* Median HH Income: $99,186 (One of the highest in the state)* 875 businesses operate in the City* Look for Opportunistic Acquisitions *Source: Ohio Dept. of Development
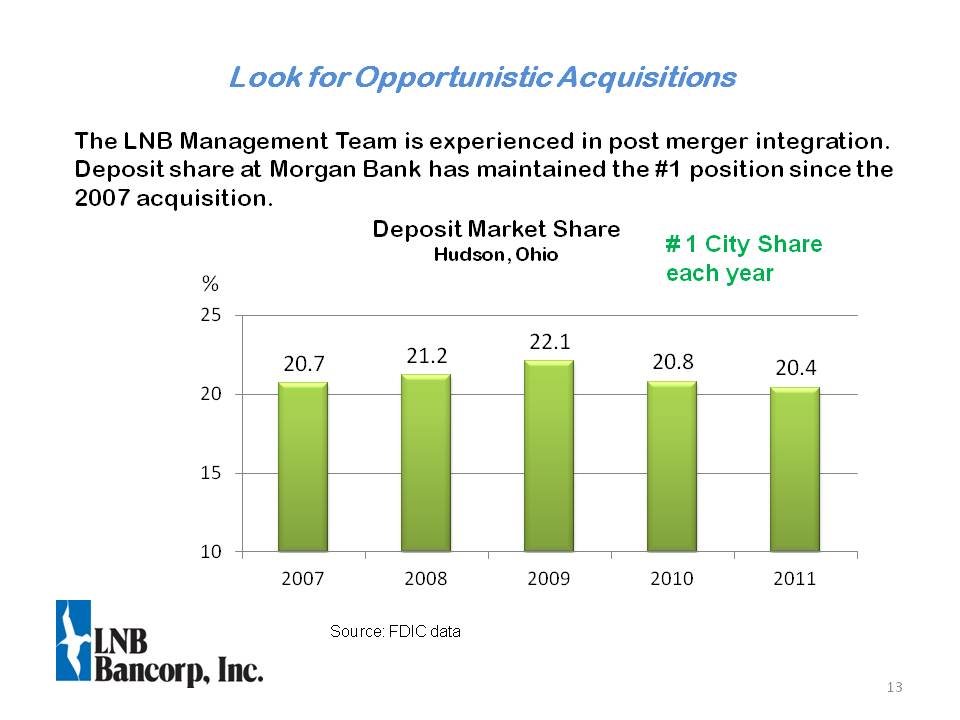
Deposit Market Share Hudson, Ohio Other Placeholder: 13 # 1 City Share each year The LNB Management Team is experienced in post merger integration. Deposit share at Morgan Bank has maintained the #1 position since the 2007 acquisition. Source: FDIC data % Look for Opportunistic Acquisitions
Other Placeholder: Indirect Auto Business15 years of experienceOriginates through dealers in: Ohio, Kentucky, Tennessee, Georgia, and IndianaAverage credit score of 7722012 Plan is to generate $143 million in assets The Indirect Auto business provides high quality assets to LNB’s balance sheet and generates recurring fee income through sales of these assets to other community banks. Look for Opportunistic Acquisitions
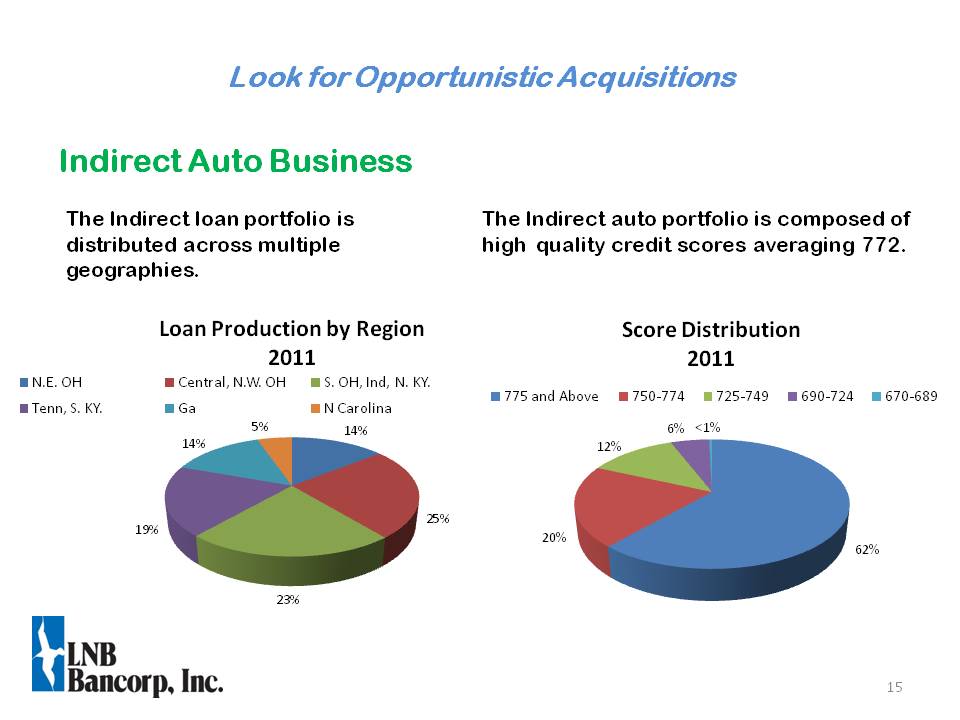
Indirect Auto Business The Indirect loan portfolio is distributed across multiple geographies. Look for Opportunistic Acquisitions The Indirect auto portfolio is composed of high quality credit scores averaging 772.
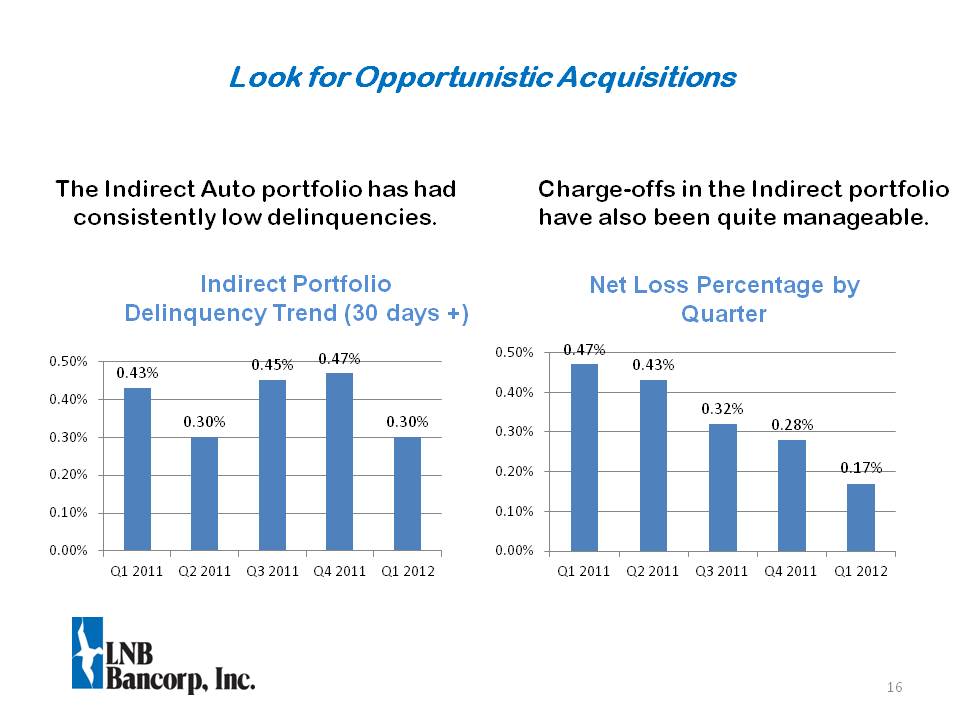
The Indirect Auto portfolio has had consistently low delinquencies. Look for Opportunistic Acquisitions Charge-offs in the Indirect portfolio have also been quite manageable. Indirect Portfolio Delinquency Trend (30 days +) Net Loss Percentage by Quarter
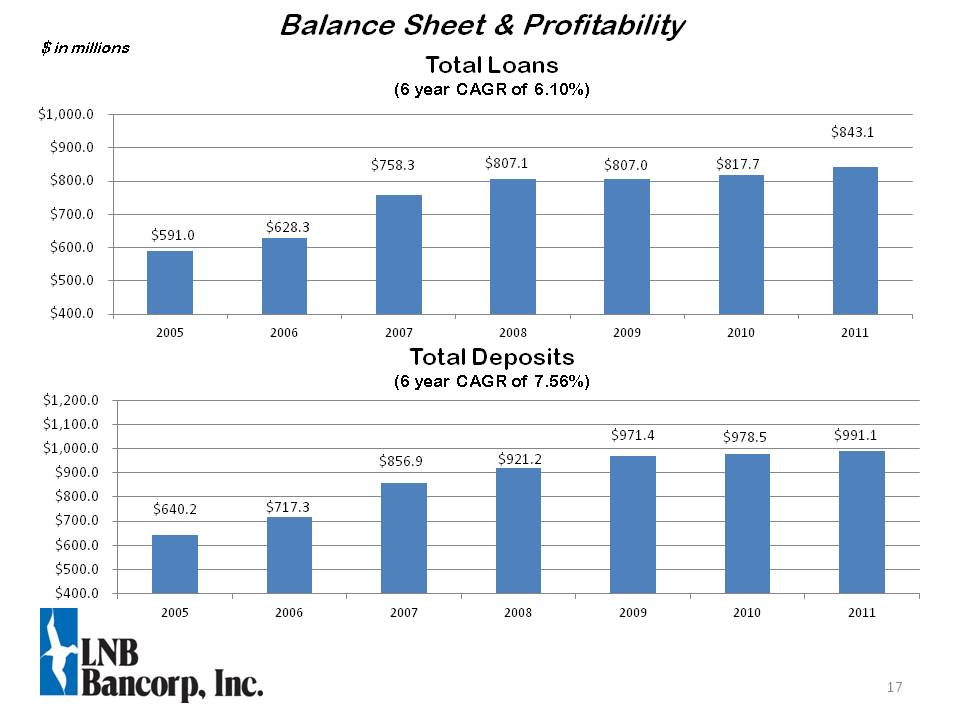
Balance Sheet & Profitability Total Deposits (6 year CAGR of 7.56%) $ in millions Total Loans (6 year CAGR of 6.10%)
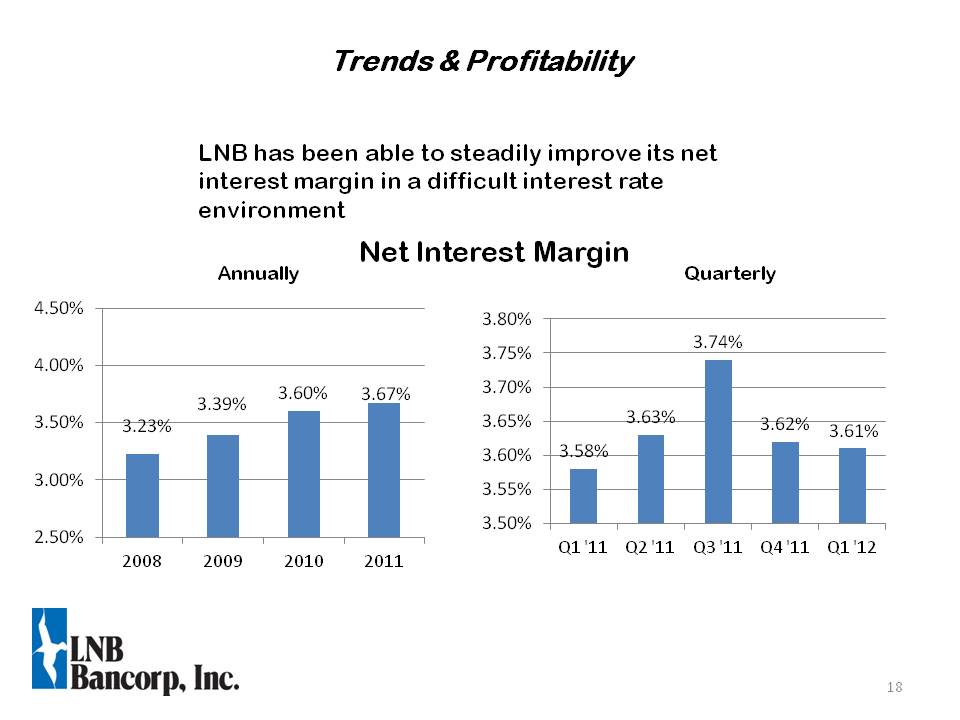
Net Interest Margin Other Placeholder: 18 LNB has been able to steadily improve its net interest margin in a difficult interest rate environment Trends & Profitability Annually Quarterly
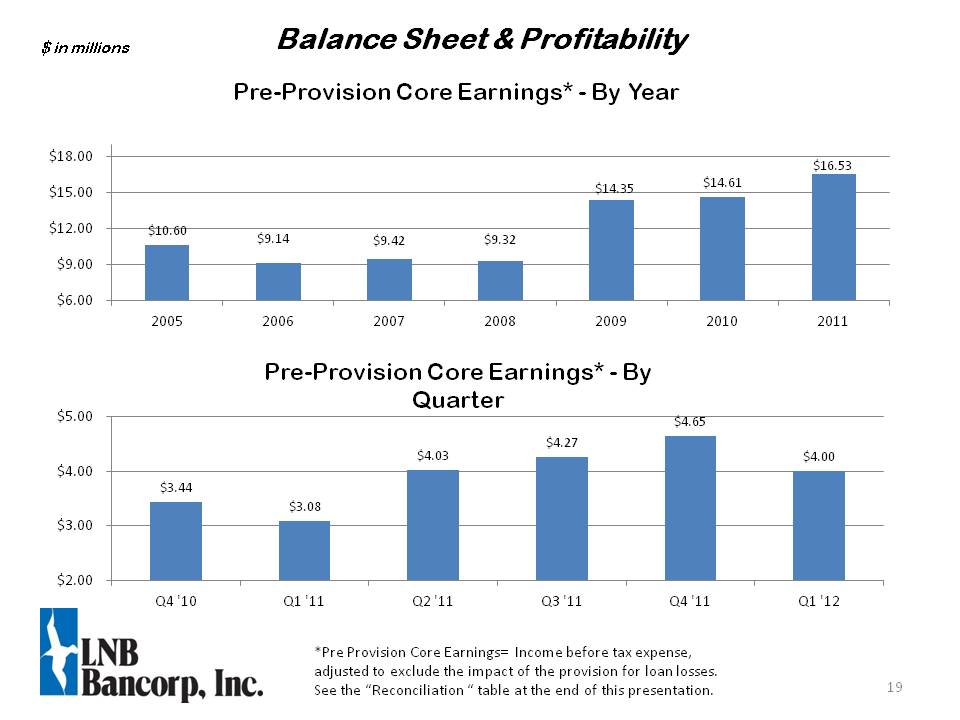
Balance Sheet & Profitability *Pre Provision Core Earnings= Income before tax expense, adjusted to exclude the impact of the provision for loan losses.See the “Reconciliation “ table at the end of this presentation. Pre-Provision Core Earnings* - By Year Pre-Provision Core Earnings* - By Quarter $ in millions
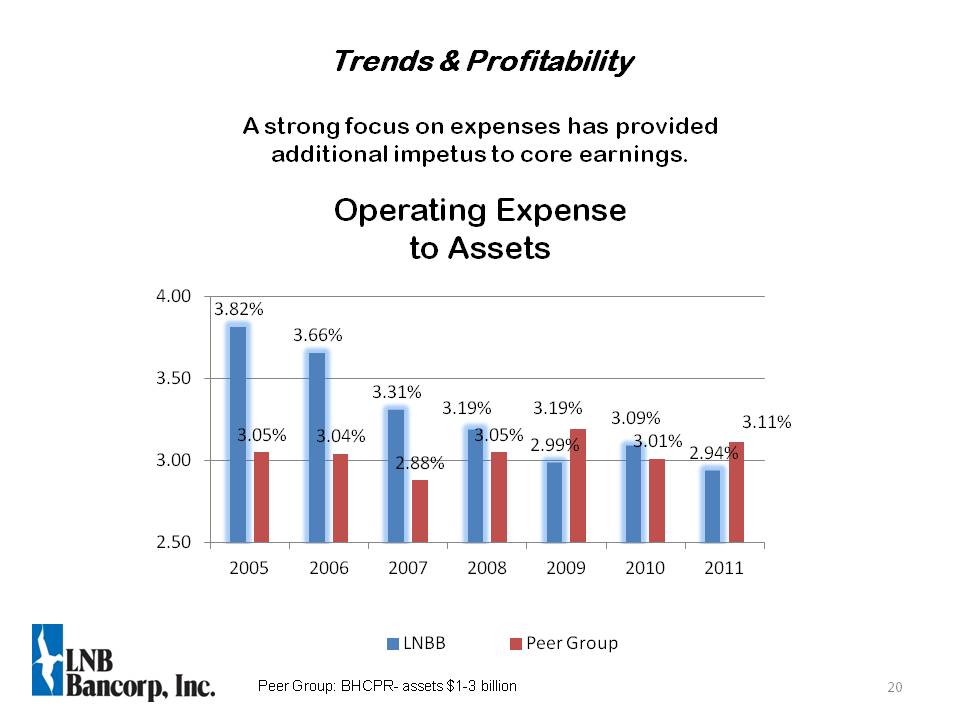
Operating Expenseto Assets Other Placeholder: 20 A strong focus on expenses has provided additional impetus to core earnings. Peer Group: BHCPR- assets $1-3 billion Trends & Profitability
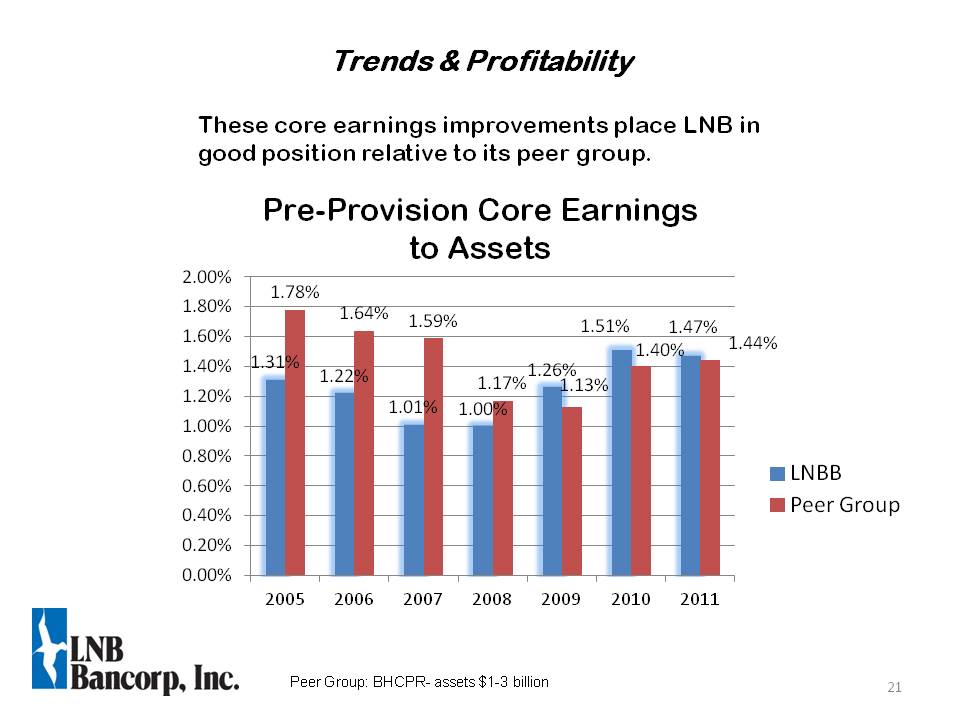
Pre-Provision Core Earningsto Assets These core earnings improvements place LNB in good position relative to its peer group. Trends & Profitability Peer Group: BHCPR- assets $1-3 billion
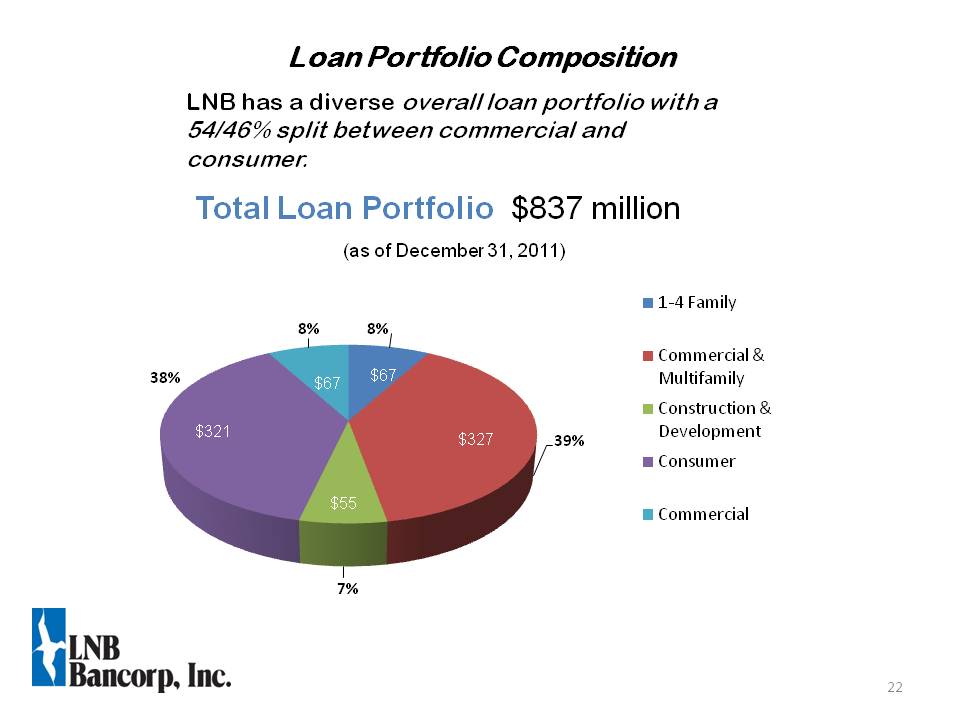
Total Loan Portfolio $837 million (as of December 31, 2011) LNB has a diverse overall loan portfolio with a 54/46% split between commercial and consumer. Loan Portfolio Composition $67 $67
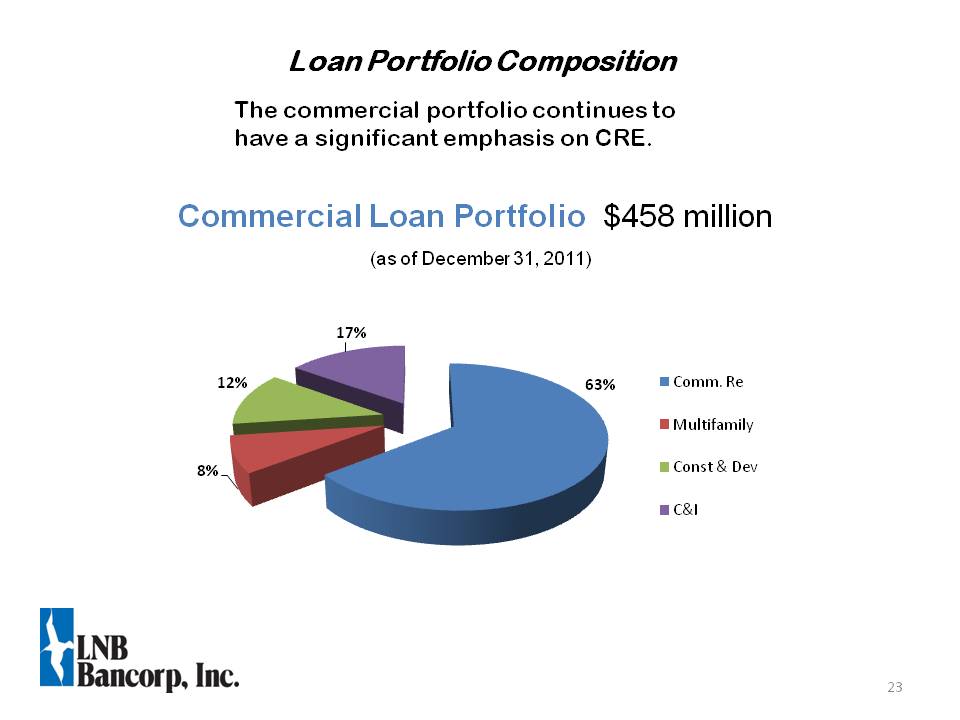
Commercial Loan Portfolio $458 million (as of December 31, 2011) The commercial portfolio continues to have a significant emphasis on CRE. Loan Portfolio Composition
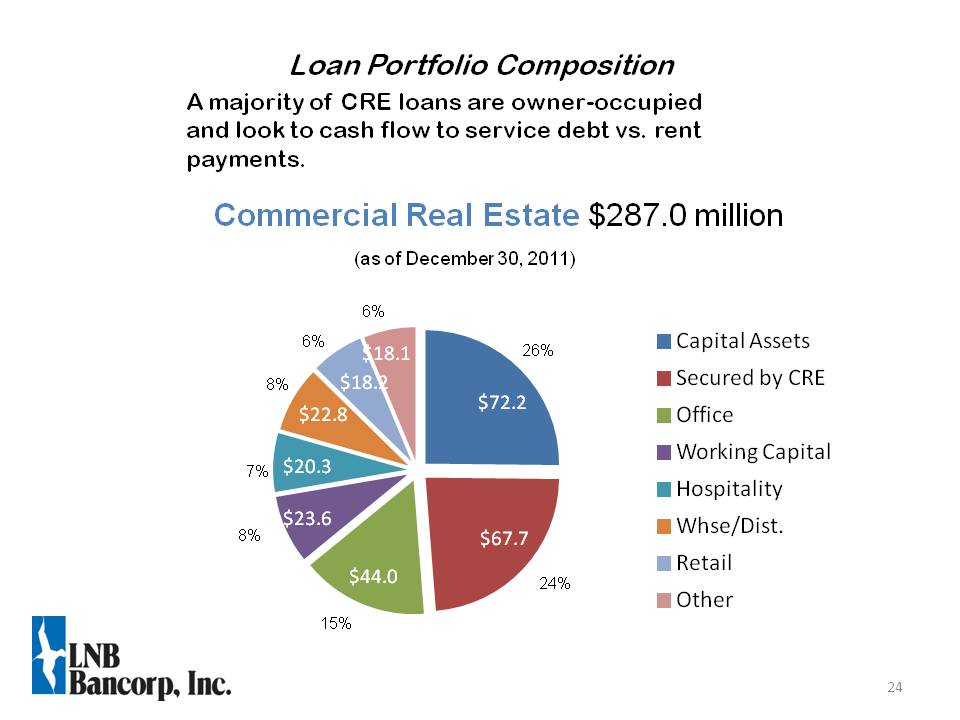
Commercial Real Estate $287.0 million (as of December 30, 2011) A majority of CRE loans are owner-occupied and look to cash flow to service debt vs. rent payments. Loan Portfolio Composition 7% 8%
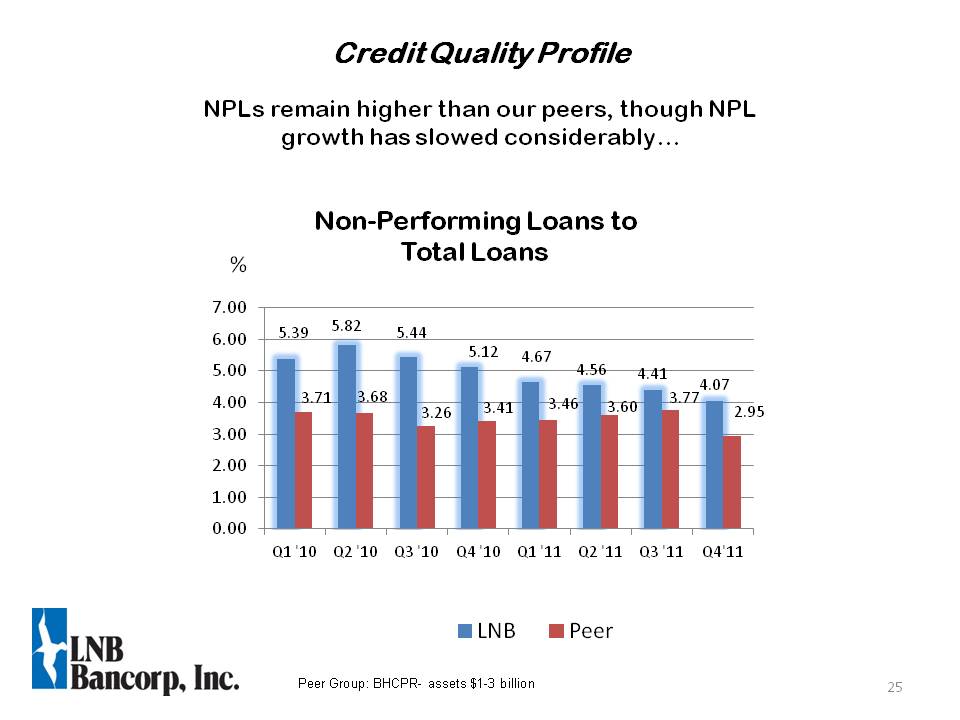
Non-Performing Loans to Total Loans NPLs remain higher than our peers, though NPL growth has slowed considerably % Credit Quality Profile Peer Group: BHCPR- assets $1-3 billion
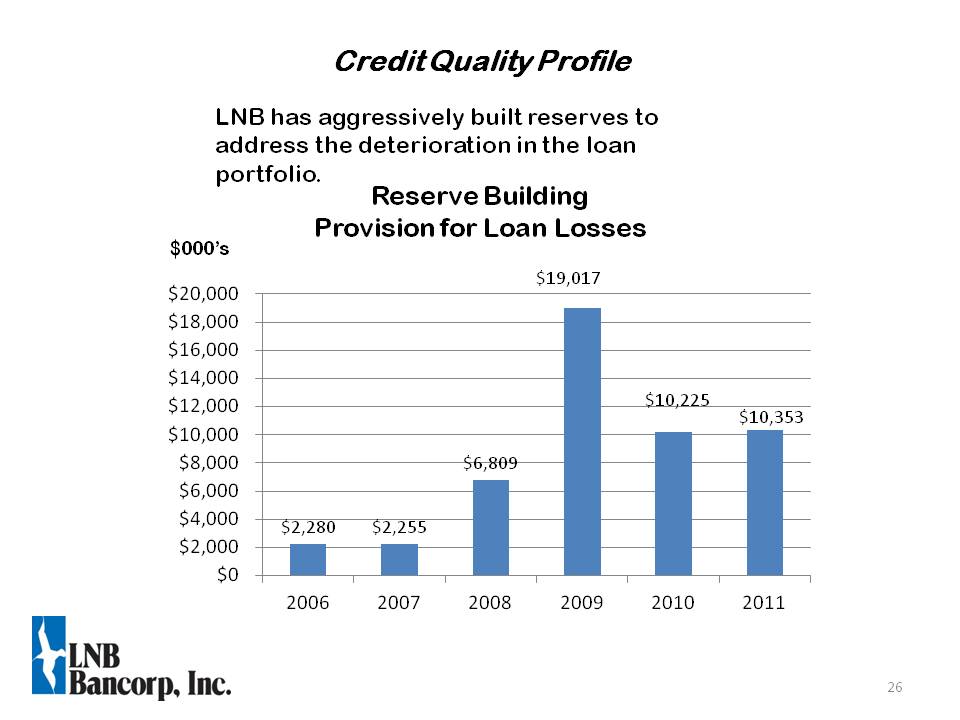
Reserve BuildingProvision for Loan Losses $000’s LNB has aggressively built reserves to address the deterioration in the loan portfolio. Credit Quality Profile
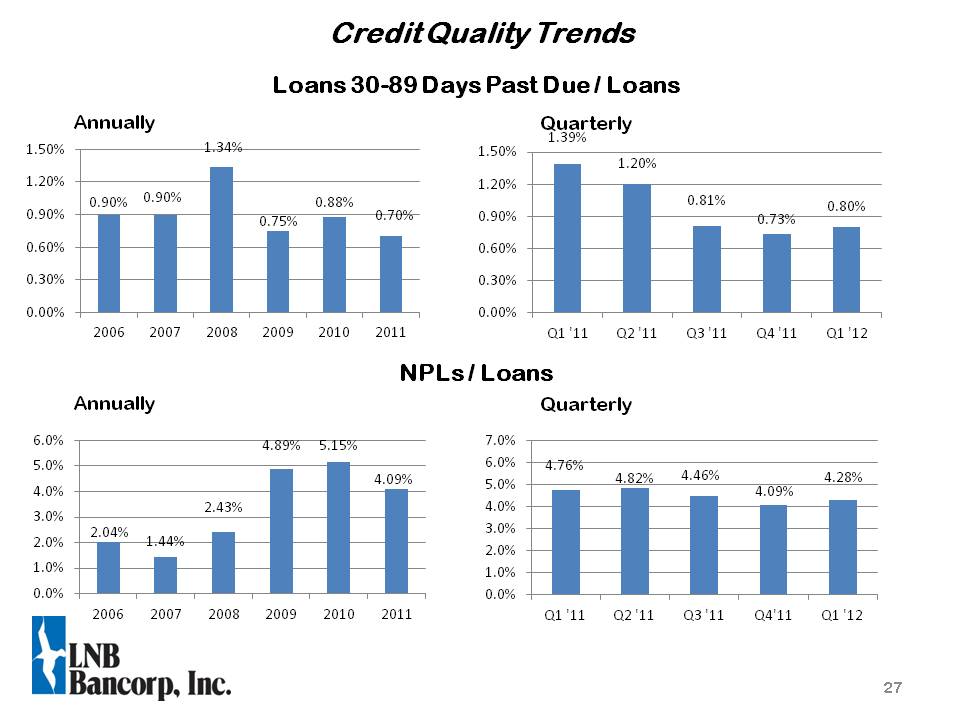
Other Placeholder: 27 Credit Quality Trends Loans 30-89 Days Past Due / Loans NPLs / Loans Annually Quarterly Annually Quarterly
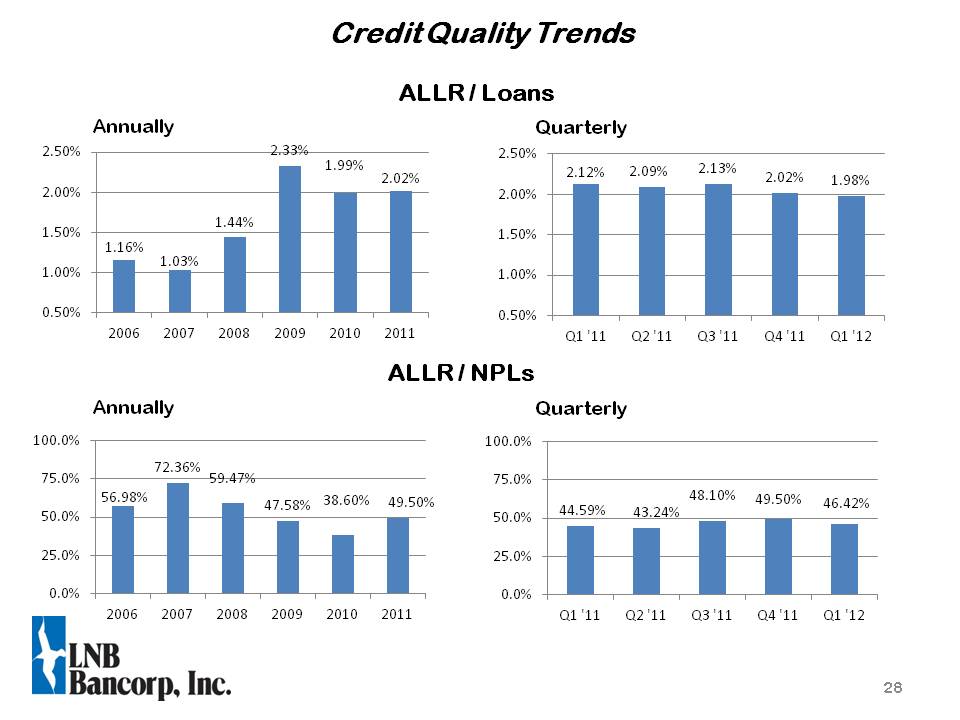
Other Placeholder: 28 Credit Quality Trends ALLR / Loans ALLR / NPLs Annually Quarterly Annually Quarterly
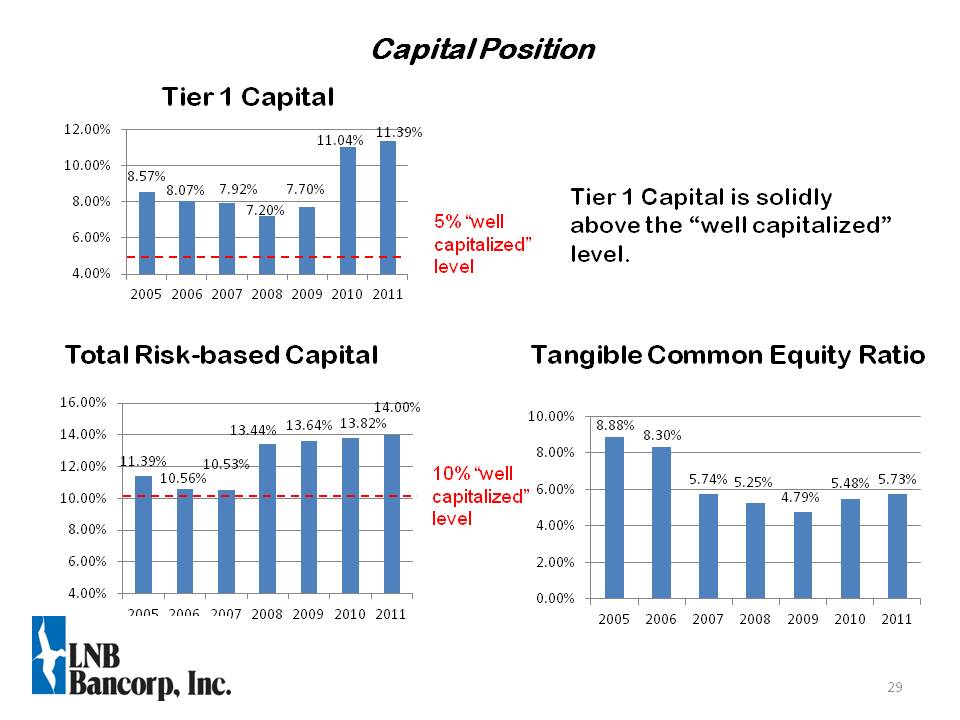
Tier 1 Capital Other Placeholder: 29 Tier 1 Capital is solidly above the “well capitalized” level. 5% “well capitalized” level Capital Position Total Risk-based Capital 10% “well capitalized” level Tangible Common Equity Ratio
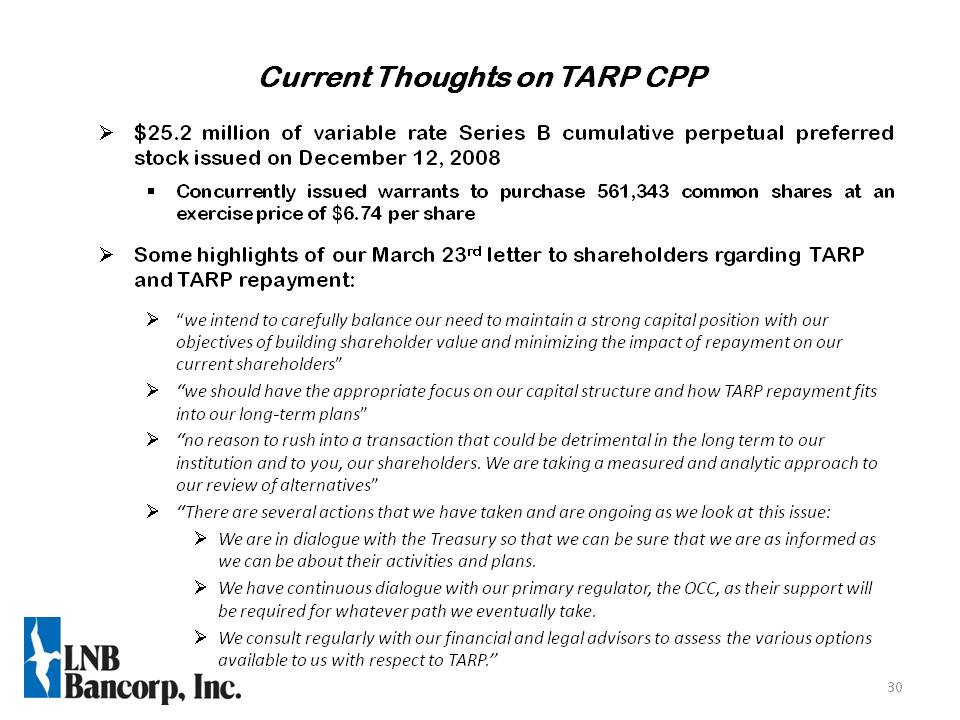
$25.2 million of variable rate Series B cumulative perpetual preferred stock issued on December 12, 2008Concurrently issued warrants to purchase 561,343 common shares at an exercise price of $6.74 per shareSome highlights of our March 23rd letter to shareholders rgarding TARP and TARP repayment:“we intend to carefully balance our need to maintain a strong capital position with our objectives of building shareholder value and minimizing the impact of repayment on our current shareholders”“we should have the appropriate focus on our capital structure and how TARP repayment fits into our long-term plans”“no reason to rush into a transaction that could be detrimental in the long term to our institution and to you, our shareholders. We are taking a measured and analytic approach to our review of alternatives”“There are several actions that we have taken and are ongoing as we look at this issue:We are in dialogue with the Treasury so that we can be sure that we are as informed as we can be about their activities and plans.We have continuous dialogue with our primary regulator, the OCC, as their support will be required for whatever path we eventually take.We consult regularly with our financial and legal advisors to assess the various options available to us with respect to TARP.” Current Thoughts on TARP CPP
LNBB -- Long Term Potential Only “Community Bank of Scale” headquartered in Northeast Ohio Flexibility Responsiveness Speed Focus on core banking capabilities Strong Fee Income Service charges Trust Fees Mortgage Lending Unique high quality indirect auto business Expanding outside Ohio Strong core earnings base and growth trends Compelling Valuation
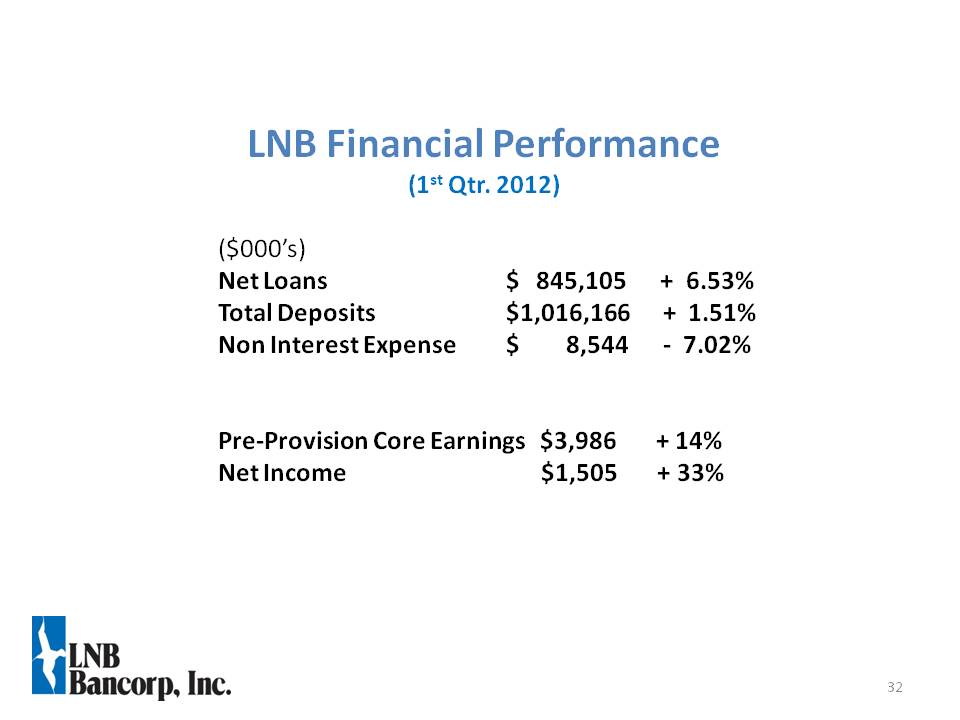
Other Placeholder: 32 LNB Financial Performance (1st Qtr. 2012) ($000’s) Net Loans $ 845,105 + 6.53% Total Deposits $1,016,166 + 1.51% Non Interest Expense $ 8,544 - 7.02% Pre-Provision Core Earnings $3,986 + 14% Net Income $1,505 + 33%