Attached files
| file | filename |
|---|---|
| 8-K - GLU MOBILE INC. 8-K - GLU MOBILE INC | a50261615.htm |
| EX-99.01 - EXHIBIT 99.01 - GLU MOBILE INC | a50261615ex99_01.htm |
Exhibit 99.02

1 Glu Mobile Q112 Earnings Call May 2, 2012
2 Safe-Harbor Statement This presentation contains "forward-looking" statements including those regarding our expectation that we will achieve sustained positive Adjusted EBITDA beginning in Q4 2012, our expectations for global, developer-accessible gaming revenues in 2012, the freemium games we expect to release in the summer of 2012, our expectation that we will release 23 games in 2012, our guidance for the second quarter of 2012 and the full fiscal year, and our target non-GAAP operating model. These forward-looking statements are subject to material risks and uncertainties that could cause actual results to differ materially from those in the forward-looking statements. Investors should consider important risk factors, which include: the risk that Glu will be unable to successfully integrate the companies that it acquired in August 2011, Griptonite and Blammo Games, and its employees and achieve expected synergies, the risk that Glu will have difficulty retaining key employees of the acquired companies; the risk that consumer demand for smartphones, tablets and next-generation platforms does not grow as significantly as we anticipate or that we will be unable to capitalize on any such growth; the risk that we do not realize a sufficient return on our investment with respect to our efforts to develop freemium games for smartphones and tablets, the risk that we do not maintain our good relationships with Apple and Google; the risk that our development expenses for games for smartphones are greater than we anticipate; the risk that our recently and newly launched games are less popular than anticipated; the risk that our newly released games will be of a quality less than desired by reviewers and consumers; the risk that the mobile games market, particularly with respect to social, freemium gaming, is smaller than anticipated; and other risks detailed under the caption "Risk Factors" in our Form 10-K filed with the Securities and Exchange Commission on March 14, 2012 and our other SEC filings. You can locate these reports through our website at http://www.glu.com/investors. These "forward-looking" statements are based on estimates and information available to us on May 2, 2012 and we are under no obligation, and expressly disclaim any obligation, to update or alter our forward-looking statements whether as a result of new information, future events or otherwise.
3 Use of Non-GAAP Financial Measures Glu uses in this presentation certain non-GAAP measures of financial performance. The presentation of these non-GAAP financial measures is not intended to be considered in isolation from, as a substitute for, or superior to, the financial information prepared and presented in accordance with GAAP, and may be different from non-GAAP financial measures used by other companies. In addition, these non-GAAP measures have limitations in that they do not reflect all of the amounts associated with Glu's results of operations as determined in accordance with GAAP. The non-GAAP financial measures used by Glu include non-GAAP revenues, non-GAAP smartphone revenues, non-GAAP freemium revenues, non-GAAP gross margins, non-GAAP operating margin, non-GAAP Profit/(Loss) and Adjusted EBITDA. These non-GAAP financial measures exclude the following items from Glu's unaudited consolidated statements of operations: Change in deferred revenues and royalties;Amortization of intangible assets; Stock-based compensation expense; Restructuring charges; Change in fair value of Blammo earnout; Transitional costs; Release of MIG pre-acquisition tax liabilities; andForeign currency exchange gains and losses primarily related to the revaluation of assets and liabilities. In addition, Glu has included in this presentation “Adjusted EBITDA” figures which are used to evaluate Glu’s operating performance and is defined as non-GAAP operating income/(loss) excluding depreciation.Glu believes that these non-GAAP financial measures, when taken together with the corresponding GAAP financial measures, provide meaningful supplemental information regarding Glu's performance by excluding certain items that may not be indicative of Glu's core business, operating results or future outlook. Glu's management uses, and believes that investors benefit from referring to, these non-GAAP financial measures in assessing Glu's operating results, as well as when planning, forecasting and analyzing future periods. These non-GAAP financial measures also facilitate comparisons of Glu's performance to prior periods. For a reconciliation of these non-GAAP financial measures to their most directly comparable GAAP financial measures, please refer to the tables attached to Glu’s earnings press release for the quarter ended March 31, 2012, which is available on our website at http://www.glu.com/investors.

4 Corporate Overview

5 Intersection of Two Rising Tides: Growth in gaming on mobile devices2) Growth in freemium gaming Leading Freemium Mobile Gaming Company

6 Now Compelling to Mass Market Featurephone focus Branded IP/72% gross margins Titles are packaged goods Premium pricing No community/social Smartphone focus Original IP/88%+ gross margins Persistent titles Freemium with virtual goods Games are social Evolution of Mobile Gaming
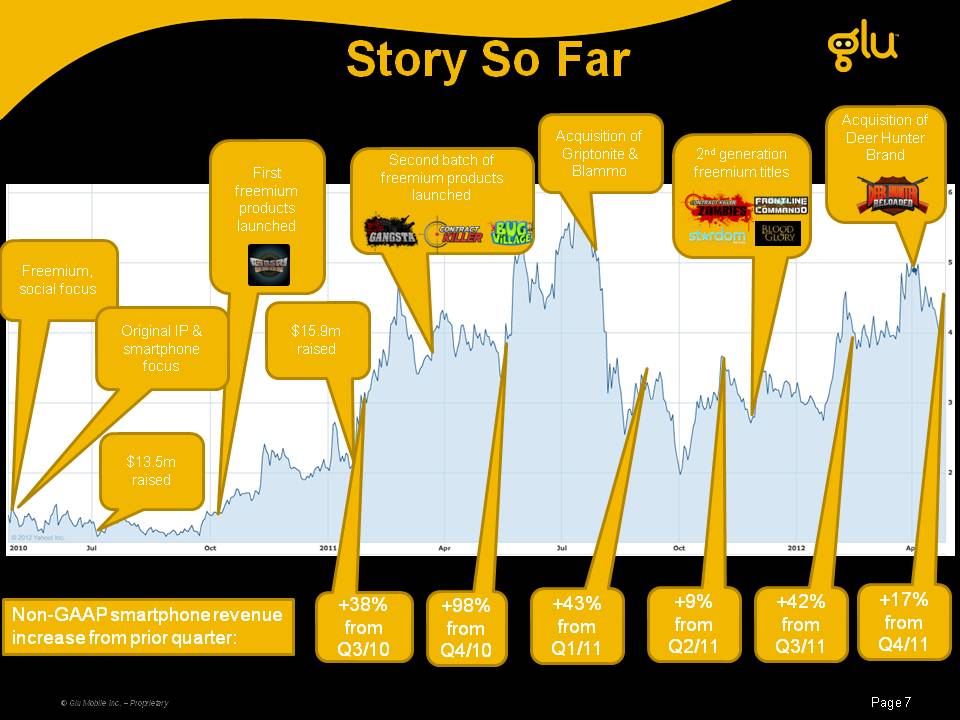
7 Story So Far Freemium, social focus $13.5m raised $15.9m raised First freemium products launched Original IP & smartphone focus Second batch of freemium products launched +38% from Q3/10 +98% from Q4/10 +43% from Q1/11 Acquisition of Griptonite & Blammo 2nd generation freemium titles Non-GAAP smartphone revenue increase from prior quarter: +42% from Q3/11 +9% from Q2/11 +17% from Q4/11 Acquisition of Deer Hunter Brand
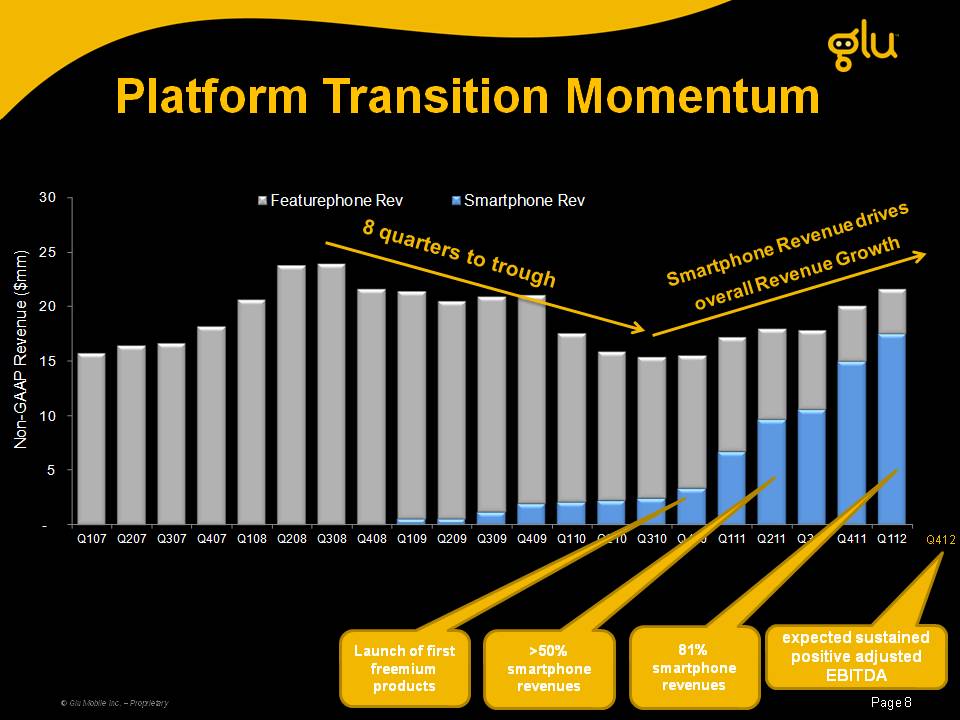
8 Platform Transition Momentum 8 quarters to trough Smartphone Revenue drivesoverall Revenue Growth Q412 >50% smartphone revenues 81% smartphone revenues Launch of first freemium products expected sustained positive adjusted EBITDA
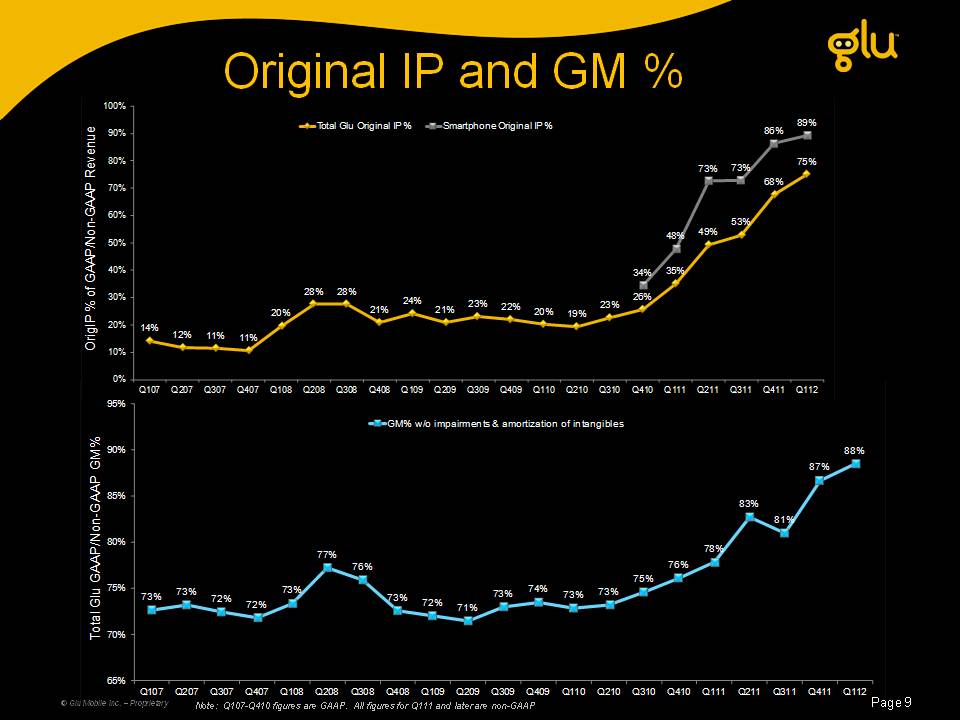
9 Original IP and GM % Note: Q107-Q410 figures are GAAP. All figures for Q111 and later are non-GAAP

10 Growth Opportunity
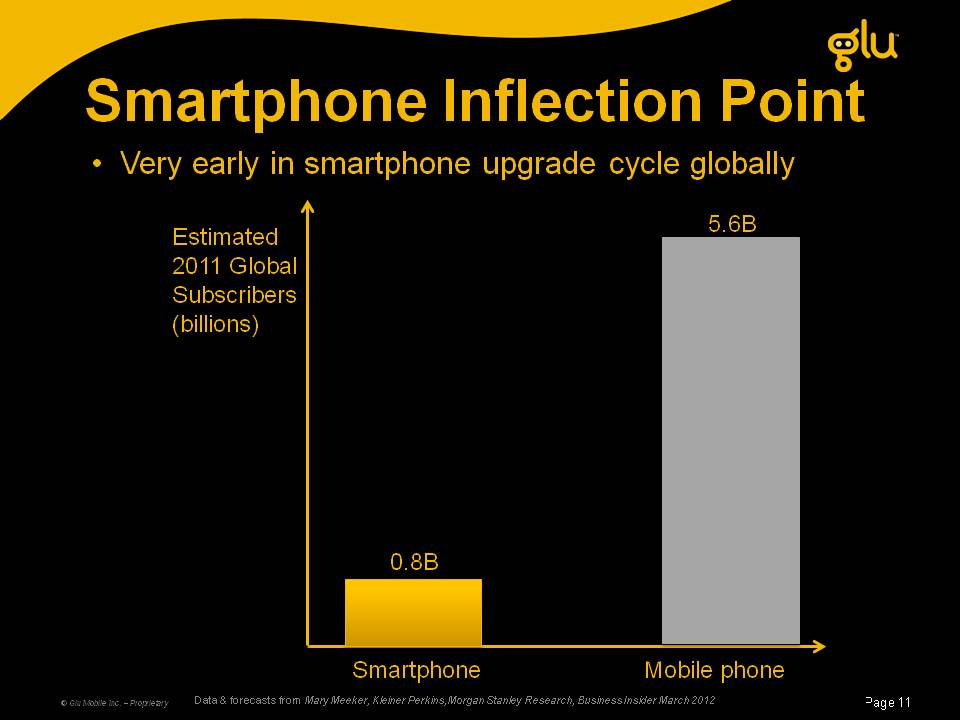
11 Smartphone Inflection Point Data & forecasts from Mary Meeker, Kleiner Perkins,Morgan Stanley Research, Business Insider March 2012 Very early in smartphone upgrade cycle globally Estimated 2011 Global Subscribers (billions) Smartphone Mobile phone 0.8B 5.6B
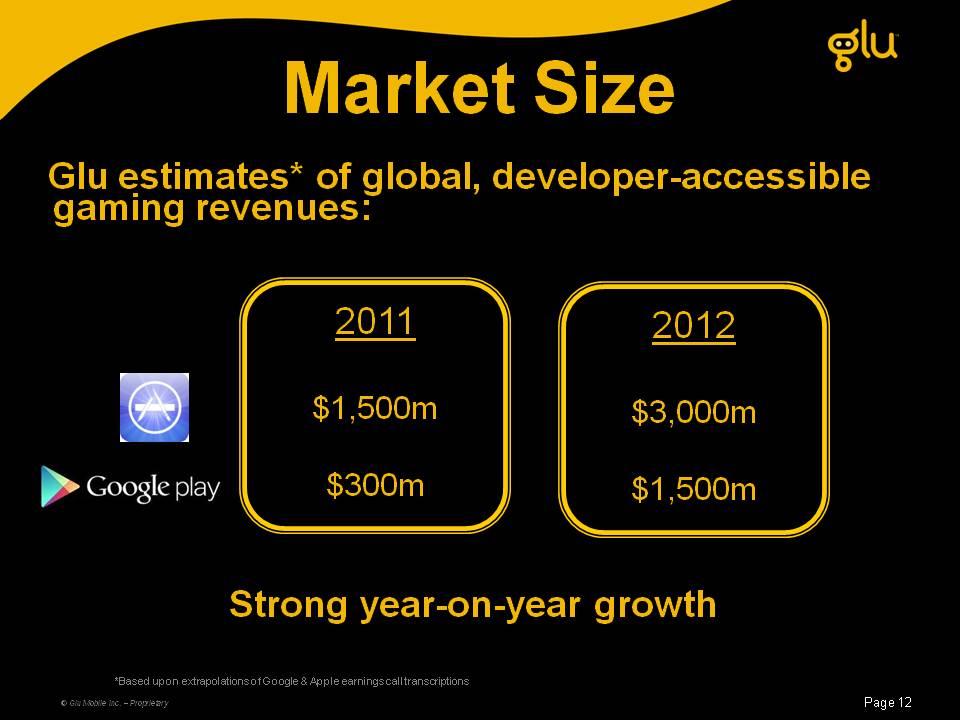
12 2011 $1,500m $300m Market Size Glu estimates* of global, developer-accessible gaming revenues: 2012 $3,000m $1,500m *Based upon extrapolations of Google & Apple earnings call transcriptions Strong year-on-year growth
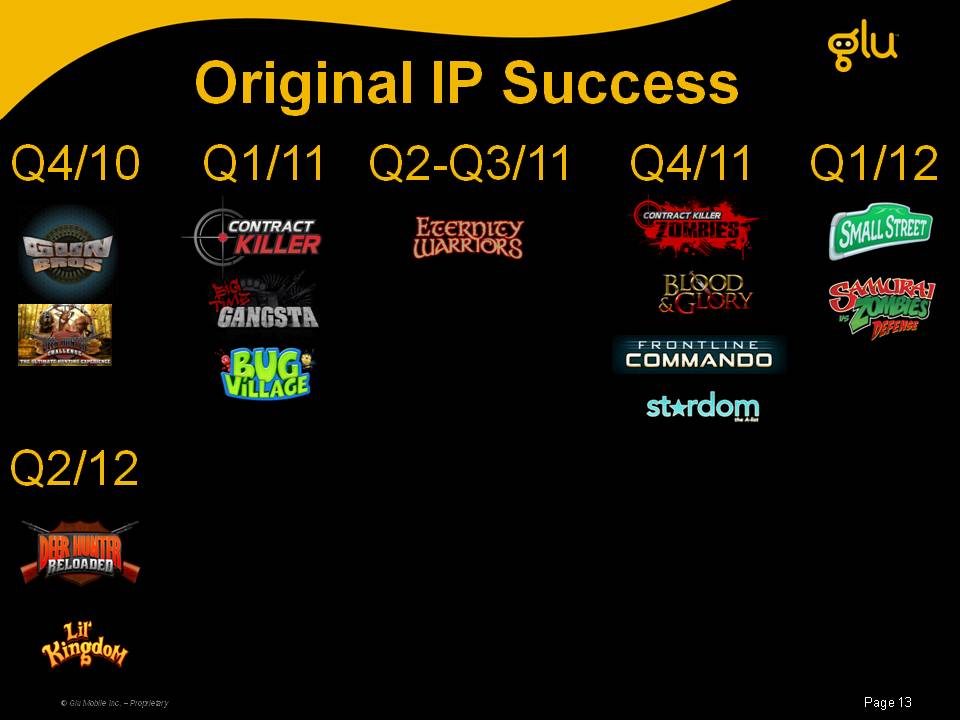
13 Original IP Success Q4/10 Q1/11 Q2-Q3/11 Q4/11 Q1/12 Q2/12

14 A Rising Tide Upon Us Android now installing 850,000 handsets/day*Glu titles first to:Launch on AndroidSupport IAP and HoneycombLeverage Google BeamUtilize APK Expansion File Technology * Andy Rubin via Twitter 2/27/2012
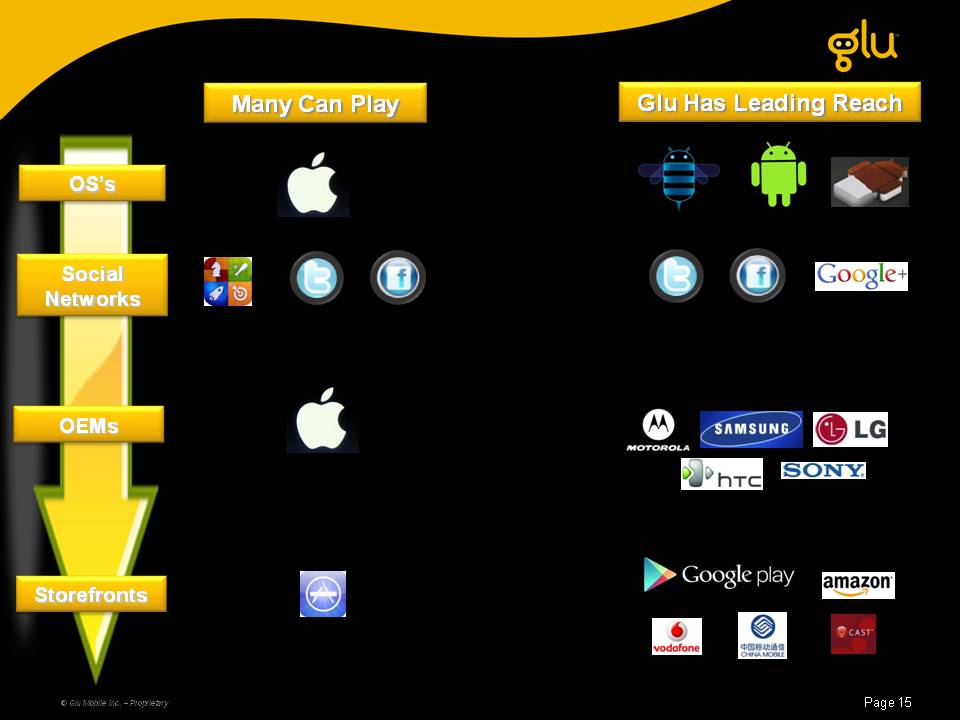
15 Many Can Play OS’s OEMs Storefronts Social Networks Glu Has Leading Reach
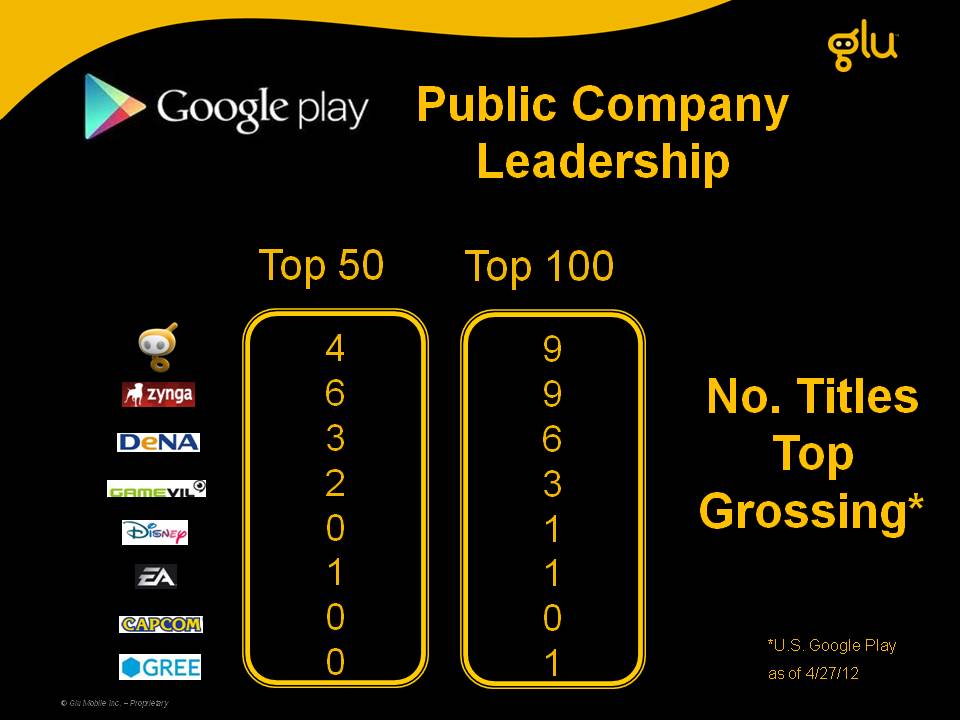
16 No. Titles Top Grossing* 46320100 Top 50 99631100 Top 100 *U.S. Google Play as of 4/27/12 Public Company Leadership
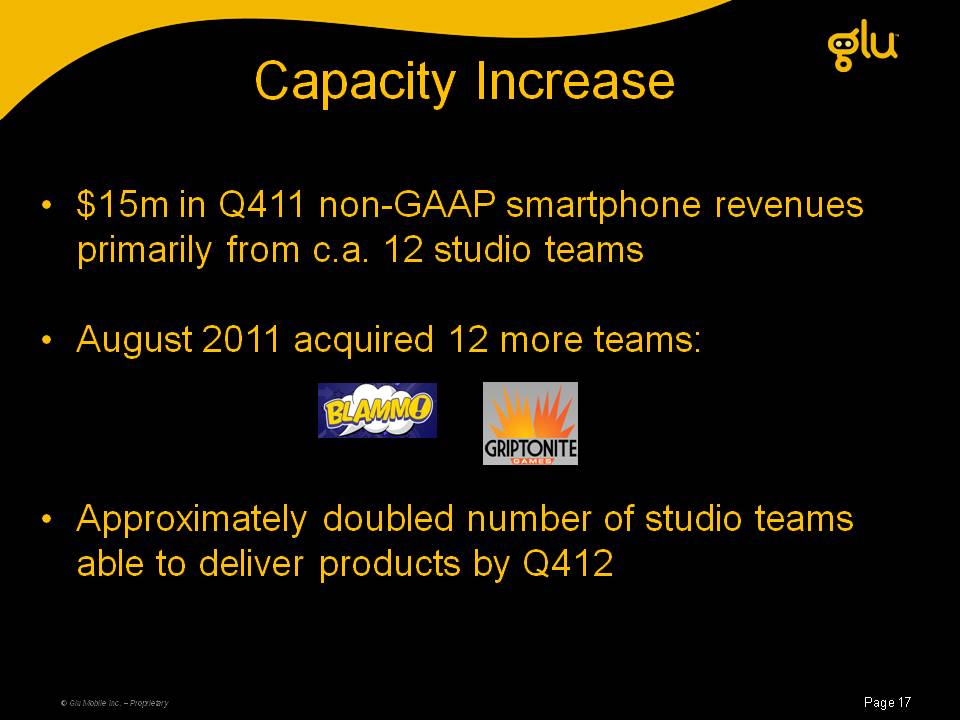
17 $15m in Q411 non-GAAP smartphone revenues primarily from c.a. 12 studio teamsAugust 2011 acquired 12 more teams:Approximately doubled number of studio teams able to deliver products by Q412 Capacity Increase

18 Launch 23 new titles in 2012 Glu Mobile: Company Confidential Q1 Q2 Q3 Q4 3 2 9 9 In Development

19 Financials
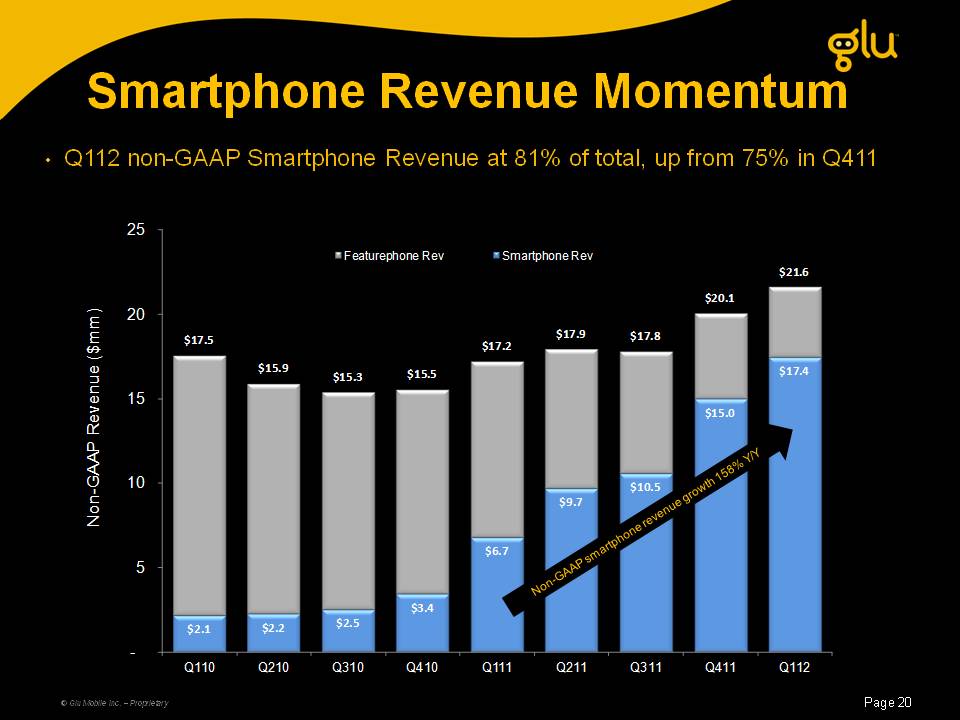
20 Q112 non-GAAP Smartphone Revenue at 81% of total, up from 75% in Q411 Smartphone Revenue Momentum (in millions of dollars) Non-GAAP smartphone revenue growth 158% Y/Y
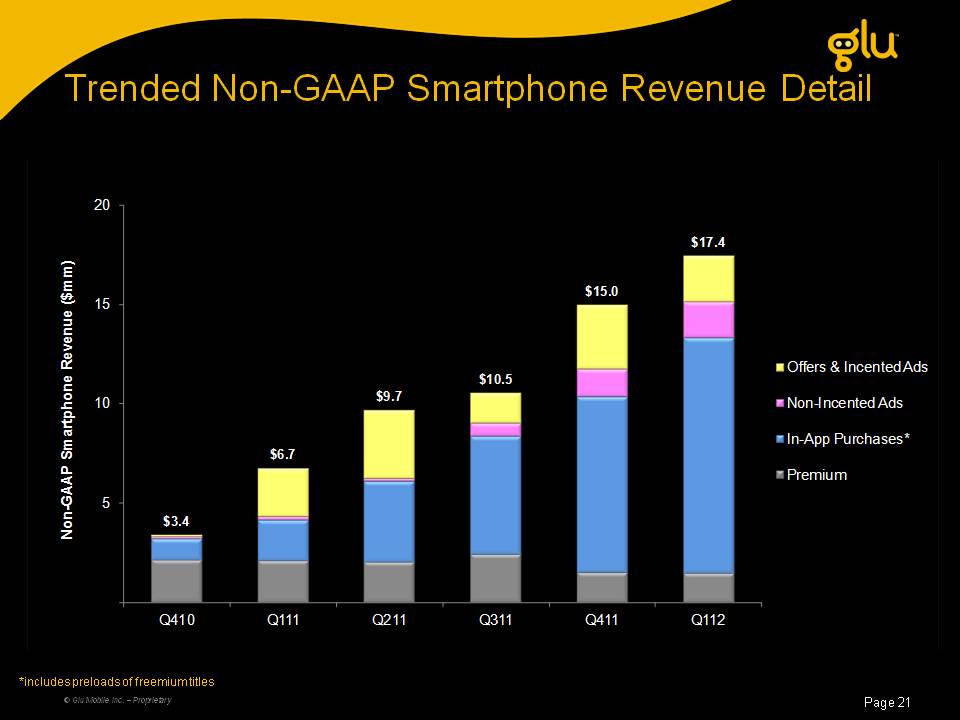
21 Trended Non-GAAP Smartphone Revenue Detail *includes preloads of freemium titles
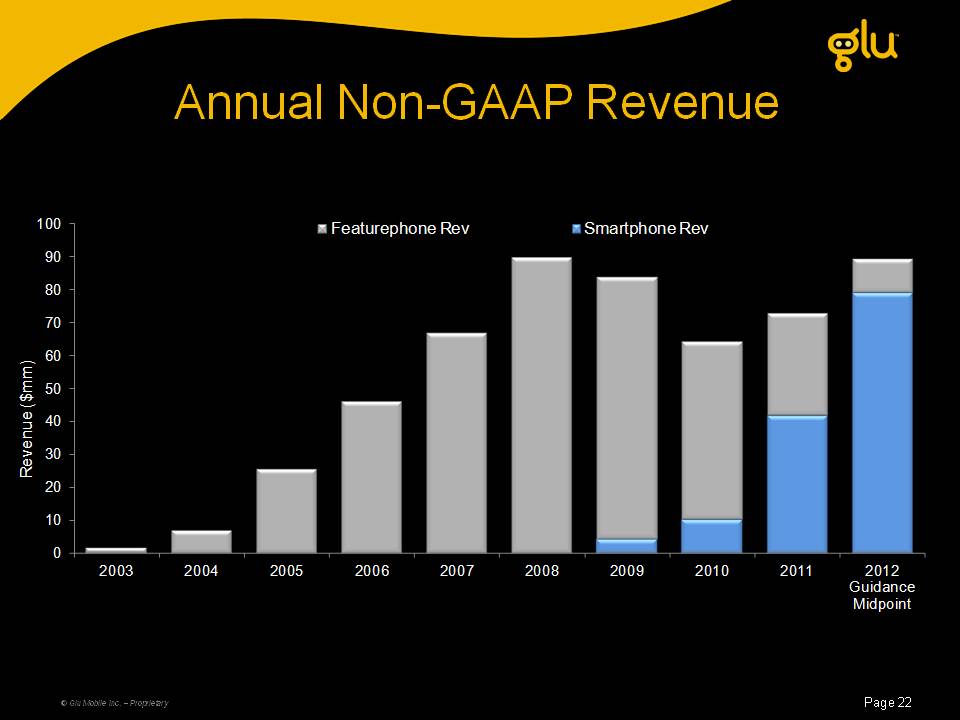
22 Annual Non-GAAP Revenue
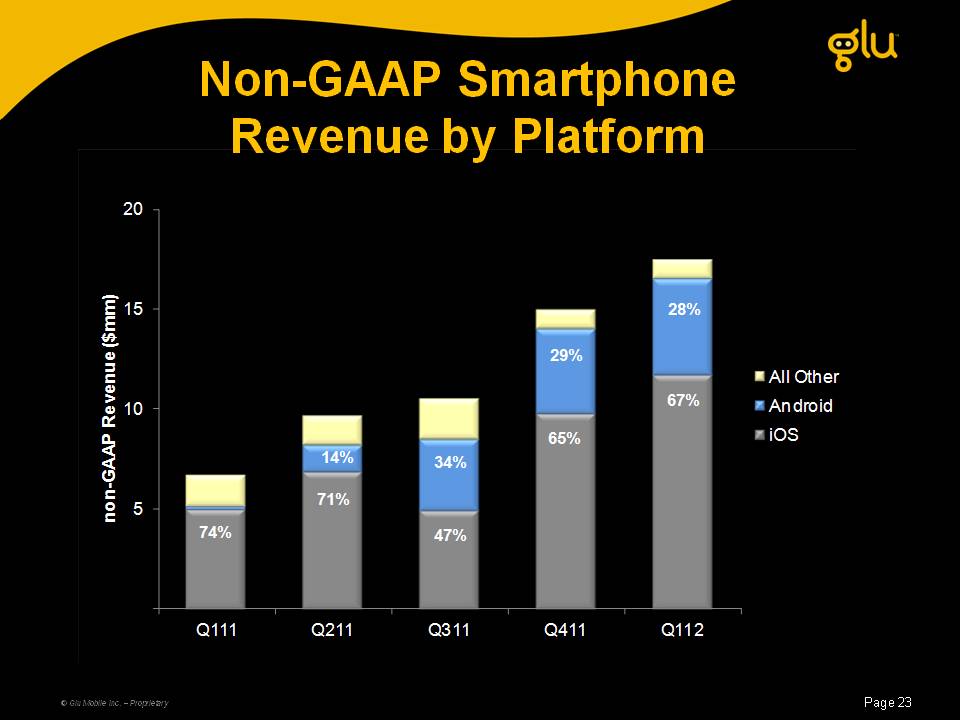
23 Non-GAAP SmartphoneRevenue by Platform
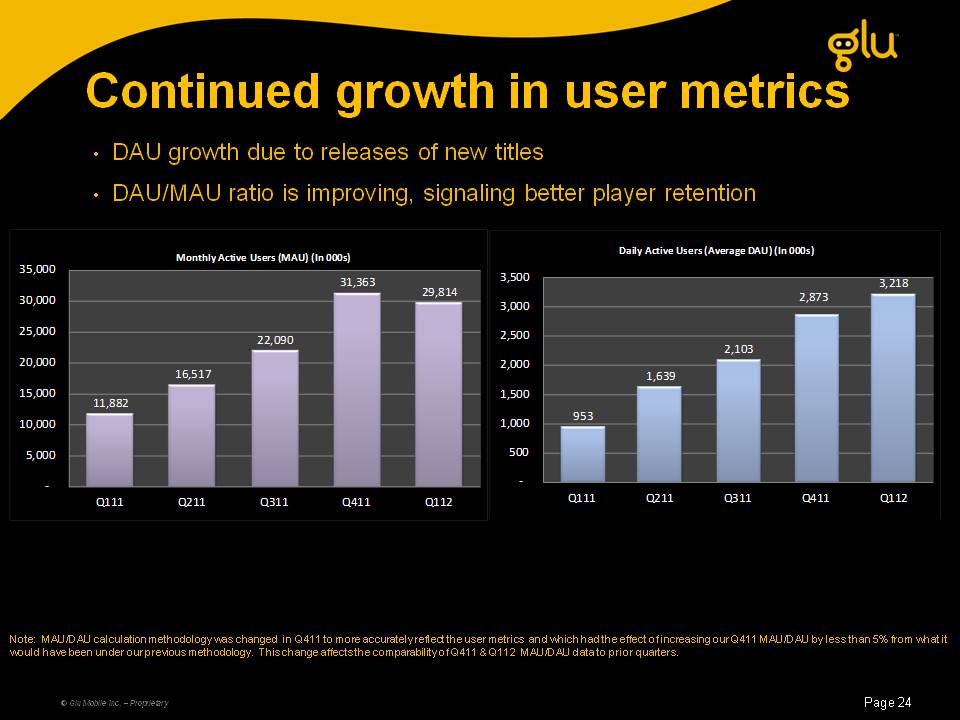
24 DAU growth due to releases of new titlesDAU/MAU ratio is improving, signaling better player retention Continued growth in user metrics Note: MAU/DAU calculation methodology was changed in Q411 to more accurately reflect the user metrics and which had the effect of increasing our Q411 MAU/DAU by less than 5% from what it would have been under our previous methodology. This change affects the comparability of Q411 & Q112 MAU/DAU data to prior quarters.
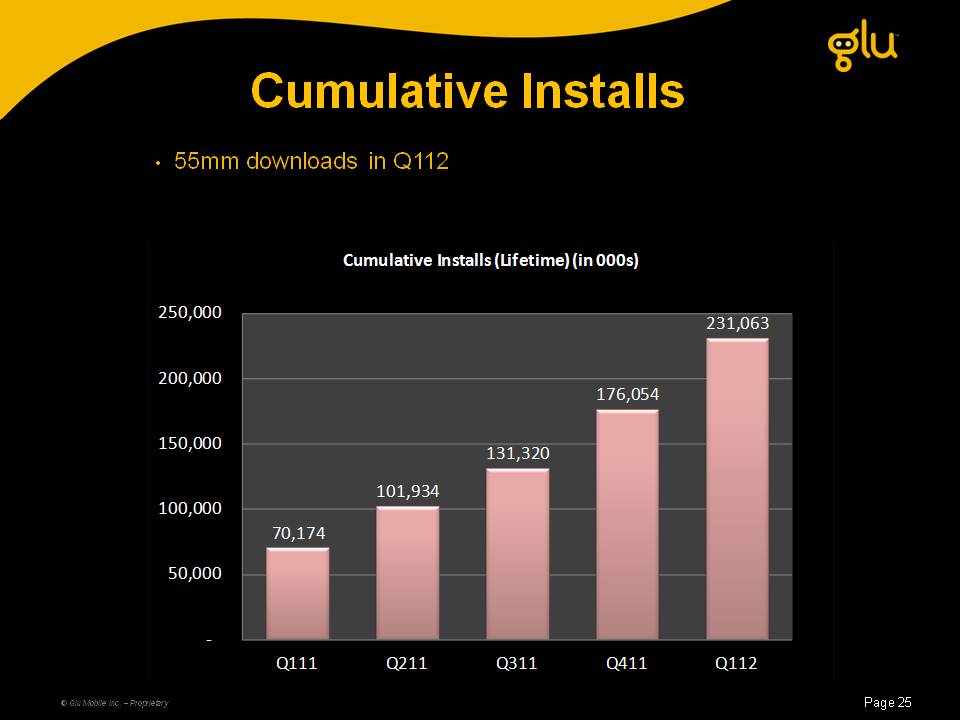
25 Cumulative Installs 55mm downloads in Q112
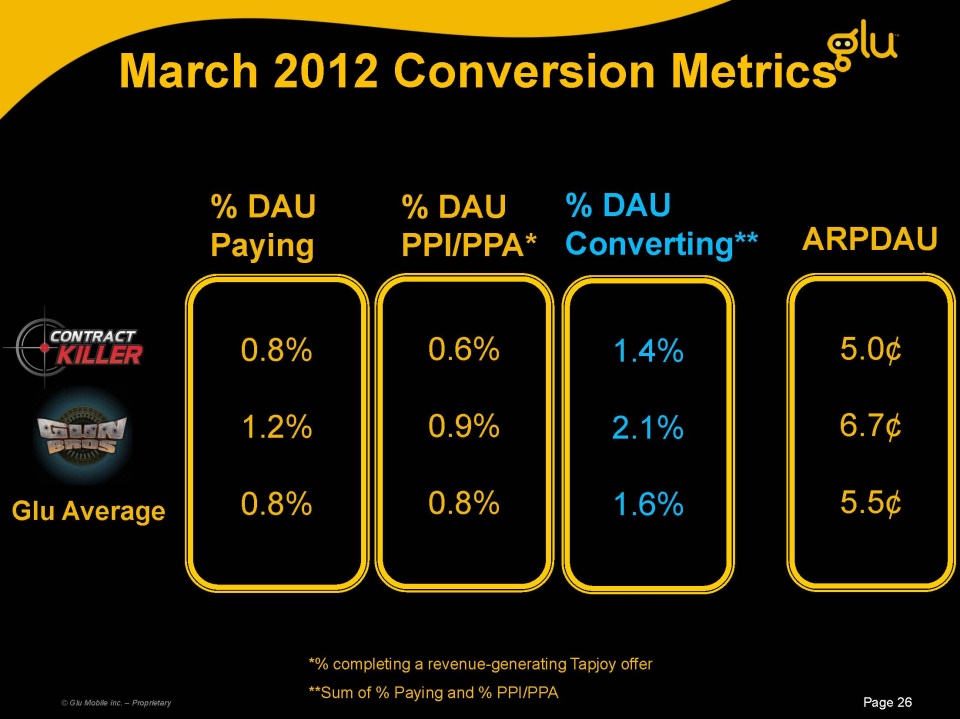
March 2012 Conversion Metrics © Glu Mobile Inc. – Proprietary 1.4% 2.1% 1.6% 5.0¢ 6.7¢ 5.5¢ ARPDAU Glu Average % DAU Converting** *% completing a revenue-generating Tapjoy offer **Sum of % Paying and % PPI/PPA 0.6% 0.9% 0.8% % DAU PPI/PPA* 0.8% 1.2% 0.8% % DAU Paying

27 Q212 & 2012 Guidance and Long Term Model
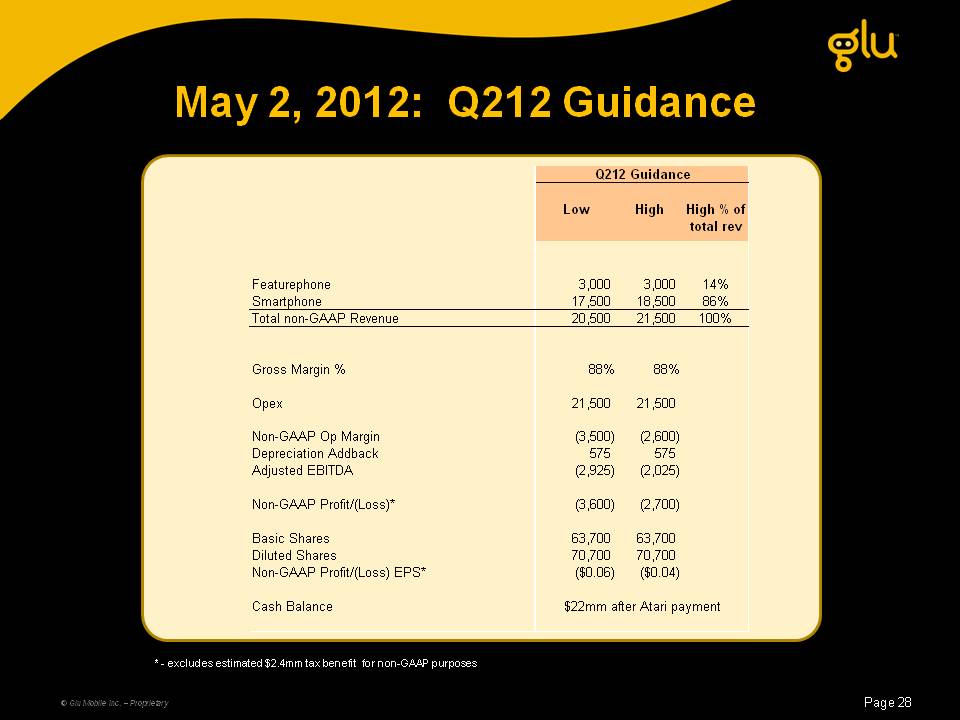
28 May 2, 2012: Q212 Guidance * - excludes estimated $2.4mm tax benefit for non-GAAP purposes
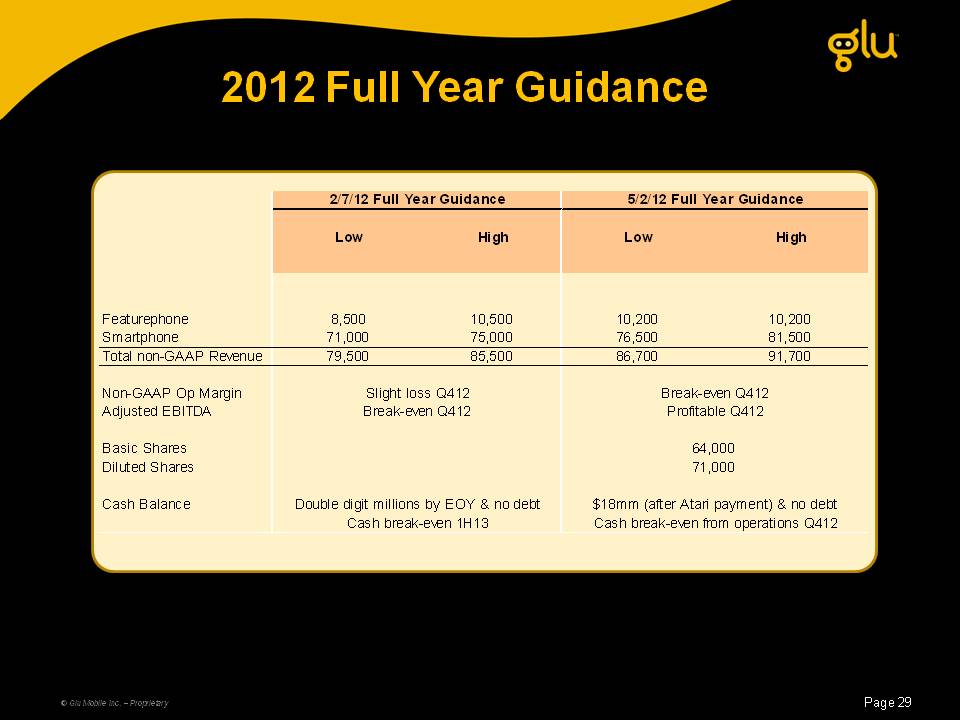
29 2012 Full Year Guidance
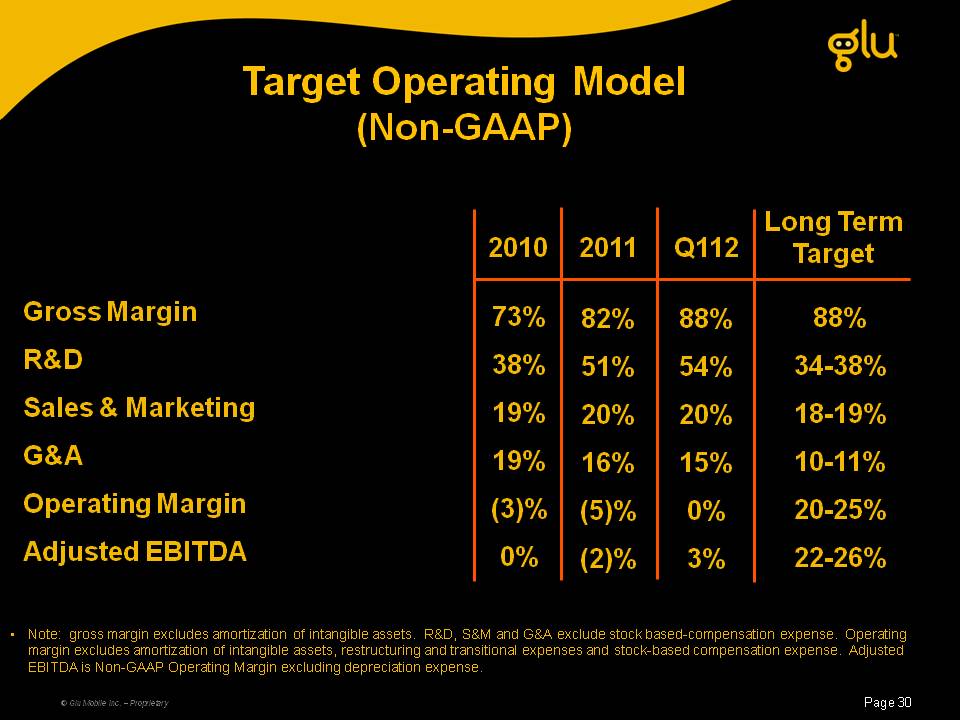
30 Target Operating Model(Non-GAAP) Gross Margin R&D Sales & Marketing G&A Operating Margin Adjusted EBITDA(Gp:) 88% 34-38% 18-19% 10-11% 20-25% 22-26% (Gp:) Long Term Target Note: gross margin excludes amortization of intangible assets. R&D, S&M and G&A exclude stock based-compensation expense. Operating margin excludes amortization of intangible assets, restructuring and transitional expenses and stock-based compensation expense. Adjusted EBITDA is Non-GAAP Operating Margin excluding depreciation expense. (Gp:) 73% 38% 19% 19%(3)% 0% (Gp:) 2010 (Gp:) 88% 54% 20% 15% 0% 3% (Gp:) Q112 (Gp:) 82% 51% 20% 16%(5)%(2)% (Gp:) 2011
31 Glu Mobile: Investment Overview Leading freemium mobile gaming company Original IP titles driving gross margin improvements Acquired two companies to approximately double development capacity
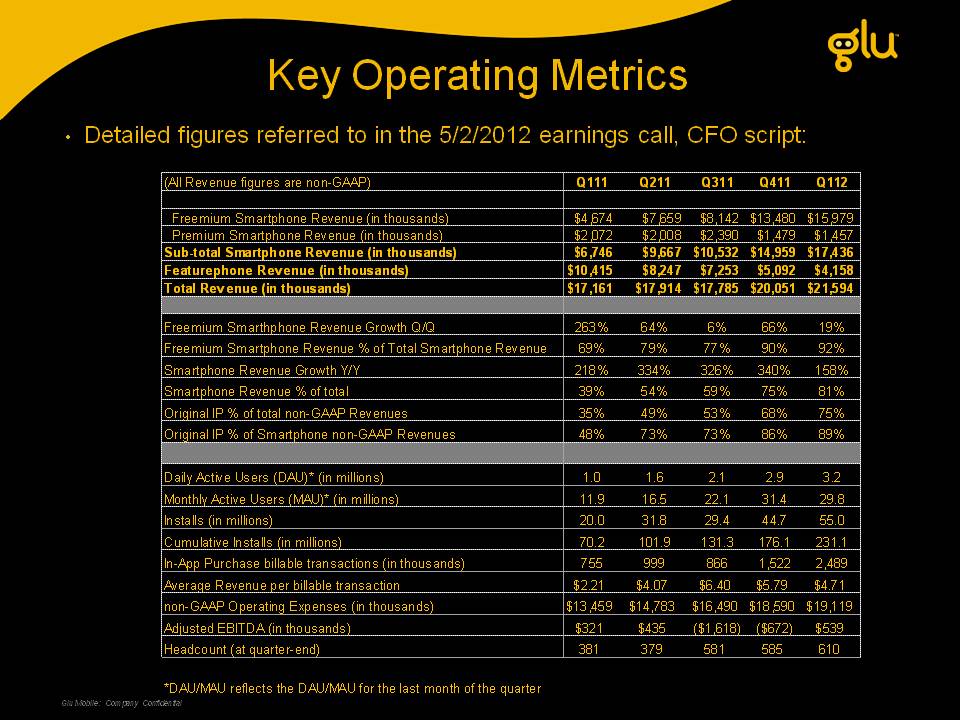
32 Key Operating Metrics Glu Mobile: Company Confidential Detailed figures referred to in the 5/2/2012 earnings call, CFO script: *DAU/MAU reflects the DAU/MAU for the last month of the quarter