Attached files
| file | filename |
|---|---|
| EX-32 - SECTION 906 CEO AND CFO CERTIFICATION - WILLIAMS COMPANIES, INC. | d332393dex32.htm |
| EX-12 - COMPUTATION OF RATIO OF EARNINGS TO FIXED CHARGES - WILLIAMS COMPANIES, INC. | d332393dex12.htm |
| EX-31.2 - SECTION 302 CFO CERTIFICATION - WILLIAMS COMPANIES, INC. | d332393dex312.htm |
| EX-31.1 - SECTION 302 CEO CERTIFICATION - WILLIAMS COMPANIES, INC. | d332393dex311.htm |
| XML - IDEA: UNKNOWN FILE - WILLIAMS COMPANIES, INC. | 0001193125-12-200863_errorLog.txt |
Table of Contents
UNITED STATES
SECURITIES AND EXCHANGE COMMISSION
Washington, D.C. 20549
FORM 10-Q
(Mark One)
| x | QUARTERLY REPORT PURSUANT TO SECTION 13 OR 15(d) OF THE SECURITIES EXCHANGE ACT OF 1934 |
For the quarterly period ended March 31, 2012
or
| ¨ | TRANSITION REPORT PURSUANT TO SECTION 13 OR 15(d) OF THE SECURITIES EXCHANGE ACT OF 1934 |
For the transition period from to
Commission file number 1-4174
THE WILLIAMS COMPANIES, INC.
(Exact name of registrant as specified in its charter)
| DELAWARE | 73-0569878 | |
| (State or other jurisdiction of incorporation or organization) |
(I.R.S. Employer Identification No.) |
| ONE WILLIAMS CENTER, TULSA, OKLAHOMA | 74172 | |
| (Address of principal executive offices) | (Zip Code) |
Registrant’s telephone number, including area code: (918) 573-2000
NO CHANGE
(Former name, former address and former fiscal year, if changed since last report.)
Indicate by check mark whether the registrant (1) has filed all reports required to be filed by Section 13 or 15(d) of the Securities Exchange Act of 1934 during the preceding 12 months (or for such shorter period that the registrant was required to file such reports), and (2) has been subject to such filing requirements for the past 90 days. Yes x No ¨
Indicate by check mark whether the registrant has submitted electronically and posted on its corporate Web site, if any, every Interactive Data File required to be submitted and posted pursuant to Rule 405 of Regulation S-T (§232.405 of this chapter) during the preceding 12 months (or for such shorter period that the registrant was required to submit and post such files). x Yes ¨ No
Indicate by check mark whether the registrant is a large accelerated filer, an accelerated filer, a non-accelerated filer, or a smaller reporting company. See the definitions of “large accelerated filer,” “accelerated filer” and “smaller reporting company” in Rule 12b-2 of the Exchange Act. (Check one):
| Large accelerated filer | x | Accelerated filer | ¨ | |||
| Non-accelerated filer | ¨ (Do not check if a smaller reporting company) | Smaller reporting company | ¨ | |||
Indicate by check mark whether the registrant is a shell company (as defined in Rule 12b-2 of the Exchange Act.) Yes ¨ No x
Indicate the number of shares outstanding of each of the issuer’s classes of common stock, as of the latest practicable date.
| Class |
Outstanding at April 23, 2012 | |
| Common Stock, $1 par value |
625,652,405 Shares |
Table of Contents
The Williams Companies, Inc.
Certain matters contained in this report include “forward-looking statements” within the meaning of Section 27A of the Securities Act of 1933, as amended, and Section 21E of the Securities Exchange Act of 1934, as amended. These forward-looking statements relate to anticipated financial performance, management’s plans and objectives for future operations, business prospects, outcome of regulatory proceedings, market conditions, and other matters. We make these forward-looking statements in reliance on the safe harbor protections provided under the Private Securities Litigation Reform Act of 1995.
All statements, other than statements of historical facts, included in this report that address activities, events, or developments that we expect, believe, or anticipate will exist or may occur in the future, are forward-looking statements. Forward-looking statements can be identified by various forms of words such as “anticipates,” “believes,” “seeks,” “could,” “may,” “should,” “continues,” “estimates,” “expects,” “forecasts,” “intends,” “might,” “goals,” “objectives,” “targets,” “planned,” “potential,” “projects,” “scheduled,” “will,” or other similar expressions. These forward-looking statements are based on management’s beliefs and assumptions and on information currently available to management and include, among others, statements regarding:
| • | Amounts and nature of future capital expenditures; |
| • | Expansion and growth of our business and operations; |
| • | Financial condition and liquidity; |
| • | Business strategy; |
| • | Cash flow from operations or results of operations; |
| • | The levels of dividends to stockholders; |
| • | Seasonality of certain business components; |
| • | Natural gas, natural gas liquids, and crude oil prices and demand. |
1
Table of Contents
Forward-looking statements are based on numerous assumptions, uncertainties, and risks that could cause future events or results to be materially different from those stated or implied in this report. Many of the factors that will determine these results are beyond our ability to control or predict. Specific factors that could cause actual results to differ from results contemplated by the forward-looking statements include, among others, the following:
| • | Whether we have sufficient cash to enable us to pay current and expected levels of dividends; |
| • | Availability of supplies, market demand, volatility of prices, and the availability and cost of capital; |
| • | Inflation, interest rates, fluctuation in foreign exchange, and general economic conditions (including future disruptions and volatility in the global credit markets and the impact of these events on our customers and suppliers); |
| • | The strength and financial resources of our competitors; |
| • | Ability to acquire new businesses and assets and integrate those operations and assets into our existing businesses, as well as expand our facilities; |
| • | Development of alternative energy sources; |
| • | The impact of operational and development hazards; |
| • | Costs of, changes in, or the results of laws, government regulations (including safety and climate change regulation and changes in natural gas production from exploration and production areas that we serve), environmental liabilities, litigation, and rate proceedings; |
| • | Our costs and funding obligations for defined benefit pension plans and other postretirement benefit plans; |
| • | Changes in maintenance and construction costs; |
| • | Changes in the current geopolitical situation; |
| • | Our exposure to the credit risk of our customers and counterparties; |
| • | Risks related to strategy and financing, including restrictions stemming from our debt agreements, future changes in our credit ratings, and the availability and cost of credit; |
| • | Risks associated with future weather conditions; |
| • | Acts of terrorism, including cybersecurity threats and related disruptions; |
| • | Additional risks described in our filings with the Securities and Exchange Commission (SEC). |
Given the uncertainties and risk factors that could cause our actual results to differ materially from those contained in any forward-looking statement, we caution investors not to unduly rely on our forward-looking statements. We disclaim any obligations to and do not intend to update the above list or to announce publicly the result of any revisions to any of the forward-looking statements to reflect future events or developments.
In addition to causing our actual results to differ, the factors listed above and referred to below may cause our intentions to change from those statements of intention set forth in this report. Such changes in our intentions may also cause our results to differ. We may change our intentions, at any time and without notice, based upon changes in such factors, our assumptions, or otherwise.
Because forward-looking statements involve risks and uncertainties, we caution that there are important factors, in addition to those listed above, that may cause actual results to differ materially from those contained in the forward-looking statements. For a detailed discussion of those factors, see Part I, Item 1A. Risk Factors in our Annual Report on Form 10-K for the year ended December 31, 2011.
2
Table of Contents
The Williams Companies, Inc.
Consolidated Statement of Income
(Unaudited)
| Three months ended March 31, | ||||||||
| (Millions, except per-share amounts) |
2012 | 2011 | ||||||
| Revenues: |
||||||||
| Williams Partners |
$ | 1,685 | $ | 1,579 | ||||
| Midstream Canada & Olefins |
345 | 316 | ||||||
| Other |
6 | 6 | ||||||
| Intercompany eliminations |
(17 | ) | (30 | ) | ||||
|
|
|
|
|
|||||
| Total revenues |
2,019 | 1,871 | ||||||
|
|
|
|
|
|||||
| Segment costs and expenses: |
||||||||
| Costs and operating expenses |
1,348 | 1,309 | ||||||
| Selling, general, and administrative expenses |
96 | 82 | ||||||
| Other (income) expense – net |
8 | (6 | ) | |||||
|
|
|
|
|
|||||
| Total segment costs and expenses |
1,452 | 1,385 | ||||||
|
|
|
|
|
|||||
| General corporate expenses |
40 | 47 | ||||||
|
|
|
|
|
|||||
| Operating income (loss): |
||||||||
| Williams Partners |
458 | 412 | ||||||
| Midstream Canada & Olefins |
104 | 74 | ||||||
| Other |
5 | — | ||||||
| General corporate expenses |
(40 | ) | (47 | ) | ||||
|
|
|
|
|
|||||
| Total operating income (loss) |
527 | 439 | ||||||
| Interest accrued |
(141 | ) | (156 | ) | ||||
| Interest capitalized |
10 | 5 | ||||||
| Investing income – net |
100 | 44 | ||||||
| Other income (expense) – net |
(4 | ) | 6 | |||||
|
|
|
|
|
|||||
| Income (loss) from continuing operations before income taxes |
492 | 338 | ||||||
| Provision (benefit) for income taxes |
133 | (22 | ) | |||||
|
|
|
|
|
|||||
| Income (loss) from continuing operations |
359 | 360 | ||||||
| Income (loss) from discontinued operations |
136 | 24 | ||||||
|
|
|
|
|
|||||
| Net income (loss) |
495 | 384 | ||||||
| Less: Net income attributable to noncontrolling interests |
72 | 63 | ||||||
|
|
|
|
|
|||||
| Net income (loss) attributable to The Williams Companies, Inc. |
$ | 423 | $ | 321 | ||||
|
|
|
|
|
|||||
| Amounts attributable to The Williams Companies, Inc.: |
||||||||
| Income (loss) from continuing operations |
$ | 287 | $ | 300 | ||||
| Income (loss) from discontinued operations |
136 | 21 | ||||||
|
|
|
|
|
|||||
| Net income (loss) |
$ | 423 | $ | 321 | ||||
|
|
|
|
|
|||||
| Basic earnings (loss) per common share: |
||||||||
| Income (loss) from continuing operations |
$ | .48 | $ | .51 | ||||
| Income (loss) from discontinued operations |
.23 | .04 | ||||||
|
|
|
|
|
|||||
| Net income (loss) |
$ | .71 | $ | .55 | ||||
|
|
|
|
|
|||||
| Weighted-average shares (thousands) |
593,231 | 586,977 | ||||||
| Diluted earnings (loss) per common share: |
||||||||
| Income (loss) from continuing operations |
$ | .47 | $ | .50 | ||||
| Income (loss) from discontinued operations |
.23 | .04 | ||||||
|
|
|
|
|
|||||
| Net income (loss) |
$ | .70 | $ | .54 | ||||
|
|
|
|
|
|||||
| Weighted-average shares (thousands) |
600,520 | 596,567 | ||||||
| Cash dividends declared per common share |
$ | .25875 | $ | .125 | ||||
See accompanying notes.
3
Table of Contents
The Williams Companies, Inc.
Consolidated Statement of Comprehensive Income
(Unaudited)
| Three months ended March 31, | ||||||||
| (Millions) |
2012 | 2011 | ||||||
| Net income (loss) |
$ | 495 | $ | 384 | ||||
| Other comprehensive income (loss): |
||||||||
| Cash flow hedging activities: |
||||||||
| Net unrealized gain (loss) from derivative instruments, net of taxes of $2 in 2012 and $8 in 2011 |
(6 | ) | (15 | ) | ||||
| Reclassifications into earnings of net derivative instrument (gain) loss, net of taxes of $28 in 2011 |
1 | (47 | ) | |||||
| Foreign currency translation adjustments |
19 | 22 | ||||||
| Amortization of actuarial (gain) loss on pension and other postretirement benefits included in net periodic benefit expense, net of taxes of ($5) in 2012 and ($4) in 2011 |
9 | 6 | ||||||
| Reclassifications into earnings of (gain) loss on sale of equity securities, net of taxes of $2 in 2012 |
(3 | ) | — | |||||
|
|
|
|
|
|||||
| Other comprehensive income (loss) |
20 | (34 | ) | |||||
|
|
|
|
|
|||||
| Comprehensive income (loss) |
515 | 350 | ||||||
| Less: Comprehensive income (loss) attributable to noncontrolling interest |
70 | 63 | ||||||
|
|
|
|
|
|||||
| Comprehensive income (loss) attributable to The Williams Companies, Inc. |
$ | 445 | $ | 287 | ||||
|
|
|
|
|
|||||
See accompanying notes.
4
Table of Contents
The Williams Companies, Inc.
(Unaudited)
| (Dollars in millions, except per-share amounts) |
March 31, 2012 |
December 31, 2011 |
||||||
| ASSETS |
||||||||
| Current assets: |
||||||||
| Cash and cash equivalents |
$ | 1,100 | $ | 889 | ||||
| Accounts and notes receivable (net of allowance of $1 at March 31, 2012 and December 31, 2011) |
641 | 637 | ||||||
| Inventories |
186 | 169 | ||||||
| Regulatory assets |
40 | 40 | ||||||
| Other current assets and deferred charges |
152 | 159 | ||||||
|
|
|
|
|
|||||
| Total current assets |
2,119 | 1,894 | ||||||
| Investments |
1,418 | 1,391 | ||||||
| Property, plant, and equipment, at cost |
19,601 | 19,082 | ||||||
| Accumulated depreciation and amortization |
(6,637 | ) | (6,502 | ) | ||||
|
|
|
|
|
|||||
| Property, plant, and equipment - net |
12,964 | 12,580 | ||||||
| Goodwill and other intangibles |
668 | 44 | ||||||
| Regulatory assets, deferred charges, and other |
621 | 593 | ||||||
|
|
|
|
|
|||||
| Total assets |
$ | 17,790 | $ | 16,502 | ||||
|
|
|
|
|
|||||
| LIABILITIES AND EQUITY |
||||||||
| Current liabilities: |
||||||||
| Accounts payable |
$ | 676 | $ | 691 | ||||
| Accrued liabilities |
529 | 631 | ||||||
| Long-term debt due within one year |
329 | 353 | ||||||
|
|
|
|
|
|||||
| Total current liabilities |
1,534 | 1,675 | ||||||
| Long-term debt |
8,366 | 8,369 | ||||||
| Deferred income taxes |
2,435 | 2,157 | ||||||
| Regulatory liabilities, deferred income, and other |
1,731 | 1,715 | ||||||
| Contingent liabilities (Note 12) |
||||||||
| Equity: |
||||||||
| Stockholders’ equity: |
||||||||
| Common stock (960 million shares authorized at $1 par value; 630 million shares issued at March 31, 2012 and 626 million shares issued at December 31, 2011) |
630 | 626 | ||||||
| Capital in excess of par value |
8,269 | 7,920 | ||||||
| Retained deficit |
(5,551 | ) | (5,820 | ) | ||||
| Accumulated other comprehensive income (loss) |
(367 | ) | (389 | ) | ||||
| Treasury stock, at cost (35 million shares of common stock) |
(1,041 | ) | (1,041 | ) | ||||
|
|
|
|
|
|||||
| Total stockholders’ equity |
1,940 | 1,296 | ||||||
| Noncontrolling interests in consolidated subsidiaries |
1,784 | 1,290 | ||||||
|
|
|
|
|
|||||
| Total equity |
3,724 | 2,586 | ||||||
|
|
|
|
|
|||||
| Total liabilities and equity |
$ | 17,790 | $ | 16,502 | ||||
|
|
|
|
|
|||||
See accompanying notes.
5
Table of Contents
The Williams Companies, Inc.
Consolidated Statement of Changes in Equity
(Unaudited)
| The Williams Companies, Inc., Stockholders | ||||||||||||||||||||||||||||||||
| Common Stock |
Capital in Excess of Par Value |
Retained Deficit |
Accumulated Other Comprehensive Loss |
Treasury Stock |
Total Stockholders’ Equity |
Noncontrolling Interest |
Total | |||||||||||||||||||||||||
| (Millions) | ||||||||||||||||||||||||||||||||
| Balance, December 31, 2011 |
$ | 626 | $ | 7,920 | $ | (5,820 | ) | $ | (389 | ) | $ | (1,041 | ) | $ | 1,296 | $ | 1,290 | $ | 2,586 | |||||||||||||
| Net income (loss) |
— | — | 423 | — | — | 423 | 72 | 495 | ||||||||||||||||||||||||
| Other comprehensive income (loss) |
— | — | — | 22 | — | 22 | (2 | ) | 20 | |||||||||||||||||||||||
| Cash dividends – common stock |
— | — | (154 | ) | — | — | (154 | ) | — | (154 | ) | |||||||||||||||||||||
| Dividends and distributions to noncontrolling interests |
— | — | — | — | — | — | (99 | ) | (99 | ) | ||||||||||||||||||||||
| Issuance of common stock from debentures conversion |
— | 3 | — | — | — | 3 | — | 3 | ||||||||||||||||||||||||
| Stock-based compensation, net of tax |
4 | 35 | — | — | — | 39 | — | 39 | ||||||||||||||||||||||||
| Sale of limited partner units of Williams Partners L.P. |
— | — | — | — | — | — | 490 | 490 | ||||||||||||||||||||||||
| Issuance of limited partner units of Williams Partners L.P. related to acquisition |
— | — | — | — | — | — | 465 | 465 | ||||||||||||||||||||||||
| Changes in Williams Partners L.P. ownership interest, net |
— | 313 | — | — | — | 313 | (498 | ) | (185 | ) | ||||||||||||||||||||||
| Reconsolidation of noncontrolling interest in Wilpro entities (see Note 3) |
— | — | — | — | — | — | 65 | 65 | ||||||||||||||||||||||||
| Other |
— | (2 | ) | — | — | — | (2 | ) | 1 | (1 | ) | |||||||||||||||||||||
|
|
|
|
|
|
|
|
|
|
|
|
|
|
|
|
|
|||||||||||||||||
| Balance, March 31, 2012 |
$ | 630 | $ | 8,269 | $ | (5,551 | ) | $ | (367 | ) | $ | (1,041 | ) | $ | 1,940 | $ | 1,784 | $ | 3,724 | |||||||||||||
|
|
|
|
|
|
|
|
|
|
|
|
|
|
|
|
|
|||||||||||||||||
See accompanying notes.
6
Table of Contents
The Williams Companies, Inc.
Consolidated Statement of Cash Flows
(Unaudited)
| Three months ended March 31, | ||||||||
| (Millions) |
2012 | 2011 | ||||||
| OPERATING ACTIVITIES: |
||||||||
| Net income (loss) |
$ | 495 | $ | 384 | ||||
| Adjustments to reconcile to net cash provided (used) by operating activities: |
||||||||
| Depreciation, depletion, and amortization |
168 | 381 | ||||||
| Provision (benefit) for deferred income taxes |
86 | (10 | ) | |||||
| Provision for loss on investments, property and other assets |
— | 31 | ||||||
| Net (gain) loss on dispositions of assets |
(57 | ) | (7 | ) | ||||
| Gain on reconsolidation of Wilpro entities (Note 3) |
(144 | ) | — | |||||
| Amortization of stock-based awards |
9 | 14 | ||||||
| Cash provided (used) by changes in current assets and liabilities: |
||||||||
| Accounts and notes receivable |
52 | 6 | ||||||
| Inventories |
(17 | ) | 38 | |||||
| Margin deposits and customer margin deposits payable |
(17 | ) | (19 | ) | ||||
| Other current assets and deferred charges |
35 | 28 | ||||||
| Accounts payable |
(68 | ) | 46 | |||||
| Accrued liabilities |
(98 | ) | (65 | ) | ||||
| Changes in current and noncurrent derivative assets and liabilities |
7 | 17 | ||||||
| Other, including changes in noncurrent assets and liabilities |
(17 | ) | (33 | ) | ||||
|
|
|
|
|
|||||
| Net cash provided (used) by operating activities |
434 | 811 | ||||||
|
|
|
|
|
|||||
| FINANCING ACTIVITIES: |
||||||||
| Proceeds from long-term debt |
— | 75 | ||||||
| Payments of long-term debt |
(25 | ) | (75 | ) | ||||
| Proceeds from issuance of common stock |
26 | 26 | ||||||
| Proceeds from sale of limited partner units of consolidated partnership |
490 | — | ||||||
| Dividends paid |
(154 | ) | (73 | ) | ||||
| Dividends and distributions paid to noncontrolling interests |
(61 | ) | (52 | ) | ||||
| Distributions paid to noncontrolling interests on sale of Wilpro assets (Note 3) |
(38 | ) | — | |||||
| Other – net |
30 | (5 | ) | |||||
|
|
|
|
|
|||||
| Net cash provided (used) by financing activities |
268 | (104 | ) | |||||
|
|
|
|
|
|||||
| INVESTING ACTIVITIES: |
||||||||
| Capital expenditures* |
(329 | ) | (526 | ) | ||||
| Purchases of investments/advances to affiliates |
(48 | ) | (42 | ) | ||||
| Purchase of business |
(325 | ) | — | |||||
| Proceeds from dispositions of investments |
78 | 11 | ||||||
| Cash of Wilpro entities upon reconsolidation (Note 3) |
121 | — | ||||||
| Other – net |
12 | (22 | ) | |||||
|
|
|
|
|
|||||
| Net cash provided (used) by investing activities |
(491 | ) | (579 | ) | ||||
|
|
|
|
|
|||||
| Increase (decrease) in cash and cash equivalents |
211 | 128 | ||||||
| Cash and cash equivalents at beginning of period |
889 | 795 | ||||||
|
|
|
|
|
|||||
| Cash and cash equivalents at end of period |
$ | 1,100 | $ | 923 | ||||
|
|
|
|
|
|||||
| * Increases to property, plant, and equipment |
$ | (371 | ) | $ | (482 | ) | ||
| Changes in related accounts payable and accrued liabilities |
42 | (44 | ) | |||||
|
|
|
|
|
|||||
| Capital expenditures |
$ | (329 | ) | $ | (526 | ) | ||
|
|
|
|
|
|||||
See accompanying notes.
7
Table of Contents
The Williams Companies, Inc.
Notes to Consolidated Financial Statements
(Unaudited)
Note 1. General, Description of Business and Basis of Presentation
General
Our accompanying interim consolidated financial statements do not include all the notes in our annual financial statements and, therefore, should be read in conjunction with the consolidated financial statements and notes thereto in our Form 10-K/A Amendment No. 2, filed May 1, 2012. The accompanying unaudited financial statements include all normal recurring adjustments and others that, in the opinion of management, are necessary to present fairly our interim financial statements.
The preparation of financial statements in conformity with accounting principles generally accepted in the United States requires management to make estimates and assumptions that affect the amounts reported in the consolidated financial statements and accompanying notes. Actual results could differ from those estimates.
Unless the context clearly indicates otherwise, references in this report to “we,” “our,” “us,” or similar language refer to The Williams Companies, Inc. and its subsidiaries.
Description of Business
Our operations are located principally in the United States and are organized into the Williams Partners and Midstream Canada & Olefins reporting segments. All remaining business activities are included in Other.
Williams Partners consists of our consolidated master limited partnership, Williams Partners L.P. (WPZ) and includes gas pipeline and domestic midstream businesses. The gas pipeline businesses include 100 percent of Transcontinental Gas Pipe Line Company, LLC (Transco), 100 percent of Northwest Pipeline GP (Northwest Pipeline), and 49 percent of Gulfstream Natural Gas System, L.L.C. (Gulfstream). WPZ’s midstream operations are composed of significant, large-scale operations in the Rocky Mountain and Gulf Coast regions, operations in the Marcellus Shale region, and various equity investments in domestic natural gas gathering and processing assets and natural gas liquid (NGL) fractionation and transportation assets. WPZ’s midstream assets also include substantial operations and investments in the Four Corners region, the Piceance basin, as well as an NGL fractionator and storage facilities near Conway, Kansas.
Our Midstream Canada & Olefins segment includes our oil sands off-gas processing plant near Fort McMurray, Alberta, our NGL/olefin fractionation facility and butylene/butane splitter facility at Redwater, Alberta, our NGL light-feed olefins cracker in Geismar, Louisiana, along with associated ethane and propane pipelines, and our refinery grade splitter in Louisiana.
Other includes other business activities that are not operating segments, as well as corporate operations.
Basis of Presentation
Comprehensive Income
In January 2012, we adopted Accounting Standards Update No. 2011-5, “Comprehensive Income (Topic 220) Presentation of Comprehensive Income” (ASU 2011-5) and Accounting Standards Update No. 2011-12, “Comprehensive Income (Topic 220) Deferral of the Effective Date for Amendments to the Presentation of Reclassifications of Items Out of Accumulated Other Comprehensive Income in Accounting Standards Update No. 2011-05” (ASU 2011-12). ASU 2011-5 requires presentation of net income and other comprehensive income either in a single continuous statement or in two separate, but consecutive, statements. ASU 2011-5 also requires separate presentation in both net income and other comprehensive income of reclassification adjustments for items that are reclassified from other comprehensive income to net income. The new guidance does not change the items reported
8
Table of Contents
Notes (Continued)
in other comprehensive income, nor affect how earnings per share is calculated and presented. ASU 2011-12 defers the effective date for only the presentation requirements related to reclassifications in ASU 2011-5. During this deferral period, ASU 2011-12 provides that we should continue to report reclassifications out of accumulated other comprehensive income consistent with the presentation requirements in effect before ASU 2011-05. All other requirements in ASU 2011-05 are not affected by ASU 2011-12. Net income (loss) and other comprehensive income (loss) are now presented in two separate, but consecutive statements.
Master limited partnership
During the first quarter of 2012, WPZ completed a public equity issuance of 8,050,000 common units representing limited partner interests. WPZ also issued 7,531,381 common units to the seller in connection with its acquisition of certain entities from Delphi Midstream Partners, LLC. (See Note 2). Following these transactions, as of March 31, 2012, we own approximately 72 percent of the interests in WPZ, including the interests of the general partner, which are wholly owned by us, and incentive distribution rights.
The previously described equity issuances by WPZ had the combined net impact of increasing our noncontrolling interests in consolidated subsidiaries by $457 million, capital in excess of par value by $313 million and deferred income taxes by $185 million.
WPZ is self funding and maintains separate lines of bank credit and cash management accounts. Cash distributions from WPZ to us, including any associated with our incentive distribution rights, occur through the normal partnership distributions from WPZ to all partners.
Discontinued operations
WPX separation
On December 31, 2011, we completed the tax-free spin-off of our 100 percent interest in WPX Energy, Inc. (WPX), to our shareholders. The spin-off was completed by means of a special stock dividend, which consisted of a distribution of one share of WPX common stock for every three shares of our common stock.
For periods prior to the spin-off, the accompanying Consolidated Statement of Income reflects the results of operations of our former exploration and production business as discontinued operations. (See Note 3.)
Unless indicated otherwise, the information in the Notes to the Consolidated Financial Statements relates to our continuing operations.
Note 2. Acquisition
On February 17, 2012, WPZ completed the acquisition of 100 percent of the ownership interests in certain entities from Delphi Midstream Partners, LLC, in exchange for $325 million in cash, net of cash acquired in the transaction and subject to certain closing adjustments, and 7,531,381 WPZ common units valued at $465 million (Laser Acquisition). These entities primarily own the Laser Gathering System, which is comprised of 33 miles of 16-inch natural gas pipeline and associated gathering facilities in the Marcellus Shale in Susquehanna County, Pennsylvania, as well as 10 miles of gathering lines in southern New York. The acquisition was accounted for as a business combination which, among other things, requires assets acquired and liabilities assumed to be measured at their acquisition date fair values. The excess of cost over those fair values was allocated to goodwill.
The amounts recognized in the financial statements are preliminary because our valuation work has not been completed. We are awaiting further information for valuing the property, plant and equipment, intangible assets, assets held for sale, environmental and contingent liabilities and asset retirement obligations. In addition, we are still in the process of identifying all the assets acquired and liabilities assumed. The following table presents a preliminary allocation of the major classes of the assets acquired, which are presented in the Williams Partners segment:
9
Table of Contents
Notes (Continued)
| Assets held for sale |
$ | 20 | ||
| Other current assets |
3 | |||
| Property, plant and equipment |
158 | |||
| Intangible assets |
329 | |||
| Goodwill |
297 | |||
| Other current liabilities |
(17 | ) | ||
|
|
|
|||
| Total |
$ | 790 | ||
|
|
|
Intangible assets recognized in the acquisition are primarily related to gas gathering agreements with customers. Those intangible assets are being amortized on a straight-line basis over a 30-year period during which the customer contracts are expected to contribute to our cash flows. Goodwill recognized in the acquisition relates primarily to enhancing our strategic platform for expansion in the area. We are currently evaluating the appropriate reporting unit for the allocation of the goodwill within the Williams Partners segment. The goodwill is not subject to amortization but will be evaluated at least annually for impairment or more frequently if impairment indicators are present. Our evaluation will include a qualitative assessment of events or circumstances to determine whether it is more likely than not that the fair value of the reporting unit is less than its carrying amount. If so, we will further compare our estimate of the fair value of the reporting unit with its carrying value, including goodwill. If the carrying value of the reporting unit exceeds its fair value, a computation of the implied fair value of the goodwill is compared with its related carrying value. If the carrying value of the reporting unit goodwill exceeds the implied fair value of that goodwill, an impairment loss will be recognized in the amount of the excess. All of the goodwill is expected to be deductible for tax purposes.
Revenues and earnings related to the Laser Acquisition included within the Consolidated Financial Statements are not material. Supplemental pro forma revenue and earnings on a combined basis for the periods presented are also not material as the Laser Gathering System began operations in October 2011.
Note 3. Discontinued Operations
On December 31, 2011, we completed the tax-free spin-off of our 100 percent interest in WPX to our shareholders. The following summarized results of discontinued operations for the three months ended March 31, 2011, reflect the results of operations of our former exploration and production business as discontinued operations. The summarized results of discontinued operations for the three months ended March 31, 2012, primarily include a gain on reconsolidation following the sale of certain of our former Venezuela operations, whose facilities were expropriated by the Venezuelan government in May 2009.
At December 31, 2011, the net assets of our former exploration and production business were eliminated from our consolidated balance sheet as the spin-off was complete.
Summarized results of discontinued operations
| Three months ended March 31, | ||||||||
| 2012 | 2011 | |||||||
| (Millions) | ||||||||
| Revenues |
$ | — | $ | 992 | ||||
|
|
|
|
|
|||||
| Income (loss) from discontinued operations before gain on reconsolidation, impairment and income taxes |
$ | (8 | ) | $ | 46 | |||
| Gain on reconsolidation |
144 | — | ||||||
| Impairment |
— | (9 | ) | |||||
| (Provision) benefit for income taxes |
— | (13 | ) | |||||
|
|
|
|
|
|||||
| Income (loss) from discontinued operations |
$ | 136 | $ | 24 | ||||
|
|
|
|
|
|||||
| Income (loss) from discontinued operations: |
||||||||
| Attributable to noncontrolling interests |
$ | — | $ | 3 | ||||
| Attributable to The Williams Companies, Inc. |
$ | 136 | $ | 21 | ||||
10
Table of Contents
Notes (Continued)
Gain on reconsolidation for 2012 is related to our majority ownership in entities (the Wilpro entities) that owned and operated the El Furrial and PIGAP II gas compression facilities prior to their expropriation by the Venezuelan government in May 2009. We deconsolidated the Wilpro entities in 2009. In the first quarter of 2012, the El Furrial and PIGAP II assets were sold as part of a settlement related to the 2009 expropriation of these assets. Upon closing, the lenders that had provided financing for these operations were repaid in full, and the Wilpro entities received $98 million in cash and the right to receive quarterly cash installments of $15 million (note receivable) through the first quarter of 2016 plus interest. Following the settlement and repayment in full of the lenders, we reestablished control and, therefore, reconsolidated the Wilpro entities and recognized a gain on reconsolidation of $144 million. This gain reflects our share of the cash, including cash received in the settlement, and a note receivable held by the Wilpro entities at the time of reconsolidation. The note receivable was recognized at its estimated fair value, as further described below.
To determine the fair value of the note receivable at the time of reconsolidation, we considered both quantitative (income) and qualitative (market) approaches. Under our quantitative approach, we calculated the net present value of a probability-weighted set of cash flows utilizing assumptions based on contractual terms, historical payment patterns by the counterparty under similar circumstances, our likelihood of using arbitration if the counterparty does not perform, and discount rates. Our qualitative analysis utilized information as to how similar notes might be valued. This analysis also reduced the value due to its limited marketability as the payment terms are embedded within the overall settlement agreement. Both analyses resulted in similar fair values. Ultimately we determined the fair value of the note receivable to be $88 million utilizing a probability-weighted cash flow analysis with a discount rate of approximately 12 percent and a probability of default ranging from 15 percent to 100 percent. Utilizing different assumptions regarding the collectability of the note receivable and discount rates could result in a materially different fair value.
Revenues and Income (loss) from discontinued operations before gain on reconsolidation, impairment and income taxes for 2011 primarily reflects the results of operations of our discontinued exploration and production business.
Energy commodity derivatives gains and losses
The following table presents pre-tax gains and losses for the three months ended March 31, 2011, for our former exploration and production business’ energy commodity derivatives.
| Three months ended | ||||||
| March 31, 2011 | Classification | |||||
| (Millions) | ||||||
| Designated as cash flow hedges |
||||||
| Net gain (loss) recognized in other comprehensive income (loss) (effective portion) |
$ | (21 | ) | Accumulated other comprehensive income (AOCI) | ||
| Net gain (loss) reclassified from accumulated other comprehensive income (loss) into income (effective portion) |
$ | 75 | Income (loss) from discontinued operations | |||
| Gain (loss) recognized in income (ineffective portion) |
$ | — | Income (loss) from discontinued operations | |||
| Not designated as cash flow hedges |
||||||
| Gain (loss) recognized in income |
$ | 3 | Income (loss) from discontinued operations | |||
11
Table of Contents
Notes (Continued)
Note 4. Asset Sales and Other Accruals
Other (income) expense – net within segment costs and expenses in 2011 includes $10 million related to the reversal of project feasibility costs from expense to capital at Williams Partners, associated with a natural gas pipeline expansion project. This reversal was made upon determining that the related project was probable of development. These costs are now included in the capital costs of the project, which we believe are probable of recovery through the project rates.
Investing income – net at Other includes income of $63 million and $11 million in the first quarter of 2012 and 2011, respectively, related to the 2010 sale of our interest in Accroven SRL. As part of a settlement regarding certain Venezuelan assets in the first quarter of 2012 (see Note 3), we also received payment for all outstanding balances due from this sale, including interest.
Note 5. Provision (Benefit) for Income Taxes
The provision (benefit) for income taxes includes:
| Three months ended March 31, | ||||||||
| 2012 | 2011 | |||||||
| (Millions) | ||||||||
| Current: |
||||||||
| Federal |
$ | 21 | $ | 29 | ||||
| State |
4 | 3 | ||||||
| Foreign |
21 | (20 | ) | |||||
|
|
|
|
|
|||||
| 46 | 12 | |||||||
| Deferred: |
||||||||
| Federal |
87 | (32 | ) | |||||
| State |
(3 | ) | (3 | ) | ||||
| Foreign |
3 | 1 | ||||||
|
|
|
|
|
|||||
| 87 | (34 | ) | ||||||
|
|
|
|
|
|||||
| Total provision (benefit) |
$ | 133 | $ | (22 | ) | |||
|
|
|
|
|
|||||
The effective income tax rate for the total provision for the three months ended March 31, 2012, is less than the federal statutory rate primarily due to the impact of nontaxable noncontrolling interests and taxes on foreign operations, partially offset by the effect of state income taxes.
The effective income tax rate for the total benefit for the three months ended March 31, 2011, is less than the federal statutory rate primarily due to federal settlements, an international revised assessment and the impact of nontaxable noncontrolling interests, partially offset by the effect of state income taxes.
During the first quarter of 2011, we finalized settlements for 1997 through 2008 on certain contested matters with the Internal Revenue Service and also received a revised assessment on an international matter. These settlements and revised assessment resulted in a tax benefit of approximately $124 million in the first quarter of 2011. As a result of these settlements and revised assessment, we decreased our unrecognized tax benefits by approximately $62 million.
On December 23, 2011, the Internal Revenue Service issued temporary and proposed regulations providing guidance relating to the deduction and capitalization of expenditures made to acquire, produce, or improve tangible property. These regulations, effective January 1, 2012, will generally require changes in accounting methods. Once complete guidance has been released, we will assess the impact of the regulations on our Consolidated Financial Statements.
12
Table of Contents
Notes (Continued)
During the next 12 months, we do not expect ultimate resolution of any unrecognized tax benefit associated with domestic or international matters to have a material impact on our unrecognized tax benefit position.
Note 6. Earnings (Loss) Per Common Share from Continuing Operations
| Three months ended March 31, | ||||||||
| 2012 | 2011 | |||||||
| (Dollars in millions, except per-share | ||||||||
| amounts; shares in thousands) | ||||||||
| Income (loss) from continuing operations attributable to The Williams Companies, Inc. available to common stockholders for basic and diluted earnings (loss) per share (1) |
$ | 287 | $ | 300 | ||||
|
|
|
|
|
|||||
| Basic weighted-average shares |
593,231 | 586,977 | ||||||
| Effect of dilutive securities: |
||||||||
| Nonvested restricted stock units |
3,564 | 4,125 | ||||||
| Stock options |
2,938 | 3,464 | ||||||
| Convertible debentures |
787 | 2,001 | ||||||
|
|
|
|
|
|||||
| Diluted weighted-average shares |
600,520 | 596,567 | ||||||
|
|
|
|
|
|||||
| Earnings (loss) per common share from continuing operations: |
||||||||
| Basic |
$ | .48 | $ | .51 | ||||
| Diluted |
$ | .47 | $ | .50 | ||||
| (1) | The three-month periods ended March 31, 2012 and March 31, 2011, include $.1 million and $.2 million, respectively, of interest expense, net of tax, associated with our convertible debentures. This amount has been added back to income (loss) from continuing operations attributable to The Williams Companies, Inc. available to common stockholders to calculate diluted earnings per common share. |
Effective January 1, 2012, new awards of time-based restricted stock units contain a nonforfeitable right to dividends during the vesting period. These share-based payment awards are participating securities and will be included in the computation of earnings (loss) per common share pursuant to the two-class method. The impact for first-quarter 2012 is immaterial.
For the three months ended March 31, 2012, 1.1 million weighted-average stock options have been excluded from the computation of diluted earnings per common share as their inclusion would be antidilutive.
The table below includes information related to stock options that were outstanding at March 31 of each respective year but have been excluded from the computation of weighted-average stock options due to the option exercise price exceeding the first quarter weighted-average market price of our common shares.
| March 31, | ||||||||
| 2012 | 2011 | |||||||
| Options excluded (millions) |
0.9 | 3.0 | ||||||
| Weighted-average exercise price of options excluded |
$ | 29.72 | $ | 31.50 | ||||
| Exercise price ranges of options excluded |
$ | 29.34 - $29.72 | $ | 28.30 - $40.51 | ||||
| First quarter weighted-average market price |
$ | 29.33 | $ | 28.27 | ||||
13
Table of Contents
Notes (Continued)
Note 7. Employee Benefit Plans
Net periodic benefit expense is as follows:
| Other Postretirement | ||||||||||||||||
| Pension Benefits | Benefits | |||||||||||||||
| Three months ended March 31, | Three months ended March 31, | |||||||||||||||
| 2012 | 2011 | 2012 | 2011 | |||||||||||||
| (Millions) | ||||||||||||||||
| Components of net periodic benefit expense: |
||||||||||||||||
| Service cost |
$ | 10 | $ | 10 | $ | 1 | $ | 1 | ||||||||
| Interest cost |
14 | 17 | 3 | 4 | ||||||||||||
| Expected return on plan assets |
(16 | ) | (19 | ) | (2 | ) | (3 | ) | ||||||||
| Amortization of prior service credit |
— | — | (2 | ) | (3 | ) | ||||||||||
| Amortization of net actuarial loss |
13 | 9 | 3 | 1 | ||||||||||||
|
|
|
|
|
|
|
|
|
|||||||||
| Net periodic benefit expense |
$ | 21 | $ | 17 | $ | 3 | $ | — | ||||||||
|
|
|
|
|
|
|
|
|
|||||||||
During the three months ended March 31, 2012, we contributed $18 million to our pension plans and $4 million to our other postretirement benefit plans. We presently anticipate making additional contributions of approximately $61 million to our pension plans and approximately $11 million to our other postretirement benefit plans in the remainder of 2012.
Note 8. Inventories
| March 31, | December 31, | |||||||
| 2012 | 2011 | |||||||
| (Millions) | ||||||||
| Natural gas liquids, olefins, and natural gas in underground storage |
$ | 117 | $ | 98 | ||||
| Materials, supplies, and other |
69 | 71 | ||||||
|
|
|
|
|
|||||
| $ | 186 | $ | 169 | |||||
|
|
|
|
|
|||||
Note 9. Debt and Banking Arrangements
Credit Facilities
Letter of credit capacity under our $900 million and WPZ’s $2 billion credit facilities is $700 million and $1.3 billion, respectively. At March 31, 2012, no letters of credit have been issued and no loans are outstanding on either facility. We have issued letters of credit totaling $20 million as of March 31, 2012, under certain bilateral bank agreements.
Issuances and Retirements
In August 2011, Transco issued $375 million of 5.4 percent senior unsecured notes due 2041 to investors in a private debt placement. As part of the new issuance, Transco entered into a registration rights agreement with the initial purchasers of the notes. An offer to exchange these unregistered notes for substantially identical new notes that are registered under the Securities Act of 1933, as amended, was commenced in February 2012 and completed in March 2012.
14
Table of Contents
Notes (Continued)
Note 10. Fair Value Measurements
The following table presents, by level within the fair value hierarchy, certain of our financial assets and liabilities. The carrying values of cash and cash equivalents, accounts receivable and accounts payable approximate fair value because of the short-term nature of these instruments. Therefore, these assets and liabilities are not presented in the following table.
| Fair Value Measurements Using | ||||||||||||||||||||
| Quoted | ||||||||||||||||||||
| Prices In | ||||||||||||||||||||
| Active | Significant | |||||||||||||||||||
| Markets for | Other | Significant | ||||||||||||||||||
| Identical | Observable | Unobservable | ||||||||||||||||||
| Carrying | Fair | Assets | Inputs | Inputs | ||||||||||||||||
| Amount | Value | (Level 1) | (Level 2) | (Level 3) | ||||||||||||||||
| (Millions) | ||||||||||||||||||||
| Assets (liabilities) at March 31, 2012: |
||||||||||||||||||||
| Recurring basis: |
||||||||||||||||||||
| ARO Trust investments |
$ | 24 | $ | 24 | $ | 24 | $ | — | $ | — | ||||||||||
| Energy derivatives assets not designated as hedging instruments |
5 | 5 | 1 | 4 | — | |||||||||||||||
| Energy derivatives assets designated as hedging instruments |
2 | 2 | 1 | 1 | — | |||||||||||||||
| Energy derivatives liabilities not designated as hedging instruments |
(4 | ) | (4 | ) | (1 | ) | (3 | ) | — | |||||||||||
| Energy derivatives liabilities designated as hedging instruments |
(10 | ) | (10 | ) | (7 | ) | (3 | ) | — | |||||||||||
| Additional disclosures: |
||||||||||||||||||||
| Notes receivable and other |
156 | 156 | 17 | 10 | 129 | |||||||||||||||
| Long-term debt, including current portion (a) |
(8,691 | ) | (9,951 | ) | — | (9,951 | ) | — | ||||||||||||
| Guarantee |
(34 | ) | (32 | ) | — | (32 | ) | — | ||||||||||||
| Assets (liabilities) at December 31, 2011: |
||||||||||||||||||||
| Recurring basis: |
||||||||||||||||||||
| ARO Trust investments |
$ | 25 | $ | 25 | $ | 25 | $ | — | $ | — | ||||||||||
| Available-for-sale equity securities |
24 | 24 | 24 | — | — | |||||||||||||||
| Energy derivatives assets not designated as hedging instruments |
1 | 1 | 1 | — | — | |||||||||||||||
| Additional disclosures: |
||||||||||||||||||||
| Notes receivable and other |
57 | 57 | N/A | N/A | N/A | |||||||||||||||
| Long-term debt, including current portion (a) |
(8,718 | ) | (10,043 | ) | N/A | N/A | N/A | |||||||||||||
| Guarantee |
(34 | ) | (32 | ) | N/A | N/A | N/A | |||||||||||||
| (a) | Excludes capital leases |
Fair Value Methods
We use the following methods and assumptions in estimating our fair-value disclosures for financial instruments:
Assets and liabilities measured at fair value on a recurring basis
ARO Trust investments: Transco deposits a portion of its collected rates, pursuant to its 2008 rate case settlement, into an external trust (ARO Trust) that is specifically designated to fund future asset retirement obligations. The ARO Trust invests in a portfolio of actively traded mutual funds that are measured at fair value on a
15
Table of Contents
Notes (Continued)
recurring basis based on quoted net asset values, are classified as available-for-sale, and are reported in regulatory assets, deferred charges, and other in the Consolidated Balance Sheet. However, both realized and unrealized gains and losses are ultimately recorded as regulatory assets or liabilities.
Energy derivatives: Energy derivatives include commodity based exchange-traded contracts and over-the-counter (OTC) contracts, which consist solely of swaps that are measured at fair value on a recurring basis. The tenure of our energy derivatives portfolio is relatively short with all of our energy derivatives expiring in the next 12 months. The fair value amounts are presented on a gross basis and do not reflect the netting of asset and liability positions permitted under the terms of our master netting arrangements. Further, the amounts do not include cash held on deposit in margin accounts that we have received or remitted to collateralize certain derivative positions. Energy derivatives are reported in other current assets and deferred charges and accrued liabilities in the Consolidated Balance Sheet.
Energy derivatives considered Level 1 measurements consist of New York Mercantile Exchange and Intercontinental Exchange contracts and are valued based on quoted prices in these active markets.
Energy derivatives included in our Level 2 measurements consist solely of OTC swaps. Swap contracts included in Level 2 are valued using an income approach including present value techniques and option pricing models. Significant inputs into our Level 2 valuations include commodity prices and interest rates, as well as considering executed transactions or broker quotes corroborated by other market data. These broker quotes are based on observable market prices at which transactions could currently be executed. In certain instances where these inputs are not observable for all periods, relationships of observable market data and historical observations are used as a means to estimate fair value. Where observable inputs are available for substantially the full term of the asset or liability, the instrument is categorized in Level 2.
Reclassifications of fair value between Level 1, Level 2, and Level 3 of the fair value hierarchy, if applicable, are made at the end of each quarter. No transfers between Level 1 and Level 2 occurred during the three months ended March 31, 2012 or 2011.
Additional fair value disclosures
Notes receivable and other: Notes receivable and other disclosed at fair value include a note receivable related to the sale of certain former Venezuela operations (see Note 3) and a receivable from our former affiliate, WPX (see Note 12). The current portion of the notes is reported in accounts and notes receivable and the noncurrent portion of the notes is reported in regulatory assets, deferred charges, and other in the Consolidated Balance Sheet. The carrying value of our notes receivable and other are considered to approximate the fair value generally due to the nature of the related interest rates and our assessment of our ability to recover these amounts using an income approach, as well as the proximity of the initial recognition at fair value of the note receivable associated with the former Venezuela operations to the reporting date. Notes receivable and other also include margin deposits, which are reported in other current assets and deferred charges.
Long-term debt: The disclosed fair value of our long-term debt is determined by a market approach using broker quoted indicative period-end bond prices. The quoted prices are based on observable transactions in less active markets for our debt or similar instruments.
Guarantee: The guarantee represented in the table consists of a guarantee we have provided in the event of nonpayment by our previously owned communications subsidiary, Williams Communications Group (WilTel), on a lease performance obligation that extends through 2042.
To estimate the disclosed fair value of the guarantee, an estimated default rate is applied to the sum of the future contractual lease payments using an income approach. The estimated default rate is determined by obtaining the average cumulative issuer-weighted corporate default rate based on the credit rating of WilTel’s current owner and the term of the underlying obligation. The default rate is published by Moody’s Investors Service. This guarantee is reported in accrued liabilities in the Consolidated Balance Sheet.
16
Table of Contents
Notes (Continued)
Guarantees
We are required by our revolving credit agreements to indemnify lenders for certain taxes required to be withheld from payments due to the lenders and for certain tax payments made by the lenders. The maximum potential amount of future payments under these indemnifications is based on the related borrowings and such future payments cannot currently be determined. These indemnifications generally continue indefinitely unless limited by the underlying tax regulations and have no carrying value. We have never been called upon to perform under these indemnifications and have no current expectation of a future claim.
Regarding our previously described guarantee of Wiltel’s lease performance, the maximum potential exposure is approximately $37 million at March 31, 2012 and $38 million at December 31, 2011. Our exposure declines systematically throughout the remaining term of WilTel’s obligation. The carrying value of the guarantee included in accrued liabilities on the Consolidated Balance Sheet is $34 million at March 31, 2012 and December 31, 2011.
We have provided guarantees in the event of nonpayment by our previously owned subsidiary, WPX, on certain contracts, primarily including a long-term transportation capacity agreement and a natural gas purchase contract, extending through 2017 and 2023, respectively. We estimate the maximum undiscounted potential future payment obligation under these remaining guarantees is approximately $245 million at March 31, 2012. Our recorded liability for these guarantees, which considers our estimate of the fair value of the guarantees, is insignificant.
Note 11. Derivative Instruments
Energy Commodity Derivatives
Risk management activities
We are exposed to market risk from changes in energy commodity prices within our operations. We may utilize derivatives to manage our exposure to the variability in expected future cash flows from forecasted purchases and sales of natural gas and NGLs attributable to commodity price risk. Certain of these derivatives utilized for risk management purposes have been designated as cash flow hedges, while other derivatives have not been designated as cash flow hedges or do not qualify for hedge accounting despite hedging our future cash flows on an economic basis.
We produce and sell NGLs and olefins at different locations throughout North America. We also buy natural gas to satisfy the required fuel and shrink needed to generate NGLs and olefins. In addition, we buy NGLs as feedstock to generate olefins. To reduce exposure to a decrease in revenues from fluctuations in NGL market prices or increases in costs and operating expenses from fluctuations in natural gas and NGL market prices, we may enter into NGL or natural gas swap agreements, financial forward contracts, and financial option contracts to mitigate the price risk on forecasted sales of NGLs and purchases of natural gas and NGLs. Those designated as cash flow hedges are expected to be highly effective in offsetting cash flows attributable to the hedged risk during the term of the hedge. However, ineffectiveness may be recognized primarily as a result of locational differences between the hedging derivative and the hedged item.
Volumes
Our energy commodity derivatives are comprised of both contracts to purchase the commodity (long positions) and contracts to sell the commodity (short positions). Derivative transactions are categorized into two types:
| • | Central hub risk: Includes physical and financial derivative exposures to Henry Hub for natural gas and Mont Belvieu for NGLs; |
17
Table of Contents
Notes (Continued)
| • | Basis risk: Includes physical and financial derivative exposures to the difference in value between the central hub and another specific delivery point. |
The following table depicts the notional quantities of the net long (short) positions in our commodity derivatives portfolio as of March 31, 2012. Natural gas is presented in millions of British Thermal Units (MMBtu) and NGLs are presented in barrels.
| Derivative Notional Volumes |
Unit of Measure |
Central Hub Risk |
Basis Risk | |||||||||
| Designated as Hedging Instruments |
||||||||||||
| Williams Partners |
Barrels | (2,205,000 | ) | |||||||||
| Williams Partners |
MMBtu | 9,503,750 | 8,101,250 | |||||||||
| Not Designated as Hedging Instruments |
||||||||||||
| Williams Partners |
Barrels | 120,000 | 345,000 | |||||||||
| Midstream Canada & Olefins |
Barrels | (130,000 | ) | |||||||||
Gains (losses)
The following table presents pre-tax gains and losses for our energy commodity derivatives designated as cash flow hedges, as recognized in AOCI, revenues, or costs and operating expenses.
| Three months ended March 31, | ||||||||||
| 2012 | 2011 | Classification | ||||||||
| (Millions) | ||||||||||
| Net gain (loss) recognized in other comprehensive income (loss) (effective portion) |
$ | (9 | ) | $ | (2 | ) | AOCI | |||
| Net gain (loss) reclassified from accumulated other comprehensive income (loss) into income (effective portion) |
$ | (2 | ) | $ | — | Revenues or Costs and Operating Expenses | ||||
There were no gains or losses recognized in income as a result of hedge ineffectiveness, as a result of reclassifications to earnings following the discontinuance of any cash flow hedges, or as a result of excluding amounts from the assessment of hedge effectiveness.
We recognized gains of $1 million and losses of $1 million in revenues for the three months ended March 31, 2012 and 2011, respectively, on our energy commodity derivatives not designated as hedging instruments. In addition, we recognized gains of less than $1 million in costs and operating expenses for the three months ended March 31, 2012 on our energy commodity derivatives not designated as hedging instruments.
The cash flow impact of our derivative activities is presented in the Consolidated Statement of Cash Flows as changes in current and noncurrent derivative assets and liabilities.
Credit-risk-related features
Certain of our derivative contracts contain credit-risk-related provisions that would require us, in certain circumstances, to post additional collateral in support of our net derivative liability positions. These credit-risk-related provisions require us to post collateral in the form of cash or letters of credit when our net liability positions exceed an established credit threshold. The credit thresholds are typically based on our senior unsecured debt ratings
18
Table of Contents
Notes (Continued)
from Standard and Poor’s and/or Moody’s Investors Service. Under these contracts, a credit ratings decline would lower our credit thresholds, thus requiring us to post additional collateral. We also have contracts that contain adequate assurance provisions giving the counterparty the right to request collateral in an amount that corresponds to the outstanding net liability.
As of March 31, 2012, we have collateral totaling $6 million, all of which is in the form of cash, posted to derivative counterparties to support the aggregate fair value of our net derivative liability position (reflecting master netting arrangements in place with certain counterparties) of $8 million. The additional collateral that we would be required to post, assuming our credit thresholds were eliminated and a call for adequate assurance under the credit risk provisions of our derivative contracts was triggered, was $2 million. At December 31, 2011, we did not have any collateral posted, either in the form of cash or letters of credit, to derivative counterparties since we had net derivative asset positions with all our counterparties.
Cash flow hedges
Changes in the fair value of our cash flow hedges, to the extent effective, are deferred in AOCI and reclassified into earnings in the same period or periods in which the hedged forecasted purchases or sales affect earnings, or when it is probable that the hedged forecasted transaction will not occur by the end of the originally specified time period. As of March 31, 2012, we have hedged portions of future cash flows associated with anticipated energy commodity purchases and sales through the end of 2012. Based on recorded values at March 31, 2012, $8 million of pre-tax net losses will be reclassified into earnings within the next nine months. These recorded values are based on market prices of the commodities as of March 31, 2012. Due to the volatile nature of commodity prices and changes in the creditworthiness of counterparties, actual gains or losses realized within the next nine months will likely differ from these values. These gains or losses are expected to substantially offset net losses or gains that will be realized in earnings from previous unfavorable or favorable market movements associated with underlying hedged transactions.
Note 12. Contingent Liabilities
Indemnification of WPX Matters
We have agreed to indemnify our former affiliate, WPX and its subsidiaries, related to the following matters. In connection with this indemnification, we have retained applicable accrued asset and liability balances associated with these matters, and as a result, have an indirect exposure to future developments in these matters.
Issues resulting from California energy crisis
WPX’s former power business was engaged in power marketing in various geographic areas, including California. Prices charged for power by WPX and other traders and generators in California and other western states in 2000 and 2001 were challenged in various proceedings, including those before the Federal Energy Regulatory Commission (FERC). WPX has entered into settlements with the State of California (State Settlement), major California utilities (Utilities Settlement), and others that substantially resolved each of these issues with these parties.
Although the State Settlement and Utilities Settlement resolved a significant portion of the refund issues among the settling parties, WPX continues to have potential refund exposure to nonsettling parties, including various California end users that did not participate in the Utilities Settlement. WPX is currently in settlement negotiations with certain California utilities aimed at eliminating or substantially reducing this exposure. If successful, and subject to a final “true-up” mechanism, the settlement agreement would also resolve WPX’s collection of accrued interest from counterparties as well as their payment of accrued interest on refund amounts. Thus, as currently contemplated by the parties, the settlement agreement would resolve most, if not all, of WPX’s legal issues arising from the 2000-2001 California Energy Crisis. We currently have a net receivable from WPX related to these matters.
Certain other issues also remain open at the FERC and for other nonsettling parties.
19
Table of Contents
Notes (Continued)
Reporting of natural gas-related information to trade publications
Civil suits based on allegations of manipulating published gas price indices have been brought against WPX and others, in each case seeking an unspecified amount of damages. WPX is currently a defendant in class action litigation and other litigation originally filed in state court in Colorado, Kansas, Missouri, and Wisconsin brought on behalf of direct and indirect purchasers of natural gas in those states. These cases were transferred to the federal court in Nevada. In 2008, the court granted summary judgment in the Colorado case in favor of WPX and most of the other defendants based on plaintiffs’ lack of standing. In 2009, the court denied the plaintiffs’ request for reconsideration of the Colorado dismissal and entered judgment in WPX’s favor. The court’s order became final on July 18, 2011, and the Colorado plaintiffs might appeal the order.
In the other cases, on July 18, 2011, the Nevada district court granted WPX’s joint motions for summary judgment to preclude the plaintiffs’ state law claims because the federal Natural Gas Act gives the FERC exclusive jurisdiction to resolve those issues. The court also denied the plaintiffs’ class certification motion as moot. In 2011, the plaintiffs’ appealed the court’s ruling to the Ninth Circuit Court of Appeals, and in early 2012, the parties completed briefing the issues. A decision is expected in 2013. Because of the uncertainty around these current pending unresolved issues, including an insufficient description of the purported classes and other related matters, we cannot reasonably estimate a range of potential exposures at this time. However, it is reasonably possible that the ultimate resolution of these items and our related indemnification obligation could result in future charges that may be material to our results of operations.
20
Table of Contents
Notes (Continued)
Other Legal Matters
Gulf Liquids litigation
Gulf Liquids contracted with Gulsby Engineering Inc. (Gulsby) and Gulsby-Bay (a joint venture between Gulsby and Bay Ltd.) for the construction of certain gas processing plants in Louisiana. National American Insurance Company (NAICO) and American Home Assurance Company provided payment and performance bonds for the projects. In 2001, the contractors and sureties filed multiple cases in Louisiana and Texas against Gulf Liquids and us.
In 2006, at the conclusion of the consolidated trial of the asserted contract and tort claims, the jury returned its actual and punitive damages verdict against us and Gulf Liquids. Based on our interpretation of the jury verdicts, we recorded a charge based on our estimated exposure for actual damages of approximately $68 million plus potential interest of approximately $20 million. In addition, we concluded that it was reasonably possible that any ultimate judgment might have included additional amounts of approximately $199 million in excess of our accrual, which primarily represented our estimate of potential punitive damage exposure under Texas law.
From May through October 2007, the court entered seven post-trial orders in the case (interlocutory orders) which, among other things, overruled the verdict award of tort and punitive damages as well as any damages against us. The court also denied the plaintiffs’ claims for attorneys’ fees. On January 28, 2008, the court issued its judgment awarding damages against Gulf Liquids of approximately $11 million in favor of Gulsby and approximately $4 million in favor of Gulsby-Bay. Gulf Liquids, Gulsby, Gulsby-Bay, Bay Ltd., and NAICO appealed the judgment. In February 2009, we settled with certain of these parties and reduced our accrued liability as of December 31, 2008, by $43 million, including $11 million of interest. On February 17, 2011, the Texas Court of Appeals upheld the dismissals of the tort and punitive damages claims and reversed and remanded the contract claim and attorney fee claims for further proceedings. None of the parties filed a petition for review in the Texas Supreme Court. As a result, we reduced our accrued liability as of December 31, 2011 by $33 million, including $14 million of interest. We are awaiting the Texas Court of Appeals to issue a mandate remanding the case to the trial court.
21
Table of Contents
Notes (Continued)
Alaska refinery contamination litigation
In January 2010, James West filed a class action lawsuit in state court in Fairbanks, Alaska on behalf of individual property owners whose water contained sulfolane contamination allegedly emanating from the Flint Hills Oil Refinery in North Pole, Alaska. The suit named our subsidiary Williams Alaska Petroleum Inc. (WAPI) and Flint Hills Resources Alaska, LLC (FHRA), a subsidiary of Koch Industries, Inc. as defendants. We owned and operated the refinery until 2004 when we sold it to FHRA. We and FHRA have made claims under the pollution liability insurance policy issued in connection with the sale of the North Pole refinery to FHRA. We and FHRA also filed claims against each other seeking, among other things, contractual indemnification alleging that the other party caused the sulfolane contamination.
In August 2010, the court denied West’s request for class certification. On May 5, 2011, we and FHRA settled the James West claim, leaving FHRA and WAPI claims. On November 17, 2011, we filed motions for summary judgment on FHRA’s claims against us, but the motions are unlikely to resolve all the outstanding claims. Similarly, FHRA has filed motions for summary judgment that would resolve some, but not all, of our claims against it. Trial is set for April 2013.
While significant uncertainty still exists due to, among other things, ongoing proceedings and expert evaluations, we currently estimate that our reasonably possible loss exposure in this matter could range from an insignificant amount up to $32 million. We might have the ability to recover any such losses under the pollution liability policy if FHRA has not exhausted the policy limits.
Other
In 2003, we entered into an agreement to sublease certain underground storage facilities to Liberty Gas Storage (Liberty). We have asserted claims against Liberty for prematurely terminating the sublease and for damage caused to the facilities. In February 2011, Liberty asserted a counterclaim for costs in excess of $200 million associated with its use of the facilities. Due to the lack of information currently available, we are unable to evaluate the merits of the counterclaim and determine the amount of any possible liability.
Environmental Matters
We are a participant in certain environmental activities in various stages including assessment studies, cleanup operations and remedial processes at certain sites, some of which we currently do not own. We are monitoring these sites in a coordinated effort with other potentially responsible parties, the U.S. Environmental Protection Agency (EPA), and other governmental authorities. We are jointly and severally liable along with unrelated third parties in some of these activities and solely responsible in others. Certain of our subsidiaries have been identified as potentially responsible parties at various Superfund and state waste disposal sites. In addition, these subsidiaries have incurred, or are alleged to have incurred, various other hazardous materials removal or remediation obligations under environmental laws. As of March 31, 2012, we have accrued liabilities totaling $46 million for these matters, as discussed below. Our accrual reflects the most likely costs of cleanup, which are generally based on completed assessment studies, preliminary results of studies or our experience with other similar cleanup operations. Certain assessment studies are still in process for which the ultimate outcome may yield significantly different estimates of most likely costs. Any incremental amount in excess of amounts currently accrued cannot be reasonably estimated at this time due to uncertainty about the actual number of contaminated sites ultimately identified, the actual amount and extent of contamination discovered and the final cleanup standards mandated by the EPA and other governmental authorities.
The EPA and various state regulatory agencies routinely promulgate and propose new rules, and issue updated guidance to existing rules. More recent rules and rulemakings include, but are not limited to, rules for reciprocating internal combustion engine maximum achievable control technology, new air quality standards for ground level ozone, and one hour nitrogen dioxide emission limits. We are unable to estimate the costs of asset additions or modifications necessary to comply with these new regulations due to uncertainty created by the various legal challenges to these regulations and the need for further specific regulatory guidance.
Continuing operations
Our interstate gas pipelines are involved in remediation activities related to certain facilities and locations for polychlorinated biphenyl, mercury contamination, and other hazardous substances. These activities have involved the EPA, various state environmental authorities and identification as a potentially responsible party at various Superfund waste disposal sites. At March 31, 2012, we have accrued liabilities of $10 million for these costs. We expect that these costs will be recoverable through rates.
We also accrue environmental remediation costs for natural gas underground storage facilities, primarily related to soil and groundwater contamination. At March 31, 2012, we have accrued liabilities totaling $8 million for these costs.
Former operations, including operations classified as discontinued
We have potential obligations in connection with assets and businesses we no longer operate. These potential obligations include the indemnification of the purchasers of certain of these assets and businesses for environmental and other liabilities existing at the time the sale was consummated. Our responsibilities relate to the operations of the assets and businesses described below.
| • | Former agricultural fertilizer and chemical operations and former retail petroleum and refining operations; |
| • | Former petroleum products and natural gas pipelines; |
| • | Former petroleum refining facilities; |
| • | Former exploration and production and mining operations; |
| • | Former electricity and natural gas marketing and trading operations. |
At March 31, 2012, we have accrued environmental liabilities of $28 million related to these matters.
Other Divestiture Indemnifications
Pursuant to various purchase and sale agreements relating to divested businesses and assets, we have indemnified certain purchasers against liabilities that they may incur with respect to the businesses and assets acquired from us. The indemnities provided to the purchasers are customary in sale transactions and are contingent upon the purchasers incurring liabilities that are not otherwise recoverable from third parties. The indemnities generally relate to breach of warranties, tax, historic litigation, personal injury, property damage, environmental matters, right of way and other representations that we have provided.
At March 31, 2012, other than as previously disclosed, we are not aware of any material claims involving the indemnities; thus, we do not expect any of the indemnities provided pursuant to the sales agreements to have a material impact on our future financial position. Any claim for indemnity brought against us in the future may have a material adverse effect on our results of operations in the period in which the claim is made.
In addition to the foregoing, various other proceedings are pending against us which are incidental to our operations.
Summary
We estimate that for all matters for which we are able to reasonably estimate a range of loss, including those noted above and others that are not individually significant, our aggregate reasonably possible losses beyond amounts accrued for all of our contingent liabilities are immaterial to our expected future annual results of operations, liquidity and financial position. These calculations have been made without consideration of any potential recovery from third parties. We have disclosed all significant matters for which we are unable to reasonably estimate a range of possible loss.
22
Table of Contents
Notes (Continued)
Note 13. Segment Disclosures
Our reporting segments are Williams Partners and Midstream Canada & Olefins. All remaining business activities are included in Other. (See Note 1.)
Performance Measurement
We currently evaluate performance based upon segment profit (loss) from operations, which includes segment revenues from external and internal customers, segment costs and expenses, equity earnings (losses) and income (loss) from investments. Intersegment sales are generally accounted for at current market prices as if the sales were to unaffiliated third parties.
The primary types of costs and operating expenses by segment can be generally summarized as follows:
| • | Williams Partners—commodity purchases (primarily for NGL and crude marketing, shrink and fuel), depreciation and operation and maintenance expenses; |
| • | Midstream Canada & Olefins—commodity purchases (primarily for shrink, feedstock and NGL and olefin marketing activities), depreciation and operation and maintenance expenses. |
As discussed in Notes 1 and 3, our former exploration and production business was spun-off on December 31, 2011 and has been reported as discontinued operations in all prior periods presented. Revenues derived from intercompany sales to our former exploration and production business, previously reported as internal, have been recast and are now shown as external. In addition, costs attributable to activities with our former exploration and production business, previously reported as internal, have been recast and are now shown as external. Such revenues and costs were $74 million and $210 million, respectively, for the three months ended March 31, 2011.
23
Table of Contents
Notes (Continued)
The following table reflects the reconciliation of segment revenues and segment profit (loss) to revenues and operating income (loss) as reported in the Consolidated Statement of Income and total assets by reporting segment.
| Williams Partners |
Midstream Canada & Olefins |
Other | Eliminations | Total | ||||||||||||||||
| (Millions) | ||||||||||||||||||||
| Three months ended March 31, 2012 |
||||||||||||||||||||
| Segment revenues: |
||||||||||||||||||||
| External |
$ | 1,673 | $ | 343 | $ | 3 | $ | — | $ | 2,019 | ||||||||||
| Internal |
12 | 2 | 3 | (17 | ) | — | ||||||||||||||
|
|
|
|
|
|
|
|
|
|
|
|||||||||||
| Total revenues |
$ | 1,685 | $ | 345 | $ | 6 | $ | (17 | ) | $ | 2,019 | |||||||||
|
|
|
|
|
|
|
|
|
|
|
|||||||||||
| Segment profit (loss) |
$ | 488 | $ | 103 | $ | 59 | $ | — | $ | 650 | ||||||||||
| Less: |
||||||||||||||||||||
| Equity earnings (losses) |
30 | — | 1 | — | 31 | |||||||||||||||
| Income (loss) from investments |
— | (1 | ) | 53 | — | 52 | ||||||||||||||
|
|
|
|
|
|
|
|
|
|
|
|||||||||||
| Segment operating income (loss) |
$ | 458 | $ | 104 | $ | 5 | $ | — | 567 | |||||||||||
|
|
|
|
|
|
|
|
|
|||||||||||||
| General corporate expenses |
(40 | ) | ||||||||||||||||||
|
|
|
|||||||||||||||||||
| Total operating income (loss) |
$ | 527 | ||||||||||||||||||
|
|
|
|||||||||||||||||||
| Three months ended March 31, 2011 |
||||||||||||||||||||
| Segment revenues: |
||||||||||||||||||||
| External |
$ | 1,552 | $ | 315 | $ | 4 | $ | — | $ | 1,871 | ||||||||||
| Internal |
27 | 1 | 2 | (30 | ) | — | ||||||||||||||
|
|
|
|
|
|
|
|
|
|
|
|||||||||||
| Total revenues |
$ | 1,579 | $ | 316 | $ | 6 | $ | (30 | ) | $ | 1,871 | |||||||||
|
|
|
|
|
|
|
|
|
|
|
|||||||||||
| Segment profit (loss) |
$ | 437 | $ | 74 | $ | 20 | $ | — | $ | 531 | ||||||||||
| Less: |
||||||||||||||||||||
| Equity earnings (losses) |
25 | — | 9 | — | 34 | |||||||||||||||
| Income (loss) from investments |
— | — | 11 | — | 11 | |||||||||||||||
|
|
|
|
|
|
|
|
|
|
|
|||||||||||
| Segment operating income (loss) |
$ | 412 | $ | 74 | $ | — | $ | — | 486 | |||||||||||
|
|
|
|
|
|
|
|
|
|||||||||||||
| General corporate expenses |
(47 | ) | ||||||||||||||||||
|
|
|
|||||||||||||||||||
| Total operating income (loss) |
$ | 439 | ||||||||||||||||||
|
|
|
|||||||||||||||||||
| March 31, 2012 |
||||||||||||||||||||
| Total assets (a) |
$ | 15,405 | $ | 1,243 | $ | 1,415 | $ | (273 | ) | $ | 17,790 | |||||||||
| December 31, 2011 |
||||||||||||||||||||
| Total assets |
$ | 14,380 | $ | 1,138 | $ | 1,275 | $ | (291 | ) | $ | 16,502 | |||||||||
| (a) | The increase in Williams Partners’ total assets as compared to the prior year-end is substantially due to the acquisition of certain entities from Delphi Midstream Partners, LLC in the first quarter of 2012. (See Note 2.) |
Note 14. Subsequent Events
In April 2012, WPZ completed the acquisition of 100 percent of the ownership interest in Caiman Eastern Midstream, LLC, from Caiman Energy, LLC (Caiman Acquisition), for approximately $1.72 billion in cash, net of purchase price adjustments, and 11,779,296 WPZ common units, valued in the transaction at approximately $720 million. The acquired entity operates a gathering and processing business in northern West Virginia, southwestern Pennsylvania, and eastern Ohio. In conjunction with the closing of the Caiman Acquisition, we purchased approximately 16.4 million additional WPZ common units for approximately $1 billion, utilizing cash on hand. Our valuation of the assets acquired and liabilities assumed has not been completed because the acquisition is very recent. We expect the significant components of the valuation to include property, plant and equipment, intangible contract assets and goodwill. We believe the acquisition will provide Williams Partners with a significant footprint and growth potential in the natural gas liquids-rich portion of the Marcellus Shale. Revenues and earnings for the acquired entity for the periods presented are not material.
WPZ had obtained a backup financing commitment for up to a $1.78 billion interim liquidity facility with UBS Investment Bank which would have been available to fund the full cash purchase price for the Caiman Acquisition if necessary. This commitment was terminated as it was not utilized.
24
Table of Contents
Notes (Continued)
In April 2012, we completed an equity issuance of 29.9 million shares of common stock at a price of $30.59 per share.
In April 2012, WPZ completed an equity issuance of 10 million common units representing limited partner interests at a price of $54.56 per unit. Subsequently, the underwriters exercised their option to purchase approximately 1 million additional common units for $54.56 per unit.
25
Table of Contents
Management’s Discussion and Analysis of
Financial Condition and Results of Operations
General
We are primarily an energy infrastructure company focused on connecting North America’s significant hydrocarbon resource plays to growing markets for natural gas, natural gas liquids (NGLs), and olefins. Our operations are located principally in the United States, but span from the deepwater Gulf of Mexico to the Canadian oil sands, and are organized into the Williams Partners and Midstream Canada & Olefins reporting segments. All remaining business activities are included in Other. (See Note 1 of Notes to Consolidated Financial Statements for further discussion of these segments.) The Williams Partners segment consists of our consolidated master limited partnership, Williams Partners L.P. (WPZ), of which we currently own approximately 68 percent, including the general partner interest.
Unless indicated otherwise, the following discussion and analysis of critical accounting estimates, results of operations, and financial condition and liquidity relates to our current continuing operations and should be read in conjunction with the consolidated financial statements and notes thereto of this Form 10-Q and Amendment No. 2 to our 2011 Annual Report on Form 10-K/A, filed May 1, 2012.
Acquisitions
In February 2012, WPZ completed the acquisition of 100 percent of the ownership interests in certain entities from Delphi Midstream Partners, LLC (Laser Acquisition). These entities primarily own the Laser Gathering System, which is comprised of 33 miles of 16-inch natural gas pipeline and associated gathering facilities in the Marcellus Shale in Susquehanna County, Pennsylvania, as well as 10 miles of gathering lines in southern New York. This acquisition represents a strategic platform to enhance WPZ’s expansion in the Marcellus Shale by providing our customers with both operational flow assurance and marketing flexibility. (See Results of Operations – Segments, Williams Partners.)
In April 2012, WPZ completed the acquisition of 100 percent of the ownership interests in Caiman Eastern Midstream, LLC from Caiman Energy, LLC (Caiman Energy) in exchange for approximately $1.72 billion in cash, net of purchase price adjustments, and approximately 11.8 million of WPZ common units representing limited partner interests valued at $720 million in the transaction (Caiman Acquisition). Caiman Energy has agreed that it will not transfer these units for a period of 18 months after the closing of the transaction without WPZ’s written consent. WPZ funded the cash portion of the transaction with a combination of cash on hand and cash received from the sale of its common units to us. (See Results of Operations – Segments, Williams Partners.)
Dividends
In January 2012, our Board of Directors approved a regular quarterly dividend of $0.25875 per share. We expect total 2012 dividends to be $1.20 per share, which is almost 55 percent higher than 2011, and a 20 percent dividend increase in both 2013 and 2014.
Overview of Three Months Ended March 31, 2012
Income (loss) from continuing operations attributable to The Williams Companies, Inc., for the three months ended March 31, 2012, changed unfavorably by $13 million compared to the three months ended March 31, 2011. This change includes:
| • | The absence of a $124 million net tax benefit recorded in first-quarter 2011 associated with federal settlements and an international revised assessment. (See Note 5 of Notes to Consolidated Financial Statements.) |
26
Table of Contents
Management’s Discussion and Analysis (Continued)
| • | A $46 million improvement in operating income at Williams Partners primarily due to an increase in fee revenues and higher NGL margins reflecting improved commodity prices (see Results of Operations – Segments, Williams Partners); |
| • | A $30 million improvement in operating income at Midstream Canada & Olefins due to higher olefin production margins. (see Results of Operations – Segments, Midstream Canada & Olefins). |
| • | A favorable change in investing income – net of $56 million primarily reflecting the first quarter 2012 receipt of the remaining payments on the 2010 sale of our interest in Accroven SRL. |
See additional discussion in Results of Operations.
Our net cash provided by operating activities for the three months ended March 31, 2012, decreased $377 million compared to the three months ended March 31, 2011, primarily due to the absence of operating cash flows from our former exploration and production business and net unfavorable changes in working capital, partially offset by improved operating income from our continuing businesses.
Recent Events
| • | In February 2012, we announced a new interstate gas pipeline joint venture. The new 120-mile Constitution Pipeline will connect Williams Partners’ gathering system in Susquehanna County, Pennsylvania, to the Iroquois Gas Transmission and Tennessee Gas Pipeline systems. We expect to own a majority of Constitution Pipeline. This project, along with the newly acquired Laser Gathering System and our Springville pipeline are key steps in Williams Partners’ strategy to create the Susquehanna Supply Hub, a major natural gas supply hub in northeastern Pennsylvania. |
| • | In March 2012, a settlement agreement was reached under which our majority-owned entities that owned and operated the El Furrial and PIGAP II gas compression facilities in Venezuela sold the assets of these facilities following their expropriation by the Venezuelan government in 2009. In connection with the settlement, we received $98 million of cash and the right to receive quarterly installments of $15 million through the first quarter of 2016. Also as part of this settlement, we received $63 million in cash related to a previous agreement to sell our interest in Accroven SRL. (See Notes 3 and 4 of Notes to Consolidated Financial Statements.) |
| • | In April 2012, we completed an equity issuance of 29.9 million shares of common stock at a price of $30.59 per share. We used the net proceeds from this offering, together with cash on hand, to purchase approximately 16.4 million additional WPZ common units in connection with the financing of WPZ’s Caiman Acquisition. |
| • | In April 2012, WPZ completed an equity issuance of 10 million common units representing limited partner interests at a price of $54.56 per unit. Subsequently, the underwriters exercised their option to purchase approximately 1 million additional common units for $54.56 per unit. The proceeds will be used to fund general partnership purposes, including funding of a portion of the purchase price of WPZ’s Caiman Acquisition. |
Company Outlook
We believe we are well positioned to execute on our 2012 business plan and to further realize our growth opportunities. Economic and commodity price indicators for 2012 and beyond reflect continued improvement in the economic environment. However, these measures can be volatile and it is reasonably possible that the economy could worsen and/or commodity prices could decline, negatively impacting our future operating results.
Our business plan for 2012 includes planned capital investments of approximately $6.6 billion, including WPZ equity issued or expected to be issued in association with the previously discussed acquisitions. We expect to fund these activities primarily through cash on hand, cash flow from operations, equity issuances and debt and equity issuances by WPZ.
27
Table of Contents
Management’s Discussion and Analysis (Continued)
Our structure is designed to drive lower capital costs, enhance reliable access to capital markets, and create a greater ability to pursue development projects and acquisitions. We expect to realize our growth opportunities through these continued investments in our businesses in a way that meets customer needs and enhances our competitive position by:
| • | Continuing to invest in and grow our gathering, processing, and interstate natural gas pipeline systems; |
| • | Retaining the flexibility to adjust somewhat our planned levels of capital and investment expenditures in response to changes in economic conditions or business opportunities. |
Potential risks and/or obstacles that could impact the execution of our plan include:
| • | Availability of capital; |
| • | General economic, financial markets, or industry downturn; |
| • | Lower than anticipated energy commodity margins; |
| • | Lower than expected levels of cash flow from operations; |
| • | Counterparty credit and performance risk; |
| • | Decreased volumes from third parties served by our midstream businesses; |
| • | Changes in the political and regulatory environments; |
| • | Physical damages to facilities, especially damage to offshore facilities by named windstorms. |
We continue to address these risks through disciplined investment strategies, commodity hedging strategies, and maintaining at least $1 billion in consolidated liquidity from cash and cash equivalents and unused revolving credit facilities.
Critical Accounting Estimate
In February 2012, Williams Partners completed the Laser Acquisition, which includes a gathering system comprised of 33 miles of 16-inch natural gas pipeline and associated gathering facilities in the Marcellus Shale in Susquehanna County, Pennsylvania, as well as 10 miles of gathering lines in southern New York. As a result of the acquisition, we have recorded $297 million of goodwill as of March 31, 2012. (See Note 2 of Notes to Consolidated Financial Statements.) We are currently evaluating the appropriate reporting unit for the allocation of the goodwill within the Williams Partners segment. We are required to evaluate the goodwill for impairment at least annually or more frequently if impairment indicators are present. Our evaluation will include a qualitative assessment of events or circumstances to determine whether it is more likely than not that the fair value of the reporting unit is less than its carrying amount. If so, we will further compare our estimate of the fair value of the reporting unit with its carrying value, including goodwill. If the carrying value of the reporting unit exceeds its fair value, a computation of the implied fair value of the goodwill is compared with its related carrying value. If the carrying value of the reporting unit goodwill exceeds the implied fair value of that goodwill, an impairment loss will be recognized in the amount of the excess.
28
Table of Contents
Management’s Discussion and Analysis (Continued)
Results of Operations
Consolidated Overview
The following table and discussion is a summary of our consolidated results of operations for the three months ended March 31, 2012, compared to the three months ended March 31, 2011. The results of operations by segment are discussed in further detail following this consolidated overview discussion.
| Three months ended March 31, |
||||||||||||||||
| 2012 | 2011 | $ Change* | % Change* | |||||||||||||
| (Millions) | ||||||||||||||||
| Revenues |
$ | 2,019 | $ | 1,871 | +148 | +8 | % | |||||||||
| Costs and expenses: |
||||||||||||||||
| Costs and operating expenses |
1,348 | 1,309 | -39 | -3 | % | |||||||||||
| Selling, general and administrative expenses |
96 | 82 | -14 | -17 | % | |||||||||||
| Other (income) expense – net |
8 | (6 | ) | -14 | NM | |||||||||||
| General corporate expenses |
40 | 47 | +7 | +15 | % | |||||||||||
|
|
|
|
|
|||||||||||||
| Total costs and expenses |
1,492 | 1,432 | ||||||||||||||
| Operating income (loss) |
527 | 439 | ||||||||||||||
| Interest accrued – net |
(131 | ) | (151 | ) | +20 | +13 | % | |||||||||
| Investing income – net |
100 | 44 | +56 | +127 | % | |||||||||||
| Other income (expense) – net |
(4 | ) | 6 | -10 | NM | |||||||||||
|
|
|
|
|
|||||||||||||
| Income (loss) from continuing operations before income taxes |
492 | 338 | ||||||||||||||
| Provision (benefit) for income taxes |
133 | (22 | ) | -155 | NM | |||||||||||
|
|
|
|
|
|||||||||||||
| Income (loss) from continuing operations |
359 | 360 | ||||||||||||||
| Income (loss) from discontinued operations |
136 | 24 | +112 | NM | ||||||||||||
|
|
|
|
|
|||||||||||||
| Net income (loss) |
495 | 384 | ||||||||||||||
| Less: Net income attributable to noncontrolling interests |
72 | 63 | -9 | -14 | % | |||||||||||
|
|
|
|
|
|||||||||||||
| Net income (loss) attributable to The Williams Companies, Inc. |
$ | 423 | $ | 321 | ||||||||||||
|
|
|
|
|
|||||||||||||
| * | + = Favorable change; - = Unfavorable change; NM = A percentage calculation is not meaningful due to change in signs, a zero-value denominator, or a percentage change greater than 200. |
Three months ended March 31, 2012 vs. three months ended March 31, 2011
The increase in revenues is primarily due to higher marketing revenues at Williams Partners resulting from higher volumes, partially offset by lower average NGL prices. Additionally, fee revenues increased at Williams Partners primarily due to higher gathering, processing, and transportation fees. Midstream Canada & Olefins ethylene revenues increased primarily due to higher average per-unit sales prices and higher volumes.
The increase in costs and operating expenses is primarily due to increased marketing purchases at Williams Partners primarily resulting from higher volumes, partially offset by lower average NGL prices. This increase is partially offset by decreased costs at Williams Partners associated with production of NGLs reflecting lower average natural gas prices.
The increase in selling, general and administrative expenses (SG&A) is primarily due to an increase at Williams Partners reflecting higher information technology and employee-related expenses driven by general growth within Williams Partners’ business operations.
Other (income) expense – net within operating income in 2011 includes a $10 million reversal of project feasibility costs from expense to capital at Williams Partners.
29
Table of Contents
Management’s Discussion and Analysis (Continued)
The favorable change in operating income (loss) generally reflects increased fee revenues and increased NGL and ethylene margins due to both favorable energy commodity price changes in 2012 as compared to 2011 and higher volumes, partially offset by unfavorable changes in SG&A and other (income) expense – net as previously discussed.
Interest accrued – net changed favorably primarily due to corporate debt retirements in December 2011.
The favorable change in investing income – net is primarily due to $63 million of income recognized in 2012 as compared to an $11 million gain in 2011 at Other related to the 2010 sale of our interest in Accroven SRL. (See Note 4 of Notes to Consolidated Financial Statements.)
Provision (benefit) for income taxes changed unfavorably primarily due to higher pre-tax income in 2012 and the absence of approximately $124 million tax benefit from federal settlements and an international revised assessment in 2011. See Note 5 of Notes to Consolidated Financial Statements for a discussion of the effective tax rates compared to the federal statutory rate for both periods.
Income (loss) from discontinued operations in 2012 primarily includes a gain on reconsolidation following the sale of certain of our former Venezuela operations. See Note 3 of Notes to Consolidated Financial Statements for a discussion for the items in income (loss) from discontinued operations.
The unfavorable change in net income attributable to noncontrolling interests primarily reflects higher operating results at WPZ and our decreased percentage of ownership of WPZ, which was 72 percent at March 31, 2012, compared to 75 percent at March 31, 2011.
30
Table of Contents
Management’s Discussion and Analysis (Continued)
Results of Operations — Segments
Williams Partners
Our Williams Partners segment includes WPZ, our consolidated master limited partnership, which includes two interstate natural gas pipelines, as well as investments in natural gas pipeline-related companies, which serve regions from the San Juan basin in northwestern New Mexico and southwestern Colorado to Oregon and Washington and from the Gulf of Mexico to the northeastern United States. WPZ also includes natural gas gathering, processing and treating facilities and oil gathering and transportation facilities located primarily in the Rocky Mountain and Gulf Coast regions of the United States. As of March 31, 2012, we own approximately 72 percent of the interests in WPZ, including the interests of the general partner, which is wholly owned by us, and incentive distribution rights.
Williams Partners’ ongoing strategy is to safely and reliably operate large-scale, interstate natural gas transmission and midstream infrastructures where our assets can be fully utilized and drive low per-unit costs. We focus on consistently attracting new business by providing highly reliable service to our customers and utilizing our low cost-of-capital to invest in growing markets, including the deepwater Gulf of Mexico, the Marcellus Shale, the western United States, and areas of increasing natural gas demand.
Williams Partners’ interstate transmission and related storage activities are subject to regulation by the Federal Energy Regulatory Commission (FERC) and as such, our rates and charges for the transportation of natural gas in interstate commerce, and the extension, expansion, or abandonment of jurisdictional facilities and accounting, among other things, are subject to regulation. The rates are established through the FERC’s ratemaking process. Changes in commodity prices and volumes transported have little near-term impact on revenues because the majority of cost of service is recovered through firm capacity reservation charges in transportation rates.
Overview of Three Months Ended March 31, 2012
Significant events during 2012 include the following:
Caiman Acquisition
In March 2012, we announced an agreement to acquire Caiman Energy’s wholly owned subsidiary, Caiman Eastern Midstream LLC (Caiman). We completed the acquisition in the second quarter of 2012. (See Note 14 of Notes to Consolidated Financial Statements.)
The acquisition provides Williams Partners with a significant footprint and growth potential in the natural gas liquids-rich Ohio River Valley area of the Marcellus Shale. Caiman’s existing physical assets include a gathering system, two processing facilities and a fractionator located in northern West Virginia and eastern Ohio. In addition to the acquisition cost, we are committing a large portion of our planned 2012 capital expenditures for expansions to the gathering, processing and fractionation facilities, which are currently under construction. NGL pipelines are also planned. The assets are anchored by long-term contracted commitments, including 236,000 dedicated gathering acres from 10 producers in West Virginia, Ohio and Pennsylvania.
We also intend to participate in a new joint venture with Caiman Energy and its investors and management to develop midstream infrastructure in the NGL- and oil-rich areas of the Utica Shale in Ohio.
Susquehanna Supply Hub
Our Susquehanna Supply Hub is an integrated gathering infrastructure in the Marcellus Shale area of northeastern Pennsylvania including gathering assets acquired in December 2010, various compression and dehydration expansion projects, additional gathering and take away facilities acquired in February 2012, and our newly constructed Springville pipeline.
In February 2012, we completed the Laser Acquisition for $325 million in cash, net of cash acquired in the transaction and subject to certain closing adjustments, and approximately 7.5 million of WPZ’s common units valued at $465 million. The gathering system is comprised of 33 miles of 16-inch natural gas pipeline and associated gathering facilities in Susquehanna County, Pennsylvania, as well as 10 miles of gathering pipeline in southern New York. The acquisition is supported by existing long-term gathering agreements that provide acreage dedications and volume commitments.
Our Springville pipeline was placed into service in January 2012, providing new take-away capacity and allowing full use of capacity from various compression and dehydration expansion projects to our gathering business in northeastern Pennsylvania’s Marcellus Shale. In conjunction with a long-term agreement with a significant producer, we are operating the 33-mile, 24-inch diameter natural gas gathering pipeline and plan to increase the capacity in 2012.
31
Table of Contents
Management’s Discussion and Analysis (Continued)
As production in the Marcellus increases and expansion projects are completed, the Susquehanna Supply Hub is expected to reach a gas take away capacity of 3 billion cubic feet per day (Bcf/d) by 2015.
Volatile commodity prices
Average per-unit NGL margins in the first quarter of 2012 were 11 percent higher than in the same period of 2011, benefiting from lower natural gas prices driven by abundant natural gas supplies, partially offset by weaker NGL prices, primarily ethane.
NGL margins are defined as NGL revenues less any applicable BTU replacement cost, plant fuel, and third-party transportation and fractionation. Per-unit NGL margins are calculated based on sales of our own equity volumes at the processing plants. Our equity volumes include NGLs where we own the rights to the value from NGLs recovered at our plants under both “keep-whole” processing agreements, where we have the obligation to replace the lost heating value with natural gas, and “percent-of-liquids” agreements whereby we receive a portion of the extracted liquids with no obligation to replace the lost heating value.
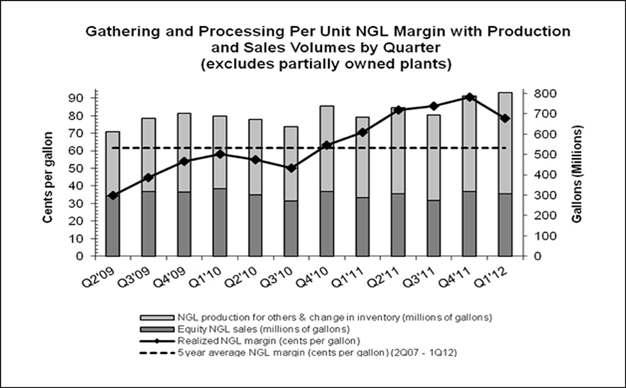
32
Table of Contents
Management’s Discussion and Analysis (Continued)
Outlook for the Remainder of 2012
Commodity price changes
| • | We expect our average per-unit NGL margins in 2012 to be comparable to 2011 and higher than our rolling five-year average per-unit NGL margins. NGL price changes have historically tracked somewhat with changes in the price of crude oil, although NGL, crude, and natural gas prices are highly volatile, difficult to predict, and are often not highly correlated. NGL margins are highly dependent upon continued demand within the global economy. However, NGL products are currently the preferred feedstock for ethylene and propylene production, which has been shifting away from the more expensive crude-based feedstocks. Bolstered by abundant long-term domestic natural gas supplies, we expect to benefit from these dynamics in the broader global petrochemical markets. |
| • | As part of our efforts to manage commodity price risks on an enterprise basis, we continue to evaluate our commodity hedging strategies. To reduce the exposure to changes in market prices, we have entered into NGL swap agreements to fix the prices of approximately 10 percent of our anticipated NGL sales volumes and an approximate corresponding portion of anticipated shrink gas requirements for the remainder of 2012. The combined impact of these energy commodity derivatives will provide a margin on the hedged volumes of $169 million. |
Gathering, processing, and NGL sales volumes
| • | The growth of natural gas supplies supporting our gathering and processing volumes are impacted by producer drilling activities, which are influenced by natural gas prices. |
| • | In Williams Partners’ onshore businesses, we anticipate significant growth in our gas gathering volumes as our infrastructure grows to support drilling activities in northeast Pennsylvania. We anticipate slight increases in gas gathering volumes in the Piceance basin and no change or slight declines in basins in the Rocky Mountain and Four Corners areas due to reduced drilling activity. We anticipate equity NGL volumes in 2012 to be comparable to 2011, as we expect little change in the volume of gas processed in the western onshore businesses. Sustained low gas prices could discourage producer drilling activities in our onshore areas and unfavorably impact the supply of natural gas available to gather and process in the long term. |
| • | In Williams Partners’ gulf coast businesses, we expect higher gas gathering, processing, and crude transportation volumes. Our customers’ drilling activities are primarily focused on crude oil economics, rather than natural gas and we have not experienced, and do not anticipate, an overall significant decline in volumes due to reduced drilling activities. |
| • | The operator of the third-party fractionator serving our NGL production transported on Overland Pass Pipeline Company LLC (OPPL) has notified us of an expected 20- to 25-day outage in the second quarter of 2012 to accommodate their expansion efforts. We have taken steps to mitigate the impact and expect the outage will result in a minimal reduction to our equity volumes. |
| • | We anticipate higher general and administrative, operating, and depreciation expense supporting our growing operations in northeast Pennsylvania, Piceance basin, and western Gulf of Mexico. |
Expansion projects
We expect to invest total capital of $5.3 billion to $5.5 billion in 2012, including WPZ equity consideration of $465 million for the Laser Acquisition and $720 million for the Caiman Acquisition. The ongoing major expansion projects include the following:
33
Table of Contents
Management’s Discussion and Analysis (Continued)
Mid-South
In August 2011, we received approval from the FERC to upgrade compressor facilities and expand our existing natural gas transmission system from Alabama to markets as far north as North Carolina. The cost of the project is estimated to be $217 million. The project is expected to be phased into service in September 2012 and June 2013 with an expected increase in capacity of 225 thousand dekatherms per day (Mdth/d).
Mid-Atlantic Connector
In July 2011, we received approval from the FERC to expand our existing natural gas transmission system from North Carolina to markets as far downstream as Maryland. The cost of the project is estimated to be $55 million and is expected to increase capacity by 142 Mdth/d. We plan to place the project into service in November 2012.
Northeast Supply Link
In December 2011, we filed an application with the FERC to expand our existing natural gas transmission system from the Marcellus Shale production region on the Leidy Line to various delivery points in New York and New Jersey. The cost of the project is estimated to be $341 million and is expected to increase capacity by 250 Mdth/d. We plan to place the project into service in November 2013.
Marcellus Shale Expansions
| • | Expansion of our Susquehanna Supply Hub in northeastern Pennsylvania, as previously discussed. |
| • | As previously discussed and assuming closing of the Caiman Acquisition, expansions currently under construction to the gas gathering system, processing facilities and fractionator, which we’ve agreed to acquire from Caiman Energy. |
| • | Expansions to our gathering system through capital to be invested within our Laurel Mountain equity investment, also in the Marcellus Shale region. The Shamrock compressor station, currently providing 60 million cubic feet per day (MMcf/d) of capacity, is expandable to 350 MMcf/d and will likely be the largest central delivery point out of the Laurel Mountain system. Our equity investee is progressing on further expansions to the Shamrock compressor station and other additions to the gathering infrastructure in 2012. |
Gulfstar FPS™ Deepwater Project
We will design, construct, and install our Gulfstar FPS™, a spar-based floating production system that utilizes a standard design approach with a capacity of 60 thousand barrels per day (Mbbls/d) of oil, up to 200 MMcf/d of natural gas, and the capability to provide seawater injection services. We expect Gulfstar FPS™ to be capable of serving as a central host facility for other deepwater prospects in the area. Construction is underway and the project is expected to be in service in 2014.
Parachute
In conjunction with a basin-wide agreement for all gathering and processing services provided by us to WPX Energy, Inc. in the Piceance basin, we plan to construct a 350 MMcf/d cryogenic gas processing plant. The Parachute TXP I plant is expected to be in service in 2014.
Keathley Canyon Connector™
Our equity investee, Discovery Producer Services LLC (Discovery), plans to construct, own, and operate a new 215-mile 20-inch deepwater lateral pipeline from a third-party floating production facility located in the Keathley Canyon Block in the central deepwater Gulf of Mexico. Discovery has signed long-term agreements
34
Table of Contents
Management’s Discussion and Analysis (Continued)
with anchor customers for natural gas gathering and processing services for production from those fields. The Keathley Canyon Connector™ lateral will originate from a third party floating production facility in the southeast portion of the Keathley Canyon area and will connect to Discovery’s existing 30-inch offshore gas transmission system. The lateral pipeline is estimated to have the capacity to flow more than 400 MMcf/d and will accommodate the tie-in of other deepwater prospects. Pre-construction activities have begun, the pipeline is expected to be laid in 2013, and is planned to be in-service in mid-2014.
Overland Pass Pipeline Expansion
Through our equity investment in OPPL, we plan to participate in the construction of a pipeline connection and capacity expansions, expected to be complete in early 2013, to increase the pipeline’s capacity to the maximum of 255 Mbbls/d, to accommodate new volumes coming from the Bakken Shale in the Williston basin.
Eminence Storage Field Leak
On December 28, 2010, we detected a leak in one of the seven underground natural gas storage caverns at our Eminence Storage Field in Mississippi. Due to the leak and related damage to the well at an adjacent cavern, both caverns are out of service. In addition, two other caverns at the field, which were constructed at or about the same time as those caverns, have experienced operating problems, and we have determined that they should also be retired. The event has not affected the performance of our obligations under our service agreements with our customers.
In September 2011, we filed an application with the FERC seeking authorization to abandon these four caverns. We estimate the total abandonment costs, which will be capital in nature, will be approximately $76 million, which is expected to be spent through the first half of 2013. As of March 31, 2012, we have incurred approximately $44 million in cumulative abandonment costs. This estimate is subject to change as work progresses and additional information becomes known. Management considers these costs to be prudent costs incurred in the abandonment of these caverns and expects to recover these costs, net of insurance proceeds, in future rate filings. To the extent available, the abandonment costs will be funded from the ARO Trust. (See Note 10 of Notes to Consolidated Financial Statements.)
Filing of Rate Cases
Pursuant to the terms of Transco’s most recent rate settlement agreement, Transco must file a new rate case no later than August 31, 2012.
During the first quarter of 2012, Northwest Pipeline filed a Stipulation and Settlement Agreement with the FERC for an increase in their rates. Northwest Pipeline received FERC approval during the second quarter of 2012. The new rates, which as filed are 7.4 percent higher than current rates, will become effective January 1, 2013.
Period-Over-Period Operating Results
| Three months ended March 31, | ||||||||
| 2012 | 2011 | |||||||
| (Millions) | ||||||||
| Segment revenues |
$ | 1,685 | $ | 1,579 | ||||
|
|
|
|
|
|||||
| Segment profit |
$ | 488 | $ | 437 | ||||
|
|
|
|
|
|||||
Three months ended March 31, 2012 vs. three months ended March 31, 2011
The increase in segment revenues includes:
| • | A $44 million increase in marketing revenues primarily due to higher volumes, partially offset by lower average NGL prices. These changes are more than offset by similar changes in marketing purchases. |
35
Table of Contents
Management’s Discussion and Analysis (Continued)
| • | A $41 million increase in fee revenues primarily due to higher gathering and processing fee revenues primarily associated with higher volumes on our Susquehanna Supply Hub gathering assets in the Marcellus Shale in northeastern Pennsylvania and on our Perdido Norte gas and oil pipelines in the western deepwater Gulf of Mexico. In addition, gathering volumes are higher in our onshore assets in the West due primarily to the absence of severe winter weather conditions in the first quarter of 2011 which limited producers’ ability to deliver gas. |
| • | An $18 million increase in natural gas transportation revenues associated with gas pipeline expansion projects placed into service in 2011. |
Segment costs and expenses increased $60 million, including:
| • | A $67 million increase in marketing purchases primarily due to higher volumes, partially offset by lower average NGL prices. These changes are largely offset by similar changes in marketing revenues. |
| • | A $10 million increase in general and administrative expenses reflecting increases in information technology and employee-related expenses driven by general growth within our business operations. |
| • | A $10 million unfavorable change due to the absence of a first-quarter 2011 reversal of project feasibility costs from expense to capital. |
| • | A $28 million decrease in costs associated with our equity NGLs primarily due to a 25 percent decrease in average natural gas prices. |
The increase in segment profit includes:
| • | A $41 million increase in fee revenues as previously discussed. |
| • | A $35 million increase in NGL margins reflecting favorable NGL commodity prices and volumes. |
| • | An $18 million increase in natural gas transportation revenues as previously discussed. |
| • | A $23 million decrease in margins related to the marketing of NGLs. |
| • | A $10 million increase in general and administrative expenses as previously discussed. |
| • | A $10 million unfavorable change due to the absence of a first-quarter 2011 reversal of project feasibility costs from expense to capital. |
Midstream Canada & Olefins
Our Midstream Canada & Olefins segment includes our oil sands off-gas processing plant near Fort McMurray, Alberta, our NGL/olefin fractionation facility at Redwater, Alberta, our NGL light-feed olefins cracker in Geismar, Louisiana along with associated ethane and propane pipelines, and our refinery grade propylene splitter in Louisiana. The products we produce are: NGLs, ethylene, propylene, and other co-products. Our NGL products include: propane, normal butane, isobutane/butylene (butylene), and condensate.
Overview of Three Months Ended March 31, 2012
Segment profit for the three months ended March 31, 2012, improved compared to the prior year primarily due to higher production margins on Geismar ethylene.
36
Table of Contents
Management’s Discussion and Analysis (Continued)
Outlook for the Remainder of 2012
Commodity price changes
While per-unit margins are volatile and highly dependent upon continued demand within the global economy, we believe that our average per-unit ethylene margin will increase over 2011 levels and our average Canadian propylene and NGL per-unit margins will be comparable to the 2011 levels. We expect ethylene margins to benefit from lower ethane prices. NGL products are currently the preferred feedstock for ethylene and propylene production which has been shifting away from the more expensive crude-based feedstocks. Bolstered by abundant long-term domestic natural gas supplies, we expect to benefit from these dynamics in the broader global petrochemical markets because of our NGL-based olefins production.
Volume impacts
While we expect our 2012 production sales volumes to be comparable or increase over 2011 levels, we expect to see temporarily lower production sales volumes in second quarter from the following issues:
| • | Feedstock constraints that we experienced from mid-March to mid-April at our oil sands off-gas processing plant. |
| • | As part of the startup process for the Boreal Pipeline, certain volumes will be required to fill the pipeline. |
| • | A seven-day unplanned outage at our Geismar plant beginning in late March and ending early April. |
Allocation of capital to projects
We expect to spend $600 million to $700 million in 2012 on capital projects, of which $516 million to $616 million remains to be spent. The major expansion projects include:
| • | The Boreal Pipeline project, which is a 12-inch diameter pipeline in Canada that will transport recovered NGLs and olefins from our extraction plant in Fort McMurray to our Redwater fractionation facility. The pipeline will have sufficient capacity to transport additional recovered liquids in excess of those from our current agreements. Construction is nearing completion and we anticipate an in-service date in the second quarter of 2012. |
| • | An expansion of our Geismar olefins production facility which is expected to increase the facility’s ethylene production capacity by 600 million pounds per year to a new annual capacity of 1.95 billion pounds. We are currently in the detailed engineering and procurement phase and expect to complete the expansion in the latter part of 2013. |
| • | The ethane recovery project, which is an expansion of our Canadian facilities that will allow us to recover ethane/ethylene mix from our operations that process off-gas from the Alberta oil sands. We plan to modify our oil sands off-gas extraction plant near Fort McMurray, Alberta, and construct a de-ethanizer at our Redwater fractionation facility. Our de-ethanizer is expected to initially process approximately 10,000 bbls/d of ethane/ethylene mix. We have signed a long-term contract to provide the ethane/ethylene mix to a third-party customer. We have begun construction and we expect to complete the expansions and begin producing ethane/ethylene mix in mid-year 2013. |
Period-Over-Period Operating Results
| Three months ended March 31, | ||||||||
| 2012 | 2011 | |||||||
| (Millions) | ||||||||
| Segment revenues |
$ | 345 | $ | 316 | ||||
|
|
|
|
|
|||||
| Segment profit |
$ | 103 | $ | 74 | ||||
|
|
|
|
|
|||||
37
Table of Contents
Management’s Discussion and Analysis (Continued)
Three months ended March 31, 2012 vs. three months ended March 31, 2011
Segment revenues and segment profit increased primarily due to:
| • | $18 million higher ethylene production sales revenues primarily due to 11 percent higher average per-unit sales prices and 4 percent higher volumes. |
| • | $7 million higher butadiene and debutanized aromatic concentrate (DAC) production sales revenues due to higher per-unit prices and higher volumes. |
Other
Other includes other business activities that are not operating segments as well as corporate operations.
Period-Over-Period Operating Results
| Three months ended March 31, | ||||||||
| 2012 | 2011 | |||||||
| (Millions) | ||||||||
| Segment revenues |
$ | 6 | $ | 6 | ||||
|
|
|
|
|
|||||
| Segment profit |
$ | 59 | $ | 20 | ||||
|
|
|
|
|
|||||
The increase in segment profit is primarily due to gains related to the 2010 sale of our interest in Accroven SRL of $53 million in 2012 compared to $11 million in the first quarter of 2011. As part of a settlement regarding certain Venezuelan assets in the first quarter of 2012 (see Note 4 of Notes to Consolidated Financial Statements), we received payment for all outstanding balances due from this sale.
38
Table of Contents
Management’s Discussion and Analysis (Continued)
Management’s Discussion and Analysis of Financial Condition and Liquidity
Outlook
Our plan for 2012, includes continued strong operating cash flows from our businesses. Lower-than-expected energy commodity prices would be somewhat mitigated by certain of our cash flow streams that are substantially insulated from short-term changes in commodity prices as follows:
| • | Firm demand and capacity reservation transportation revenues under long-term contracts from our gas pipelines; |
| • | Fee-based revenues from certain gathering and processing services in our midstream businesses. |
We believe we have, or have access to, the financial resources and liquidity necessary to meet our requirements for capital and investment expenditures, dividends and distributions, working capital, and tax and debt payments while maintaining a sufficient level of liquidity. In particular, we note the following for 2012:
| • | We expect capital investments to total between $6.4 billion and $6.8 billion in 2012, including WPZ equity consideration of approximately $1.2 billion associated with acquisitions. Of this total, maintenance capital expenditures, which are generally considered nondiscretionary and include expenditures to meet legal and regulatory requirements, to maintain and/or extend the operating capacity and useful lives of our assets, and to complete certain well connections, are expected to total between $520 million and $600 million. Expansion capital which is generally more discretionary to fund projects in order to grow our business is expected to total between $5.88 billion and $6.2 billion. See Results of Operations – Segments, Williams Partners and Midstream Canada & Olefins for discussions describing the general nature of these investments. |
| • | We expect to pay total cash dividends of approximately $1.20 per common share, an increase of almost 55 percent over 2011 levels. We expect to increase our dividend quarterly through paying out substantially all of the cash distributions, net of applicable taxes, interest and costs, we receive from WPZ. |
| • | We expect to fund capital and investment expenditures, tax and debt payments, dividends and distributions, and working capital requirements primarily through cash flow from operations, cash and cash equivalents on hand, utilization of our revolving credit facilities, and proceeds from debt issuances and sales of equity securities as needed. Based on a range of market assumptions, we currently estimate our cash flow from operations will be between $1.925 billion and $2.425 billion in 2012. |
| • | We expect to maintain consolidated liquidity (which includes liquidity at WPZ) of at least $1 billion from cash and cash equivalents and unused revolving credit facilities. |
| • | We expect WPZ to fund its $325 million of current debt maturities with new debt issuances. |
| • | In April 2012, WPZ acquired Caiman Eastern Midstream, LLC, in exchange for aggregate consideration of approximately $1.72 billion cash, net of purchase price adjustments, and 11.8 million of WPZ’s limited partner units. |
| • | In connection with WPZ’s Caiman Acquisition, we made an additional investment in WPZ of approximately $1 billion to facilitate the acquisition. We purchased approximately 16.4 million WPZ limited partner units, and have agreed to temporarily waive our incentive distribution rights (IDRs) related to these units and the units issued to the seller of Caiman Eastern Midstream, LLC, in connection with this acquisition. We estimate the foregone IDRs would have yielded approximately $26 million in 2012. |
| • | In April 2012, we issued 29.9 million shares of common stock in a public offering at a price of $30.59 per share. We used the net proceeds of $887 million, along with cash-on-hand, to purchase additional WPZ common units in connection with WPZ’s Caiman Acquisition. |
39
Table of Contents
Management’s Discussion and Analysis (Continued)
| • | During April 2012, WPZ completed an equity issuance of 10 million common units representing limited partner interests in it at a price of $54.56 per unit. Subsequently, the underwriters exercised their option to purchase approximately 1 million additional common units for $54.56 per unit. The net proceeds of approximately $581 million will be used for general partnership purposes, including the funding of a portion of the purchase price of the Caiman Acquisition. |
Potential risks associated with our planned levels of liquidity and the planned capital and investment expenditures discussed above include:
| • | Sustained reductions in energy commodity prices from the range of current expectations; |
| • | Lower than expected distributions, including IDRs, from WPZ. WPZ’s liquidity could also be impacted by a lack of adequate access to capital markets to fund its growth; |
| • | Lower than expected levels of cash flow from operations from Midstream Canada & Olefins. |
Liquidity
Based on our forecasted levels of cash flow from operations and other sources of liquidity, we expect to have sufficient liquidity to manage our businesses in 2012. Our internal and external sources of consolidated liquidity include cash generated from our operations, cash and cash equivalents on hand, and our credit facilities. Additional sources of liquidity, if needed, include bank financings, proceeds from the issuance of long-term debt and equity securities, and proceeds from asset sales. These sources are available to us at the parent level and are expected to be available to certain of our subsidiaries, particularly equity and debt issuances from WPZ. WPZ is expected to be self-funding through its cash flows from operations, use of its credit facility, and its access to capital markets. WPZ makes cash distributions to us in accordance with the partnership agreement, which considers our level of ownership and incentive distribution rights. Our ability to raise funds in the capital markets will be impacted by our financial condition, interest rates, market conditions, and industry conditions.
| March 31, 2012 | ||||||||||||||||
| Available Liquidity | Expiration | WPZ | WMB | Total | ||||||||||||
| (Millions) | ||||||||||||||||
| Cash and cash equivalents |
$ | 263 | $ | 837 | (1) | $ | 1,100 | |||||||||
| Capacity available under our $900 million senior unsecured revolving credit facility (2) |
June 3, 2016 | 900 | 900 | |||||||||||||
| Capacity available to WPZ under its $2 billion senior unsecured revolving credit facility (3) |
June 3, 2016 | 2,000 | 2,000 | |||||||||||||
|
|
|
|
|
|
|
|||||||||||
| $ | 2,263 | $ | 1,737 | $ | 4,000 | |||||||||||
|
|
|
|
|
|
|
|||||||||||
| (1) | Includes $614 million of cash and cash equivalents that is being held by certain subsidiary and international operations and is not considered available for general corporate purposes. The remainder of our cash and cash equivalents is primarily held in government-backed instruments. |
| (2) | At March 31, 2012, we are in compliance with the financial covenants associated with this credit facility agreement. |
| (3) | At March 31, 2012, WPZ is in compliance with the financial covenants associated with this credit facility agreement. This credit facility is only available to WPZ, Transco and Northwest Pipeline as co-borrowers. |
In addition to the credit facilities listed above, we have issued letters of credit totaling $20 million as of March 31, 2012 under certain bilateral bank agreements.
WPZ filed a shelf registration statement as a well-known, seasoned issuer in February 2012 that allows it to issue an unlimited amount of registered debt and limited partnership unit securities.
40
Table of Contents
Management’s Discussion and Analysis (Continued)
At the parent-company level, we filed a shelf registration statement as a well-known, seasoned issuer in May 2009 that allows us to issue an unlimited amount of registered debt and equity securities.
Credit Ratings
Our ability to borrow money is impacted by our credit ratings and the credit ratings of WPZ. The current ratings are as follows:
| Senior | ||||||||||||||||
| Unsecured | Corporate | |||||||||||||||
| Rating Agency |
Date of Last Change |
Outlook | Debt Rating | Credit Rating | ||||||||||||
| Williams: |
||||||||||||||||
| Standard & Poor’s | March 5, 2012 | Stable | BBB- | BBB | ||||||||||||
| Moody’s Investors Service | February 27, 2012 | Stable | Baa3 | N/A | ||||||||||||
| Fitch Ratings | February 9, 2012 | Stable | BBB- | N/A | ||||||||||||
| Williams Partners: |
||||||||||||||||
| Standard & Poor’s | March 5, 2012 | Stable | BBB | BBB | ||||||||||||
| Moody’s Investors Service | February 27, 2012 | Stable | Baa2 | N/A | ||||||||||||
| Fitch Ratings | February 9, 2012 | Positive | BBB- | N/A | ||||||||||||
With respect to Standard and Poor’s, a rating of “BBB” or above indicates an investment grade rating. A rating below “BBB” indicates that the security has significant speculative characteristics. A “BB” rating indicates that Standard and Poor’s believes the issuer has the capacity to meet its financial commitment on the obligation, but adverse business conditions could lead to insufficient ability to meet financial commitments. Standard and Poor’s may modify its ratings with a “+” or a “-” sign to show the obligor’s relative standing within a major rating category.
With respect to Moody’s, a rating of “Baa” or above indicates an investment grade rating. A rating below “Baa” is considered to have speculative elements. The “1”, “2”, and “3” modifiers show the relative standing within a major category. A “1” indicates that an obligation ranks in the higher end of the broad rating category, “2” indicates a mid-range ranking, and “3” indicates a ranking at the lower end of the category.
With respect to Fitch, a rating of “BBB” or above indicates an investment grade rating. A rating below “BBB” is considered speculative grade. Fitch may add a “+” or a “-” sign to show the obligor’s relative standing within a major rating category.
Credit rating agencies perform independent analyses when assigning credit ratings. No assurance can be given that the credit rating agencies will continue to assign us investment grade ratings even if we meet or exceed their current criteria for investment grade ratios. A downgrade of our credit rating might increase our future cost of borrowing and would require us to post additional collateral with third parties, negatively impacting our available liquidity. As of March 31, 2012, we estimate that a downgrade to a rating below investment grade for us or WPZ could require us to post up to $35 million or $199 million, respectively, in additional collateral with third parties.
41
Table of Contents
Management’s Discussion and Analysis (Continued)
Sources (Uses) of Cash
| Three months ended March 31, | ||||||||
| 2012 | 2011 | |||||||
| (Millions) | ||||||||
| Net cash provided (used) by: |
||||||||
| Operating activities |
$ | 434 | $ | 811 | ||||
| Financing activities |
268 | (104 | ) | |||||
| Investing activities |
(491 | ) | (579 | ) | ||||
|
|
|
|
|
|||||
| Increase in cash and cash equivalents |
$ | 211 | $ | 128 | ||||
|
|
|
|
|
|||||
Operating activities
Our net cash provided by operating activities for the three months ended March 31, 2012, decreased $377 million from the same period in 2011 primarily due to the absence of cash flows from our former exploration and production business and net unfavorable changes in working capital, partially offset by improved operating income from our continuing businesses.
Financing activities
Significant transactions include:
| • | $490 million received from WPZ’s first quarter 2012 equity offering; |
| • | We paid $154 million of quarterly dividends on common stock. |
Investing activities
Significant transactions include:
| • | Capital expenditures totaled $329 million and $526 million for 2012 and 2011, respectively; |
| • | $325 million paid, net of cash acquired in the transaction, for WPZ’s acquisition of 100 percent of the ownership interests in certain entities from Delphi Midstream Partners, LLC; |
| • | $121 million received from the reconsolidation of the Wipro entities. (See Note 3 of our Notes to Consolidated Financial Statements). This cash is only considered available for use in our international operations. |
Off-Balance Sheet Financing Arrangements and Guarantees of Debt or Other Commitments
We have various other guarantees and commitments which are disclosed in Notes 10 and 12 of Notes to Consolidated Financial Statements. We do not believe these guarantees or the possible fulfillment of them will prevent us from meeting our liquidity needs.
42
Table of Contents
Quantitative and Qualitative Disclosures About Market Risk
Interest Rate Risk
Our current interest rate risk exposure is related primarily to our debt portfolio and has not materially changed during the first three months of 2012.
Commodity Price Risk
We are exposed to the impact of fluctuations in the market price of natural gas and NGLs, as well as other market factors, such as market volatility and energy commodity price correlations. We are exposed to these risks in connection with our owned energy-related assets, our long-term energy-related contracts, and limited proprietary trading activities. Our management of the risks associated with these market fluctuations includes maintaining a conservative capital structure and significant liquidity, as well as using various derivatives and nonderivative energy-related contracts. The fair value of derivative contracts is subject to many factors, including changes in energy commodity market prices, the liquidity and volatility of the markets in which the contracts are transacted, and changes in interest rates. (See Note 11 of Notes to Consolidated Financial Statements.)
We measure the risk in our portfolio using a value-at-risk methodology to estimate the potential one-day loss from adverse changes in the fair value of the portfolio. Value-at-risk requires a number of key assumptions and is not necessarily representative of actual losses in fair value that could be incurred from the portfolio. Our value-at-risk model uses a Monte Carlo method to simulate hypothetical movements in future market prices and assumes that, as a result of changes in commodity prices, there is a 95 percent probability that the one-day loss in fair value of the portfolio will not exceed the value-at-risk. The simulation method uses historical correlations and market forward prices and volatilities. In applying the value-at-risk methodology, we do not consider that the simulated hypothetical movements affect the positions or would cause any potential liquidity issues, nor do we consider that changing the portfolio in response to market conditions could affect market prices and could take longer than a one-day holding period to execute. While a one-day holding period has historically been the industry standard, a longer holding period could more accurately represent the true market risk given market liquidity and our own credit and liquidity constraints.
We segregate our derivative contracts into trading and nontrading contracts, as defined in the following paragraphs. We calculate value-at-risk separately for these two categories. Contracts designated as normal purchases or sales and nonderivative energy contracts have been excluded from our estimation of value-at-risk.
Trading
Our trading portfolio consists of derivative contracts entered into for purposes other than economically hedging our commodity price-risk exposure. The fair value of our trading derivatives was a net asset of $1 million at March 31, 2012. The value-at-risk for contracts held for trading purposes was less than $0.1 million at March 31, 2012 and December 31, 2011.
Nontrading
Our nontrading portfolio consists of derivative contracts that hedge or could potentially hedge the price risk exposure from the following activities:
| Segment |
Commodity Price Risk Exposure | |
| Williams Partners |
• Natural gas purchases | |
| • NGL sales | ||
| Midstream Canada & Olefins |
• NGL purchases and sales |
The fair value of our nontrading derivatives was a net liability of $8 million at March 31, 2012 and a net asset of $1 million at December 31, 2011.
43
Table of Contents
The value-at-risk for derivative contracts held for nontrading purposes was $2.3 million at March 31, 2012, and zero at December 31, 2011.
Certain of the derivative contracts held for nontrading purposes are accounted for as cash flow hedges. Of the total fair value of nontrading derivatives, cash flow hedges had a net liability value of $8 million as of March 31, 2012. Though these contracts are included in our value-at-risk calculation, any changes in the fair value of the effective portion of these hedge contracts would generally not be reflected in earnings until the associated hedged item affects earnings.
44
Table of Contents
Controls and Procedures
Our management, including our Chief Executive Officer and Chief Financial Officer, does not expect that our disclosure controls and procedures (as defined in Rules 13a-15(e) and 15d-15(e) of the Securities Exchange Act) (Disclosure Controls) or our internal controls over financial reporting (Internal Controls) will prevent all errors and all fraud. A control system, no matter how well conceived and operated, can provide only reasonable, not absolute, assurance that the objectives of the control system are met. Further, the design of a control system must reflect the fact that there are resource constraints, and the benefits of controls must be considered relative to their costs. Because of the inherent limitations in all control systems, no evaluation of controls can provide absolute assurance that all control issues and instances of fraud, if any, within the company have been detected. These inherent limitations include the realities that judgments in decision-making can be faulty and that breakdowns can occur because of simple error or mistake. Additionally, controls can be circumvented by the individual acts of some persons, by collusion of two or more people, or by management override of the control. The design of any system of controls is also based in part upon certain assumptions about the likelihood of future events, and there can be no assurance that any design will succeed in achieving its stated goals under all potential future conditions. Because of the inherent limitations in a cost-effective control system, misstatements due to error or fraud may occur and not be detected. We monitor our Disclosure Controls and Internal Controls and make modifications as necessary; our intent in this regard is that the Disclosure Controls and Internal Controls will be modified as systems change and conditions warrant.
Evaluation of Disclosure Controls and Procedures
An evaluation of the effectiveness of the design and operation of our Disclosure Controls was performed as of the end of the period covered by this report. This evaluation was performed under the supervision and with the participation of our management, including our Chief Executive Officer and Chief Financial Officer. Because of the material weakness described below that existed at March 31, 2012, our Chief Executive Officer and Chief Financial Officer concluded that these Disclosure Controls were not effective at a reasonable assurance level.
In April 2012, we identified a material weakness related to accounting for deferred income taxes related to our investment in Williams Partners L.P. (WPZ) associated with gains recorded as part of stockholders’ equity on units that WPZ issued in prior years.
A material weakness is a deficiency, or combination of deficiencies, in internal control over financial reporting, such that there is a reasonable possibility that a material misstatement of the annual or interim financial statements will not be prevented or detected on a timely basis.
Previously we had not recorded deferred income taxes related to our investment in WPZ associated with gains recorded as part of stockholders’ equity on units that WPZ issued in prior years. However, in accordance with ASC 740 Income Taxes, we have concluded that we should recognize deferred income taxes for tax effects arising from the differences in our financial and income tax bases in our WPZ investment resulting from these transactions. We have corrected our financial statements for the period ended December 31, 2011 and our method of accounting for deferred income taxes related to our investment in WPZ associated with gains recorded as part of stockholders’ equity on units that WPZ issues. We are also enhancing our controls for oversight of tax accounting for our financial investment in WPZ.
First-Quarter 2012 Changes in Internal Controls
There have been no changes during the first quarter of 2012 that have materially affected, or are reasonably likely to materially affect, our Internal Controls. However, in April 2012, we began enhancing our controls for oversight of tax accounting for our financial investment in WPZ.
Environmental
Certain reportable legal proceedings involving governmental authorities under federal, state and local laws regulating the discharge of materials into the environment are described below. While it is not possible for us to predict the final outcome of the proceedings which are still pending, we do not anticipate a material effect on our consolidated financial position if we receive an unfavorable outcome in any one or more of such proceedings.
In September 2007, the EPA requested, and Transco later provided, information regarding natural gas compressor stations in the states of Mississippi and Alabama as part of the EPA’s investigation of Transco’s compliance with the Clean Air Act. On March 28, 2008, the EPA issued notices of violation alleging violations of Clean Air Act requirements at these compressor stations. Transco met with the EPA in May 2008 and submitted a response denying the allegations in June 2008. In May 2011, Transco provided additional information to the EPA pertaining to these compressor stations in response to a request they had made in February 2011. In August 2010, the EPA requested, and Transco provided, similar information for a compressor station in Maryland.
45
Table of Contents
Other
The additional information called for by this item is provided in Note 12 of the Notes to Consolidated Financial Statements included under Part I, Item 1. Financial Statements of this report, which information is incorporated by reference into this item.
46
Table of Contents
| Exhibit No. |
Description | |||
| Exhibit 3.1 | — | Restated Certificate of Incorporation (filed on May 26, 2010, as Exhibit 3.1 to the Company’s Current Report on Form 8-K) and incorporated herein by reference. | ||
| Exhibit 3.2 | — | Restated By-Laws (filed on May 26, 2010, as Exhibit 3.2 to the Company’s Current Report on Form 8-K) and incorporated herein by reference. | ||
| Exhibit 10.1 | — | Contribution Agreement, dated as of March 19, 2012, between Caiman Energy, LLC and Williams Partners L.P. (filed on April 26, 2012 as Exhibit 10.1 to Williams Partners, L.P.’s Form 10-Q (File No. 001-32599)) and incorporated herein by reference. | ||
| *Exhibit 12 | — | Computation of Ratio of Earnings to Fixed Charges. | ||
| *Exhibit 31.1 | — | Certification of Chief Executive Officer pursuant to Rules 13a-14(a) and 15d-14(a) promulgated under the Securities Exchange Act of 1934, as amended, and Item 601(b)(31) of Regulation S-K, as adopted pursuant to Section 302 of the Sarbanes-Oxley Act of 2002. | ||
| *Exhibit 31.2 | — | Certification of Chief Financial Officer pursuant to Rules 13a-14(a) and 15d-14(a) promulgated under the Securities Exchange Act of 1934, as amended, and Item 601(b)(31) of Regulation S-K, as adopted pursuant to Section 302 of the Sarbanes-Oxley Act of 2002. | ||
| **Exhibit 32 | — | Certification of Chief Executive Officer and Chief Financial Officer pursuant to 18 U.S.C. Section 1350, as adopted pursuant to Section 906 of the Sarbanes-Oxley Act of 2002. | ||
| *Exhibit 101.INS | — | XBRL Instance Document. | ||
| *Exhibit 101.SCH | — | XBRL Taxonomy Extension Schema. | ||
| *Exhibit 101.CAL | — | XBRL Taxonomy Extension Calculation Linkbase. | ||
| *Exhibit 101.DEF | — | XBRL Taxonomy Extension Definition Linkbase. | ||
| *Exhibit 101.LAB | — | XBRL Taxonomy Extension Label Linkbase. | ||
| *Exhibit 101.PRE | — | XBRL Taxonomy Extension Presentation Linkbase. | ||
| * | Filed herewith. |
| ** | Furnished herewith. |
47
Table of Contents
SIGNATURE
Pursuant to the requirements of the Securities Exchange Act of 1934, the registrant has duly caused this report to be signed on its behalf by the undersigned thereunto duly authorized.
THE WILLIAMS COMPANIES, INC.
(Registrant)
/s/ TED T. TIMMERMANS
Ted T. Timmermans
Vice President, Controller and Chief Accounting
Officer (Duly Authorized Officer and Principal
Accounting Officer)
May 1, 2012
Table of Contents
EXHIBIT INDEX
| Exhibit No. |
Description | |||||
| Exhibit 3.1 | — | Restated Certificate of Incorporation (filed on May 26, 2010, as Exhibit 3.1 to the Company’s Current Report on Form 8-K) and incorporated herein by reference. | ||||
| Exhibit 3.2 | — | Restated By-Laws (filed on May 26, 2010, as Exhibit 3.2 to the Company’s Current Report on Form 8-K) and incorporated herein by reference. | ||||
| Exhibit 10.1 | — | Contribution Agreement, dated as of March 19, 2012, between Caiman Energy, LLC and Williams Partners L.P. (filed on April 26, 2012 as Exhibit 10.1 to Williams Partners, L.P.’s Form 10-Q (File No. 001-32599)) and incorporated herein by reference. | ||||
| * Exhibit 12 | — | Computation of Ratio of Earnings to Fixed Charges. | ||||
| * Exhibit 31.1 | — | Certification of Chief Executive Officer pursuant to Rules 13a-14(a) and 15d-14(a) promulgated under the Securities Exchange Act of 1934, as amended, and Item 601(b)(31) of Regulation S-K, as adopted pursuant to Section 302 of the Sarbanes-Oxley Act of 2002. | ||||
| *Exhibit 31.2 | — | Certification of Chief Financial Officer pursuant to Rules 13a-14(a) and 15d-14(a) promulgated under the Securities Exchange Act of 1934, as amended, and Item 601(b)(31) of Regulation S-K, as adopted pursuant to Section 302 of the Sarbanes-Oxley Act of 2002. | ||||
| **Exhibit 32 | — | Certification of Chief Executive Officer and Chief Financial Officer pursuant to 18 U.S.C. Section 1350, as adopted pursuant to Section 906 of the Sarbanes-Oxley Act of 2002. | ||||
| *Exhibit 101.INS | — | XBRL Instance Document | ||||
| *Exhibit 101.SCH | — | XBRL Taxonomy Extension Schema | ||||
| *Exhibit 101.CAL | — | XBRL Taxonomy Extension Calculation Linkbase | ||||
| *Exhibit 101.DEF | — | XBRL Taxonomy Extension Definition Linkbase | ||||
| *Exhibit 101.LAB | — | XBRL Taxonomy Extension Label Linkbase | ||||
| *Exhibit 101.PRE | — | XBRL Taxonomy Extension Presentation Linkbase | ||||
| * | Filed herewith. |
| ** | Furnished herewith. |