Attached files
| file | filename |
|---|---|
| 8-K - 8-K - TFS Financial CORP | d342724d8k.htm |
 Investor Conference Call
May 3, 2012
Exhibit 99.1 |
 2
Forward-Looking Statements
This presentation contains forward-looking statements, which can be identified by the use of such
words as estimate, project, believe, intend, anticipate, plan, seek, expect and similar
expressions. These forward-looking statements include: Statements of our goals, intentions and expectations; Statements regarding our business plans and prospects and growth and operating strategies; Statements concerning trends in our provision for loan losses and charge-offs; Statements regarding the asset quality of our loan and investment portfolios; and Estimates of our risks and future costs and benefits. These forward-looking
statements are subject to significant risks, assumptions and uncertainties, including, among other things, the following
important factors that could affect the actual outcome of future events:
Significantly increased competition among depository and other financial institutions; Inflation and changes in the interest rate environment that reduce our interest margins or reduce the
fair value of financial instruments;
General economic conditions, either nationally or in our market areas, including employment prospects
and conditions that are worse than expected;
Decreased demand for our products and services and lower revenue and earnings because of a recession
or other events; Adverse changes and volatility in the securities and credit markets; Legislative or regulatory changes that adversely affect our business, including changes in regulatory
costs and capital requirements and changes related to our ability to pay dividends and the
ability of Third Federal Savings and Loan Association of Cleveland, MHC to waive dividends;
Our ability to enter new markets successfully and take advantage of growth opportunities, and the
positive short-term dilutive effect of potential acquisitions or de novo branches, if any; Changes in consumer spending, borrowing and savings habits; Changes in accounting policies and practices, as may be adopted by the bank regulatory agencies, the
Financial Accounting Standards Board and the Public Company Accounting Oversight Board; Future adverse developments concerning Fannie Mae or Freddie Mac; Changes in monetary and fiscal policy of the U.S. Government, including policies of the U.S. Treasury
and the Federal Reserve Board;
Changes in policy and/or assessment rates of taxing authorities that adversely affect us; The timing and the amount of revenue that we may recognize; Changes in expense trends (including, but not limited to, trends affecting non-performing assets,
charge offs and provisions for loan losses);
The impact of the continuing governmental effort to restructure the U.S. financial and regulatory
system; The extensive reforms enacted in the Dodd-Frank Act which will impact us; The adoption of implementing regulations by a number of different regulatory bodies under the
Dodd-Frank Act, and uncertainty in the exact nature, extent and timing of such
regulations and the impact they will have on us; The impact of coming under the jurisdiction of new federal regulators; Changes in our organization, or compensation and benefit plans; Inability of third-party providers to perform their obligations to us; Adverse changes and volatility in real estate markets; A slowing or failure of the moderate economic recovery; The strength or weakness of the real estate markets and of the consumer and commercial credit sectors
and its impact on the credit quality of our loans and other assets; and.
The ability of the U.S. Federal Government to manage federal debt limits. Because of these and
other uncertainties, our actual future results may be materially different from the results indicated by these forward-looking statements.
|
 3
Organized in 1997 as the mid-tier stock holding company for Third
Federal Savings & Loan Association of Cleveland (“Thrift”), which
was founded in 1938 by Ben and Gerome Stefanski
Completed first step IPO conversion in April 2007
TFSL (NASDAQ)
Financials at 3/31/12:
Total Assets:
$11.3B
Total Deposits:
$ 8.8B
Shareholders’
Equity:
$ 1.8B
Market Capitalization:
$ 2.9B
As of March 31, 2012, there were 308.9 million shares outstanding,
of which 73.5% were held by the Mutual Holding Company
Overview of TFS Financial Corporation |
 4
Strategic Overview
Our business model is to originate and service first mortgage loans and continue to
service
existing
home
equity
loans
and
lines,
which
we
fund
with
core
retail
deposits
Historically
a
fixed
rate
lender,
but
Smart
Rate
adjustable
rate
mortgage
product
has
been major part of originations since introduced to market in July 2010
ARM portion of production (58% current fiscal YTD; 55% fiscal 2011; 19% fiscal
2010) First mortgage loans and retail deposits have been generated
mainly in OH/FL footprint. New state expansion began in May 2011, offering
our Smart Rate adjustable rate mortgage
to
refinance
customers
through
our
Customer
Service
and
Internet
Channels
and
using
our
underwriting
standards
and
processing
requirements
of
our
traditional
markets.
Only non-commissioned Third Federal associates have been and continue to be
used to gather applications, underwrite and process the requests to generate
mortgage loans and home equity loans and lines
First
mortgage
originations
continue
to
be
made
using
stringent,
conservative
lending
standards. For first mortgages originated during the current fiscal year, the
average FICO score was 783, and the average LTV was 62%.
Being a low-cost provider is a critical strategic advantage
Historically, stock repurchases and dividends have supplemented shareholder
returns, but are currently suspended by regulatory action.
|
 5
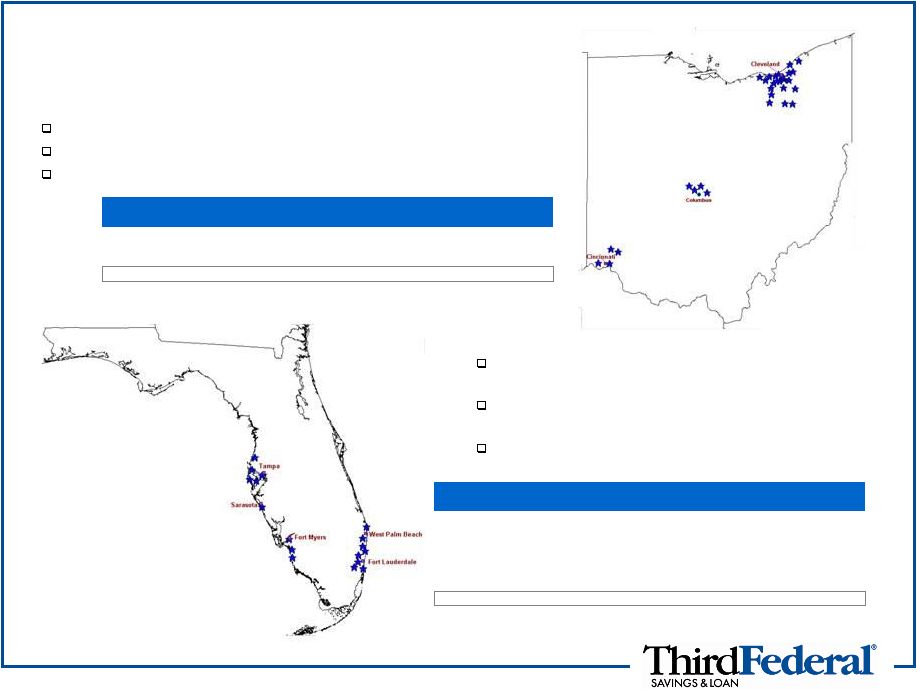
Ohio
22 full service branches in Northeast Ohio
4 loan production offices in the Columbus area (Central Ohio)
4 loan production offices in the Cincinnati area (Southwestern Ohio)
Markets of Operation
Florida
Organic, de novo expansion into Florida started in
2000
9 full service branches along the West Coast from
New Port Richey to Naples
8 full-service branches along the East Coast from
Palm Gardens to Hallandale
Source: SNL Financial for market data as of June 30, 2011
Deposits from Company data as of March 31, 2012
Deposits
Market
Market
MSA
Branches
($M)
Share (%)
Rank
Tampa-St.Petersburg-Clearwater, FL
5
1,159
1.86
8
Miami-Fort Lauderdale, FL
8
1,057
0.66
26
Cape Coral-Fort Myers, FL
2
275
2.14
14
Sarasota-Bradenton-Venice, FL
1
271
1.53
12
Naples-Marco Island, FL
1
128
1.18
17
Florida Totals
17
2,890
0.66
22
Deposits
Market
Market
MSA
Branches
($M)
Share (%)
Rank
Cleveland-Elyria-Mentor, OH
19
5,416
11.23
3
Akron, OH
3
517
4.21
8
Ohio Totals
22
5,933
2.64
9 |
 6
Financial Highlights
(Dollars in Thousands)
At, or for the year ended,
9/30/11
9/30/10
9/30/09
3/31/12
12/31/11
3/31/11
Balance Sheet
Assets ($)
10,892,948
11,076,027
10,598,840
11,286,768
11,058,126
10,885,060
Net Loans ($)
9,750,943
9,181,749
9,219,585
10,117,558
10,012,862
9,743,582
Deposits ($)
8,715,910
8,851,941
8,570,506
8,823,176
8,658,513
8,755,942
Common Equity ($)
1,773,924
1,752,897
1,745,865
1,799,803
1,795,960
1,752,982
Balance Sheet Ratios
Loans/ Deposits (%)
111.9
103.7
107.6
114.7
115.6
111.3
TCE / TA (%)
16.2
15.8
16.4
15.9
16.2
16.0
Thrift Only Ratios:
Core Capital Ratio (%)
13.9
12.1
12.5
13.5
13.8
13.7
Tier 1 Risk Based Ratio (%)
21.0
18.0
17.3
21.0
21.0
20.3
Total Risk Based Capital Ratio (%)
22.3
19.2
18.2
22.2
22.2
21.6
Profitability
Net Interest income ($)
247,648
227,506
230,075
65,785
64,255
60,901
Provision for loan losses ($)
(98,500)
(106,000)
(115,000)
(27,000)
(15,000)
(22,500)
Net Interest income after prov for loan losses ($)
149,148
121,506
115,075
38,785
49,255
38,401
Non-interest income ($)
30,982
58,638
67,384
6,411
5,709
8,267
Non-interest expense ($)
(168,055)
(161,933)
(162,388)
(43,320)
(42,479)
(43,975)
Income loss before income taxes ($)
12,075
18,211
20,071
1,876
12,485
2,693
Income tax benefit (expense) ($)
(2,735)
(6,873)
(5,676)
(854)
(4,026)
(469)
Net income loss ($)
9,340
11,338
14,395
1,022
8,459
2,224
Net interest margin (%)
2.32
2.16
2.20
2.42
2.40
2.29
Non-interest expense to average assets (%)
1.54
1.50
1.51
1.55
1.55
1.61
Asset Quality
NPAs/ Assets (%)
2.3
2.7
2.6
1.8
1.7
2.5
NCOs/ Avg Loans (%)
0.8
0.7
0.7
0.9
3.0
0.8
Reserves/ Loans (%)
1.6
1.4
1.0
1.0
1.0
1.5
Texas Ratio (NPAs & TDRs / TCE & LLR) (%)
19.6
20.9
17.4
16.9
16.5
20.5
At, or for the three months ended, |
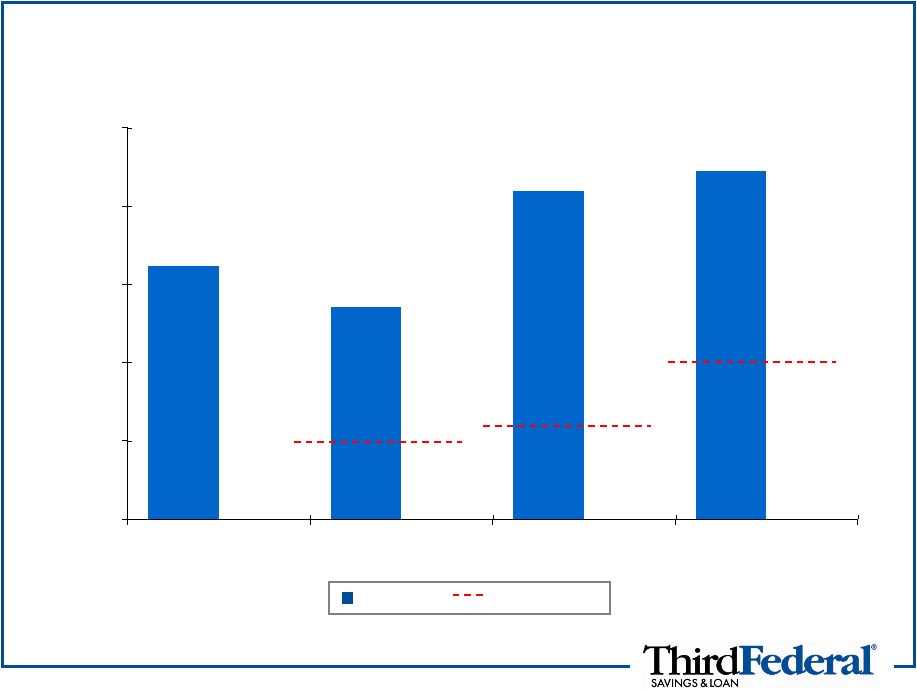 13.54%
21.33%
22.58%
15.87%
0.00%
5.00%
10.00%
15.00%
20.00%
25.00%
Tangible Common
Equity Ratio (TFSL)
Core Capital Ratio
(Thrift)
Tier 1 Risk-based Ratio
(Thrift)
Total Risk-Based
Capital Ratio (Thrift)
7
Capital Position as of March 31, 2012
Well Capitalized
6.00%
10.00%
5.00%
TFSL/Thrift |
 8
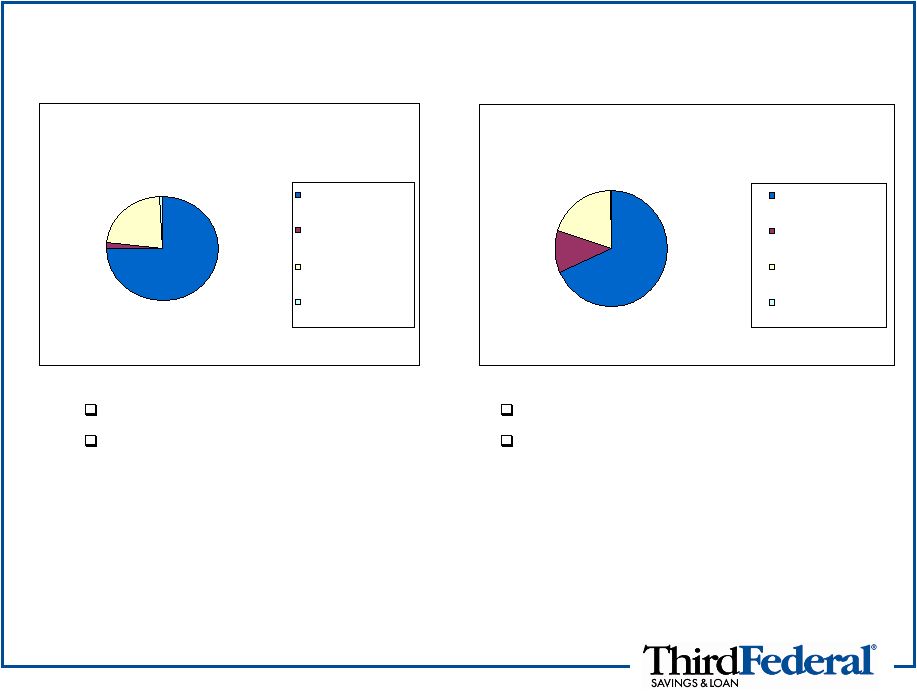
Loan and Deposit Balances
*About
Home
Today:
An
affordable
housing
program
targeted
toward
low
and
moderate
income
home
buyers
that
is
designed
to
teach the essential skills needed for successful homeownership. Most loans supported by private
mortgage insurance. Cumulative loan originations under this program have been less than
$20 million over the last three years. 79% of first mortgages in Ohio
Also service $4.6 billion in loans for
others
No brokered deposits
Average branch has $226 million in deposits
Gross Loan Balances 3/31/2012
2%
1%
23%
75%
Residential non-Home
Today
Residential Home
Today
Equity loans and lines of
credit
Other
Deposit Data 3/31/2012
0%
68%
12%
20%
Certificates of Deposit
Negotiable Order of
Withdrawal
Savings
Accrued Interest |
 9
Adjustable Rate Loan Production
Smart Rate adjustable product began July 2010
In the six months ended 3/31/12, total loan production of $1.34 billion was
58% ARM and 42% fixed
Average credit score of quarter ended 3/31/12 ARM production was
782,
with average LTV of 60%
% Fixed vs. % Adjustable First Mortgage Loan Production
0
10
20
30
40
50
60
70
80
90
100
110
FY 2009
FY 2010
FY 2011
6 mo. ended
3/31/12
Variable
Fixed |
 10
Adjustable Rate Growth
As of 3/31/12, 45% of all real estate loans, including equity loan products,
are adjustable rate
Total ARMs of $2.4 billion represents 31% of all first mortgages
at 3/31/12,
compared to 14% of all first mortgages as of 9/30/10
In May 2011, we began expansion of our Smart Rate adjustable rate
mortgage into 10 new states
PA, NJ, IL, NC, VA, CT, TN, CO, OR and WA
New state expansion represents $106 million in closed loans as of 3/31/12
0
5
10
15
20
25
30
35
Adjustable Mortgages as a Percentage of Total
First Mortgage Portfolio |
 11
Loan Delinquencies and Charge-offs
3/31/12 loan balances include $246 million of loans held for sale
Charge-offs for quarter ended 12/31/11 impacted by charge-off of SVA,
which had a balance of $55.5 million at 9/30/11
Dollars in millions
Loan
Balances
3/31/12
3/31/12
9/30/11
9/30/10
3/31/12
12/31/11
9/30/11
9/30/10
Residential non-Home Today
Ohio
$6,063
1.1%
1.4%
1.9%
$4
$9
$9
$5
Florida
$1,327
3.4%
5.1%
5.2%
4
18
9
7
Other
264
0.3%
0.7%
1.5%
-
-
-
-
Total
$7,654
1.5%
2.1%
2.5%
$8
$27
$18
$12
Residential Home Today
Ohio
$221
20.3%
30.0%
34.8%
$6
$23
$7
$5
Florida
10
16.6%
32.1%
32.1%
-
1
-
-
Total
$231
20.1%
30.1%
34.6%
$6
$24
$7
$5
Home Equity Loans and Lines of Credit
Ohio
$902
1.2%
1.6%
2.0%
$1
$5
$10
$7
Florida
669
1.9%
3.3%
4.1%
3
14
29
33
California
279
1.0%
1.4%
1.5%
1
1
5
4
Other
466
1.3%
2.1%
2.4%
4
3
5
5
Total
$2,316
1.4%
2.2%
2.6%
$9
$23
$49
$49
Other
$62
0.7%
4.3%
4.2%
$0
$1
$1
$2
Overall Total
$10,263
1.9%
2.9%
3.5%
$23
$75
$75
$68
Quarter-end
Net Charge Offs
Delinquencies at:
FYE |
 12
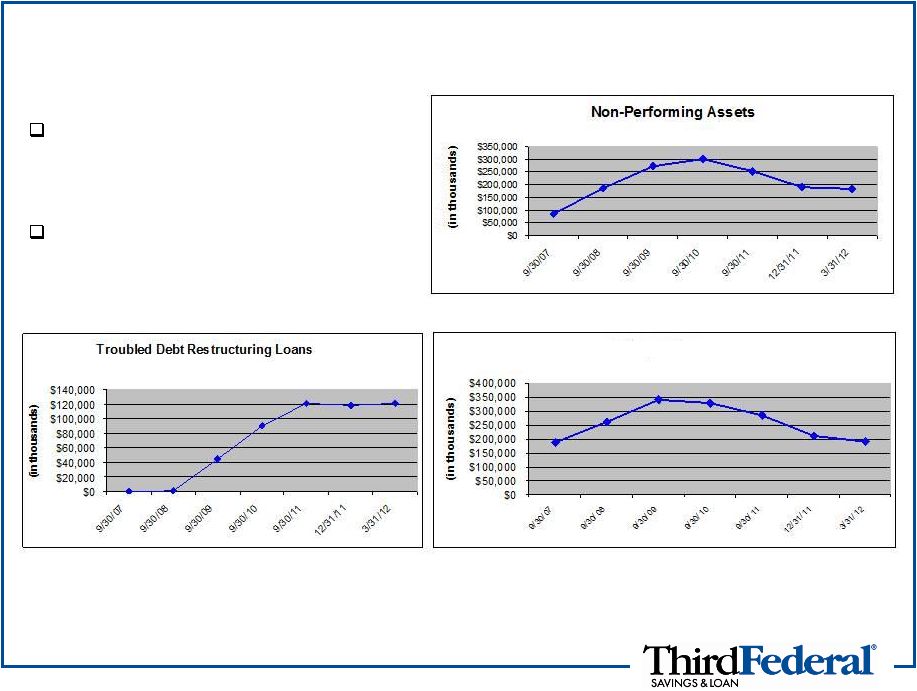
Loan Portfolio Trends
Non-performing assets and
delinquencies are trending
downward
Troubled debt restructuring
loans have leveled off
Delinquencies |
 13
Regulatory Status
Company believes it has met all the key provisions of the February 7,
2011 MOU received from the OTS, subject to OCC/Fed regulatory
exam validation. We are awaiting results from the validation process
but
would
not
anticipate
final
actions
until
early
in
the
fourth
fiscal
quarter.
Interagency guidance suggests that performing junior liens that are
subordinate to non-accrual first liens should be considered non-accrual.
$14.5 million of performing ELOCs at March 31, 2012, were reclassified
as non-accrual. Minimal income statement or allowance impact, but the
non-performing assets increased accordingly.
Regulatory bodies: OCC (for thrift); Federal Reserve (holding
company); CFPB; FDIC
Dividends and stock buyback program still subject to regulatory 45-day
non-objection
No direction on proposed Fed rules for MHC dividend waivers
|
 14
Investor Conference Call
May 3, 2012
Investor Questions |