Attached files
| file | filename |
|---|---|
| 8-K - FORM 8-K - SunCoke Energy, Inc. | d343387d8k.htm |
| EX-99.1 - PRESS RELEASE - SunCoke Energy, Inc. | d343387dex991.htm |
 Q1 2012
Earnings Conference Call May 1, 2012
Exhibit 99.2 |
 Safe Harbor
Statement This slide presentation should be reviewed in conjunction with SunCoke’s
First Quarter 2012 earnings release and conference call held on May 1, 2012 at 10:00
a.m. ET. Some of the information included in this presentation contains
“forward-looking statements” (as defined in Section 27A of the
Securities Act of 1933, as amended and Section 21E of the Securities Exchange Act of 1934, as
amended). Such forward-looking statements are based on management’s beliefs
and assumptions and on information currently available. Forward-looking statements
include the information concerning SunCoke’s possible or assumed future results of operations, business strategies,
financing plans, competitive position, potential growth opportunities, potential operating
performance improvements, effects resulting from our separation from Sunoco, the
effects of competition and the effects of future legislation or regulations. Forward-
looking statements include all statements that are not historical facts and may be identified
by the use of forward-looking terminology such as the words
“believe,” “expect,”
“plan,”
“intend,”
“anticipate,”
“estimate,”
“predict,”
“potential,”
“continue,”
“may,”
“will,”
“should”
or the negative of these terms or similar expressions. Forward-looking statements involve
risks, uncertainties and assumptions. Actual results may differ materially from those
expressed in these forward-looking statements. You should not put undue reliance on
any forward-looking statements. In accordance with the safe harbor provisions of the
Private Securities Litigation Reform Act of 1995, SunCoke has included in its filings
with the Securities and Exchange Commission cautionary language identifying important factors (but not necessarily all the
important factors) that could cause actual results to differ materially from those expressed
in any forward-looking statement made by SunCoke. For more information concerning
these factors, see SunCoke's Securities and Exchange Commission filings. All
forward-looking statements included in this presentation are expressly qualified in their
entirety by such cautionary statements. SunCoke undertakes no obligation to update
publicly any forward-looking statement (or its associated cautionary language)
whether as a result of new information or future events or otherwise.
This presentation includes certain non-GAAP financial measures intended to supplement, not
substitute for, comparable GAAP measures. Reconciliations of non-GAAP financial
measures to GAAP financial measures are provided in the Appendix at the end of the
presentation. Investors are urged to consider carefully the comparable GAAP measures and the reconciliations to those
measures provided in the Appendix, or on our website at www.suncoke.com.
First Quarter 2012 Earnings Conference Call
1 |
 Q1 2012 Earnings
Overview Q1 2012 results driven by strong Coke
business performance
•
Successful Middletown startup
•
Improvement at Indiana Harbor
•
Yield/cost improvement at other
facilities
Coal remains a challenge
•
Higher than expected cash costs
•
Difficult demand/price environment
•
Taking further action to reduce costs
Solid quarter-end liquidity position
•
Expect positive free cash flow for
balance of year
Reaffirming expected 2012 Adjusted
EBITDA of $250 million to $280 million
First Quarter 2012 Earnings Conference Call
2
(1)
For a definition of Adjusted EBITDA and reconciliation of Adjusted
EBITDA, please see the appendix.
$0.17
$0.24
Q1 '11
Q1 '12
Earnings Per Share
(diluted)
$26.6
$55.8
Q1 '11
Q1 '12
Adjusted EBITDA
(1)
(in millions) |
 Q1 2012 Financial
Results First Quarter 2012 Earnings Conference Call
3
Revenue up 44%
•
•
•
Adjusted EBITDA more than doubled
•
•
•
Earnings Per Share increased to $0.24
•
($ in millions)
Q1'12
Q1'11
Revenue
$481.3
$333.4
$147.9
Operating Income
$33.9
$4.3
$29.6
Net Income Attributable to
Shareholders
$16.9
$11.9
$5.0
Earnings Per Share
$0.24
$0.17
$0.07
Coke Adjusted EBITDA
(1)
$55.2
$20.5
$34.7
Coal Adjusted EBITDA
(2)
$7.4
$12.3
($4.9)
Corporate/Other
($6.8)
($6.2)
($0.6)
Adjusted EBITDA
(3)
$55.8
$26.6
$29.2
Domestic Coke Sales Volumes
1,078
872
206
Coal Sales Volumes
373
386
(13)
Change
Domestic coke production up 206
thousand tons
Middletown produced 142 thousand
tons; added $68.5 million to revenue
Higher average coal prices favorable
to Coke and Coal revenues
•
Middletown contributed $11.5 million
Meaningful improvement at Indiana
Harbor
Higher yields and operating cost
recovery throughout coke business
Offset by higher coal mining costs
Reflects operating income gains and
costs of standalone capital structure
(1) Coke Adjusted EBITDA includes Adjusted EBITDA from Jewell Coke, Other Domestic Coke and
International segments.
(2) Coal Adjusted EBITDA includes Adjusted EBITDA from Coal Mining segment. In Q1 ’12,
internal coal transfer price mechanism changed to reflect Jewell Coke contract price;
prior year periods adjusted to reflect this change.
(3) For a definition of Adjusted EBITDA and reconciliation of Adjusted EBITDA, please see the
appendix. |
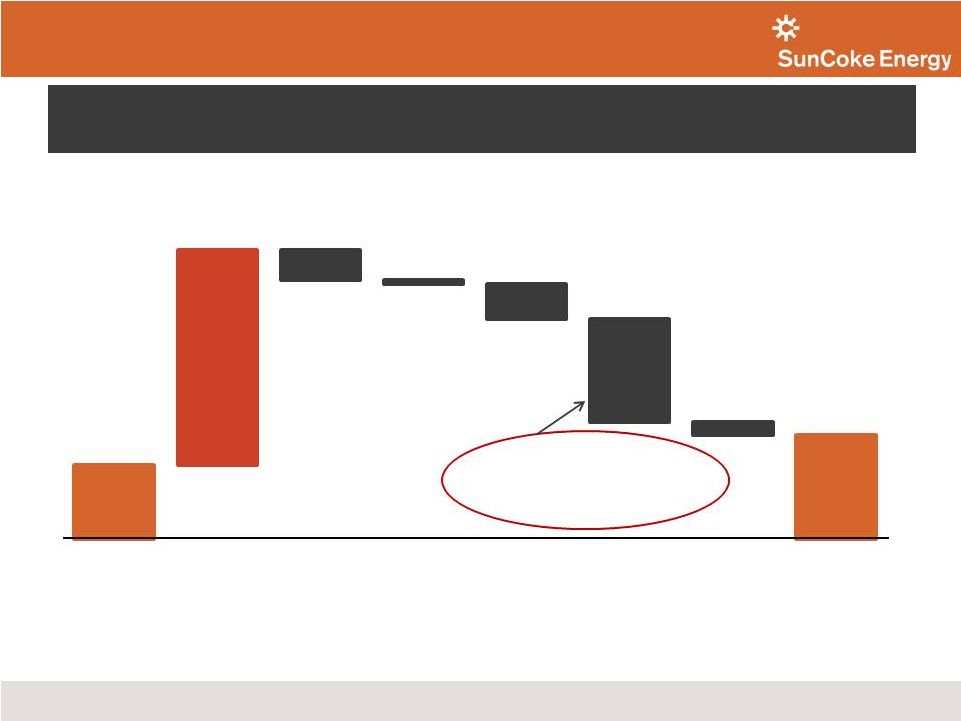
 Adjusted
EBITDA (1)
Bridge –
Q1 2011 to Q1 2012
4
Quarter’s performance led by strong Coke business results
First Quarter 2012 Earnings Conference Call
($ in millions)
$26.6
$55.8
$11.5
$4.4
$8.5
$10.3
($4.9)
($0.6)
Q1 2011
Adjusted
EBITDA (1)
Middletown
Indiana
Harbor
(excluding-non-
recurring items)
Indiana
Harbor
non-recurring
items (2)
Coke Business
(Jewel/Haverhill/
Granite City/Int'l)
Coal Mining
Corporate
Costs
Q1 2012
Adjusted
EBITDA (1)
Total improvement of
$12.9 million
(1)
For a definition of Adjusted EBITDA and reconciliation of Adjusted EBITDA, please see the
appendix. (2)
Non-recurring items that impacted Indiana Harbor performance included a $2.4 million, net
of noncontrolling interests (“NCI”), charge related to a coke inventory
reduction and a $1.3 million, net of NCI, lower cost or market adjustment on pad coal
inventory in Q1 2012 and $12.2 million, net of NCI, in coke cover costs in Q1 2011. |
 First Quarter 2012 Earnings Conference Call
5
EPS
Bridge
–
Q1
2011
to
Q1
2012
EPS growth reflects strength of cokemaking business
offset by financing costs for standalone capital structure
(1)
For a definition of Adjusted EBITDA and reconciliation of Adjusted EBITDA, please see the
appendix. $0.17
$0.24
$0.50
($0.07)
($0.01)
($0.08)
($0.24)
($0.03)
Q1 2011 EPS
(Diluted)
Adjusted
EBITDA
Coke
Adjusted
EBITDA
Coal Mining
Adjusted
EBITDA
Corporate Costs
Depreciation,
Depletion
& Amortization
Financing Costs
Taxes
Q1 2012 EPS
(Diluted)
Reflects:
Q1 2012 interest expense: $12.1m
Q1 2011 income from affiliate, net: $4.2m |
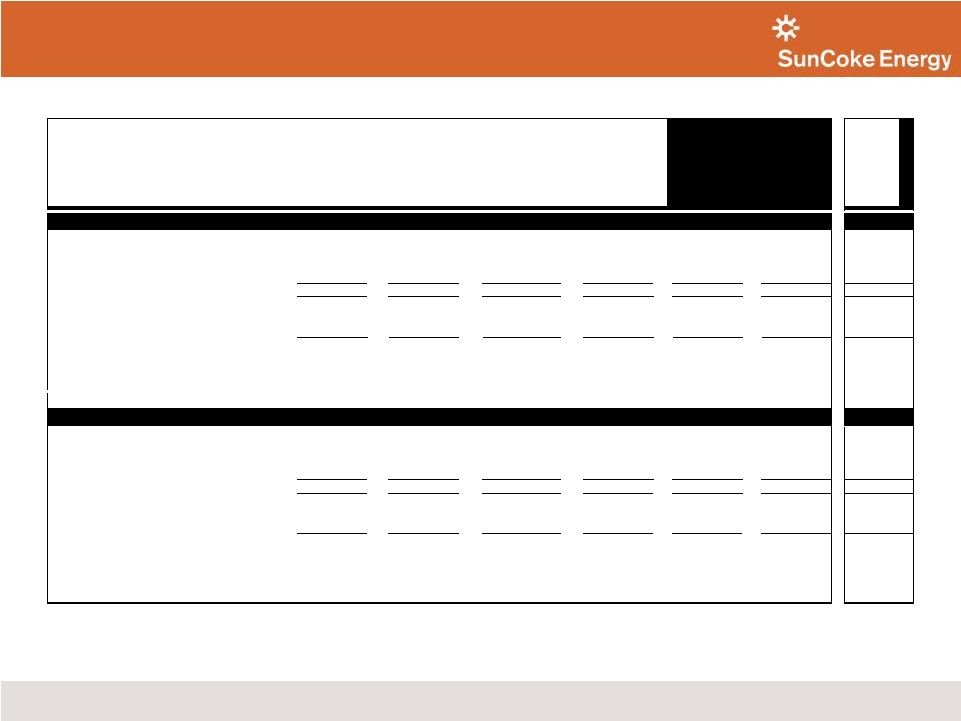
 Domestic Coke
Business Summary (Jewell Coke & Other Domestic Coke)
Domestic
Coke
Production
Domestic Coke Adjusted EBITDA
(1)
Per Ton
(Tons in thousands)
($ in millions, except per ton amounts)
Other
Domestic
Coke:
687
Other
Domestic
Coke:
786
Other
Domestic
Coke:
838
First Quarter 2012 Earnings Conference Call
Other
Domestic
Coke:
745
•
Quarter benefited from Indiana Harbor improvements
and strong Middletown Adjusted EBITDA per ton
profile
Other
Domestic
Coke:
894
6
For a definition of EBITDA and Adjusted EBITDA/Ton and reconciliations, please see the
appendix. Includes Indiana Harbor contract billing adjustment of $6.0 million, net of NCI, and inventory
adjustment of $6.2 million, net of NCI, of which $3.1 million is attributable to
Q3 2011. Includes a $2.4 million, net of NCI, charge related to coke inventory reduction and a $1.3
million, net of NCI, lower cost or market adjustment on pad coal inventory
and lower coal-to-coke yields related to the startup at Middletown. (1)
(2)
(3)
•
Middletown primary driver of increased coke production
in Q1 ‘12 |
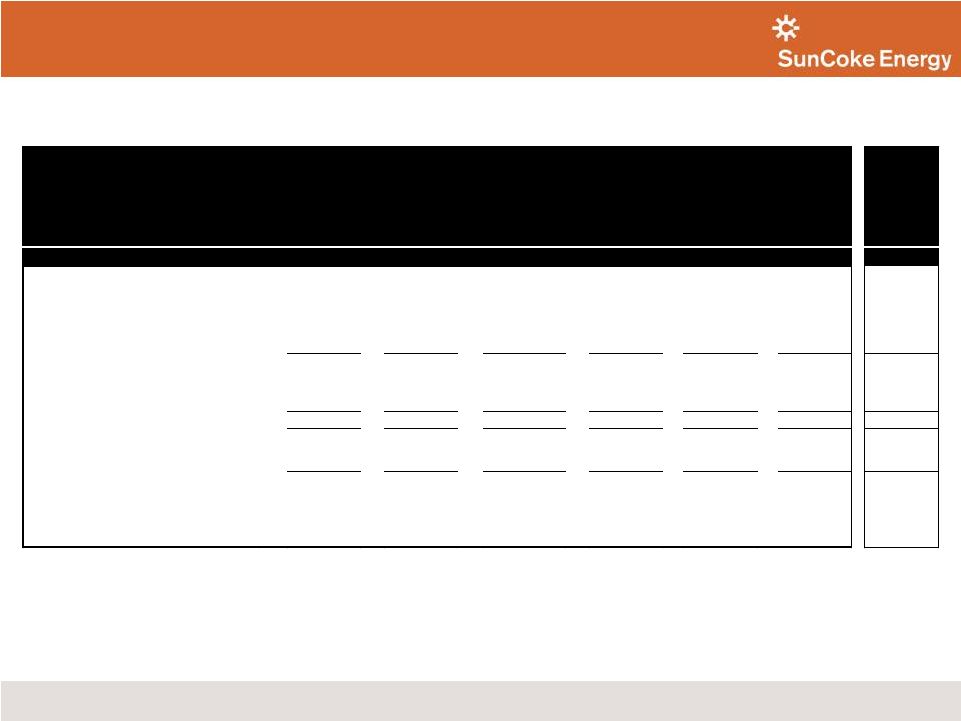
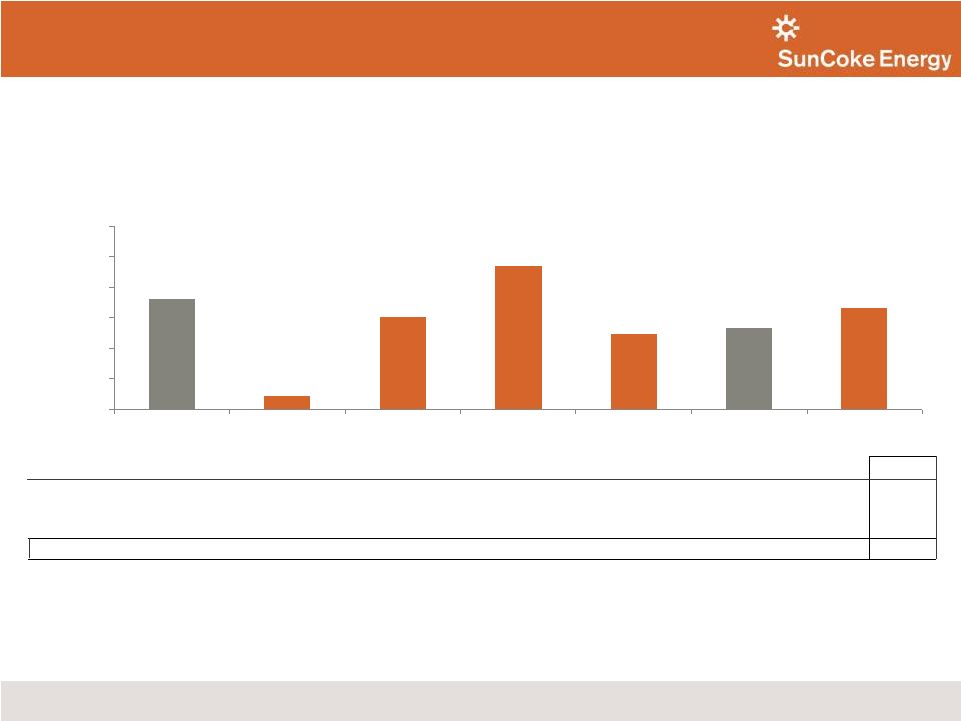 2%
15%
23%
12%
17%
18%
13%
0.0%
5.0%
10.0%
15.0%
20.0%
25.0%
30.0%
2010
Q1 2011
Q2 2011
Q3 2011
Q4 2011
2011
Q1 2012
Pretax ROIC
(1)(2)
for Domestic Coke
excluding Middletown prior to 2012
First Quarter 2012 Earnings Conference Call
Pretax Return on Invested Capital (ROIC)
7
(3)
(3)
(4)
Pretax ROIC, ex-Middletown prior 2012
(1)(2)
2010
Q1 2011
Q2 2011
Q3 2011
Q4 2011
2011
Q1 2012
Total Domestic Coke (Includes Jewell Coke and Other Domestic Coke)
18%
2%
15%
23%
12%
13%
17%
International Coke
35%
10%
7%
20%
120%
36%
0%
Coal Mining
32%
46%
28%
21%
(5%)
23%
11%
Total SunCoke (Including Corp./Other)
18%
4%
11%
16%
8%
10%
13%
1)
For a definition of Pretax ROIC and reconciliations, please see the appendix.
2)
Pretax ROIC is calculated as Adjusted Pretax Operating Income divided by average invested
capital (stockholders’ equity plus total debt net of cash and cash equivalents); for a
reconciliation of Adjusted Pretax Operating Income to Adjusted EBITDA, please see appendix.
3)
Includes Indiana Harbor contract billing adjustment of $6.0 million, net of NCI, and inventory
adjustment of $6.2 million, net of NCI, of which $3.1 million is attributable to Q3
2011.
4)
Includes a $2.4 million, net of NCI, charge related to a coke inventory reduction and a $1.3
million, net of NCI, and $4.0 million of non-recurring costs and lower coal-to-coke
yields related to the startup at Middletown.
Note: This table excludes Middletown assets up to and including Q4 2011. At the end of
Q4 2011, identifiable assets included in Other Domestic Coke attributable to Middletown
were $402.8m (prior to Q4 2011, Middletown was included in the Corporate and Other segment);
see historical segment detail in public filings for additional detail |
 Domestic Coke
Business – Adjusted EBITDA
(1)
Outlook
First Quarter 2012 Earnings Conference Call
8
($ in millions, except as noted)
Estimated
Low
Estimated
High
Domestic Coke Adjusted EBITDA
(1)
Per Ton
$55
$60
Annual Domestic Coke Sales Volumes (in millions of tons)
x 4.3
x 4.4
Domestic Coke Adjusted EBITDA
(1)
$237
$264
Less: Ongoing Capital Expenditures
($35)
($35)
Annual Domestic Coke Adjusted EBITDA
(1)
less Ongoing
Capital Expenditures
$202
$229
Illustrative Liquidity Ratios for Domestic Coke Business
Estimated
Estimated
Net Debt
(2)
to Adjusted EBITDA
(1)
2.6x
2.3x
Interest Coverage
(3)
5.4x
6.0x
All figures are estimates based on current expectations for domestic coke business
(Jewell Coke and Other Domestic Coke segments); for example purposes only
•
With Middletown at its target run rate, expect domestic coke Adjusted EBITDA
(1)
per
ton to be $55 -
$60
•
Expect annual domestic coke Adjusted EBITDA
(1)
less ongoing capital expenditures in
excess of $200 million
(1) For a definition of
Adjusted EBITDA and reconciliation of Adjusted EBITDA, please see the appendix.
(2)
Net Debt represents Total Debt less cash balance at end of period. Net Debt provides a
perspective on the Company's overall debt position. Net Debt was calculated by subtracting our
3/31/2012 cash balance of $113.6 million from our Total Debt of $725.7 million on
3/31/2012.
(3) Interest coverage is
Adjusted EBITDA divided by expected 2012 interest expense of $44 million, net of amortization of issuance, discount and other fees.
|
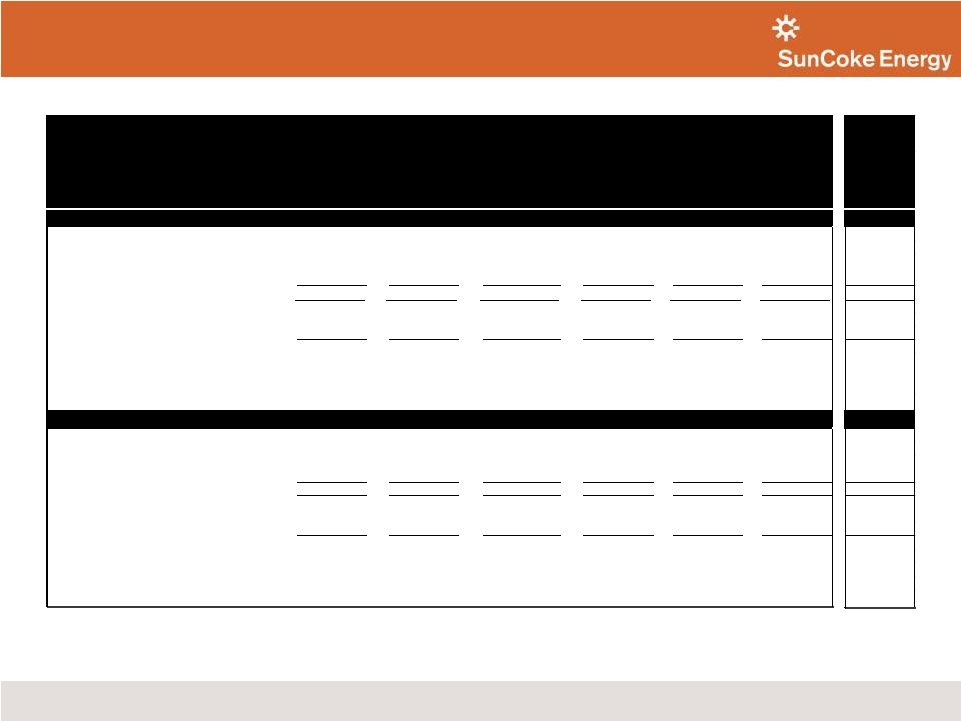
 Coal Mining
Financial Summary Coal
Mining
Adjusted
EBITDA
(1)
and
Avg.
Sales
Price/Ton
(2)
($ in millions, except per ton amounts)
First Quarter 2012 Earnings Conference Call
(1)
For a definition of Adjusted EBITDA and a reconciliation of Adjusted EBITDA, please see the
appendix. (2)
Average Sales Price is the weighted average sales price for all coal sales volumes, including
sales to affiliates and sales to Jewell Coke. (3)
9
Coal Sales, Production and Purchases
$12
$11
$9
$2
$7
$152
$162
$155
$159
$171
$32
$34
$25
$20
$20
$114
$126
$132
$138
$151
-$50
$0
$50
$100
$150
$200
Q1 '11
Q2 '11
Q3 '11
Q4 '11(3)
Q1 '12
Coal Adjusted EBITDA
Average Sales Price
Coal Adj EBITDA / ton
Coal Cash Cost / ton
Q1 '11
Q2 '11
Q3 '11
Q4 '11
Q1 '12
Coal Sales
386
334
371
363
373
Coal Production
335
340
340
349
375
Purchased Coal
51
24
22
20
19
Q1 2012 Adjusted EBITDA declined
YoY to $7.4 million
Higher costs and lower sales volumes more
than offset higher prices
Cash Costs continued to rise
Jewell Cash Cost per ton increased to $161
per ton
Reject rates increased to 68% due to
geology and preparation plant inefficiency
Higher labor costs due to additional
headcount, not offset by increase in clean
coal production
Higher royalties based on higher coal sales
prices
Experienced permitting delays at
Revelation
Full year coal outlook reduced based on
Q1 2012 performance
Q4 2011 Adjusted EBITDA inclusive of Black Lung Liability charge of $3.4 million and
OPEB expense allocation of $1.8 million. |
 10
Coal Mining Action Plan
Focusing on our most productive mines to reduce costs
Reducing 2012 coal mining production estimate from 1.8
million to 1.6 million tons
Reducing capital spending in line with reduced coal outlook
First Quarter 2012 Earnings Conference Call
Taking action intended to make
coal mining business cash neutral in 2012
•
Idling high cost/low quality mines and deferring further expansion
Consolidating staff and equipment to more productive mines; reducing overtime and
number of contractors
•
Cutting Hi-Vol. and thermal coal production at HKCC •
Experienced permitting delays at Revelation
Cutting expected 2012 capital expenditures from $60 million to approximately
$40 million
Focusing on replacing aged mining equipment, increasing preparation plant
efficiency and building new load out facility
|
 Q1 2012 Sources
& Uses of Cash First Quarter 2012 Earnings Conference Call
11
Maintained solid liquidity position during quarter;
revolver capacity remained at approximately $150 million
($ in millions)
$127.5
$16.6
$18.4
$1.7
$113.6
($39.8)
($9.5)
($1.3)
Q4 2011
Cash
Balance
Q1 2012
Net Income
Depreciation,
Depletion &
Amortization
Other, net
Changes in
Working
Capital
Capital
Expenditures
Cash Provided
by (Used in)
Financing
Activities
Q1 2012
Cash
Balance
Primarily reflects:
Inventories: $18.9m
Accounts payable: ($39.9m)
Interest payable: ($8.1m) |
 12
Updated 2012 Outlook
First Quarter 2012 Earnings Conference Call
Middletown startup gives
confidence in outlook
2012 Coke production now
expected to be in excess of
4.3 million tons
Expect average Adjusted
EBITDA per ton to be $55 -
$60 for balance of the year
New plant permitting efforts
continue
Focused on permitting for
an anticipated 660,000 ton
capacity plant with 120
ovens
Not pursuing investment
opportunity with Global
Coke
Remain committed to India
entry strategy
Discussing opportunities
with other merchant coke
producers in India
Targeting potential
transaction by early 2013
Focus on mining mid-vol. coal
and meeting contracted
volumes
Production target reduced to
an expected 1.6 million tons
Anticipating cash flow neutral
impact in 2012
Idling mines; redeploying
employees and reducing
contractors
Reducing expected capital
spending to $40 million
Focusing investments on
mining equipment
replacement, preparation
plant efficiency and building
new load out facility
Expect to have permits in
first half of 2013; will then
seek customer
commitments
Domestic Coke
International Coke
Coal Mining |
 13
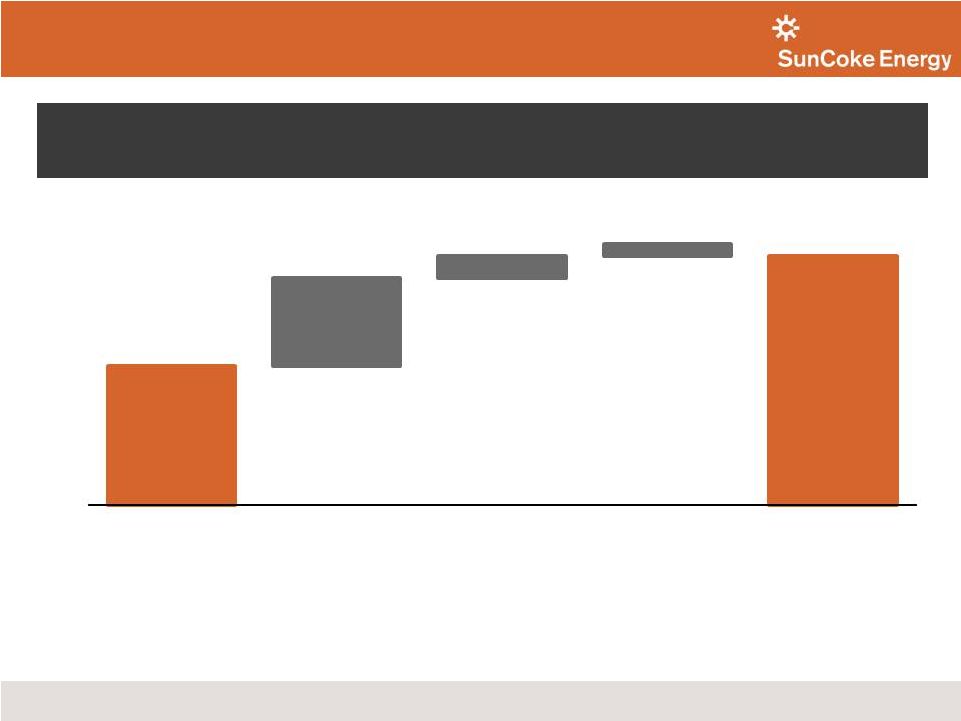
2012 Adjusted EBITDA
(1)
Outlook
Reaffirming full year 2012 Adjusted EBITDA guidance,
driven by expected strong U.S. coke performance
($ in millions)
(1)
For a definition of Adjusted EBITDA, please see the appendix.
First Quarter 2012 Earnings Conference Call
$141
$250 -
$280
$95 -
$110
$5 -
$15
2011
Adjusted
EBITDA
Coke Business
Coal Mining
Corporate
Costs
2012 Adjusted
EBITDA
$9
-
$14 |
 Updated 2012
Guidance Metric
Expected 2012 Outlook
Adjusted EBITDA
(1)
$250 million –
$280 million
EPS* (at 22% tax rate)
$1.30 –
$1.65
Capital Expenditures &
Investments
Approximately $100 million
Free Cash Flow
(2)
$75 million +
Cash Tax Rate
10% –
15%
Effective Tax Rate
20% –
24%
Corporate Costs
$30 million –
$35 million
Coke Production
In excess of 4.3 million tons
Coal Production
Approximately 1.6 million tons
(1) For a definition of Adjusted EBITDA and reconciliation, please see the appendix
(2) For a definition of Free Cash Flow and reconciliation, please see the appendix
First Quarter 2012 Earnings Conference Call
14
*Diluted |
 MLP Evaluation
Update We believe domestic coke assets could qualify for an MLP
•
Coal business not under consideration
Engaged key advisors to assist in MLP evaluation
Analysis underway to assess structuring alternatives
Plan to provide update on Q2 earnings call
First Quarter 2012 Earnings Conference Call
15 |
 Questions |
 Appendix
|
 Definitions
First Quarter 2012 Earnings Conference Call
18
Adjusted
EBITDA
Adjusted
EBITDA/Ton
Free Cash Flow
Pretax
Return
on
Invested
Capital
(ROIC)
•
represents earnings before interest, taxes, depreciation, depletion and amortization (“EBITDA”) adjusted for
sales discounts and the deduction of income attributable to non-controlling interests in our
Indiana Harbor cokemaking operations. EBITDA reflects sales discounts included as a
reduction in sales and other operating revenue. The sales discounts represent the sharing with
our customers of a portion of nonconventional fuels tax credits, which reduce our income tax expense. However, we
believe that our Adjusted EBITDA would be inappropriately penalized if these discounts were treated as
a reduction of EBITDA since they represent sharing of a tax benefit which is not included in
EBITDA. Accordingly, in computing Adjusted EBITDA, we have added back these sales discounts.
Our Adjusted EBITDA also reflects the deduction of income attributable to noncontrolling
interest in our Indiana Harbor cokemaking operations. EBITDA and Adjusted EBITDA do not
represent and should not be considered alternatives to net income or operating income under
United States generally accepted accounting principles (GAAP) and may not be comparable to
other similarly titled measures of other businesses. Management believes Adjusted EBITDA is an
important measure of the operating performance of the Company’s assets and is indicative of the
Company’s ability to generate cash from operations. •
represents Adjusted EBITDA divided by tons sold. •
equals cash from operations less cash used in investing activities less cash distributions to non-controlling
interests. Management believes Free Cash Flow information enhances an investor’s
understanding of a business’ ability to generate cash. Free Cash Flow does not
represent and should not be considered an alternative to net income or cash flows from
operating activities as determined under GAAP and may not be comparable to other similarly titled
measures of other businesses.
•
is defined as Adjusted EBITDA less depreciation expense plus net income
attributable to non-controlling interests divided by average invested capital (stockholders’
equity plus total debt net of cash and cash equivalents). We use Pretax ROIC as one
measure of how effectively we deploy capital and make multi-year investment
decisions. It is also used as a long-term performance measure under certain of our incentive
compensation plans. Pretax ROIC is not a measure of financial performance under generally
accepted accounting principles, and may not be comparable to other similarly titled measures
used by other companies. Pretax ROIC should not be considered in isolation or as an alternative to net
earnings as an indicator of performance. We define segment level Pretax ROIC as Adjusted EBITDA
less depreciation expense plus net income attributable to non-controlling interests divided
by average allocated invested capital. Average allocated invested capital for
each respective segment is calculated pro-rata based on the segment level identifiable assets for the period as
disclosed in our public filings.
|
 19
Reconciliations
First Quarter 2012 Earnings Conference Call
$ in millions
Q1 2012
FY 2011
Q4 2011
Q3 2011
Q2 2011
Q1 2011
FY 2010
Adjusted Pro Forma Operating Income
151.5
Add: Pro Forma impact of ArcelorMittal settlement
51.0
Subtract: Legal and settlement charges related to ArcelorMittal Settlement
and Indiana Harbor Arbitration
(16.3)
Adjusted Operating Income
37.1
80.4
14.9
33.5
24.6
7.4
186.2
Net Income (Loss) attributable to Noncontrolling Interest
(0.3)
(1.7)
(0.5)
3.4
1.6
(6.2)
7.1
Subtract: Depreciation Expense
(18.4)
(58.4)
(16.0)
(14.7)
(14.7)
(13.0)
(48.2)
Adjusted EBITDA
55.8
140.5
31.4
44.8
37.7
26.6
227.3
Subtract: Depreciation, depletion and amortization
(18.4)
(58.4)
(16.0)
(14.7)
(14.7)
(13.0)
(48.2)
Subtract: Financing expense, net
(12.0)
(1.4)
(7.1)
(3.3)
4.5
4.5
19.0
Subtract: Income Tax
(5.3)
(7.2)
2.9
(5.1)
(1.9)
(3.1)
(46.9)
Subtract: Sales Discount
(3.2)
(12.9)
(3.2)
(3.5)
(3.1)
(3.1)
(12.0)
Add: Net Income attributable to NCI
(0.3)
(1.7)
(0.5)
3.4
1.6
(6.2)
7.1
Net Income
16.6
58.9
7.5
21.6
24.1
5.7
146.3
Reconciliations from Adjusted Operating Income and Adjusted EBITDA to Net Income
|
 Reconciliations
First Quarter 2012 Earnings Conference Call
20
$ in millions, except per ton data
Jewell Coke
Other
Domestic
Coke
International
Coke
Jewell Coal
Corporate
Combined
Domestic
Coke
Q1 2012
Adjusted EBITDA
15.0
40.1
0.1
7.4
(6.8)
55.8
55.1
Subtract: Depreciation, depletion and amortization
(1.3)
(12.6)
(0.1)
(4.1)
(0.3)
(18.4)
(13.9)
Add (Subtract): Net (Income) loss attributable
to noncontrolling interests
(0.3)
(0.3)
(0.3)
Adjusted Pre-Tax Operating Income
13.7
27.2
-
3.3
(7.1)
37.1
40.9
Adjusted EBITDA
15.0
40.1
0.1
7.4
(6.8)
55.8
55.1
Sales Volume (thousands of tons)
186
892
358
373
1,078
Adjusted EBITDA per Ton
80.6
45.0
0.3
19.8
51.1
Average
Allocated
Invested
Capital
(1)
53.3
928.2
41.0
119.6
NMF
1,142.1
981.5
Annualized Quarterly Pretax ROIC
103%
12%
0%
11%
NMF
13%
17%
FY 2011
Adjusted EBITDA
46.1
89.4
13.7
35.5
(44.2)
140.5
135.5
Subtract: Depreciation, depletion and amortization
(4.9)
(38.7)
(0.2)
(12.9)
(1.7)
(58.4)
(43.6)
Add (Subtract): Net (Income) loss attributable
to noncontrolling interests
(1.7)
(1.7)
(1.7)
Adjusted Pre-Tax Operating Income
41.2
49.0
13.5
22.6
(45.9)
80.4
90.2
Adjusted EBITDA
46.1
89.4
13.7
35.5
(44.2)
140.5
135.5
Sales Volume (thousands of tons)
702
3,068
1,442
1,454
3,770
Adjusted EBITDA per Ton
65.7
29.1
9.5
24.4
35.9
Average Allocated Invested Capital
52.8
627.8
37.4
99.8
NMF
817.8
680.6
Pretax ROIC
78%
8%
36%
23%
NMF
10%
13%
Reconciliations from Adjusted EBITDA to Adjusted Pre-Tax Operating Income
|
   Reconciliations
First Quarter 2012 Earnings Conference Call
21
$ in millions, except per ton data
Jewell Coke
Other
Domestic
Coke
International
Coke
Jewell Coal
Corporate
Combined
Domestic
Coke
Q4 2011
Adjusted EBITDA
10.6
21.3
10.2
2.5
(13.2)
31.4
31.9
Subtract: Depreciation, depletion and amortization
(1.2)
(10.6)
(0.1)
(3.7)
(0.4)
(16.0)
(11.8)
Add (Subtract): Net (Income) loss attributable
to noncontrolling interests
(0.5)
(0.5)
(0.5)
Adjusted Pre-Tax Operating Income
9.4
10.2
10.1
(1.2)
(13.6)
14.9
19.6
Adjusted EBITDA
10.6
21.3
10.2
2.5
(13.2)
31.4
31.9
Sales Volume (thousands of tons)
166
837
295
363
1,003
Adjusted EBITDA per Ton
63.9
25.4
34.6
6.9
31.8
Average Allocated Invested Capital
46.7
594.0
33.7
105.6
NMF
779.9
640.6
Annualized Quarterly Pretax ROIC
81%
7%
120%
-5%
NMF
8%
12%
Q3 2011
Adjusted EBITDA
13.9
34.3
1.7
9.2
(14.3)
44.8
48.2
Subtract: Depreciation, depletion and amortization
(1.2)
(9.9)
-
(3.3)
(0.3)
(14.7)
(11.1)
Add (Subtract): Net (Income) loss attributable
to noncontrolling interests
3.4
3.4
3.4
Adjusted Pre-Tax Operating Income
12.7
27.8
1.7
5.9
(14.6)
33.5
40.5
Adjusted EBITDA
13.9
34.3
1.7
9.2
(14.3)
44.8
48.2
Sales Volume (thousands of tons)
191
777
373
371
968
Adjusted EBITDA per Ton
72.8
44.1
4.6
24.8
49.8
Average Allocated Invested Capital
53.5
636.2
34.8
115.1
NMF
839.6
689.7
Annualized Quarterly Pretax ROIC
95%
17%
20%
21%
NMF
16%
23%
Reconciliations from Adjusted EBITDA to Adjusted Pre-Tax Operating Income
|
   22
First Quarter 2012 Earnings Conference Call
Reconciliations
$ in millions, except per ton data
Jewell Coke
Other
Domestic
Coke
International
Coke
Jewell Coal
Corporate
Combined
Domestic
Coke
Q2 2011
Adjusted EBITDA
10.6
25.3
0.8
11.5
(10.5)
37.7
35.9
Subtract: Depreciation, depletion and amortization
(1.4)
(9.6)
(0.1)
(3.2)
(0.4)
(14.7)
(11.0)
Add (Subtract): Net (Income) loss attributable
to noncontrolling interests
1.6
1.6
1.6
Adjusted Pre-Tax Operating Income
9.2
17.3
0.7
8.3
(10.9)
24.6
26.5
Adjusted EBITDA
10.6
25.3
0.8
11.5
(10.5)
37.7
35.9
Sales Volume (thousands of tons)
170
757
412
334
927
Adjusted EBITDA per Ton
62.4
33.4
1.9
34.4
38.7
Average Allocated Invested Capital
57.9
648.2
39.7
117.7
NMF
863.4
706.1
Annualized Quarterly Pretax ROIC
64%
11%
7%
28%
NMF
11%
15%
Q1 2011
Adjusted EBITDA
11.0
8.5
1.0
12.3
(6.2)
26.6
19.5
Subtract: Depreciation, depletion and amortization
(1.1)
(8.6)
-
(2.7)
(0.6)
(13.0)
(9.7)
Add (Subtract): Net (Income) loss attributable
to noncontrolling interests
(6.2)
(6.2)
(6.2)
Adjusted Pre-Tax Operating Income
9.9
(6.3)
1.0
9.6
(6.8)
7.4
3.6
Adjusted EBITDA
11.0
8.5
1.0
12.3
(6.2)
26.6
19.5
Sales Volume (thousands of tons)
175
697
362
386
872
Adjusted EBITDA per Ton
62.9
12.2
2.8
31.9
22.4
Average Allocated Invested Capital
56.0
645.6
41.4
83.8
NMF
826.9
701.7
Annualized Quarterly Pretax ROIC
71%
-4%
10%
46%
NMF
4%
2%
Reconciliations from Adjusted EBITDA to Adjusted Pre-Tax Operating Income
|
 First Quarter 2012 Earnings Conference Call
23
Reconciliations
$ in millions, except per ton data
Jewell Coke
Other
Domestic
Coke
International
Coke
Jewell Coal
Corporate
Combined
Domestic
Coke
FY 2010
Adjusted EBITDA
123.9
78.5
15.0
24.0
(14.1)
227.3
202.4
Add (Subtract): Pro Forma impact of
ArcelorMittal settlement
(69.0)
18.0
(51.0)
(51.0)
Add (Subtract): Legal and settlement charges
related to ArcelorMittal Settlement and
Indiana Harbor Arbitration
3.6
12.7
16.3
16.3
Proforma Adjusted EBITDA
58.5
109.2
15.0
24.0
(14.1)
192.6
167.7
Subtract: Depreciation, depletion and amortization
(4.4)
(35.0)
(0.1)
(7.7)
(1.0)
(48.2)
(39.4)
Add (Subtract): Net (Income) loss attributable
to noncontrolling interests
7.1
7.1
7.1
Adjusted Pro Forma Operating Income
54.1
81.3
14.9
16.3
(15.1)
151.5
135.4
Adjusted EBITDA
58.5
109.2
15.0
24.0
(14.1)
192.6
167.7
Sales Volume (thousands of tons)
721
2,917
-
1,277
3,638
Adjusted EBITDA per Ton
81.1
37.4
18.8
46.1
Average Allocated Invested Capital
58.5
691.6
42.5
51.4
NMF
844.0
750.1
Pretax ROIC
92%
12%
35%
32%
NMF
18%
18%
Reconciliations from Adjusted EBITDA to Adjusted Pre-Tax Operating Income
|
 First Quarter 2012 Earnings Conference Call
24
Pretax Return on Invested Capital Reconciliation, $MM
(1) See Adjusted EBITDA and Pretax ROIC Reconciliation for respective periods, 2010
uses Adjusted Pro Forma Operating Income (2) Q1
2012
Average
Invested
Capital
includes
Middletown
in
both
the
beginning
and
ending
of
quarter
average
(Q1
2012
and
Q4
2011)
Consolidated Sun Coke Energy
Q1 2012
2011
Q4 2011
Q3 2011
Q2 2011
Q1 2011
2010
2009
Adjusted Pre-Tax Operating Income
(1)
37.1
80.4
14.9
33.5
24.6
7.4
151.5
Invested Capital
Q1 2012
(2)
2011
Q4 2011
Q3 2011
Q2 2011
Q1 2011
2010
2009
Debt
$725.7
$726.4
$726.4
$697.8
$794.7
$715.7
$655.3
$145.3
Equity
513.3
559.9
559.9
604.5
457.3
433.4
429.3
815.6
Cash
(113.6)
(127.5)
(127.5)
(110.9)
(30.5)
(11.0)
(40.1)
(2.7)
Middletown
(402.8)
(402.8)
(387.6)
(346.1)
(286.7)
(242.2)
(72.5)
Invested Capital
$1,125.4
$756.0
$756.0
$803.8
$875.4
$851.5
$802.4
$885.6
Average Invested Capital*
$1,142.1
$817.8
$779.9
$839.6
$863.4
$826.9
$844.0
Q1 2012
2011
Q4 2011
Q3 2011
Q2 2011
Q1 2011
2010
Quarterly ROIC
13%
8%
16%
11%
4%
Last Twelve Months' ROIC
10%
18%
*5 quarter average for 2011, two quarter average for each quarter, year-end average for
2010 Debt
Q2 2011
Q1 2011
2010
2009
Interest receivable from affiliate
(3.6)
(1.8)
0.0
0.0
Notes receivable from affiliate
(289.0)
(289.0)
(289.0)
(289.0)
Advances from affiliate
1,087.3
1,006.5
944.3
434.3
Total Debt
794.7
715.7
655.3
145.3 |
  First
Quarter 2012 Earnings Conference Call 25
Pretax Return on Invested Capital Reconciliation, $MM
Period ended
Jewell
Coke
Other
Domestic
Coke
International
Coke
Coal
Mining
Corporate
and Other
Total
Identifiable Assets for
Allocating Invested Capital
Q1 2012
83.9
1,440.2
64.6
189.1
141.1
1,918.9
Q4 2011, inc Middletown
81.6
1,440.8
62.7
182.1
174.6
1,941.8
Q4 2011
81.6
1,038.0
62.7
182.1
174.6
1,539.0
Q3 2011
77.7
990.6
52.7
178.3
192.3
1,879.2
Q2 2011
85.1
954.4
53.6
173.5
67.2
1,972.6
Q1 2011
82.6
922.6
61.2
167.3
48.9
1,860.1
2010
80.9
962.6
59.7
76.7
7.3
1,718.5
2009
82.7
972.1
59.2
67.6
3.7
1,546.7
Percentage of
Invested Capital
Q1 2012
4.7%
81.0%
3.6%
10.6%
NMF
100.0%
Q4 2011, inc Middletown
4.6%
81.5%
3.5%
10.3%
NMF
100.0%
Q4 2011
6.0%
76.1%
4.6%
13.3%
NMF
100.0%
Q3 2011
6.0%
76.2%
4.1%
13.7%
NMF
100.0%
Q2 2011
6.7%
75.4%
4.2%
13.7%
NMF
100.0%
Q1 2011
6.7%
74.8%
5.0%
13.6%
NMF
100.0%
2010
6.9%
81.6%
5.1%
6.5%
NMF
100.0%
2009
7.0%
82.3%
5.0%
5.7%
NMF
100.0%
Allocated
Invested Capital
Q1 2012
53.1
911.7
40.9
119.7
-
1,125.4
Q4 2011, inc Middletown
53.5
944.8
41.1
119.4
-
1,158.8
Q4 2011
45.2
575.1
34.7
100.9
-
756.0
Q3 2011
48.1
612.9
32.6
110.3
-
803.8
Q2 2011
58.8
659.6
37.0
119.9
-
875.4
Q1 2011
57.0
636.7
42.3
115.5
-
851.5
2010
55.0
654.6
40.6
52.1
-
802.4
2009
62.0
728.7
44.4
50.6
-
885.6
Note:
This
table
excludes
Middletown
assets
up
to
and
including
Q4
2011.
At
the
end
of
Q4
2011,
identifiable
assets
included
in
Other
Domestic
Coke
attributable
to
Middletown
were
$402.8m (prior to Q4 2011, Middletown was included in the Corporate and Other
segment); see historical segment detail in public filings for additional detail. |
  26
2012E
Low
2012E
High
Net Income
$98
$122
Depreciation, Depletion and Amortization
74
72
Total financing costs, net
48
46
Income tax expense
25
37
EBITDA
$245
$277
Sales discounts
11
10
Noncontrolling interests
(6)
(7)
Adjusted EBITDA
$250
$280
Estimated EBITDA Reconciliation, $MM
2012E Net Income to Adjusted EBITDA Reconciliation
First Quarter 2012 Earnings Conference Call |
 27
Estimated Free Cash Flow Reconciliation, $MM
2012E Estimated Free Cash Flow Reconciliation
First Quarter 2012 Earnings Conference Call
2012
Cash from operations;
In excess of
$ 179
Less cash used for investing activities
Approx.
(100)
Less payments to minority interest
Approx.
(4)
Free Cash Flow
In excess of
$ 75 |
 Media releases and SEC filings are available
on our website at www.suncoke.com
Contact Investor Relations for more information: 630-824-1907
|