Attached files
| file | filename |
|---|---|
| 8-K - ROCK-TENN COMPANY 8-K - Rock-Tenn CO | a50253988.htm |
Exhibit 99.1

Fiscal 2012 2nd Quarter Earnings Conference Call Presentation April 26, 2012 Jim Rubright – Chairman and Chief Executive Officer Steve Voorhees – Chief Financial Officer and Chief Administrative Officer
Statements in this presentation that do not relate strictly to historical facts are forward-looking statements within the meaning of the Private Securities Litigation Reform Act of 1995, including the slides entitled “3Q’12 Outlook” and “Key Financial Statistics – FY12 Outlook” that give guidance for future periods in 2012. Forward-looking statements are based on our current expectations, beliefs, plans or forecasts and use words in this presentation such as will, estimate, trending, or refer to future time periods. You should not place undue reliance on any forward-looking statements as such statements involve risks, uncertainties, assumptions and other factors that could cause actual results to differ materially, including the following: our ability to integrate Smurfit-Stone or to achieve benefits from the Smurfit-Stone Acquisition, including, without limitation, synergies and performance improvements; expected levels of depreciation, corporate expenses, interest expense, income tax rates, federal NOL utilization, Black Liquor and AMT tax credit utilization, pension contributions, capital expenditures, commodity costs, maintenance outages, containerboard inventory builds; the level of demand for our products; economic downtime; our ability to successfully identify and make performance improvements; anticipated returns on our capital investments; possible increases in energy, raw materials, shipping and capital equipment costs; any reduction in the supply of raw materials; fluctuations in selling prices and volumes; intense competition; the potential loss of certain customers; adverse changes in general market and industry conditions and other risks, uncertainties and factors discussed in Item 1A "Risk Factors" and under the caption "Business — Forward-Looking Information" in our 2011 Annual Report on Form 10-K and by similar disclosures in any of our subsequent SEC filings. The information contained herein speaks as of the date hereof and we do not have or undertake any obligation to update such information as future events unfold. 2 Cautionary Statement Regarding Forward-Looking Information
Use of Non-GAAP Financial Measures and Reconciliations We have included financial measures that are not prepared in accordance with accounting principles generally accepted in the United States ("GAAP"). The non-GAAP financial measures presented are not intended to be a substitute for GAAP financial measures, and any analysis of non-GAAP financial measures should be used only in conjunction with results presented in accordance with GAAP and the reconciliations of non-GAAP financial measures to GAAP financial measures included in the Appendix to this presentation. 3
Disclaimer We may from time to time be in possession of certain information regarding RockTenn that applicable law would not require us to disclose to the public in the ordinary course of business, but would require us to disclose if we were engaged in the purchase or sale of our securities. This presentation shall not be considered to be part of any solicitation of an offer to buy or sell RockTenn securities. This presentation also may not include all of the information regarding RockTenn that you may need to make an investment decision regarding RockTenn securities. Any such investment decision should be made on the basis of the overall mix of information regarding RockTenn that is publicly available as of the date of such decision. 4
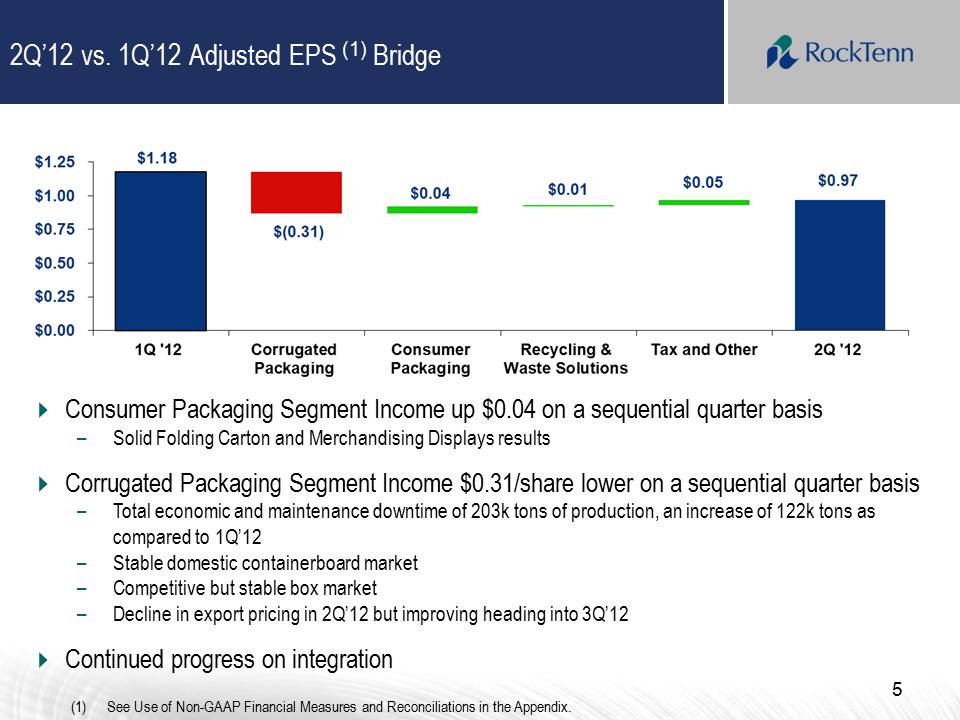
2Q’12 vs. 1Q’12 Adjusted EPS (1) Bridge 5 (1) See Use of Non-GAAP Financial Measures and Reconciliations in the Appendix. �� Consumer Packaging Segment Income up $0.04 on a sequential quarter basis – Solid Folding Carton and Merchandising Displays results �� Corrugated Packaging Segment Income $0.31/share lower on a sequential quarter basis – Total economic and maintenance downtime of 203k tons of production, an increase of 122k tons as compared to 1Q’12 – Stable domestic containerboard market – Competitive but stable box market – Decline in export pricing in 2Q’12 but improving heading into 3Q’12 �� Continued progress on integration $1.25 $1.00 $0.75 $0.50 $0.25 $0.00 $1.18 $(0.31) $0.04 $0.01 $0.05 $0.97 1Q ’12 Corrugated Packaging Consumer Packaging Recycling & Waste Solutions Tax and Other 2Q ‘12
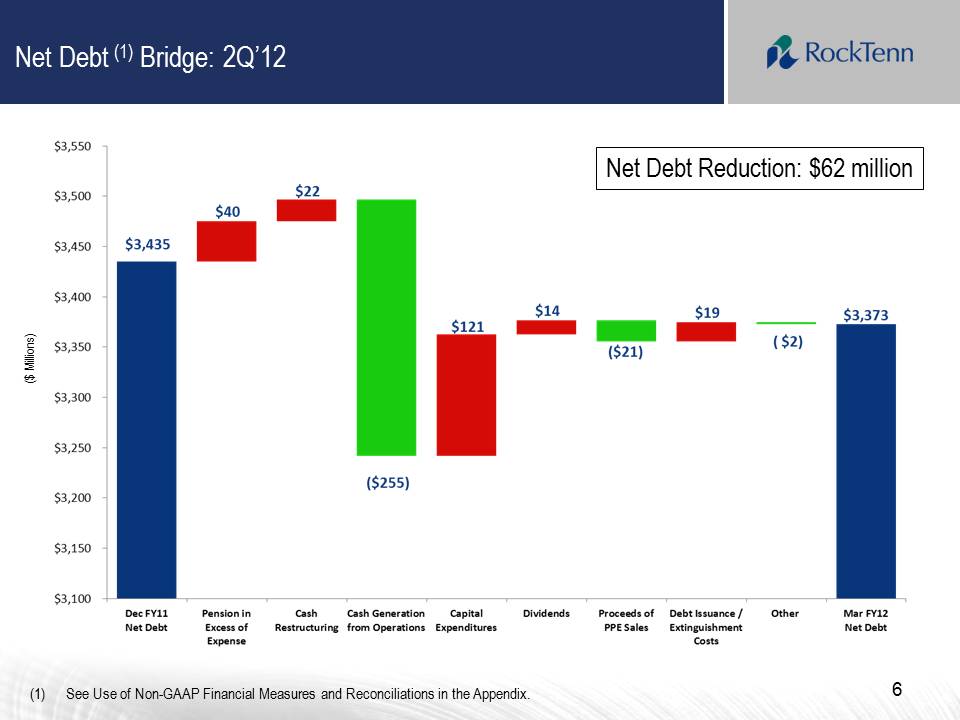
Net Debt (1) Bridge: 2Q’12 6 (1) See Use of Non-GAAP Financial Measures and Reconciliations in the Appendix. ($ Millions) Net Debt Reduction: $62 million $3,550 $3,500 $3,450 $3,400 $3,300 $3,350 $3,250 $3,200 $3,150 $3,100 $3,435 $40 $22 ($255) $121 $14 ($21) $19 ($2) $3,373 Dec FY11 Net Debt Pension in Excee of Expense Cash Restructuring Cash Generation from Operations Capital Expenditures Dividends Proceeds of PPE Sales Debt Issuance/Extinguishment Cost Other Mar FY12 Net Debt
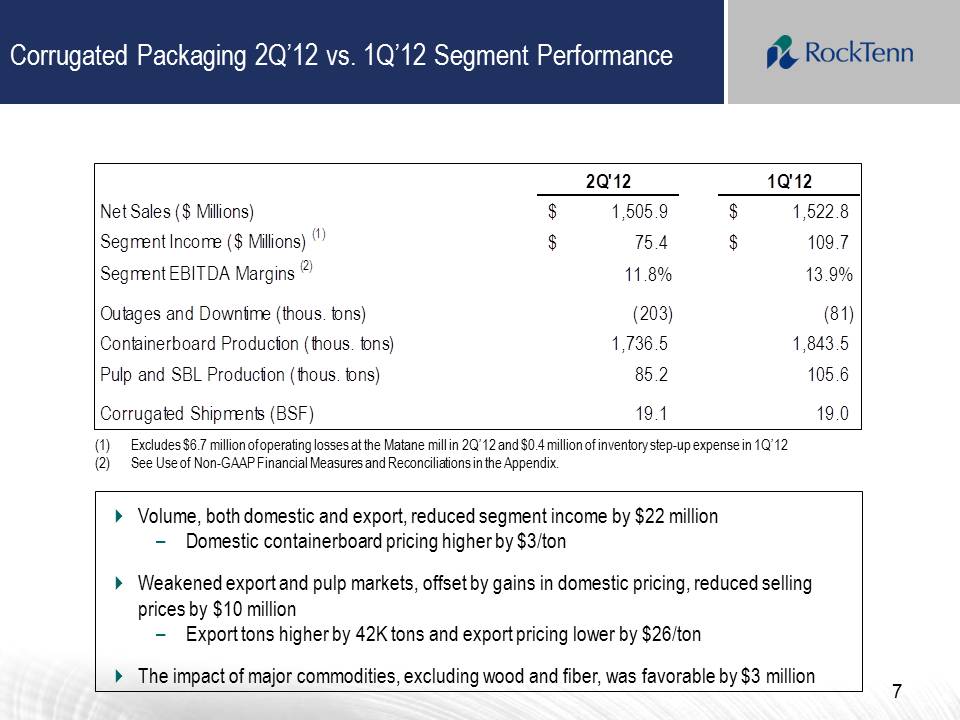
Corrugated Packaging 2Q’12 vs. 1Q’12 Segment Performance 7 2Q'12 1Q'12 Net Sales ($ Millions) 1,505.9 $ 1,522.8 $ Segment Income ($ Millions) (1) 75.4 $ 109.7 $ Segment EBITDA Margins (2) 11.8% 13.9% Outages and Downtime (thous. tons) (203) (81) Containerboard Production (thous. tons) 1,736.5 1,843.5 Pulp and SBL Production (thous. tons) 85.2 105.6 Corrugated Shipments (BSF) 19.1 19.0 �� Volume, both domestic and export, reduced segment income by $22 million – Domestic containerboard pricing higher by $3/ton �� Weakened export and pulp markets, offset by gains in domestic pricing, reduced selling prices by $10 million – Export tons higher by 42K tons and export pricing lower by $26/ton �� The impact of major commodities, excluding wood and fiber, was favorable by $3 million (1) Excludes $6.7 million of operating losses at the Matane mill in 2Q’12 and $0.4 million of inventory step-up expense in 1Q’12 (2) See Use of Non-GAAP Financial Measures and Reconciliations in the Appendix.
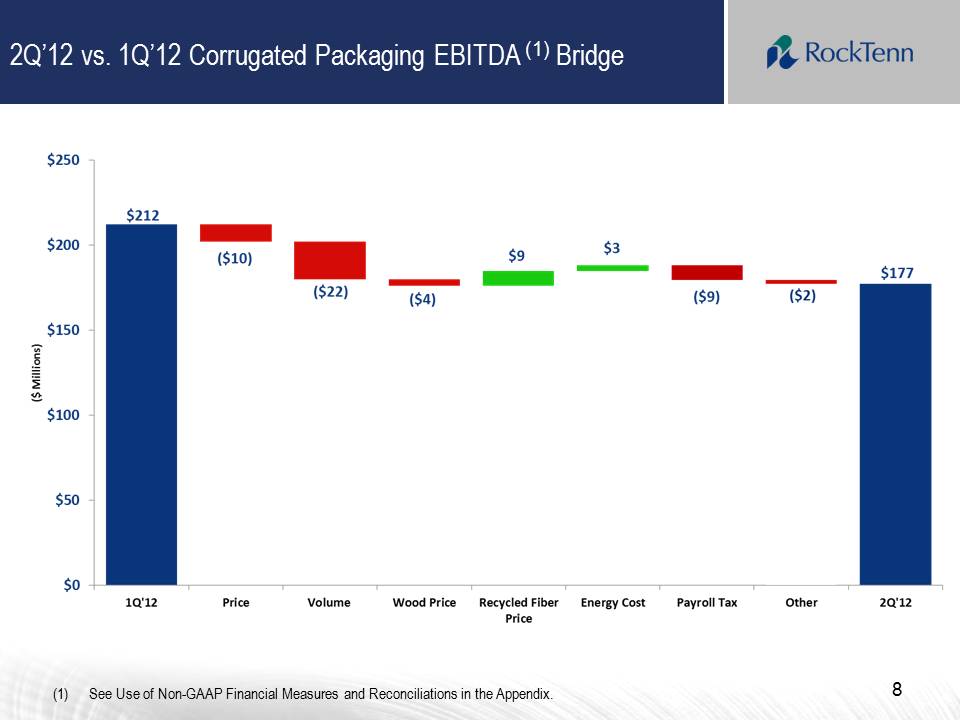
2Q’12 vs. 1Q’12 Corrugated Packaging EBITDA (1) Bridge 8 (1) See Use of Non-GAAP Financial Measures and Reconciliations in the Appendix. $250 $200 $150 $100 $50 $0 $212 ($10) ($22) ($4) $9 $3 ($9) ($2) $177 1Q’12 Price Volume Wood Price Recycled Fiber Price Energy Cost Payroll Tax Other 2Q’12
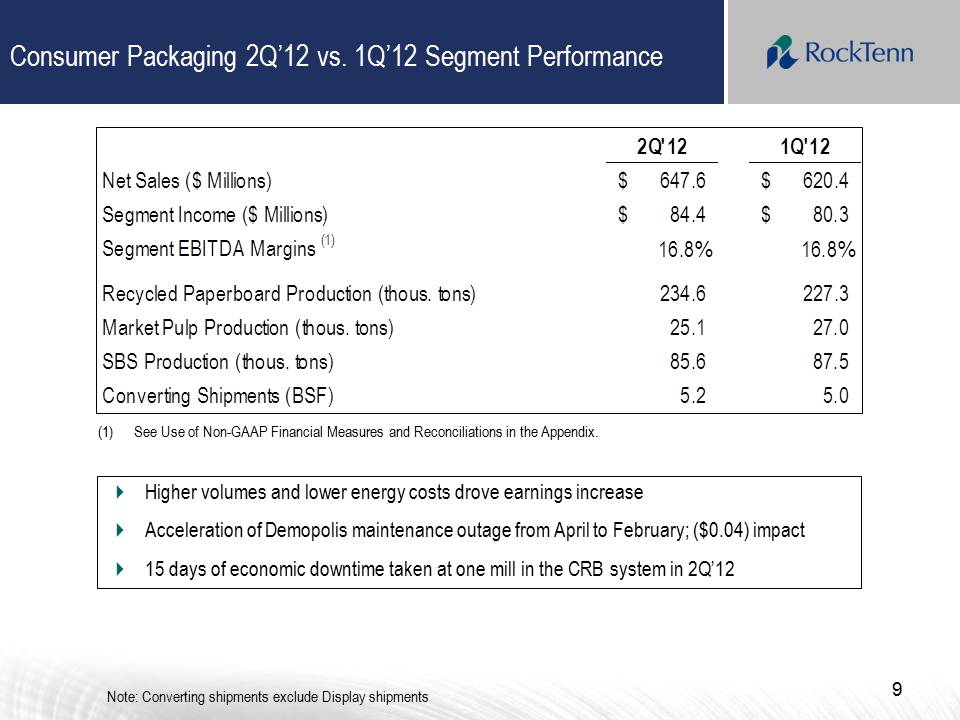
Consumer Packaging 2Q’12 vs. 1Q’12 Segment Performance 9 2Q'12 1Q'12 Net Sales ($ Millions) 647.6 $ 620.4 $ Segment Income ($ Millions) 84.4 $ 80.3 $ Segment EBITDA Margins (1) 16.8% 16.8% Recycled Paperboard Production (thous. tons) 234.6 227.3 Market Pulp Production (thous. tons) 25.1 27.0 SBS Production (thous. tons) 85.6 87.5 Converting Shipments (BSF) 5.2 5.0 �� Higher volumes and lower energy costs drove earnings increase �� Acceleration of Demopolis maintenance outage from April to February; ($0.04) impact �� 15 days of economic downtime taken at one mill in the CRB system in 2Q’12 Note: Converting shipments exclude Display shipments (1) See Use of Non-GAAP Financial Measures and Reconciliations in the Appendix.
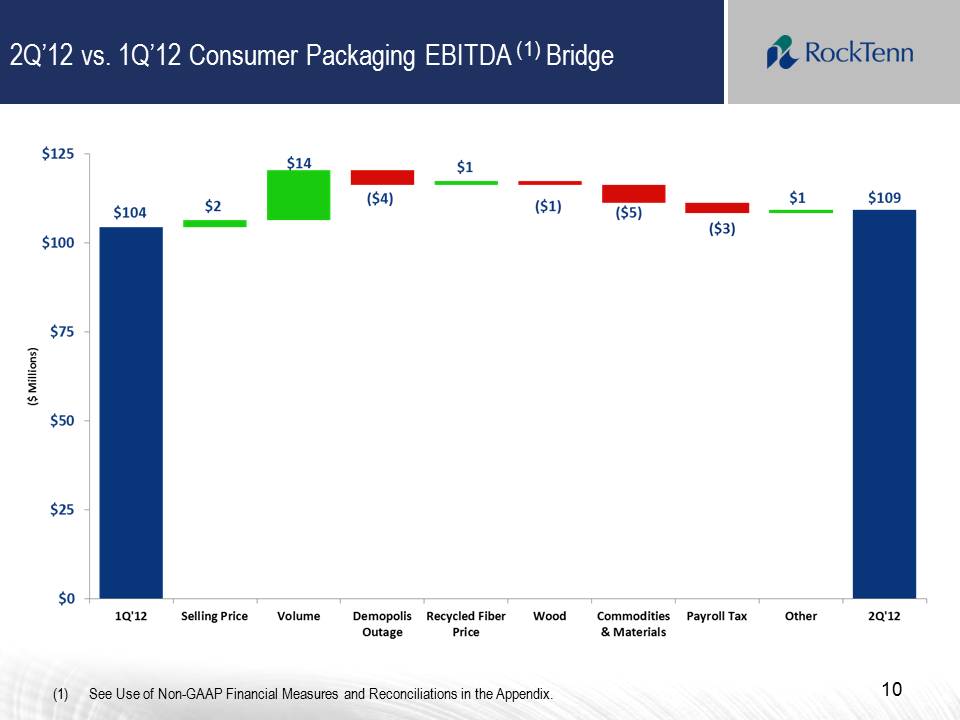
2Q’12 vs. 1Q’12 Consumer Packaging EBITDA (1) Bridge 10 (1) See Use of Non-GAAP Financial Measures and Reconciliations in the Appendix. $125 $100 $75 $50 $25 $0 1Q’12 Selling Price Volume Demopolis Outage Recycled Fiber Price Wood Commodities & Materials Payroll Tax 2Q’12 $104 $2 $14 ($4) $1 ($1) ($5) ($3) $109
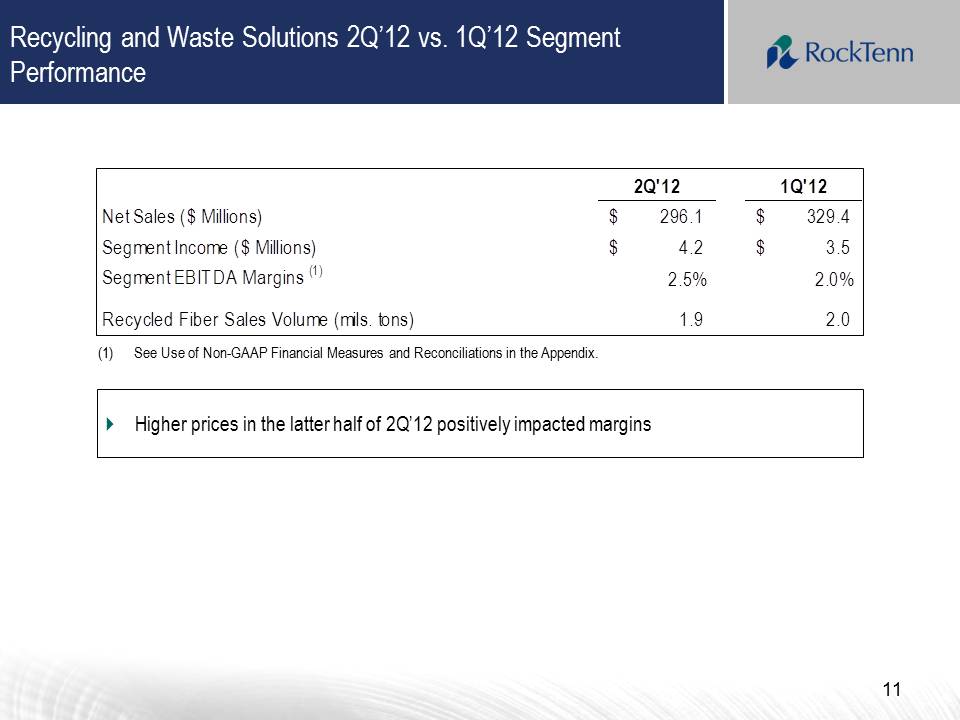
Recycling and Waste Solutions 2Q’12 vs. 1Q’12 Segment Performance 11 2Q'12 1Q'12 Net Sales ($ Millions) 296.1 $ 329.4 $ Segment Income ($ Millions) 4.2 $ 3.5 $ Segment EBITDA Margins (1) 2.5% 2.0% Recycled Fiber Sales Volume (mils. tons) 1.9 2.0 ��Higher prices in the latter half of 2Q’12 positively impacted margins (1) See Use of Non-GAAP Financial Measures and Reconciliations in the Appendix.
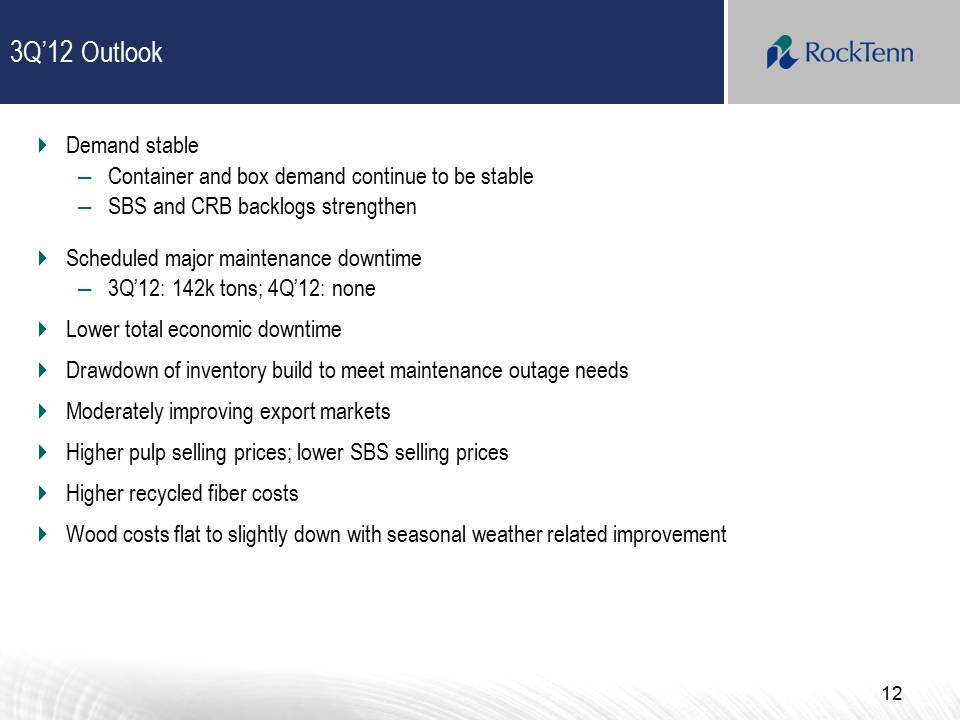
12 3Q’12 Outlook �� Demand stable – Container and box demand continue to be stable – SBS and CRB backlogs strengthen �� Scheduled major maintenance downtime – 3Q’12: 142k tons; 4Q’12: none �� Lower total economic downtime �� Drawdown of inventory build to meet maintenance outage needs �� Moderately improving export markets �� Higher pulp selling prices; lower SBS selling prices �� Higher recycled fiber costs �� Wood costs flat to slightly down with seasonal weather related improvement
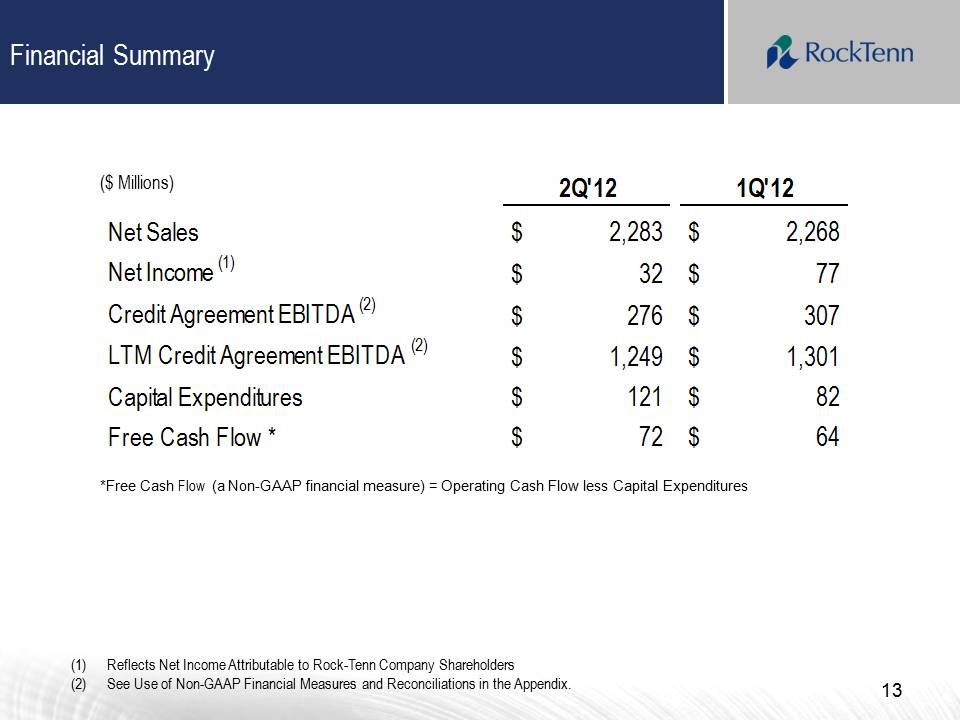
2Q'12 1Q'12 Net Sales 2,283 $ 2,268 $ Net Income (1) 32 $ 77 $ Credit Agreement EBITDA (2) 276 $ 307 $ LTM Credit Agreement EBITDA (2) 1,249 $ 1,301 $ Capital Expenditures 121 $ 82 $ Free Cash Flow * 72 $ 64 $ Financial Summary 13 *Free Cash Flow (a Non-GAAP financial measure) = Operating Cash Flow less Capital Expenditures (1) Reflects Net Income Attributable to Rock-Tenn Company Shareholders (2) See Use of Non-GAAP Financial Measures and Reconciliations in the Appendix. ($ Millions)
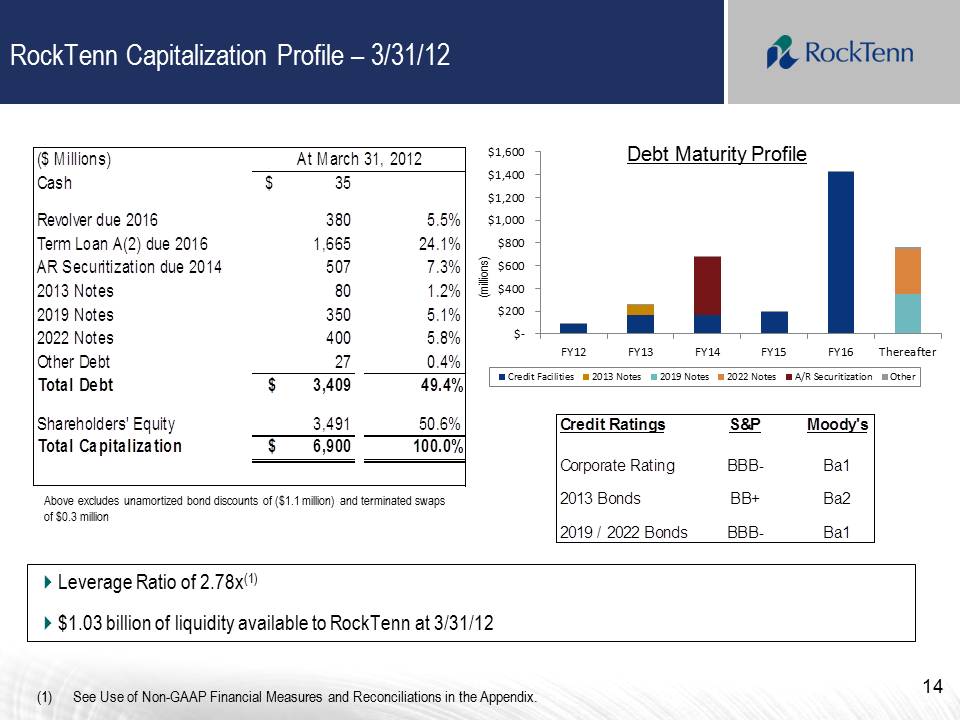
��Leverage Ratio of 2.78x(1) ��$1.03 billion of liquidity available to RockTenn at 3/31/12 14 RockTenn Capitalization Profile – 3/31/12 Debt Maturity Profile (millions) ($ Millions) Cash $ 35 Revolver due 2016 380 5.5% Term Loan A(2) due 2016 1,665 24.1% AR Securitization due 2014 507 7.3% 2013 Notes 80 1.2% 2019 Notes 350 5.1% 2022 Notes 400 5.8% Other Debt 27 0.4% Total Debt $ 3,409 49.4% Shareholders' Equity 3,491 50.6% Total Capitalization $ 6,900 100.0% At March 31, 2012 Above excludes unamortized bond discounts of ($1.1 million) and terminated swaps of $0.3 million (1) See Use of Non-GAAP Financial Measures and Reconciliations in the Appendix. $‐ $200 $400 $600 $800 $1,000 $1,200 $1,400 $1,600 FY12 FY13 FY14 FY15 FY16 Thereafter Credit Facilities 2013 Notes 2019 Notes 2022 Notes A/R Securitization Other Credit Ratings S&P Moody's Corporate Rating BBB- Ba1 2013 Bonds BB+ Ba2 2019 / 2022 Bonds BBB- Ba1
15 Integration �� Run rate of synergy and performance improvements in excess of $150 million �� Completed conversion of SAP to JD Edwards �� Completed first natural gas energy conversion at Stevenson mill; three additional conversions in late 2012 �� Closed the Matane recycled corrugated medium mill and announced closure of two additional box plants �� To date, nine box plant closures have been announced
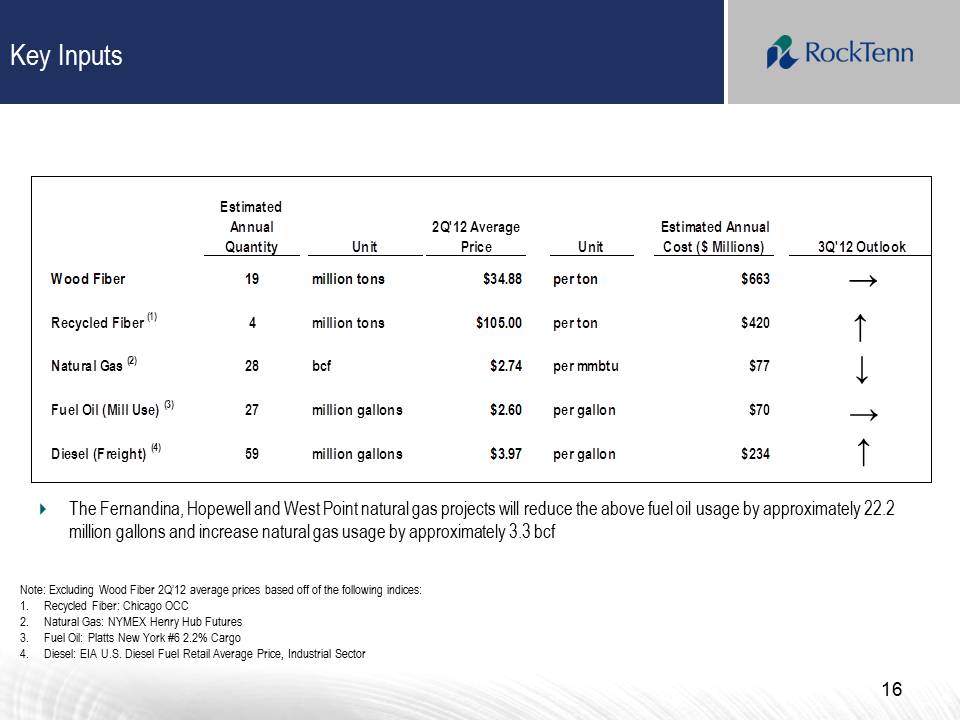
Estimated Annual Quantity Unit 2Q'12 Average Price Unit Estimated Annual Cost ($ Millions) 3Q'12 Outlook Wood Fiber 19 million tons $34.88 per ton $663 Recycled Fiber (1) 4 million tons $105.00 per ton $420 Natural Gas (2) 28 bcf $2.74 per mmbtu $77 Fuel Oil (Mill Use) (3) 27 million gallons $2.60 per gallon $70 Diesel (Freight) (4) 59 million gallons $3.97 per gallon $234 Key Inputs 16 Note: Excluding Wood Fiber 2Q’12 average prices based off of the following indices: 1. Recycled Fiber: Chicago OCC 2. Natural Gas: NYMEX Henry Hub Futures 3. Fuel Oil: Platts New York #6 2.2% Cargo 4. Diesel: EIA U.S. Diesel Fuel Retail Average Price, Industrial Sector ↓ ↓ ↓ ↓ ↓ �� The Fernandina, Hopewell and West Point natural gas projects will reduce the above fuel oil usage by approximately 22.2 million gallons and increase natural gas usage by approximately 3.3 bcf
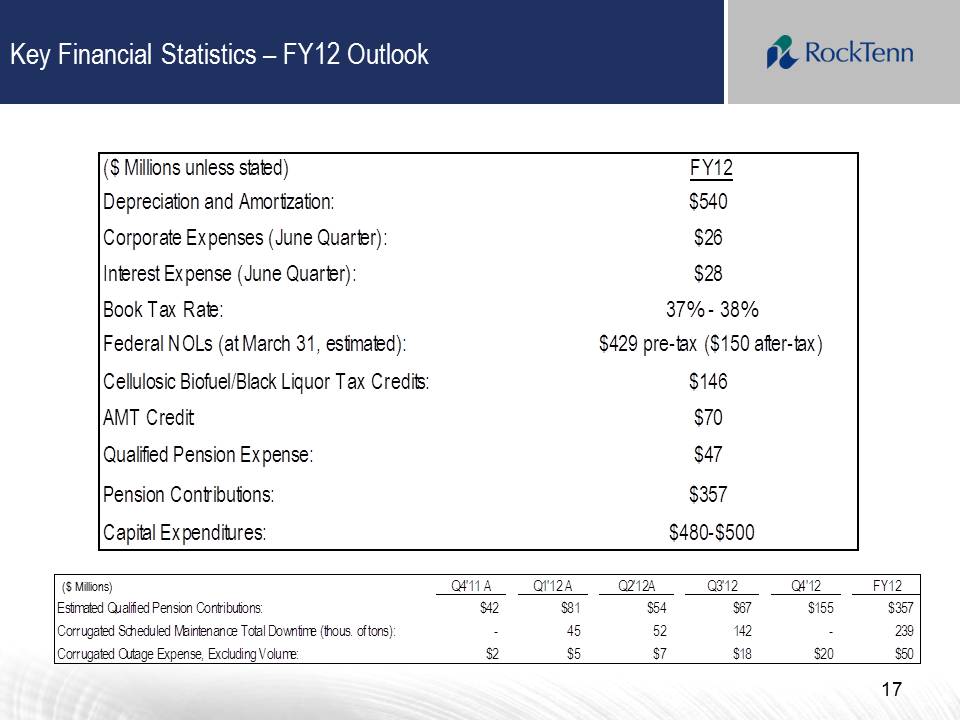
Key Financial Statistics – FY12 Outlook ($ Millions unless stated) FY12 Depreciation and Amortization: $540 Corporate Expenses (June Quarter): $26 Interest Expense (June Quarter): $28 Book Tax Rate: 37% - 38% Federal NOLs (at March 31, estimated): $429 pre-tax ($150 after-tax) Cellulosic Biofuel/Black Liquor Tax Credits: $146 AMT Credit: $70 Qualified Pension Expense: $47 Pension Contributions: $357 Capital Expenditures: $480-$500 Q4'11 A Q1'12 A Q2'12A Q3'12 Q4'12 FY12 Estimated Qualified Pension Contributions: $42 $81 $54 $67 $155 $357 Corrugated Scheduled Maintenance Total Downtime (thous. of tons): - 45 52 142 – 239 Corrugated Outage Expense, Excluding Volume: $2 $5 $7 $18 $20 $50 ($ Millions) 17

RockTenn

Appendix 19
20 Use of Non-GAAP Financial Measures and Reconciliations Below, we define the non-GAAP financial measures, provide a reconciliation of each non-GAAP financial measure to the most directly comparable financial measure calculated in accordance with GAAP, and discuss the reasons that we believe this information is useful to management and may be useful to investors. These measures may differ from similarly captioned measures of other companies in our industry. Non-GAAP Measures Our definitions of Credit Agreement EBITDA and Segment EBITDA may differ from other similarly titled measures at other companies. Credit Agreement EBITDA (as defined) and Adjusted EBITDA (as defined) are not defined in accordance with GAAP and should not be viewed as alternatives to GAAP measures of operating results or liquidity. RockTenn management believes that net income is the most directly comparable GAAP measure to Credit Agreement EBITDA (as defined) and Segment Income is the most directly comparable GAAP measure to Segment EBITDA.
21 Non-GAAP Measures: Credit Agreement EBITDA and Total Funded Debt (as defined) “Credit Agreement EBITDA” is calculated in accordance with the definition of “EBITDA” contained in the Company’s Credit Agreement. Credit Agreement EBITDA is generally defined as Consolidated Net Income plus: consolidated interest expense; consolidated tax expenses; depreciation and amortization expenses; charges and expenses for financing fees and expenses and write-offs of deferred financing fees and expenses, remaining portions of OID on prepayment of indebtedness, premiums due in respect of prepayment of indebtedness, and commitment fees in respect of financing commitments; various charges and expenses related to, or incurred in connection with, the Smurfit-Stone acquisition; costs and expenses relating to the integration of Smurfit-Stone and the achievement of synergies relating to the Smurfit-Stone acquisition; certain run-rate synergies expected to be achieved due to the Smurfit-Stone acquisition; all non-cash charges; all cash charges and expenses for plant and other facility closures and other cash restructuring charges; labor disruption charges; officer payments associated with any permitted acquisitions; “black liquor” expenses; cash charges and expenses incurred in respect of the Chapter 11 bankruptcy proceeding and plan of reorganization of Smurfit-Stone; and all non-recurring cash expenses taken in respect of any multi-employer and defined benefitpension plan obligations that are related to plant and other facilities closures. For additional information on the calculation see our Credit Agreement, dated as of May 27, 2011, filed as Exhibit 10.1 to our Form 8-K, dated May 27, 2011. “Total Funded Debt” is calculated in accordance with the definition of “Total Funded Debt” contained in the Company’s Credit Agreement. Total Funded Debt is generally defined as aggregate debt obligations reflected in our balance sheet, less the hedge adjustments resulting from terminated and existing fair value interest rate derivatives or swaps, plus additional outstanding letters of credit not already reflected in debt, plus debt guarantees.
22 Non-GAAP Measures: Credit Agreement EBITDA and Total Funded Debt Our management uses Credit Agreement EBITDA and Total Funded Debt to evaluate compliance with RockTenn’s debt covenants and borrowing capacity available under its Credit Agreement. Management also uses Credit Agreement EBITDA as a measure of our Company’s core operating performance. Management believes that investors also use these measures to evaluate the Company’s compliance with its debt covenants and available borrowing capacity. Management also believes that investors Credit Agreement EBITDA as a measure of our Company’s core operating performance. Borrowing capacity is dependent upon, in addition to other measures, the “Total Funded Debt/EBITDA ratio” or “Leverage Ratio,” which is defined as Total Funded Debt divided by Credit Agreement EBITDA.
23 Non-GAAP Measures: Net Debt We have defined the non-GAAP measure “Net Debt” to include the aggregate debt obligations reflected in our balance sheet, less the hedge adjustments resulting from terminated and existing fair value interest rate derivatives or swaps, the balance of our cash and cash equivalents, restricted cash (which includes the balance sheet line items restricted cash and restricted cash and marketable debt securities) and certain other investments that we consider to be readily available to satisfy such debt obligations. Our management uses Net Debt, along with other factors, to evaluate our financial condition. We believe that Net Debt is an appropriate supplemental measure of financial condition and may be useful to investors because it provides a more complete understanding of our financial condition before the impact of our decisions regarding the appropriate use of cash and liquid investments.
24 Non-GAAP Measures: Adjusted Net Income and Adjusted Earnings Per Diluted Share We also use the non-GAAP measures “adjusted net income” and “adjusted earnings per diluted share”. Management believes these non-GAAP financial measures provide our board of directors, investors, potential investors, securities analysts and others with useful information to evaluate the performance of the Company because it excludes restructuring and other costs, net, the alternative fuel mixture credit and cellulosic biofuel producer credit and other specific items that management believes are not indicative of the ongoing operating results of the business. The Company and the board of directors use this information to evaluate the Company’s performance relative to other periods.
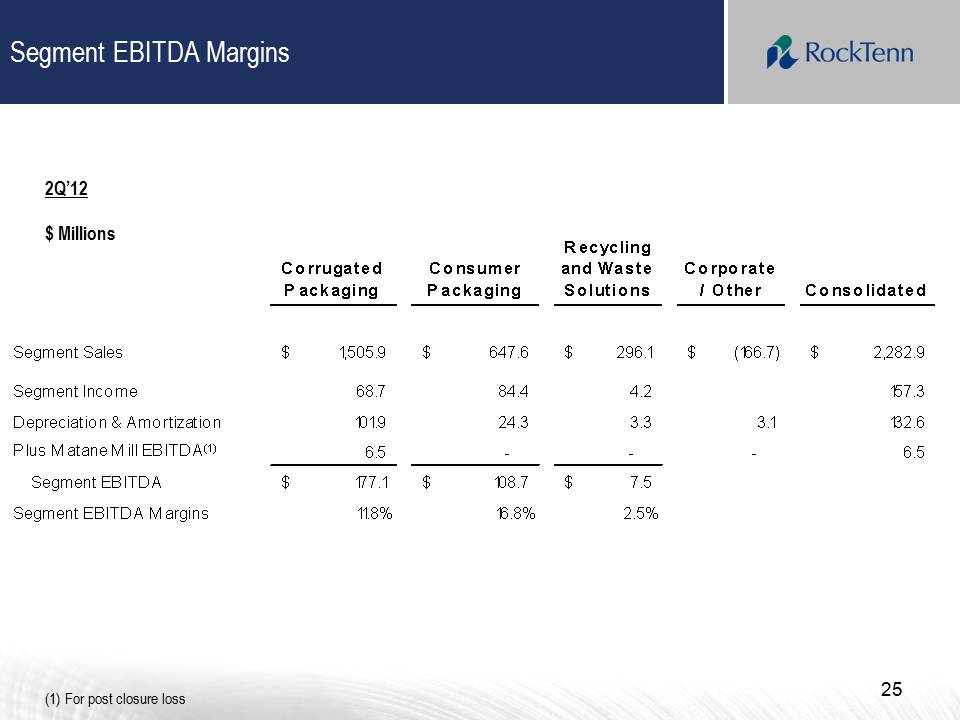
Segment EBITDA Margins 25 Corrugated Packaging Consumer Packaging Recycling and Waste Solutions Corporate/ Other Consolidated Segment Sales 1,505.9 $ 647.6 $ 296.1 $ (166.7) $ 2,282.9 $ Segment Income 68.7 84.4 4.2 157.3 Depreciation & Amortization 101.9 24.3 3.3 3.1 132.6 Plus M atane M ill EB ITDA(1) 6.5 - - - 6.5 Segment EBITDA 177.1 $ 108.7 $ 7.5 $ Segment EB ITDA M argins 11.8% 16.8% 2.5% 2Q’12 $ Millions (1) For post closure loss
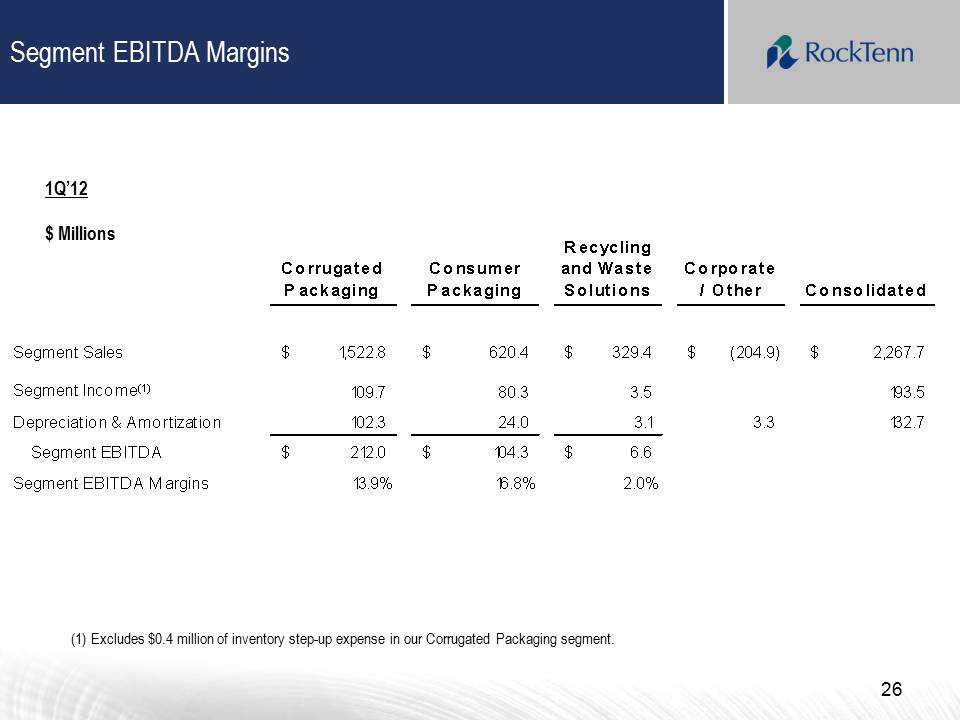
Segment EBITDA Margins 26 (1) Excludes $0.4 million of inventory step-up expense in our Corrugated Packaging segment. Corrugated Packaging Consumer Packaging Recycling and Waste Solutions Corporate/ Other Consolidated Segment Sales 1,522.8 $ 620.4 $ 329.4 $ (204.9) $ 2,267.7 $ Segment Income(1) 109.7 80.3 3.5 193.5 Depreciation & Amortization 102.3 24.0 3.1 3.3 132.7 Segment EBITDA 212.0 $ 104.3 $ 6.6 $ Segment EBITDA M argins 13.9% 16.8% 2.0% 1Q’12 $ Millions
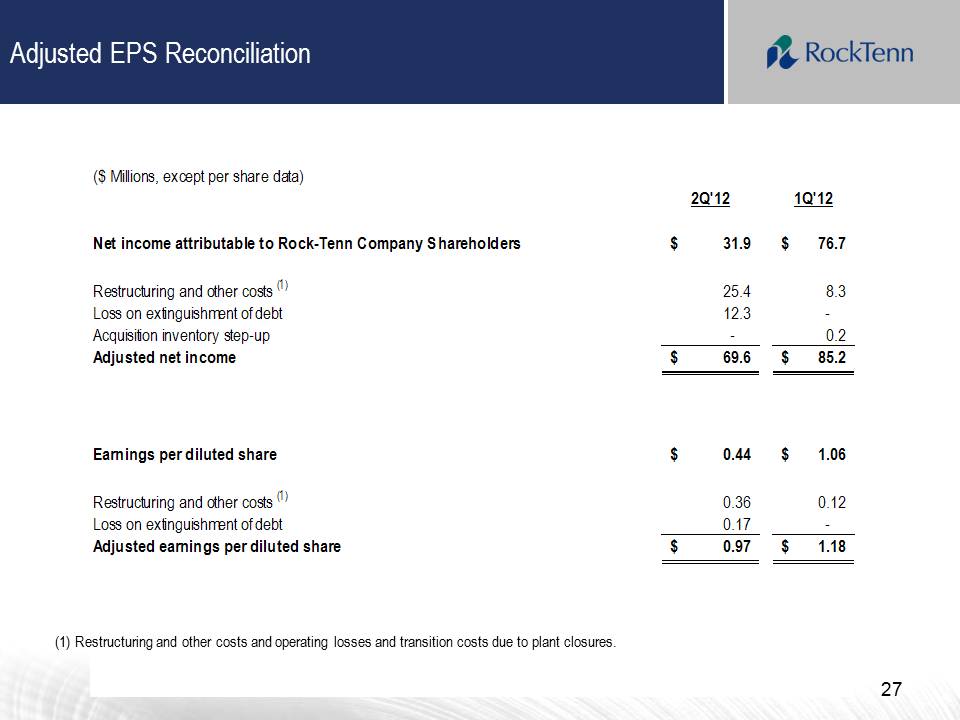
Adjusted EPS Reconciliation 27 ($ Millions, except per share data) 2Q'12 1Q'12 Net income attributable to Rock-Tenn Company Shareholders 31.9 $ 76.7 $ Restructuring and other costs (1) 25.4 8.3 Loss on extinguishment of debt 12.3 - Acquisition inventory step-up - 0.2 Adjusted net income 69.6 $ 85.2 $ Earnings per diluted share 0.44 $ 1.06 $ Restructuring and other costs (1) 0.36 0.12 Loss on extinguishment of debt 0.17 - Adjusted earnings per diluted share 0.97 $ 1.18 $ (1) Restructuring and other costs and operating losses and transition costs due to plant closures.
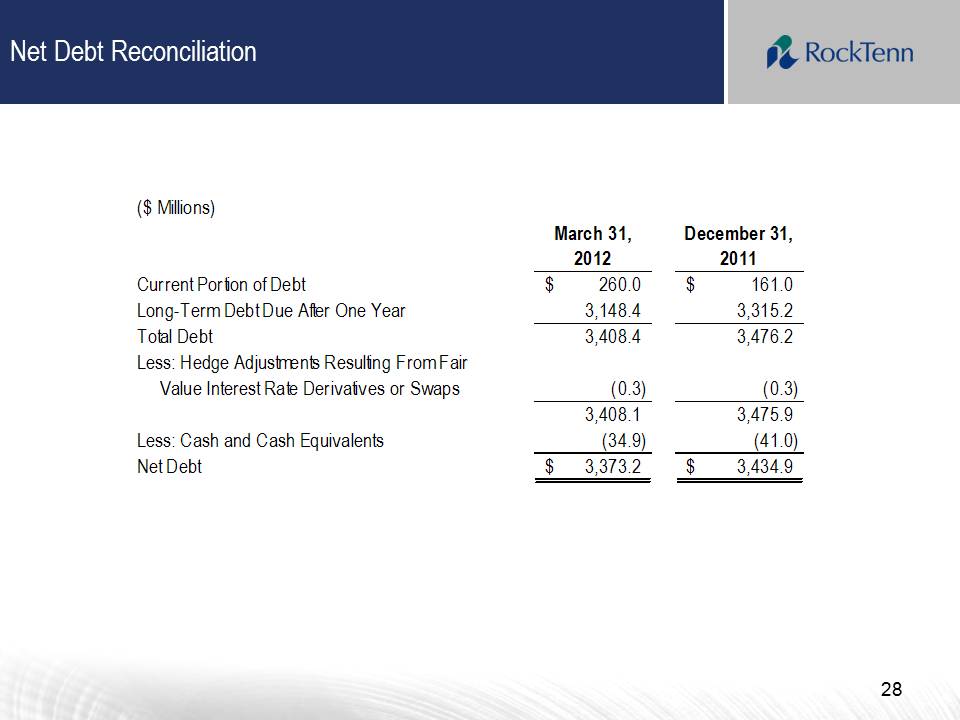
Net Debt Reconciliation 28 ($ Millions) March 31, 2012 December 31, 2011 Current Portion of Debt 260.0 $ 161.0 $ Long-Term Debt Due After One Year 3,148.4 3,315.2 Total Debt 3,408.4 3,476.2 Less: Hedge Adjustments Resulting From Fair Value Interest Rate Derivatives or Swaps (0.3) (0.3) 3,408.1 3,475.9 Less: Cash and Cash Equivalents (34.9) (41.0) Net Debt 3,373.2 $ 3,434.9 $
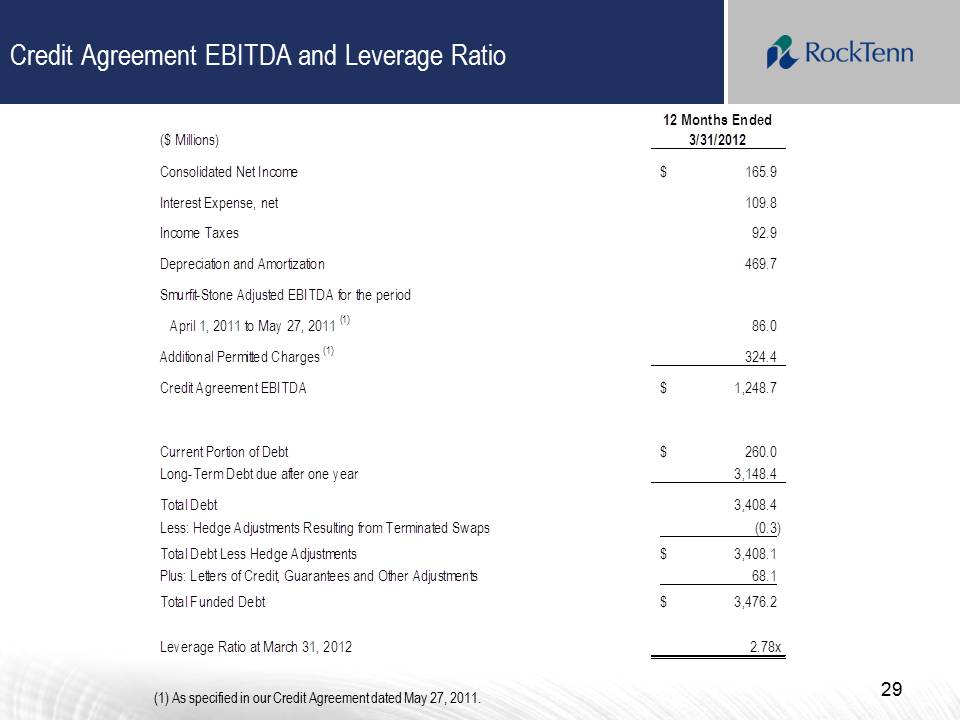
Credit Agreement EBITDA and Leverage Ratio 29 ($ Millions) 12 Months Ended 3/31/2012 Consolidated Net Income 165.9 $ Interest Expense, net 109.8 Income Taxes 92.9 Depreciation and Amortization 469.7 Smurfit-Stone Adjusted EBITDA for the period April 1, 2011 to May 27, 2011 (1) 86.0 Additional Permitted Charges (1) 324.4 Credit Agreement EBITDA 1,248.7 $ Current Portion of Debt 260.0 $ Long-Term Debt due after one year 3,148.4 Total Debt 3,408.4 Less: Hedge Adjustments Resulting from Terminated Swaps (0.3) Total Debt Less Hedge Adjustments 3,408.1 $ Plus: Letters of Credit, Guarantees and Other Adjustments 68.1 Total Funded Debt 3,476.2 $ Leverage Ratio at March 31, 2012 2.78x (1) As specified in our Credit Agreement dated May 27, 2011.
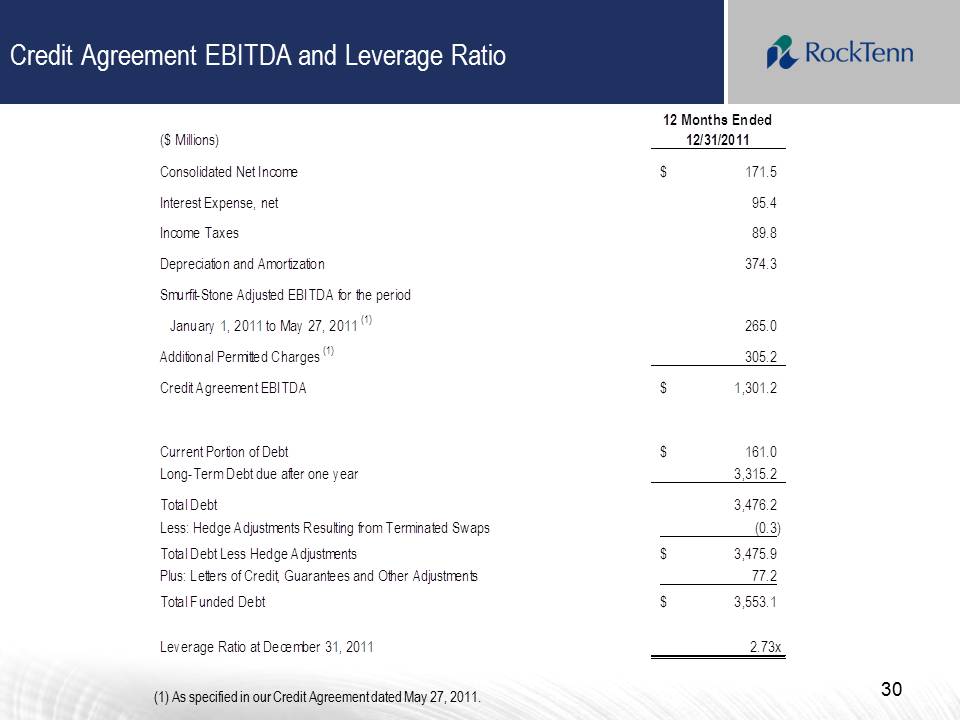
Credit Agreement EBITDA and Leverage Ratio 30 (1) As specified in our Credit Agreement dated May 27, 2011. ($ Millions) 12 Months Ended 12/31/2011 Consolidated Net Income 171.5 $ Interest Expense, net 95.4 Income Taxes 89.8 Depreciation and Amortization 374.3 Smurfit-Stone Adjusted EBITDA for the period January 1, 2011 to May 27, 2011 (1) 265.0 Additional Permitted Charges (1) 305.2 Credit Agreement EBITDA 1,301.2 $ Current Portion of Debt 161.0 $ Long-Term Debt due after one year 3,315.2 Total Debt 3,476.2 Less: Hedge Adjustments Resulting from Terminated Swaps (0.3) Total Debt Less Hedge Adjustments 3,475.9 $ Plus: Letters of Credit, Guarantees and Other Adjustments 77.2 Total Funded Debt 3,553.1 $ Leverage Ratio at December 31, 2011 2.73x
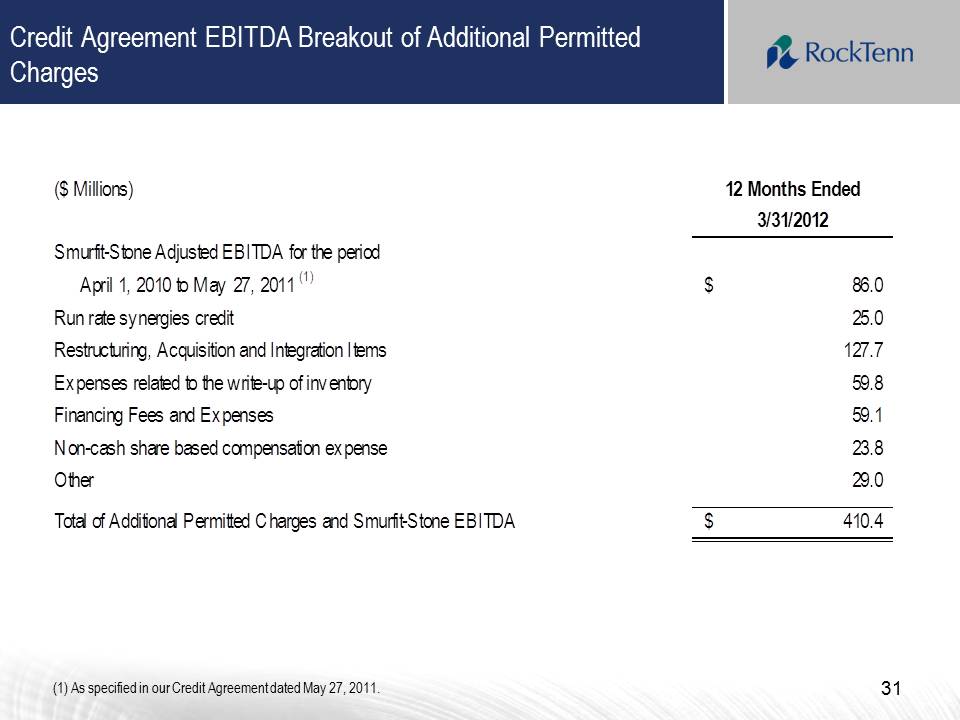
Credit Agreement EBITDA Breakout of Additional Permitted Charges 31 ($ Millions) 12 Months Ended 3/31/2012 Smurfit-Stone Adjusted EBITDA for the period April 1, 2010 to May 27, 2011 (1) 86.0 $ Run rate synergies credit 25.0 Restructuring, Acquisition and Integration Items 127.7 Expenses related to the write-up of inventory 59.8 Financing Fees and Expenses 59.1 Non-cash share based compensation expense 23.8 Other 29.0 Total of Additional Permitted Charges and Smurfit-Stone EBITDA 410.4 $ (1) As specified in our Credit Agreement dated May 27, 2011.
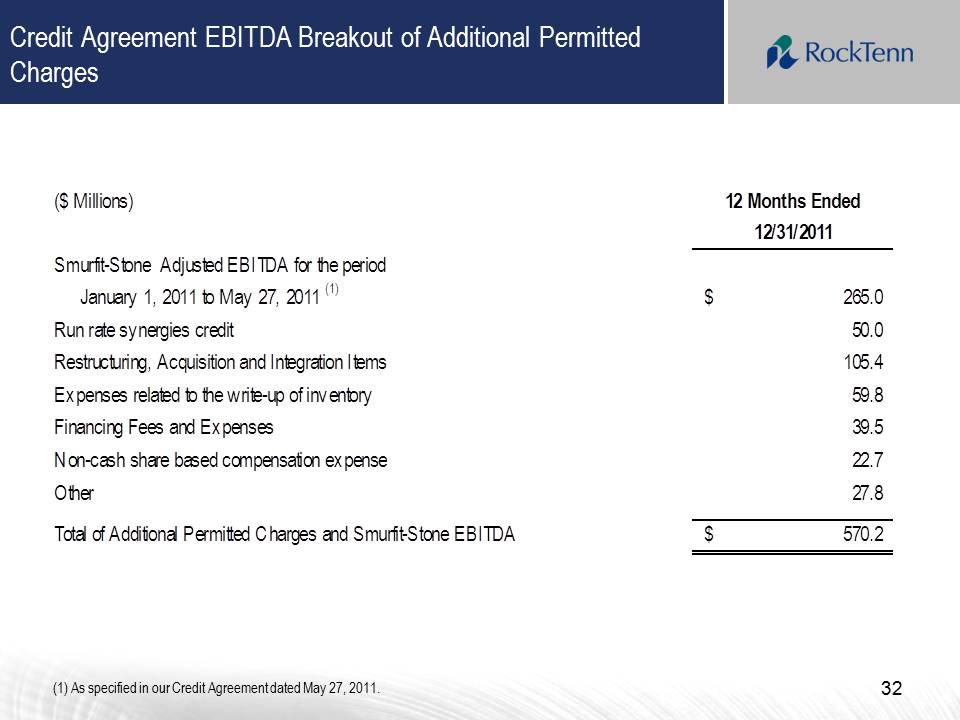
Credit Agreement EBITDA Breakout of Additional Permitted Charges 32 ($ Millions) 12 Months Ended 12/31/2011 Smurfit-Stone Adjusted EBITDA for the period January 1, 2011 to May 27, 2011 (1) 265.0 $ Run rate synergies credit 50.0 Restructuring, Acquisition and Integration Items 105.4 Expenses related to the write-up of inventory 59.8 Financing Fees and Expenses 39.5 Non-cash share based compensation expense 22.7 Other 27.8 Total of Additional Permitted Charges and Smurfit-Stone EBITDA 570.2 $ (1) As specified in our Credit Agreement dated May 27, 2011.
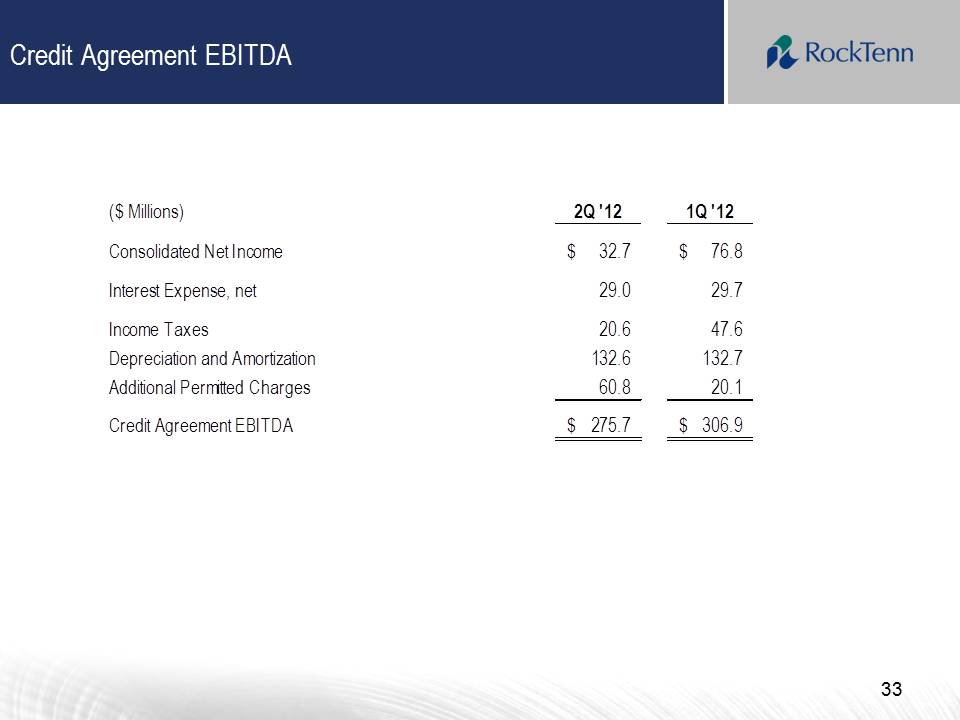
Credit Agreement EBITDA 33 ($ Millions) 2Q '12 1Q '12 Consolidated Net Income 32.7 $ 76.8 $ Interest Expense, net 29.0 29.7 Income Taxes 20.6 47.6 Depreciation and Amortization 132.6 132.7 Additional Permitted Charges 60.8 20.1 Credit Agreement EBITDA 275.7 $ 306.9 $

RockTenn