Attached files
| file | filename |
|---|---|
| 8-K - 8-K - OCCIDENTAL PETROLEUM CORP /DE/ | a12-10496_18k.htm |
| EX-99.5 - EX-99.5 - OCCIDENTAL PETROLEUM CORP /DE/ | a12-10496_1ex99d5.htm |
| EX-99.1 - EX-99.1 - OCCIDENTAL PETROLEUM CORP /DE/ | a12-10496_1ex99d1.htm |
| EX-99.3 - EX-99.3 - OCCIDENTAL PETROLEUM CORP /DE/ | a12-10496_1ex99d3.htm |
| EX-99.2 - EX-99.2 - OCCIDENTAL PETROLEUM CORP /DE/ | a12-10496_1ex99d2.htm |
EXHIBIT 99.4
|
|
Occidental Petroleum Corporation First Quarter 2012 Earnings Conference Call April 26, 2012 |

|
|
2 Net Income - $1.6 Billion in 1Q12 vs. $1.5 Billion in 1Q11 EPS $1.92 (diluted) vs. $1.90 (diluted) in 1Q11. Several factors lowered earnings during 1Q12 by about 5 cents per diluted share, including: higher insurgent activity in Colombia resulting in pipeline interruptions; a maintenance-related shutdown in Qatar; field shut-in due to labor disputes which have shut down the pipeline in Yemen, and; inclement weather at our Elk Hills operations; partially offset by additional oil entitlements in Libya, related to the initial start-up phase of operations after the 2011 civil unrest. First Quarter 2012 Earnings – Highlights |
|
|
3 First Quarter 2012 Earnings – Oil & Gas Segment Variance Analysis – 1Q12 vs. 1Q11 Core Results for 1Q12 of $2.5 B vs. $2.5 B in 1Q11 * Includes higher foreign exchange losses and higher ad valorem taxes ($ in millions) $2,510 $514 $25 $209 $180 $67 $49 $40 $2,504 1Q11 Sales Price Sales Volume Higher Operating Costs Higher DD&A Rate Higher G&A Costs Higher Expl. Exp. All Others * 1Q12 |
|
|
4 1Q12 1Q11 Oil and Gas Production Volumes (mboe/d) 755 730 1Q12 production of 755 mboe/d was the highest in the Company’s history and was up over 3% from 1Q11. We are the largest liquids producer in the US lower 48 states and grew our oil production from 1Q11 by 10% to 244 mb/d. Our total domestic production was 455 mboe/d, the sixth consecutive domestic volume record for the company, in line with our guidance of 455 to 457 mboe/d. Inclement weather, which resulted in numerous power outages in California, reduced Elk Hills gas production by about 11 mmcf per day. Our total domestic production was about 13% higher than 1Q11. Latin America volumes were 26 mboe/d. Colombia’s production of 24 mb/d was about 7 mb/d lower than its typical production capacity due to higher insurgent activity that resulted in pipeline interruptions. First Quarter 2012 Earnings – Oil & Gas Production |
|
|
5 In the Middle East region: Libya production was 20 mb/d, which included additional entitlements related to the post-2011 civil-unrest period. In Iraq, we produced 5 mb/d, a decrease of 4 mb/d from 4Q11 volumes. The lower volume is directly related to reduced spending levels. Yemen production was 17 mb/d, a decrease of 6 mb/d from 4Q11. The decrease reflected the expiration of the Masila Field contract in mid-December, partially offset by the timing of cost recovery volumes which are typically higher in the first half of the year. In Oman, 1Q12 production was 74 mboe/d, a decrease of 2 mboe/d 4Q11. The decrease was attributable to operational issues. In Qatar, 1Q12 production was 72 mb/d, a decrease of 4 mb/d over 4Q11, resulting from a maintenance shutdown in March. For Dolphin and Bahrain combined, production increased 3 mboe/d from 4Q11. First Quarter 2012 Earnings – Oil & Gas Production |
|
|
6 As a result of higher year-over-year average oil prices and other factors affecting production sharing and similar contracts, 1Q12 production was lower by 10 mboe/d from 1Q11. These factors did not materially affect production compared to 4Q11. Our 1Q12 sales volumes were 745 mboe/d. The 10 mboe/d difference, compared to the production volumes, is larger than the typical difference between production and sales, and was due entirely to the timing of liftings, almost all of which was related to Libya and Iraq. First Quarter 2012 Earnings – Oil & Gas Production |
|
|
7 1Q12 realized prices were mixed for our products compared to 4Q11. Our worldwide crude oil realized price was $107.98 per barrel, an increase of 8%, worldwide NGLs were $52.51 per barrel, a decrease of about 5%, and domestic natural gas prices were $2.84 per mcf, a decline of 21%. Realized oil prices for the quarter represented 105% of the average WTI and 91% of the average Brent price. Realized NGL prices were 51% of WTI and realized domestic gas prices were 100% of the average NYMEX price. The NGL realization is low by historical standards and indicates a troubling trend. Over the last five years, domestic NGL realizations have dropped from about 73% to 52% of WTI. Absolute realized price of NGLs is not significantly different than five years ago. Price changes at current global prices affect our quarterly earnings before income taxes by $36 million for a $1.00 per barrel change in oil prices and $8 million for a $1.00 per barrel change in NGL prices. A swing of 50 cents per million BTUs in domestic gas prices affects quarterly pre-tax earnings by about $35 million. First Quarter 2012 Earnings – Oil & Gas Segment – Realized Prices |
|
|
8 First Quarter 2012 Earnings – Oil & Gas Segment 1Q12 1Q11 Reported Segment Earnings ($mm) $2,504 $2,468 WTI Oil Price ($/bbl) $102.93 $94.10 Brent Oil Price ($/bbl) $118.35 $104.96 NYMEX Gas Price ($/mcf) $2.83 $4.27 Oxy’s Realized Prices Worldwide Oil ($/bbl) $107.98 $92.14 + 17% year-over-year Worldwide NGLs ($/bbl) $52.51 $52.64 ~ unchanged US Natural Gas ($/mcf) $2.84 $4.21 - 32.5% year-over-year |
|
|
9 Oil and gas cash production costs were $14.00 a boe for 1Q12, compared with last year's twelve-month costs of $12.84 a boe and 4Q11 costs of $14.22 per boe. The cost increase reflects higher well maintenance activity. Taxes other than on income, which are directly related to product prices, were $2.49 per boe for 1Q12, compared to $2.21 per boe for all of 2011. 1Q12 exploration expense, was $98 million, in line with our guidance. First Quarter 2012 Earnings – Oil & Gas Segment – Production Costs and Taxes |
|
|
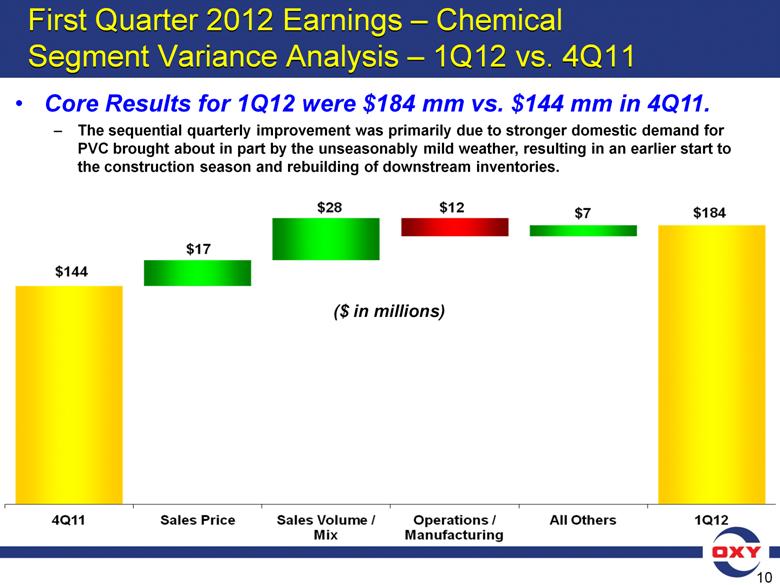
10 First Quarter 2012 Earnings – Chemical Segment Variance Analysis – 1Q12 vs. 4Q11 Core Results for 1Q12 were $184 mm vs. $144 mm in 4Q11. The sequential quarterly improvement was primarily due to stronger domestic demand for PVC brought about in part by the unseasonably mild weather, resulting in an earlier start to the construction season and rebuilding of downstream inventories. ($ in millions) $144 $17 $ 28 $12 $7 $ 184 4Q11 Sales Price Sales Volume / Mix Operations / Manufacturing All Others 1Q12 |
|
|
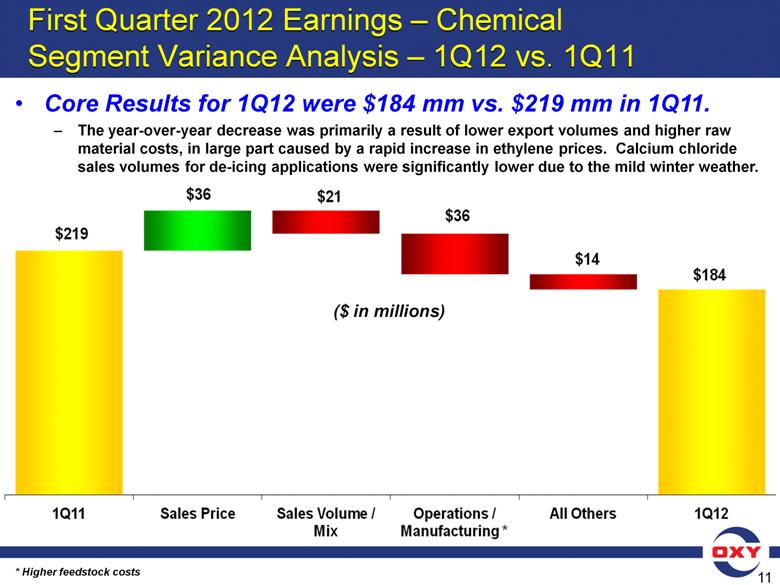
11 First Quarter 2012 Earnings – Chemical Segment Variance Analysis – 1Q12 vs. 1Q11 Core Results for 1Q12 were $184 mm vs. $219 mm in 1Q11. The year-over-year decrease was primarily a result of lower export volumes and higher raw material costs, in large part caused by a rapid increase in ethylene prices. Calcium chloride sales volumes for de-icing applications were significantly lower due to the mild winter weather. * Higher feedstock costs ($ in millions) $219 $36 $21 $36 $14 $ 184 1Q11 Sales Price Sales Volume / Mix Operations / Manufacturing * All Others 1Q12 |
|
|
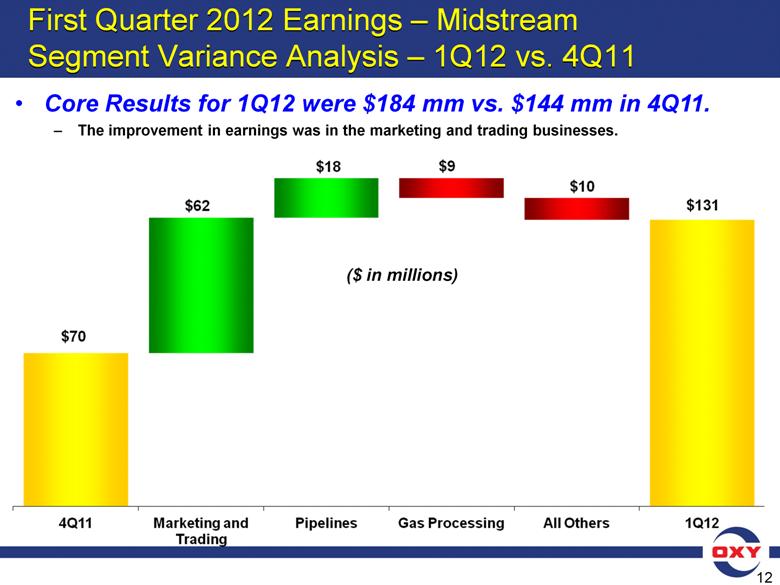
12 First Quarter 2012 Earnings – Midstream Segment Variance Analysis – 1Q12 vs. 4Q11 ($ in millions) Core Results for 1Q12 were $184 mm vs. $144 mm in 4Q11. The improvement in earnings was in the marketing and trading businesses. $70 $62 $18 $9 $10 $131 4Q11 Marketing and Trading Pipelines Gas Processing All Others 1Q12 |
|
|
13 The worldwide effective tax rate was 42% for 1Q12. The increase over our guidance was due to higher Libya liftings. Our 1Q12 US and foreign tax rates are included in the “Investor Relations Supplemental Schedules.” First Quarter 2012 Earnings – Taxes |
|
|
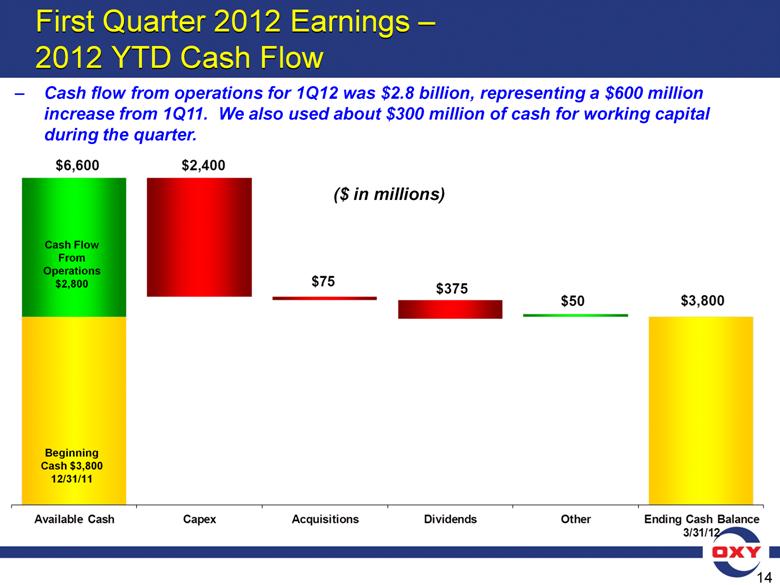
14 First Quarter 2012 Earnings – 2012 YTD Cash Flow Cash flow from operations for 1Q12 was $2.8 billion, representing a $600 million increase from 1Q11. We also used about $300 million of cash for working capital during the quarter. ($ in millions) Cash Flow From Operations $2,800 Beginning Cash $3,800 12/31/11 $6,600 $50 $75 $375 $2,400 $3,800 Available Cash Capex Acquisitions Dividends Other Ending Cash Balance 3/31/12 |
|
|
15 First Quarter 2012 Earnings – 1Q12 Capital Expenditures Capital expenditures for 1Q12 were $2.4 billion, slightly lower than the run rate incurred in 4Q11. Year-to-date capital expenditures by segment were 84% in oil and gas, 14% in midstream and the remainder in chemicals. |
|
|
16 First Quarter 2012 Earnings – Shares Outstanding & Debt/Capital Shares Outstanding (mm) 1Q12 3/31/12 Weighted Average Basic 810.5 Weighted Average Diluted 811.3 Basic Shares Outstanding 810.5 Diluted Shares Outstanding 811.3 3/31/12 12/31/11 Debt/Capital 13% 13% |
|
|
17 First Quarter 2012 Earnings – Key Performance Metrics Occidental’s 1Q12 production set an all time record for the Company and, for the sixth consecutive quarter, the domestic oil and gas segment produced record volumes. 1Q12 domestic production of 455 mboe/d, consisting of 316 mb/d of liquids and 834 mmcf/d of gas, was an increase of 6 mboe/d to 4Q11. All of the domestic production growth over 4Q11 was in liquids, which grew from 310 mb/d to 316 mb/d. Gas production was flat. Compared to 1Q11, our domestic liquids production grew by 35 mb/d and gas production by 100 mmcf/d. As you may recall, Occidental is the largest producer of liquids in the lower 48 states. |
|
|
18 First Quarter 2012 Earnings – Key Performance Metrics Focusing on total return to our shareholders, in February, we increased our annual dividends by $0.32, or by 17%, to $2.16 per share. Our annualized return on equity for the first three months of 2012 was 16% and return on capital employed was 14%. During 1Q12, the Company generated cash flow from operations of $2.8 billion, a 25% increase from 1Q11. |
|
|
19 In 1Q12, our capital spending was $2.4 billion. The current capital run rate may come down over the course of the year as certain projects, such as the Elk Hills gas plant, are completed. In addition, as indicated in the last quarter’s conference call, we will review our capital program around mid-year and adjust as conditions dictate. First Quarter 2012 Earnings – Capital Program |
|
|
20 First Quarter 2012 Earnings – Capital Program Domestic Operations – California The rig count at the end of the 1Q12 was about the same as the 31 we were running at year-end 2011. We expect the rig count to remain at current levels through the middle of the year; Relative to last year. we are seeing improvement with respect to permitting issues in the state. We have received approved field rules and permits for both injection wells and drilling locations. The regulatory agency is responsive and committed to working through the backlog of permits. We expect to maintain our capital program at current levels for about the first half of the year, which will enable us to continue to grow our production volumes. We will reassess our capital program as the year progresses and the current regulatory environment clearly stabilizes; Starting in early 2011, we shifted our development program focusing on conventional and non-conventional opportunities outside the traditional Elk Hills area. |
|
|
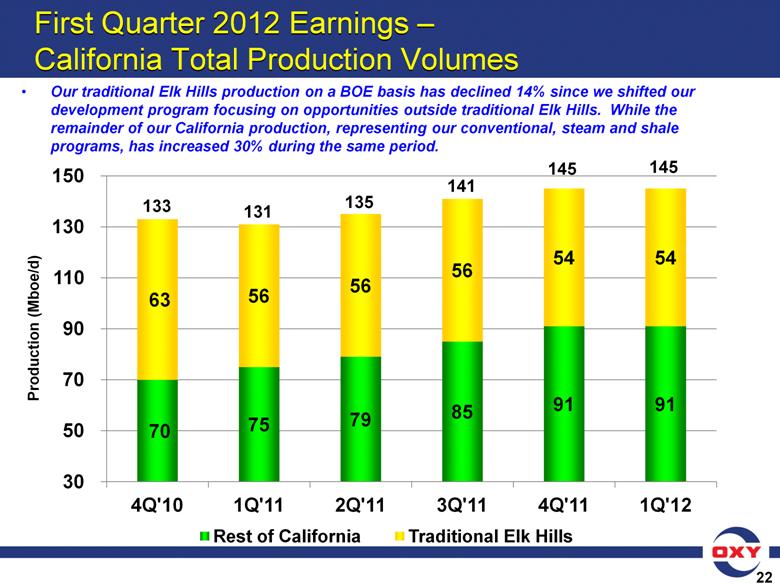
21 First Quarter 2012 Earnings – Capital Program Domestic Operations – California Our traditional Elk Hills production on a BOE basis has declined 14% since we began this program, while the remainder of our California production, representing our conventional, steam and shale programs, has increased 30% during the same period. Essentially all of the increase came from liquids. Excluding the traditional Elk Hills, liquids production was up about 35%, or about 17 mb/d. As we previously discussed, we are shifting our program to emphasize it and liquids-rich production. We have started to see the effect of this shift in 1Q12 production. We expect most of the California production growth in the near future to come from liquids. While in the current environment we don't expect to drill many gas wells, the new Elk Hills gas plant will positively affect our operational efficiency and production in the back half of the year. |
|
|
22 Production (Mboe/d) Our traditional Elk Hills production on a BOE basis has declined 14% since we shifted our development program focusing on opportunities outside traditional Elk Hills. While the remainder of our California production, representing our conventional, steam and shale programs, has increased 30% during the same period. 133 131 135 141 145 145 First Quarter 2012 Earnings – California Total Production Volumes 70 75 79 85 91 91 63 56 56 56 54 54 30 50 70 90 110 130 150 4Q'10 1Q'11 2Q'11 3Q'11 4Q'11 1Q'12 Rest of California Traditional Elk Hills |
|
|
23 Production (Mboe/d) Essentially all of the production increase outside traditional Elk Hills came from liquids. Excluding the traditional Elk Hills, liquids production was up about 35%, or about 17 mb/d. As we previously discussed, we are shifting our program to emphasize oil and liquids-rich production. 90 91 93 96 99 101 First Quarter 2012 Earnings – California Liquids Production Volumes 49 54 56 60 64 66 41 37 37 36 35 35 20 30 40 50 60 70 80 90 100 4Q'10 1Q'11 2Q'11 3Q'11 4Q'11 1Q'12 Rest of California Traditional Elk Hills |
|
|
24 OCCIDENTAL PETROLEUM TOTAL CALIFORNIA PRODUCTION VOLUMES Volumes in MBOEPD Change from Q4'10 Q1'11 Q2'11 Q3'11 Q4'11 Q1'12 Q4'10 vs Q1'12 Traditional Elk Hills 63 56 56 56 54 54 -14% Rest of California 70 75 79 85 91 91 30% Total California 133 131 135 141 145 145 9% |
|
|
25 OCCIDENTAL PETROLEUM TOTAL CALIFORNIA PRODUCTION VOLUMES Liquids in MBOEPD; Gas Volumes in MMCFPD Change from Liquids Q4'10 Q1'11 Q2'11 Q3'11 Q4'11 Q1'12 Q4'10 vs Q1'12 Traditional Elk Hills - Liquids 41 37 37 36 35 35 -15% Rest of California - Liquids 49 54 56 60 64 66 35% Total California 90 91 93 96 99 101 12% Gas Q4'10 Q1'11 Q2'11 Q3'11 Q4'11 Q1'12 Q4'10 vs Q1'12 Traditional Elk Hills - Gas 131 114 114 118 112 117 -11% Rest of California - Gas 128 128 138 151 164 150 17% Total California - Gas 259 242 252 269 276 267 3% |
|
|
4 First Quarter 2012 Earnings Capital Program Domestic Operations -Elkermian • The rig count at the end of 1Q12 was 26, three more than we were running at year-end 2011. - We expect our rig count to remain at about this level during The year; • We have significant acreage positions in a number of plays in the Permian basin that will give us ample future growth opportunities. • Our total acreage position in these plays, as broadly defined, is approximately 2.9 million gross, or about 1.0 million acres net. • Based on what we currently believe are the likely limits of these plays, our gross and net working interest acreages are 1.0 million and 300,000 acres, respectively. • We are currently operating 24 rigs in these areas. • Additional-36 74 wells in which we have a working interest were drilled by third party operators during 1Q12. We currently expect about 300 additional wells to be drilled by those operators the rest of the year. • We expect that our program and the third-party drilling will accelerate our Permian production in the latter part of this year. |
|
|
27 First Quarter 2012 Earnings – Oxy Acreage in Select Permian Basin Plays Acreage in Select Permian Basin Plays Thousands of Acres Play Gross Net Working Interest Gross Net Working Interest Delaware Basin Bone Spring 560 200 260 90 Delaware 380 130 80 30 Wolfcamp Delaware 320 80 130 30 Avalon 280 70 110 30 Wabo 190 40 60 10 Yeso 180 70 70 30 Wolfbone 120 30 90 20 Total Delaware Basin 2,030 620 800 240 Midland Basin Cline Shale 390 160 100 40 Wolfcamp Midland 280 110 70 30 Wolfberry 250 100 50 20 Total Midland Basin 920 370 220 90 2,950 990 1,020 330 Oxy Acreage Oxy Acreage in Likely Limits |
|
|
28 First Quarter 2012 Earnings – Capital Program Domestic Operations – Midcontinent and Other In Williston, our rig count was 13 at March 319 down from 14 at year-end 20111 • We expect that our rig count will be about 6 by the end of 2012. As mentioned in last quarter’s conference call, we have shifted some capital from this area to California and the Permian; • Natural gas prices in the US, continue at depressed levels. As a result, we have cut back our pure gas drilling, If the current low NGL prices continue, cutbacks in liquid-rich wells may be necessary. |
|
|
29 First Quarter 2012 Earnings – Capital Program International Operations The Al Hon Shah gas project is approximately 38% complete and is progressing as planned. This project made up about 10% of our total capital program for 1Q12. If spending continues at current levels, we will see higher than anticipated spending in the remainder of 2012. However, total development capital for the project is expected to be in line with previous estimates. • In Iraq, the spending declined compared to 4Q11 levels as a result of contract approval delays However, recently a number of major contracts were approved covering drilling and completion services, workovers and logistics support. |
|
|
30 As we look ahead to 2Q12, we expect oil and gas production to be as follows: We expect our domestic production to grow by 3 to 4 mboe/d each month from the current quarterly average of 455 mboe/d, which would correspond to a 6 to 8 mboe/d increase for the quarter. Internationally, Colombia 1Q12 production was reduced by 7 mb/d resulting from increased insurgent attacks on the pipeline. Production should go back up to normal levels assuming no significant insurgent activity. Production has been at about normal levels so far in the current quarter. First Quarter 2012 Earnings – Oil and Gas – 2Q12 Production Outlook |
|
|
31 The Middle East region production is expected to be as follows: Production has resumed in our operations in Libya and averaged 20 mb/d in 1Q12, including entitlements from the post-2011 civil-unrest period. We expect 2Q12 volumes to be about 11 mb/d. We expect production to increase gradually during the course of the year reaching the historical levels of about 14 mb/d by year-end. In Iraq, as discussed previously, production levels depend on capital spending amounts. We are unable to predict the timing of the capital spend. For Dolphin, a planned plant shutdown reduced production in January and February. Production increased significantly in March. We expect 2Q12 production to increase modestly over 1Q12 volumes. In the remainder of the Middle East, we expect production to be comparable to 1Q12 volumes. First Quarter 2012 Earnings – Oil and Gas – 2Q12 Production Outlook |
|
|
32 We expect sales and production volumes in 2Q12 to be about equal, subject to the scheduling of liftings. A $5.00 change in global oil prices would impact our PSC daily volumes by about 3 mboe/d. We expect exploration expense to be about $125 million for seismic and drilling for our exploration programs in 2Q12. First Quarter 2012 Earnings – 2Q12 Outlook – Oil and Gas |
|
|
33 The chemical segment 2Q12 earnings are estimated to be about $175 million. We expect lower natural gas prices and improvements in the exports of vinyl chloride monomer (VCM) and polyvinyl chloride (PVC) to be offset by several planned maintenance turnarounds and an anticipated slowdown in domestic PVC demand following the unusually strong start in 1Q12. We expect our combined worldwide tax rate in 2Q12 to decrease to about 41%. The decrease from 1Q12 reflects lower Libya liftings. First Quarter 2012 Earnings – 2Q12 Outlook – Chemicals & Taxes |
|
|
34 First Quarter 2012 Earnings – Summary To summarize: We closed the quarter with an all time record total Company production and the sixth consecutive record domestic oil and gas production. As the largest liquids producer in the lower 48 states, we increased our liquids production by 6 mb/d from the 4Q11 and by 35 mb/d from 1Q11; We increased our annual dividend rate by 17 percent to $2.16 per share; Our capital spending was $2.4 billion in 1Q11, with the Al Hosn Shah gas project increasing to about 10 percent of the total spending; The business generated cash flow from operations of $2.8 billion in the quarter. |
|
|
35 First Quarter 2012 Earnings – Q&A |