Attached files
| file | filename |
|---|---|
| 8-K - FIRST MERCHANTS CORPORATION - 1ST QUARTER 2012 EARNINGS PRESENTATION SLIDES - FIRST MERCHANTS CORP | f8kearningsslide04262012.htm |

1
First Merchants Corporation
1st Quarter 2012
Earnings Call
1st Quarter 2012
Earnings Call
April 26, 2012

2
Michael C. Rechin
President
and Chief Executive Officer

3
Forward-Looking Statement
FORWARD-LOOKING STATEMENT
The Corporation may make forward-looking statements about its
relative business outlook. These forward-looking statements and
all other statements made during this meeting that do not
concern historical facts are subject to risks and uncertainties that
may materially affect actual results.
Specific forward-looking statements include, but are not limited
to, any indications regarding the financial services industry, the
economy and future growth of the balance sheet or income
statement.
Please refer to our press releases, Form 10-Qs and 10-Ks
concerning factors that could cause actual results to differ
materially from any forward-looking statements.

4
1st QUARTER 2012 HIGHLIGHTS
• EPS
– $.46 per share (171% year-over-year growth)
– Core EPS: $.25 per share (47% year-over-year growth)
– SCB bargain purchase gain of $.21 per share
• SCB FDIC-Modified Whole-Bank Transaction
• Core Revenue Growth
– $1.7M increase year-over-year
• Balance Sheet Well Positioned for Growth
– Strong Core Funding Base
– Tangible Common Equity: 7.07%
– Tier 1 Common: 9.20%
– Lower Risk Profile

5
Mark K. Hardwick
Executive Vice President
and Chief Financial Officer

6
2010 2011 Q1-’11
Q1-’12
1. Investments
$ 827 $ 946 $ 886 $ 960
2. Loans 2,857 2,731 2,766 2,815
3. Allowance (83) (71) (81) (70)
4. CD&I & Goodwill 154 150 153 150
5. BOLI 97 124 102 123
6. Other 319 293 291 258
7. Total Assets $4,171 $4,173 $4,117 $4,236
($ in Millions)
TOTAL ASSETS

7
Loan Composition (as of 3/31/12)
YTD Yield = 5.17%
LOAN AND CREDIT DETAIL

8
INVESTMENT PORTFOLIO
(as of 3/31/12)
(as of 3/31/12)

9
2010 2011
Q1-’11 Q1-’12
1. Customer Non-Maturity
Deposits
$2,127 $2,196 $2,083 $2,273
2. Customer Time Deposits 996 816 943 836
3. Brokered Deposits 146 123 126 170
4. Borrowings 277 378 305 287
5. Other Liabilities 28 34 56 31
6. Hybrid Capital 142 111 142 111
7. Preferred Stock (CPP) 68 - 68 -
8. Preferred Stock (SBLF) - 91 - 91
9. Common Equity
387 424 394 437
10. Total Liabilities and Capital $4,171 $4,173 $4,117 $4,236
($ in Millions)
TOTAL LIABILITIES AND CAPITAL

10
DEPOSITS
(as of 3/31/12)
(as of 3/31/12)

11
CAPITAL RATIOS
2010 2011 Q1-’11 Q1-’12
1. Total Risk-Based
Capital Ratio 15.74% 16.54% 15.66% 16.39%
2. Tier 1 Risk-Based
Capital Ratio 12.82% 13.92% 13.05% 14.14%
3. Leverage Ratio 9.50% 10.17% 9.80% 10.61%
4. Tier 1 Common Risk-
Based Capital Ratio 7.64% 8.83% 7.75% 9.20%
5. TCE/TCA 5.86% 6.84% 6.16% 7.07%

12
|
|
Q1 - '10
|
Q2 - '10
|
Q3 - '10
|
Q4 - '10
|
Q1 - '11
|
Q2 - '11
|
Q3 - '11
|
Q4 - '11
|
Q1 - '12
|
|
Net Interest Income - FTE ($ in millions)
|
$37.8 |
$37.7
|
$37.2 |
$36.7
|
$36.9
|
$37.3 |
$37.3
|
$37.6 |
$37.6 |
|
Tax Equivalent Yield on Earning
Assets |
5.39%
|
5.38%
|
5.38%
|
5.13%
|
5.11%
|
5.04%
|
5.01%
|
4.83%
|
4.74%
|
|
Cost of Supporting Liabilities
|
1.57%
|
1.48%
|
1.45%
|
1.30%
|
1.16%
|
1.05%
|
0.99%
|
0.84%
|
0.78%
|
|
Net Interest Margin
|
3.82%
|
3.90%
|
3.93%
|
3.83%
|
3.95%
|
3.99%
|
4.02%
|
3.99%
|
3.96%
|
|
|
NET INTEREST MARGIN

13
2010 2011 Q1-’11 Q1-’12
1. Service Charges on Deposit Accounts $13.3 $12.0 $
2.8 $2.8
2. Trust
Fees 7.7 7.7 2.0
2.0
3. Insurance Commission Income 6.2 5.7 1.9 1.7
4. Electronic Card Fees 6.1
6.5 1.5 1.7
5. Cash Surrender Value of Life Ins 2.1 2.6 0.6 1.4
6. Gains on Sales Mortgage Loans 6.8 7.4 1.9 2.0
7. Securities Gains/Losses 1.9 2.0 0.1 0.8
8. Gain on FDIC-Modified Whole-Bank
Transaction - -
- 9.1
9. Other 4.4 5.2 1.1 1.2
10. Total $48.5 $49.1 $11.9 $22.7
11. Adjusted Non-Interest Income1 $46.6 $47.1 $11.8 $12.8
1Adjusted for Bond Gains & Losses and Gain on FDIC-Modified Whole-Bank Transaction
($ in Millions)
NON-INTEREST INCOME

14
NON-INTEREST EXPENSE
2010
2011
Q1-’11 Q1-’12
1. Salary & Benefits $73.3 $74.7 $17.2 $19.4
2. Premises & Equipment 17.2 16.9 4.5 4.4
3. Core Deposit Intangible 4.7 3.5 1.1 0.5
4. Professional Services 1.4 2.2 0.6 0.7
5. OREO/Credit-Related Expense 14.6
10.6 3.2 2.2
6. FDIC Expense 8.1 5.5 2.1 1.1
7. Outside Data Processing 5.1 5.7 1.4 1.4
8. Marketing 2.0 2.0 0.4 0.4
9. Other 15.9 14.8 3.4 3.9
10. Total $142.3 $135.9 $33.9 $34.0
($ in Millions)
15
EARNINGS
2010
2011 Q1-’11 Q1-’12
1. Net Interest Income-FTE $149.4 $149.1 $36.9 $37.6
2. Non Interest
Income1 46.6 47.1 11.8 12.8
3. Non Interest Expense
(142.3) (135.9) (33.9) (34.0)
4. Pre-Tax Pre-Provision Earnings $53.7 $60.3 $14.8 $16.4
5. Provision
(46.5) (22.6) (5.6) (4.9)
6. Adjustments1
1.9 2.0 0.1 9.9
7. Taxes - FTE (2.3)
(14.4) (3.8) (7.1)
8. Gain/(Loss) on CPP/Trust Preferred 10.1 (12.3) — —
9. Preferred Stock Dividend (5.2) (4.0)
(1.0) (1.1)
10. Net Income Avail. for Distribution $11.7 $ 9.0 $ 4.5 $13.2
11. EPS $0.48 $0.34
$0.17 $0.46
1Adjusted for Bond Gains & Losses and Gain on FDIC-Modified Whole-Bank Transaction
($ in Millions)

16
EARNINGS PER SHARE
1
1
2
2010 Q1 Q2 Q3 Q4 Total
1. Actual $ .01 $ .35 $ .02 $ .10 $ .48
2. Adjusted $ .01 ($.05) $ .02 $ .10 $ .08
2011 Q1 Q2 Q3 Q4 Total
3. Actual $ .17 $ .18 ($.25) $ .24 $ .34
4. Adjusted $ .17 $ .18 $ .21 $ .24 $ .80
2012
Q1 Q2 Q3 Q4 Total
5. Actual $ .46 - - - $ .46
6. Adjusted $ .25 - - - $ .25
1Adjusted for gains and losses on CPP/Trust Preferred refinance and repayment net of
taxes (Line 8 on slide 15)
2Adjusted for Gain on FDIC-Modified Whole-Bank Transaction

17
John J. Martin
Senior Vice President
and Chief Credit Officer
18
ASSET QUALITY SUMMARY
19
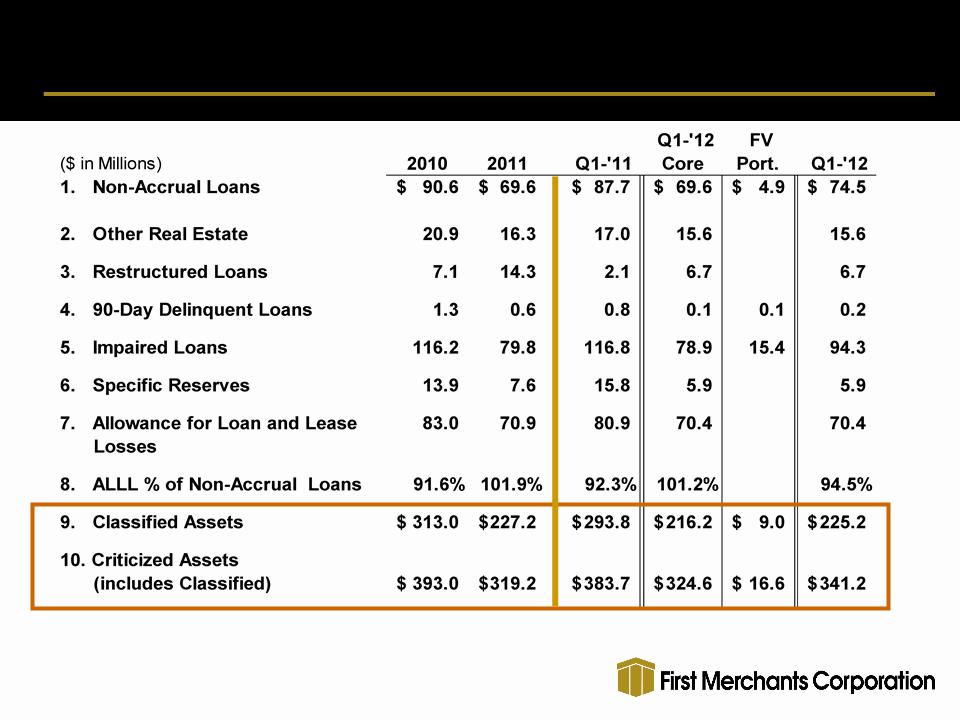
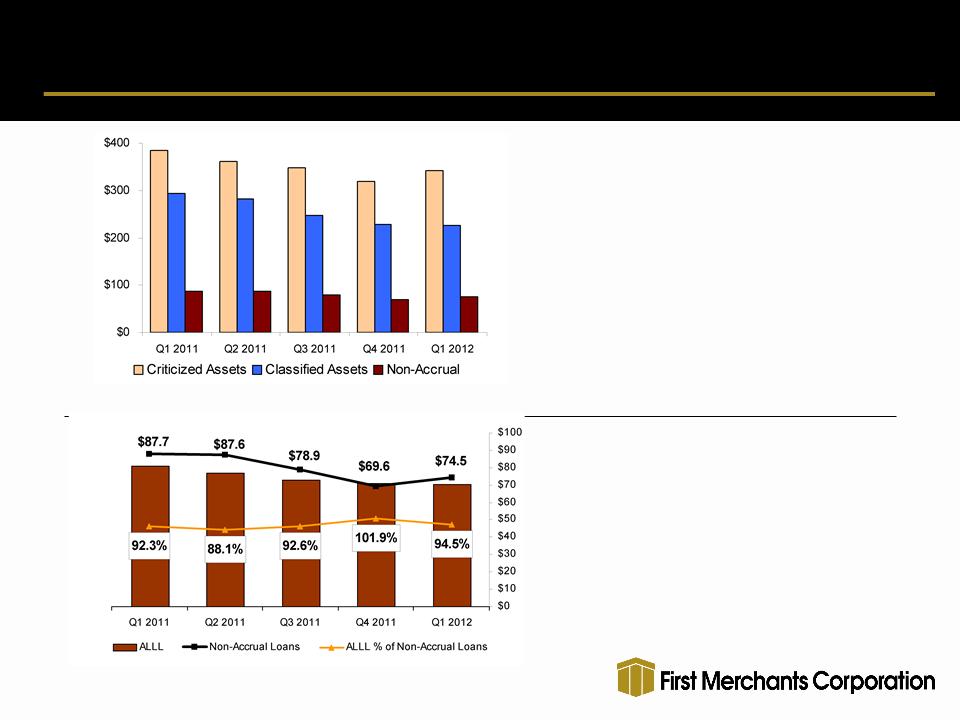
CREDIT METRICS AND ALLL COVERAGE
Criticized Assets down 11.1% Q1-’12
compared to Q1-’11 and up 6.9% linked
quarter
compared to Q1-’11 and up 6.9% linked
quarter
Classified Assets down 23.3% Q1-’12
compared to Q1-’11 and down .9% linked
quarter
compared to Q1-’11 and down .9% linked
quarter
Non-Accrual Loans down 15.1% Q1-’12
compared to Q1-’11 and up 7.0% linked
quarter
compared to Q1-’11 and up 7.0% linked
quarter
*Q1 2012 includes loans acquired at Fair Value
Allowance for Loan and Lease
Losses as a % of Non-Accrual
Loans reduced to 94.5%
Losses as a % of Non-Accrual
Loans reduced to 94.5%
Acquired Fair Value portfolio with
$4.9M in newly identified Non-
Accruals; Core Non-Accruals flat for
quarter.
$4.9M in newly identified Non-
Accruals; Core Non-Accruals flat for
quarter.
($ in Millions)
($ in Millions)

20
NON-PERFORMING ASSET RECONCILIATION
|
($ in millions)
|
Q4-’10
|
Q1-’11
|
Q2-’11
|
Q3-’11
|
Q4-’11
|
Q1-’12*
|
|
1. Beginning Balance NPAs & 90+ Days Delinquent
|
$ 130.8
|
$ 120.0
|
$ 107.6
|
$ 109.5
|
$ 106.7
|
$ 100.8
|
|
Non-Accrual
|
|
|
|
|
|
|
|
2. Add: New Non-Accruals*
|
27.4
|
11.7
|
26.7
|
21.4
|
10.2
|
16.4
|
|
3. Less: To Accrual/Payoff/Restructured
|
( 14.5)
|
( 3.2)
|
( 8.3)
|
( 8.7)
|
( 7.6)
|
( 2.7)
|
|
4. Less: To OREO
|
( 7.0)
|
( 2.0)
|
( 1.6)
|
( 9.7)
|
( 1.2)
|
( 2.5)
|
|
5. Less: Charge-offs*
|
( 13.9)
|
( 9.4)
|
(16.9)
|
(11.6)
|
( 10.7)
|
( 6.3)
|
|
6. Increase /(Decrease): Non-Accrual Loans
|
(8.0)
|
( 2.9)
|
( .1)
|
(8.6)
|
(9.3)
|
4.9
|
|
Other Real Estate Owned (ORE)
|
|
|
|
|
|
|
|
7. Add: New ORE Properties
|
7.2
|
2.2
|
1.6
|
9.7
|
1.2
|
2.5
|
|
8. Less: ORE Sold
|
(4.2)
|
( 3.6)
|
( 1.6)
|
( 5.0)
|
(3.3)
|
( 1.8)
|
|
9. Less: ORE Losses (write-downs)
|
( 3.6)
|
( 2.5)
|
( 1.6)
|
( 0.7)
|
(1.1)
|
( 1.4)
|
|
10. Increase /(Decrease): ORE
|
( .6)
|
( 3.9)
|
( 1.6)
|
4.0
|
( 3.2)
|
( .7)
|
|
11. Increase /(Decrease): 90 Days Delinquent*
|
( 4.0)
|
( 0.6)
|
( 0.5)
|
1.4
|
( 1.0)
|
( 0.4)
|
|
12. Increase /(Decrease): Restructured Loans
|
1.8
|
( 5.0)
|
4.1
|
.4
|
7.6
|
(7.6)
|
|
13. Total NPA Change
|
(10.8)
|
(12.4)
|
1.9
|
(2.8)
|
(5.9)
|
(3.8)
|
|
14. Ending Balance NPAs & 90+ Days Delinquent
|
$ 120.0
|
$ 107.6
|
$ 109.5
|
$ 106.7
|
$ 100.8
|
$ 97.0
|
25.8%
*Q1-’12 Includes FV portfolio loans acquired.

21
NET CHARGE-OFFS, PROVISION AND ALLOWANCE
($ in Millions)

22
Credit Summary
• Asset quality trends continue to improve
• Decrease in Restructured Loans following their return to
market terms, demonstrated performance and loss
recognition
market terms, demonstrated performance and loss
recognition
• Charge-offs and provision expense lower and in line with
improvement in credit quality
improvement in credit quality
• Total loan pipeline improving driven by mortgage and
commercial loans
commercial loans
• Fair Value portfolio of $89.7M with a composition similar
to core portfolio
to core portfolio

23
Michael C. Rechin
President
and Chief Executive Officer

24
Overview of 2012 Strategy and Tactics
“Growth and Top-Tier Performance”
“Growth and Top-Tier Performance”
• Shelby County Bank integration
• Grow revenue by intensifying revenue-generating
activity:
activity:
– Market coverage tactics . . . including SCB
– Additional investment in business banking professionals in key
markets
markets
– Retail CRM and sales management system
• Implement systems and processes to improve efficiency:
– Banking center rationalization
– Enhance systems in consumer collections, human resources
and finance
and finance
• Seek non-organic growth opportunities

25
CONTACT INFORMATION
First Merchants Corporation common stock is
traded on the NASDAQ Global Select Market
under the symbol FRME.
traded on the NASDAQ Global Select Market
under the symbol FRME.
Additional information can be found at
www.firstmerchants.com
Investor inquiries:
David L. Ortega
Investor Relations
Telephone: 765.378.8937
dortega@firstmerchants.com