Attached files
| file | filename |
|---|---|
| 8-K - FORM 8-K - OUTERWALL INC | d340149d8k.htm |
| EX-99.2 - PREPARED REMARKS FROM THE CHIEF EXECUTIVE OFFICER AND CHIEF FINANCIAL OFFICER - OUTERWALL INC | d340149dex992.htm |
| EX-99.1 - EARNINGS RELEASE FOR THE QUARTER ENDED MARCH 31, 2012 - OUTERWALL INC | d340149dex991.htm |
 Investor Update
2012 Q1
April 26, 2012
Exhibit 99.3 |
 Safe
Harbor for Forward-Looking Statements This presentation contains
statements considered forward-looking for purposes of the safe harbor provisions
under
the
Private
Securities
Litigation
Reform
Act
of
1995.
Actual
results
may
differ
materially
from
those
indicated
by
these
forward-looking
statements
as
a
result
of
various
factors,
including
those
discussed
in
our
most recent Annual Report on Form 10-K and Quarterly Report on Form 10-Q
filed with the Securities and Exchange Commission. Coinstar, Inc. assumes no
obligation and does not intend to update these forward- looking
statements. 2
©2012
Coinstar,
Inc.
All
rights
reserved.
These
materials
may
not
be
reproduced,
altered,
or
distributed
without
the
express
written
consent
of
Coinstar,
Inc. |
 2012
Full Year and Q2 Guidance As of April 26, 2012
3
2012
Full
Year
–
Kiosk
Installations,
net
Redbox
4,000 -
6,000
Coin
50 –
150
New Ventures
0 -
650
2012 Full Year Capital Expenditures
from Continuing Operations (in millions)
Redbox -
New
$133 –
$141
Redbox –
Maintenance
$7 –
$9
Coin –
New
$19 –
$22
Coin –
Maintenance
$6 –
$8
Corporate –
Other
$90 –
$95
Total
$255 –
$275
2012 Q2 Guidance (in millions, except EPS)
Revenue
$525 –
$550
Core adjusted EBITDA from continuing operations*
$114 –
$124
Core
diluted
EPS
from
continuing
operations
†
$1.09 –
$1.24
2012
Full
Year
–
Other
(in
millions,
except
EPS)
Core adjusted EBITDA from continuing operations*
$465 –
$495
Core
diluted
EPS
from
continuing
operations
†
$4.40 –
$4.80
Average diluted shares outstanding
32.6 –
33.6
Estimated effective tax rate
40%
Free
cash
flow
from
continuing
operations
‡
$130 –
$155
2012
Full
Year
–
Revenue
(in
millions)
Redbox
$1,850 –
$1,960
Coin
$300 –
$310
New Ventures
$5 –
$10
Consolidated
$2,155 –
$2,280
©2012
Coinstar,
Inc.
All
rights
reserved.
These
materials
may
not
be
reproduced,
altered,
or
distributed
without
the
express
written
consent
of
Coinstar,
Inc. |
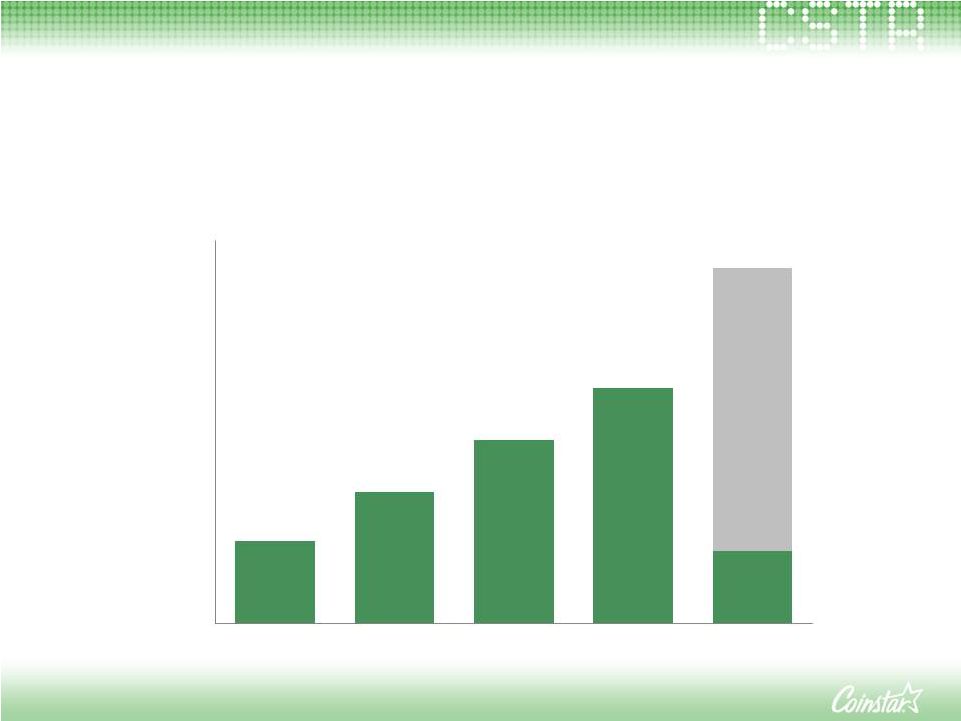 Consolidated Revenue
As of March 31, 2012
In millions
4
*Guidance as of April 26, 2012
$-
$500
$1,000
$1,500
$2,000
$2,500
$3,000
2008
2009
2010
2011
2012
$2,155 -
$2,280*
$650
$1,033
$1,436
$1,845
$568
YTD
Q1
©2012
Coinstar,
Inc.
All
rights
reserved.
These
materials
may
not
be
reproduced,
altered,
or
distributed
without
the
express
written
consent
of
Coinstar,
Inc. |
 Business Segment Information
As of March 31, 2012
*From acquisition date
Redbox *
Q1
Q2
Q3
Q4
YTD
2012
502,942
$
-
$
-
$
-
$
502,942
$
2011
362,344
$
363,862
$
389,801
$
445,591
$
1,561,598
$
2010
263,078
$
271,869
$
305,365
$
319,397
$
1,159,709
$
2009
154,697
$
188,909
$
198,064
$
231,760
$
773,430
$
2008
60,513
$
89,956
$
104,192
$
133,792
$
388,453
$
Coin
Q1
Q2
Q3
Q4
YTD
2012
19,319
$
-
$
-
$
-
$
19,319
$
2011
20,609
$
26,800
$
27,879
$
25,678
$
100,966
$
2010
15,020
$
28,043
$
27,872
$
25,382
$
96,317
$
2009
22,391
$
26,016
$
27,254
$
26,949
$
102,610
$
Coin
Q1
Q2
Q3
Q4
YTD
2012
64,826
$
-
$
-
$
-
$
64,826
$
2011
61,363
$
71,065
$
75,506
$
74,448
$
282,382
$
2010
59,918
$
70,362
$
74,669
$
71,033
$
275,982
$
2009
57,876
$
64,741
$
69,501
$
66,398
$
258,516
$
2008
59,329
$
64,585
$
71,104
$
66,608
$
261,626
$
New Ventures
Q1
Q2
Q3
Q4
YTD
2012
411
$
-
$
-
$
-
$
411
$
2011
365
$
301
$
310
$
416
$
1,392
$
2010
126
$
125
$
153
$
326
$
730
$
2009
180
$
194
$
160
$
143
$
677
$
Redbox *
Q1
Q2
Q3
Q4
YTD
2012
108,818
$
-
$
-
$
-
$
108,818
$
2011
50,821
$
74,017
$
83,499
$
76,595
$
284,932
$
2010
46,301
$
37,167
$
53,648
$
53,734
$
190,850
$
2009
20,850
$
24,568
$
26,684
$
29,469
$
101,571
$
New Ventures
Q1
Q2
Q3
Q4
YTD
2012
(5,617)
$
-
$
-
$
-
$
(5,617)
$
2011
(2,555)
$
(4,767)
$
(4,425)
$
(6,068)
$
(17,815)
$
2010
(1,488)
$
(1,927)
$
(2,248)
$
(2,560)
$
(8,223)
$
2009
(154)
$
(641)
$
(669)
$
(617)
$
(2,081)
$
Revenue
Segment Operating Income (Loss)
In thousands
5
In thousands
©2012
Coinstar,
Inc.
All
rights
reserved.
These
materials
may
not
be
reproduced,
altered,
or
distributed
without
the
express
written
consent
of
Coinstar,
Inc. |
 Business Segment Information
As of March 31, 2012
Coin
Q1
Q2
Q3
Q4
YTD
2012
8,341
$
-
$
-
$
-
$
8,341
$
2011
7,371
$
7,451
$
7,924
$
9,176
$
31,922
$
2010
7,059
$
7,562
$
7,468
$
7,632
$
29,721
$
2009
6,741
$
7,177
$
7,081
$
7,008
$
28,007
$
Redbox *
Q1
Q2
Q3
Q4
YTD
2012
32,443
$
-
$
-
$
-
$
32,443
$
2011
27,098
$
27,360
$
30,910
$
30,062
$
115,430
$
2010
22,121
$
23,866
$
23,955
$
23,503
$
93,445
$
2009
13,169
$
14,725
$
15,527
$
17,267
$
60,688
$
New Ventures
Q1
Q2
Q3
Q4
YTD
2012
7
$
-
$
-
$
-
$
7
$
2011
175
$
679
$
5
$
7
$
866
$
2010
3,500
$
184
$
(41)
$
183
$
3,826
$
2009
240
$
273
$
367
$
406
$
1,286
$
Depreciation, Amortization and Other
*From acquisition date
In thousands
6
©2012
Coinstar,
Inc.
All
rights
reserved.
These
materials
may
not
be
reproduced,
altered,
or
distributed
without
the
express
written
consent
of
Coinstar,
Inc. |
 Installations and Same Store Sales
As of March 31, 2012
Redbox Kiosks (rounded)
Q1
Q2
Q3
Q4
2012
36,800
--
--
--
2011
31,800
33,300
34,400
35,400
2010
24,800
26,900
28,500
30,200
2009
15,400
17,900
20,600
22,400
2008
7,900
9,600
11,800
13,700
Coin Kiosk Same Store Sales
Q1
Q2
Q3
Q4
2012
1.6%
--
--
--
2011
5.3%
1.8%
1.0%
1.7%
2010
0.5%
7.9%
7.9%
10.0%
2009
-5.0%
-4.3%
-5.4%
-5.1%
Coin Kiosks (rounded)
Q1
Q2
Q3
Q4
2012
20,200
--
--
--
2011
18,800
18,900
19,500
20,200
2010
19,100
19,000
18,900
18,900
2009
18,400
18,400
18,800
19,200
2008
15,500
16,500
17,500
18,400
Redbox Kiosk Same Store Sales
Q1
Q2
Q3
Q4
2012
28.1%
--
--
--
2011
15.3%
16.6%
13.0%
27.1%
2010
21.0%
3.5%
17.2%
12.5%
2009
35.0%
33.0%
26.3%
21.0%
Redbox
Coin
7
©2012
Coinstar,
Inc.
All
rights
reserved.
These
materials
may
not
be
reproduced,
altered,
or
distributed
without
the
express
written
consent
of
Coinstar,
Inc. |
 Other
Information As of March 31, 2012
Redbox Gross Margin
Q1
Q2
Q3
Q4
YTD
2012
56.9%
--
--
--
56.9%
2011
53.1%
58.4%
59.1%
54.9%
56.3%
2010
59.0%
56.4%
59.7%
54.4%
57.3%
2009
59.6%
57.4%
58.1%
54.0%
57.0%
2008
65.2%
63.0%
62.5%
62.2%
62.9%
Q1
Q2
Q3
Q4
YTD
2012
38,007
$
--
--
--
38,007
$
2011
38,472
$
49,405
$
46,902
$
44,457
$
179,236
$
2010
31,517
$
52,822
$
48,135
$
38,375
$
170,849
$
2009
34,987
$
38,288
$
28,647
$
46,545
$
148,467
$
2008
28,182
$
34,653
$
47,692
$
33,525
$
144,052
$
Consolidated Capital Expenditures* (in thousands)
*For continuing operations
8
©2012
Coinstar,
Inc.
All
rights
reserved.
These
materials
may
not
be
reproduced,
altered,
or
distributed
without
the
express
written
consent
of
Coinstar,
Inc. |
 Top 5
Customers by Revenue *All Walmart related companies, including Sam’s
Club and ASDA As of March 31, 2012
Walgreens
Walmart*
Kroger
7-
Eleven
CVS
Walmart*
Kroger
Supervalu
Ahold
Delhaize
Walgreens
Walmart*
Kroger
7-Eleven
CVS
Redbox
Coin
Consolidated
9
©2012
Coinstar,
Inc.
All
rights
reserved.
These
materials
may
not
be
reproduced,
altered,
or
distributed
without
the
express
written
consent
of
Coinstar,
Inc. |