Attached files
| file | filename |
|---|---|
| 8-K - 8-K - ARCH RESOURCES, INC. | a12-10541_18k.htm |
Exhibit 99.1
|
|
Annual Shareholder Meeting Steven F. Leer, Chairman and CEO John W. Eaves, President and COO St. Louis | April 26, 2012 |
|
|
Slide 2 Forward-Looking Information This presentation contains “forward-looking statements” – that is, statements related to future, not past, events. In this context, forward-looking statements often address our expected future business and financial performance, and often contain words such as “expects,” “anticipates,” “intends,” “plans,” “believes,” “seeks,” or “will.” Forward-looking statements by their nature address matters that are, to different degrees, uncertain. For us, particular uncertainties arise from changes in the demand for our coal by the domestic electric generation industry; from legislation and regulations relating to the Clean Air Act and other environmental initiatives; from operational, geological, permit, labor and weather-related factors; from fluctuations in the amount of cash we generate from operations; from future integration of acquired businesses; and from numerous other matters of national, regional and global scale, including those of a political, economic, business, competitive or regulatory nature. These uncertainties may cause our actual future results to be materially different than those expressed in our forward-looking statements. We do not undertake to update our forward-looking statements, whether as a result of new information, future events or otherwise, except as may be required by law. For a description of some of the risks and uncertainties that may affect our future results, you should see the risk factors described from time to time in the reports we file with the Securities and Exchange Commission. This presentation includes certain non-GAAP financial measures, including Adjusted EBITDA and Adjusted Earnings Per Share. These non-GAAP financial measures are not measures of financial performance in accordance with generally accepted accounting principles and may exclude items that are significant in understanding and assessing our financial results. Therefore, these measures should not be considered in isolation or as an alternative to net income from operations, cash flows from operations, earnings per fully-diluted share or other measures of profitability, liquidity or performance under generally accepted accounting principles. You should be aware that our presentation of these measures may not be comparable to similarly-titled measures used by other companies. A reconciliation of these financial measures to the most comparable measures presented in accordance with generally accepted accounting principles has been included at the end of this presentation. |
|
|
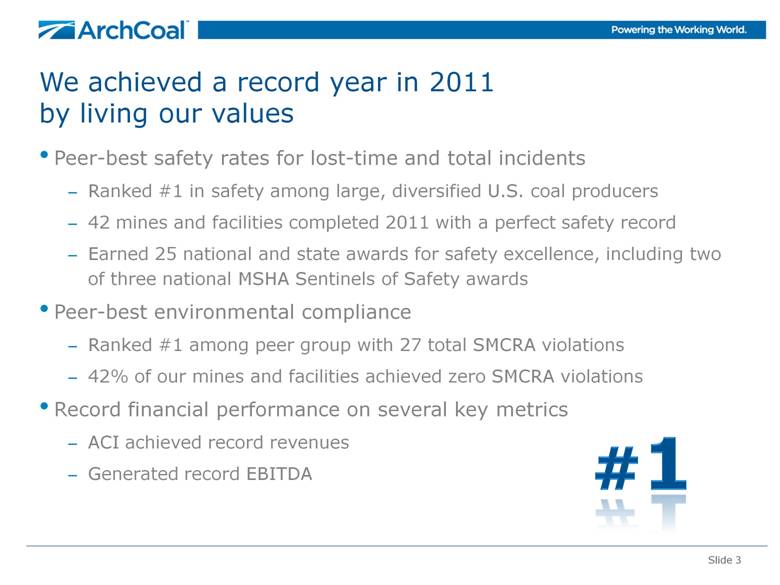
Slide 3 We achieved a record year in 2011 by living our values Peer-best safety rates for lost-time and total incidents Ranked #1 in safety among large, diversified U.S. coal producers 42 mines and facilities completed 2011 with a perfect safety record Earned 25 national and state awards for safety excellence, including two of three national MSHA Sentinels of Safety awards Peer-best environmental compliance Ranked #1 among peer group with 27 total SMCRA violations 42% of our mines and facilities achieved zero SMCRA violations Record financial performance on several key metrics ACI achieved record revenues Generated record EBITDA |
|
|
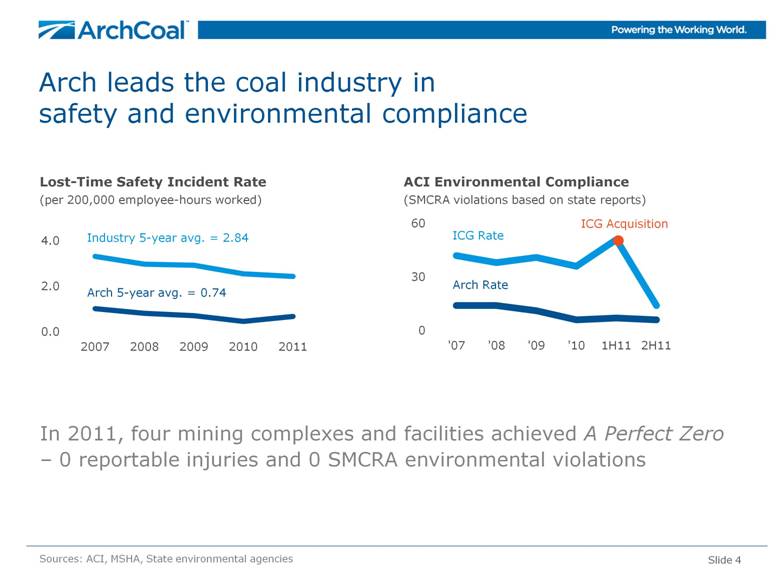
Arch leads the coal industry in safety and environmental compliance In 2011, four mining complexes and facilities achieved A Perfect Zero – 0 reportable injuries and 0 SMCRA environmental violations Slide 4 Sources: ACI, MSHA, State environmental agencies ACI Environmental Compliance (SMCRA violations based on state reports) Lost-Time Safety Incident Rate (per 200,000 employee-hours worked) Arch 5-year avg. = 0.74 Industry 5-year avg. = 2.84 ICG Rate Arch Rate ICG Acquisition |
|
|
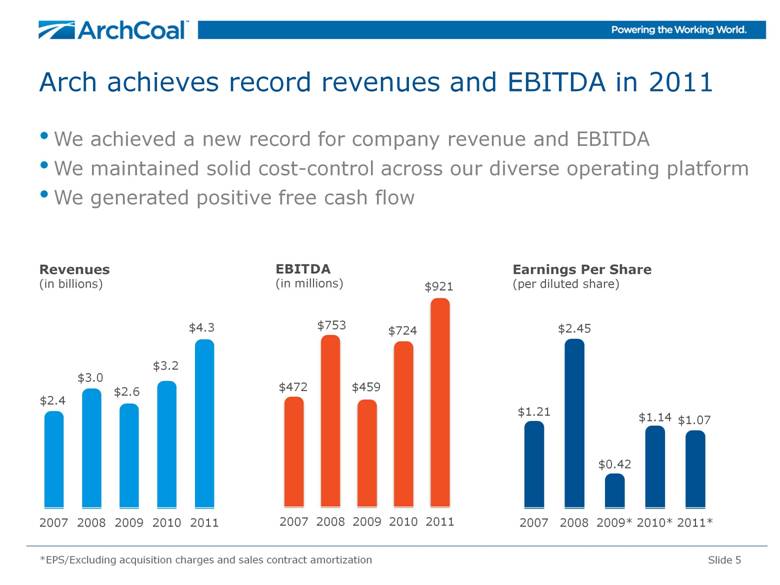
Slide 5 Arch achieves record revenues and EBITDA in 2011 We achieved a new record for company revenue and EBITDA We maintained solid cost-control across our diverse operating platform We generated positive free cash flow Revenues (in billions) Earnings Per Share (per diluted share) EBITDA (in millions) *EPS/Excluding acquisition charges and sales contract amortization |
|
|
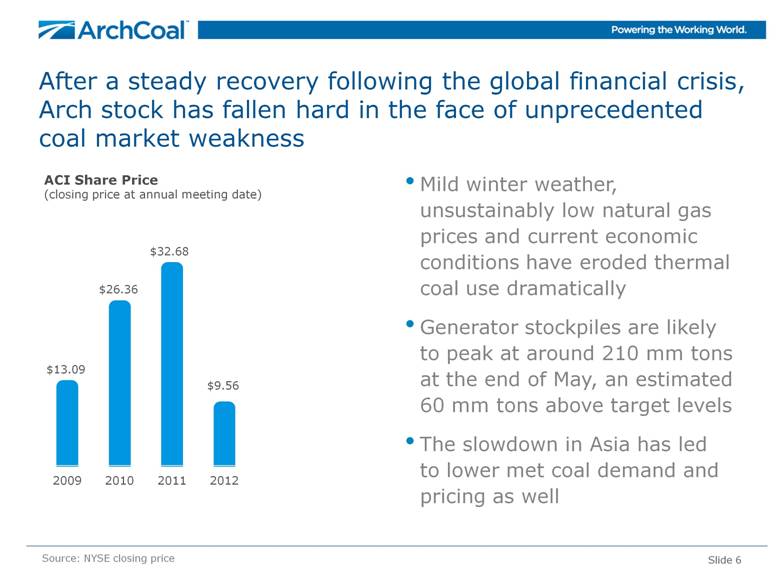
After a steady recovery following the global financial crisis, Arch stock has fallen hard in the face of unprecedented coal market weakness Slide 6 Source: NYSE closing price Mild winter weather, unsustainably low natural gas prices and current economic conditions have eroded thermal coal use dramatically Generator stockpiles are likely to peak at around 210 mm tons at the end of May, an estimated 60 mm tons above target levels The slowdown in Asia has led to lower met coal demand and pricing as well ACI Share Price (closing price at annual meeting date) |
|
|
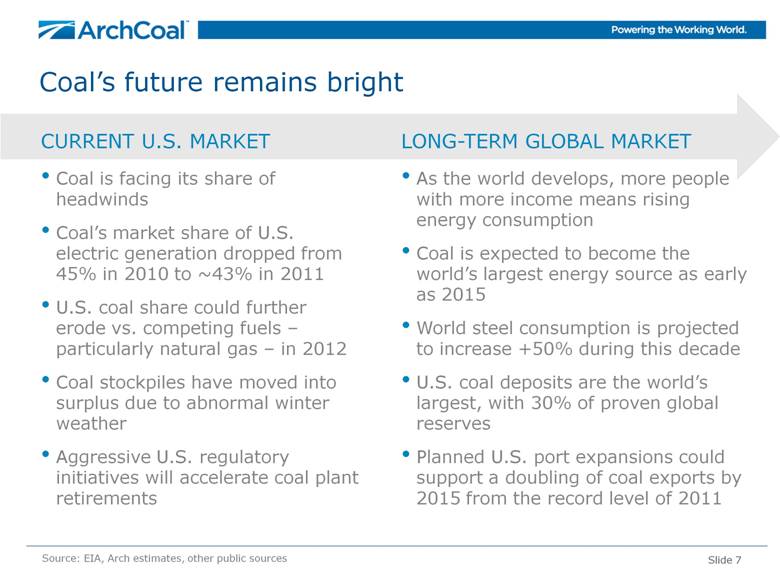
Slide 7 Coal’s future remains bright CURRENT U.S. MARKET Coal is facing its share of headwinds Coal’s market share of U.S. electric generation dropped from 45% in 2010 to ~43% in 2011 U.S. coal share could further erode vs. competing fuels – particularly natural gas – in 2012 Coal stockpiles have moved into surplus due to abnormal winter weather Aggressive U.S. regulatory initiatives will accelerate coal plant retirements Source: EIA, Arch estimates, other public sources LONG-TERM GLOBAL MARKET As the world develops, more people with more income means rising energy consumption Coal is expected to become the world’s largest energy source as early as 2015 World steel consumption is projected to increase +50% during this decade U.S. coal deposits are the world’s largest, with 30% of proven global reserves Planned U.S. port expansions could support a doubling of coal exports by 2015 from the record level of 2011 |
|
|
Short-Term Outlook for Coal Markets |

|
|
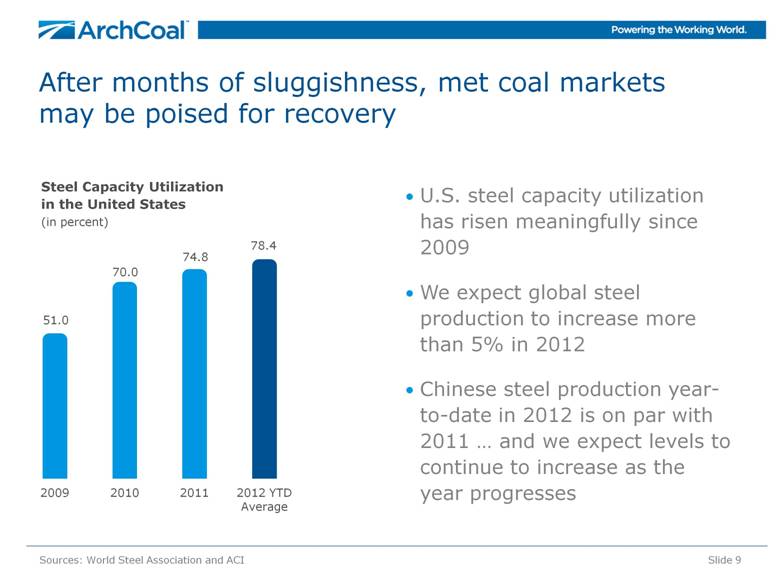
After months of sluggishness, met coal markets may be poised for recovery U.S. steel capacity utilization has risen meaningfully since 2009 We expect global steel production to increase more than 5% in 2012 Chinese steel production year-to-date in 2012 is on par with 2011 and we expect levels to continue to increase as the year progresses Slide 9 Sources: World Steel Association and ACI Steel Capacity Utilization in the United States (in percent)... |
|
|
U.S. exports appear to be on clear upward trend We expect U.S. exports to continue to climb during next five years We project U.S. export growth of 5-15 million tons annually U.S. coal industry is transforming from swing supplier to strategic supplier status in the global marketplace Slide 10 U.S. Coal Exports (in millions of tons) 112-116 |

|
|
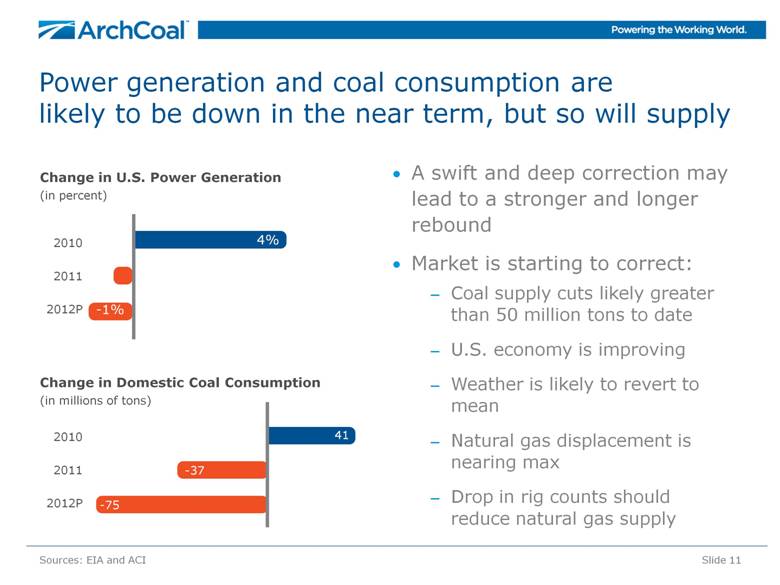
Power generation and coal consumption are likely to be down in the near term, but so will supply A swift and deep correction may lead to a stronger and longer rebound Market is starting to correct: Coal supply cuts likely greater than 50 million tons to date U.S. economy is improving Weather is likely to revert to mean Natural gas displacement is nearing max Drop in rig counts should reduce natural gas supply Slide 11 Change in U.S. Power Generation (in percent) Sources: EIA and ACI Change in Domestic Coal Consumption (in millions of tons) 2010 2011 2012P 2010 2011 2012P 4% -1% |
|
|
Long-Term Energy Outlook |

|
|
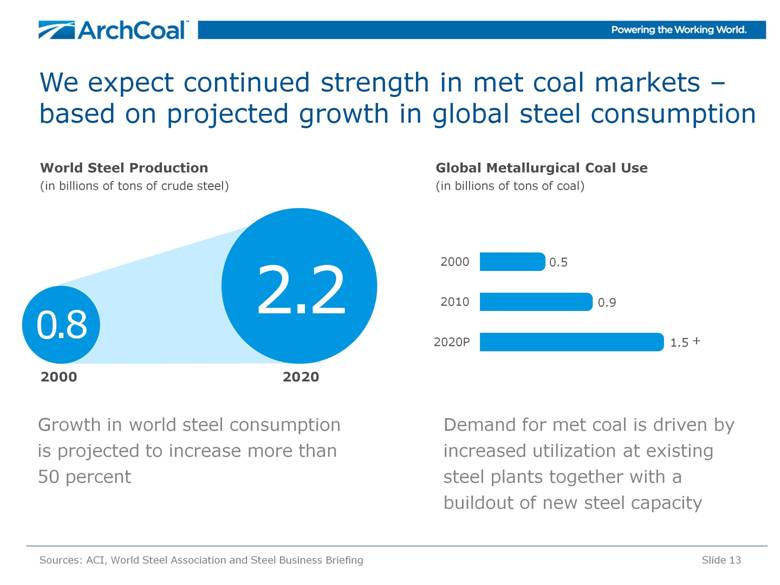
We expect continued strength in met coal markets – based on projected growth in global steel consumption Slide 13 World Steel Production (in billions of tons of crude steel) Sources: ACI, World Steel Association and Steel Business Briefing Global Metallurgical Coal Use (in billions of tons of coal) + 2000 2020 2.2 0 .8 Growth in world steel consumption is projected to increase more than 50 percent Demand for met coal is driven by increased utilization at existing steel plants together with a buildout of new steel capacity |
|
|
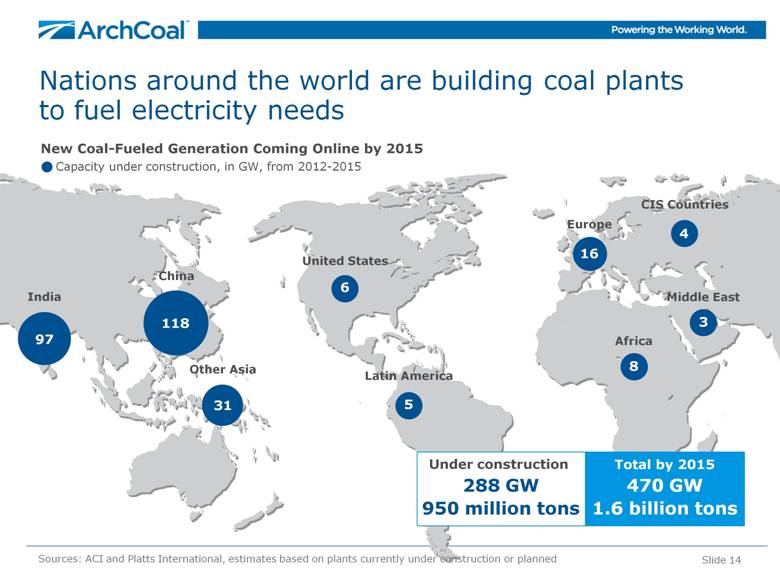
Slide 14 Nations around the world are building coal plants to fuel electricity needs Sources: ACI and Platts International, estimates based on plants currently under construction or planned Africa Europe CIS Countries Middle East Other Asia 31 United States 6 Latin America 5 China 118 97 India 8 3 16 4 Under construction 288 GW 950 million tons Total by 2015 470 GW 1.6 billion tons New Coal-Fueled Generation Coming Online by 2015 Capacity under construction, in GW, from 2012-2015 |
|
|
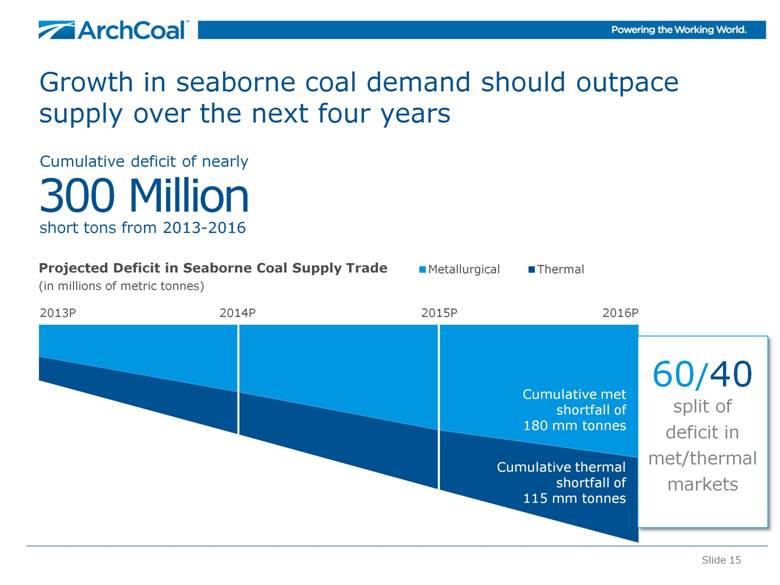
Slide 15 Growth in seaborne coal demand should outpace supply over the next four years Projected Deficit in Seaborne Coal Supply Trade (in millions of metric tonnes) 2013P 2014P 2015P 2016P 60/40 split of deficit in met/thermal markets Cumulative deficit of nearly 300 Million short tons from 2013-2016 Cumulative met shortfall of 180 mm tonnes Cumulative thermal shortfall of 115 mm tonnes |
|
|
Traditional supply sources are struggling to keep pace with demand, making U.S. coal increasingly competitive Supply Pressures Slide 16 China is depleting reserves at unprecedented (and accelerating) rate and production is migrating further from population centers. Imported coal often offers significant quality and environmental advantages. Indonesia coal quality is declining and infrastructure is a huge challenge. Substantial capital is required to open new reserve areas and growing domestic demand could constrain export growth. Australia will experience higher costs in new reserve areas. Government, regulatory and community impediments are on the rise. India faces quality, land use, environmental and infrastructure challenges. South Africa is increasingly mature, infrastructure needs are great. Russia faces reserve depletion in West, infrastructure needs in East. Mongolia & Mozambique have coal but no roads, rail, ports or miners. Sources: Public sources |

|
|
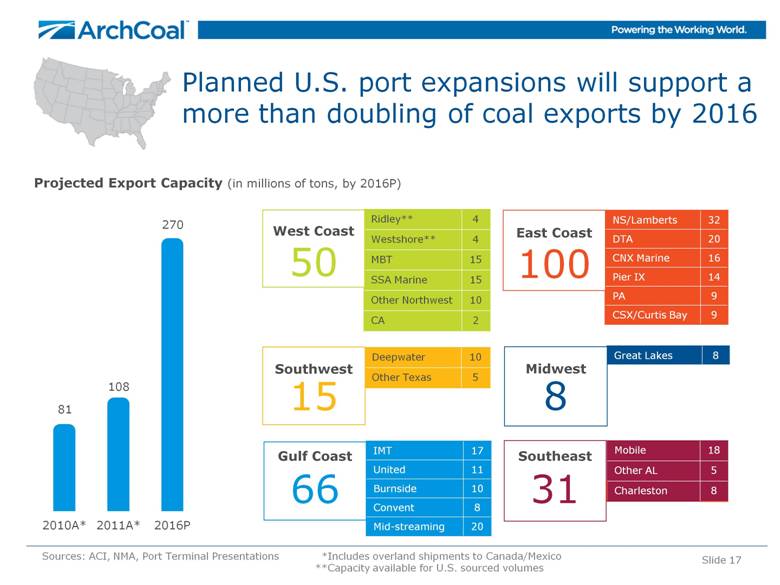
Planned U.S. port expansions will support a more than doubling of coal exports by 2016 NS/Lamberts 32 DTA 20 CNX Marine 16 Pier IX 14 PA 9 CSX/Curtis Bay 9 Ridley** 4 Westshore** 4 MBT 15 SSA Marine 15 Other Northwest 10 CA 2 Mobile 18 Other AL 5 Charleston 8 Projected Export Capacity (in millions of tons, by 2016P) Sources: ACI, NMA, Port Terminal Presentations *Includes overland shipments to Canada/Mexico **Capacity available for U.S. sourced volumes Slide 17 Deepwater 10 Other Texas 5 IMT 17 United 11 Burnside 10 Convent 8 Mid-streaming 20 Great Lakes 8 West Coast 50 Southwest 15 Gulf Coast 66 East Coast 100 Midwest 8 Southeast 31 |
|
|
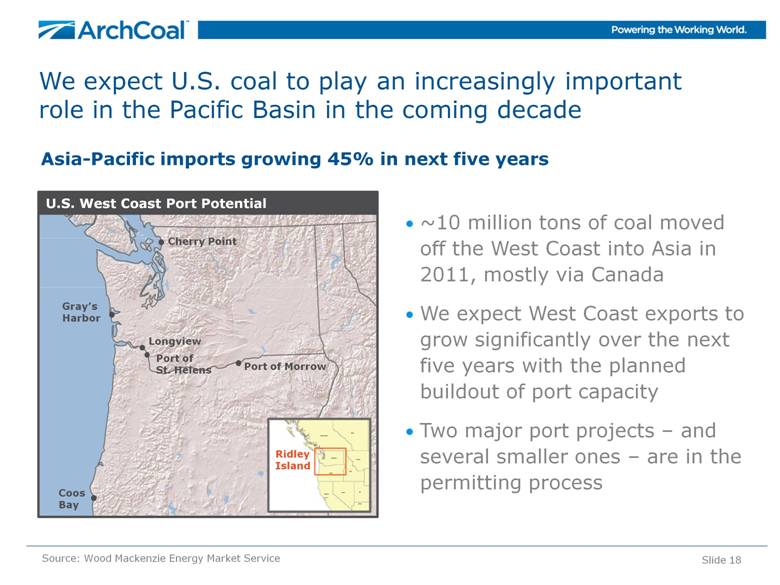
We expect U.S. coal to play an increasingly important role in the Pacific Basin in the coming decade ~10 million tons of coal moved off the West Coast into Asia in 2011, mostly via Canada We expect West Coast exports to grow significantly over the next five years with the planned buildout of port capacity Two major port projects – and several smaller ones – are in the permitting process U.S. West Coast Port Potential Gray’s Harbor Cherry Point Longview Coos Bay Port of St. Helens Ridley Island Port of Morrow Source: Wood Mackenzie Energy Market Service Slide 18 Asia-Pacific imports growing 45% in next five years |
|
|
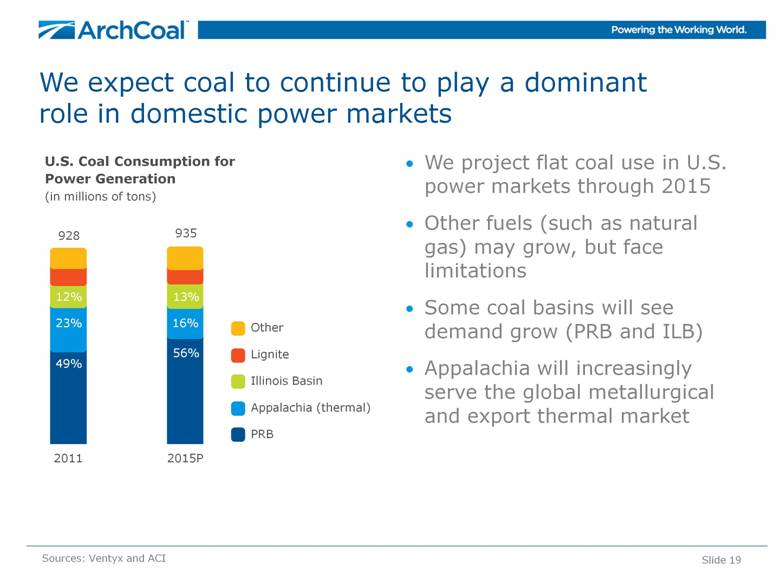
We expect coal to continue to play a dominant role in domestic power markets We project flat coal use in U.S. power markets through 2015 Other fuels (such as natural gas) may grow, but face limitations Some coal basins will see demand grow (PRB and ILB) Appalachia will increasingly serve the global metallurgical and export thermal market U.S. Coal Consumption for Power Generation (in millions of tons) Other Lignite Illinois Basin Appalachia (thermal) PRB Sources: Ventyx and ACI Slide 19 928 935 49% 56% 23% 16% 13% 12% 2011 2015P |
|
|
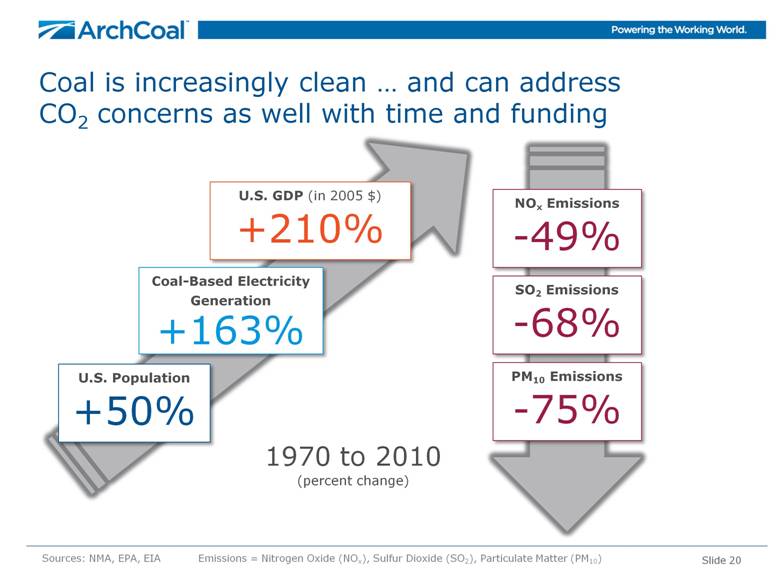
Coal is increasingly clean... and can address CO2 concerns as well with time and funding Sources: NMA, EPA, EIA Emissions = Nitrogen Oxide (NOx), Sulfur Dioxide (SO2), Particulate Matter (PM10) Slide 20 Coal-Based Electricity Generation +163% U.S. GDP (in 2005 $) +210% U.S. Population +50% 1970 to 2010 (percent change) SO2 Emissions -68% NOx Emissions -49% PM10 Emissions -75% |
|
|
The New Arch Coal |
|
|
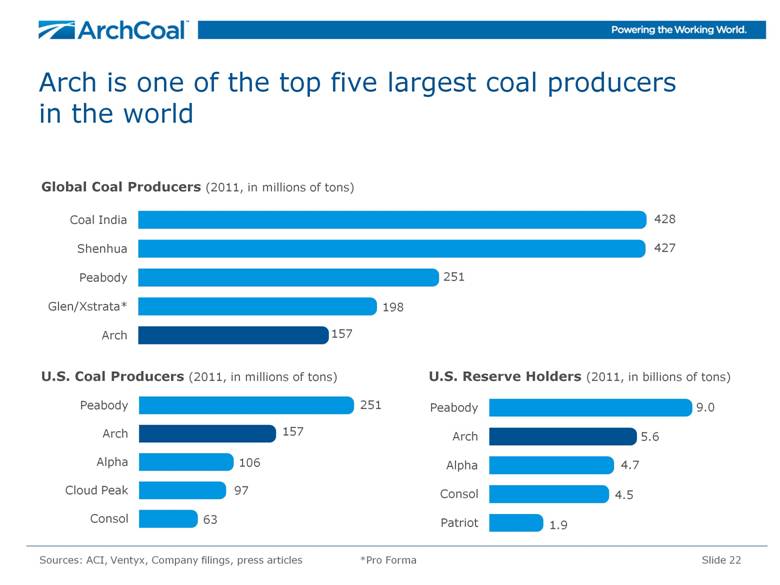
U.S. Coal Producers (2011, in millions of tons) U.S. Reserve Holders (2011, in billions of tons) Arch is one of the top five largest coal producers in the world Slide 22 Sources: ACI, Ventyx, Company filings, press articles *Pro Forma Global Coal Producers (2011, in millions of tons) |
|
|
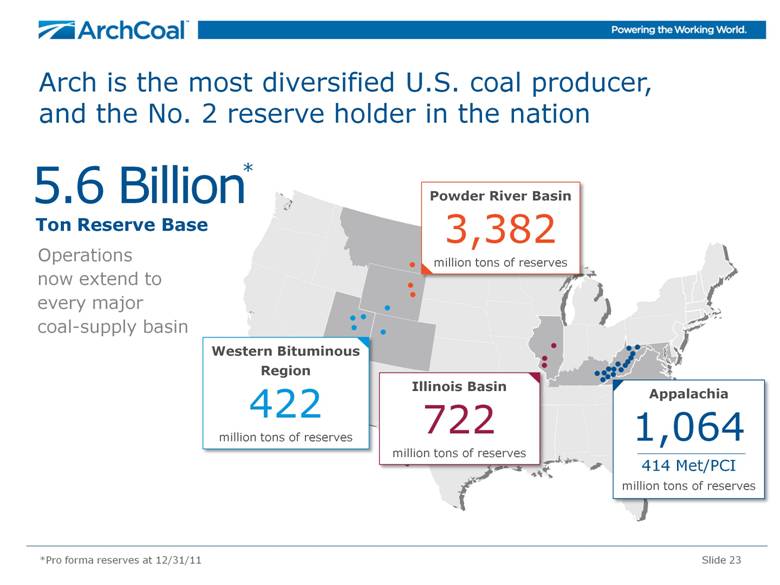
Arch is the most diversified U.S. coal producer, and the No. 2 reserve holder in the nation Operations now extend to every major coal-supply basin Slide 23 *Pro forma reserves at 12/31/11 5.6 Billion Ton Reserve Base Western Bituminous Region 422 million tons of reserves Illinois Basin 722 million tons of reserves Powder River Basin 3,382 million tons of reserves Appalachia 1,064 414 Met/PCI million tons of reserves * |
|
|
In the near term, Arch is reducing production and capital spending, while expanding its met portfolio Reduce production targets during weak market cycles to preserve the future value of reserve base Lower capital spending levels on thermal assets to match our current view of market demand Diligently manage controllable costs while maintaining flexibility to respond as market conditions evolve Highly committed in the near term – with opportunities to sell into seaborne markets and domestic markets given Arch’s cost structure Slide 24 |
|
|
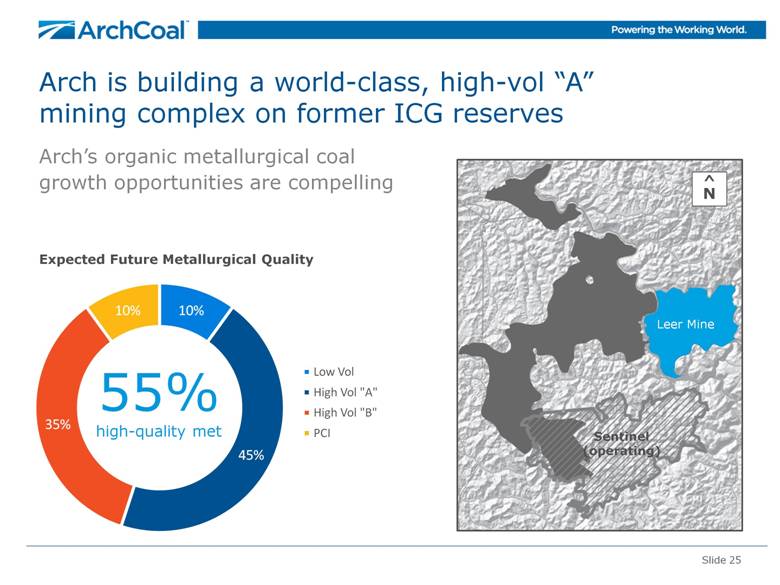
Slide 25 Arch is building a world-class, high-vol “A” mining complex on former ICG reserves Arch’s organic metallurgical coal growth opportunities are compelling 55% high-quality met Leer Mine Sentinel (operating) ^ N Expected Future Metallurgical Quality Low Vol High Vol “A” High Vol “B” PCI |
|
|
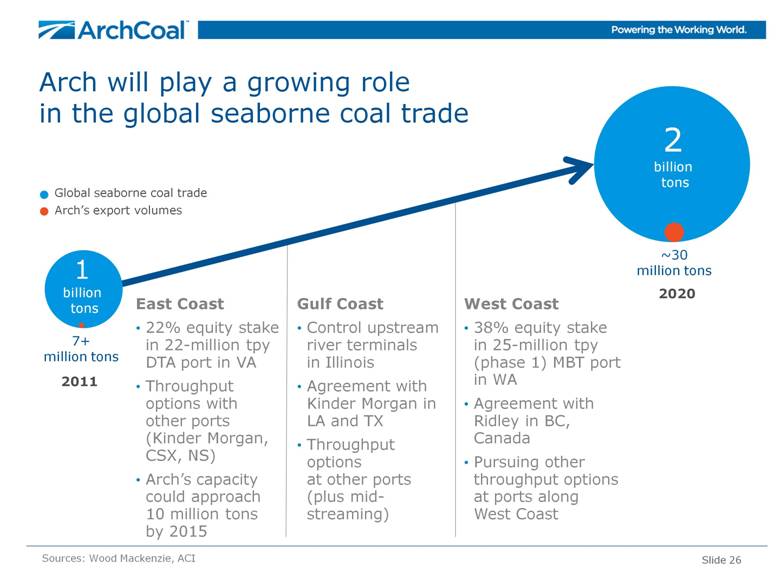
Slide 26 Arch will play a growing role in the global seaborne coal trade East Coast 22% equity stake in 22-million tpy DTA port in VA Throughput options with other ports (Kinder Morgan, CSX, NS) Arch’s capacity could approach 10 million tons by 2015 Sources: Wood Mackenzie, ACI 2020 2 billion tons 7+ million tons 1 billion tons 2011 ~30 million tons Global seaborne coal trade Arch’s export volumes West Coast 38% equity stake in 25-million tpy (phase 1) MBT port in WA Agreement with Ridley in BC, Canada Pursuing other throughput options at ports along West Coast Gulf Coast Control upstream river terminals in Illinois Agreement with Kinder Morgan in LA and TX Throughput options at other ports (plus mid-streaming) |
|
|
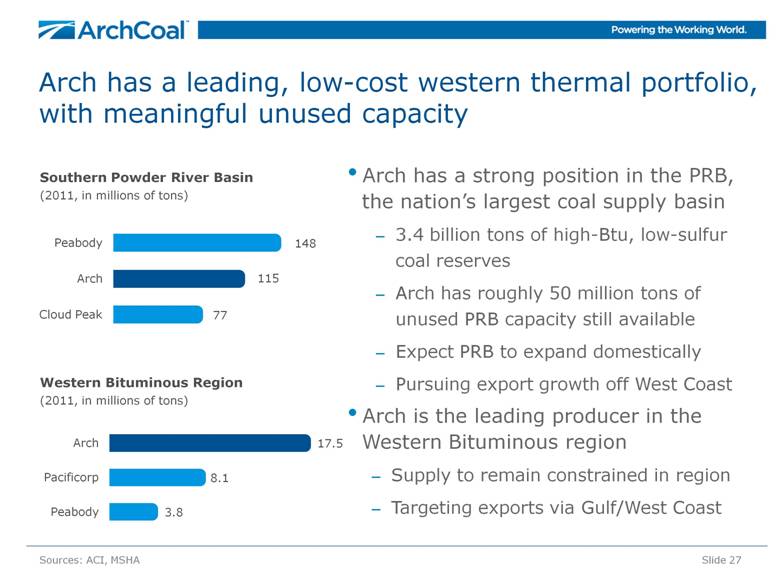
Arch has a leading, low-cost western thermal portfolio, with meaningful unused capacity Arch has a strong position in the PRB, the nation’s largest coal supply basin 3.4 billion tons of high-Btu, low-sulfur coal reserves Arch has roughly 50 million tons of unused PRB capacity still available Expect PRB to expand domestically Pursuing export growth off West Coast Arch is the leading producer in the Western Bituminous region Supply to remain constrained in region Targeting exports via Gulf/West Coast Slide 27 Sources: ACI, MSHA Western Bituminous Region (2011, in millions of tons) Southern Powder River Basin (2011, in millions of tons) |
|
|
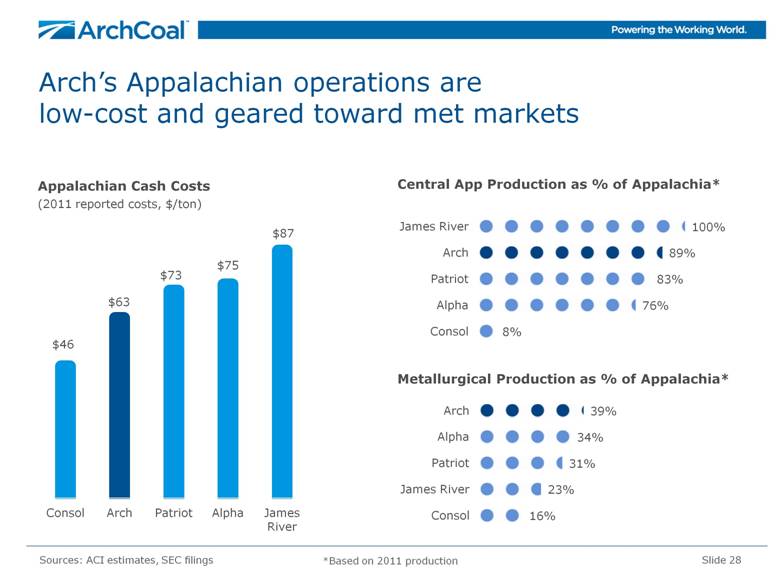
Arch’s Appalachian operations are low-cost and geared toward met markets Slide 28 Sources: ACI estimates, SEC filings Central App Production as % of Appalachia* Metallurgical Production as % of Appalachia* Appalachian Cash Costs (2011 reported costs, $/ton) *Based on 2011 production |
|
|
Slide 29 Arch has dedicated $50+ million to date to advance U.S. clean coal technologies U.S. Department of Energy, National Carbon Capture Center Washington University, Consortium for Clean Coal Utilization University of Wyoming, School of Energy Resources DKRW, Mine-Mouth Coal-to-Liquids Facility ADA, Environmental Solutions Tenaska, Inc., Trailblazer Energy Center |
|
|
Arch’s leadership position in the coal industry will drive future value creation Slide 30 World-class global coal franchise Top five global coal producer and marketer One of the world’s largest metallurgical coal suppliers Disciplined financial management, capital allocation U.S. coal industry powerhouse Most diversified U.S. coal producer Represent 15 percent of U.S. coal supply Second largest coal reserve holder in nation Consistently first in safety and environmental performance among peer group |
|
|
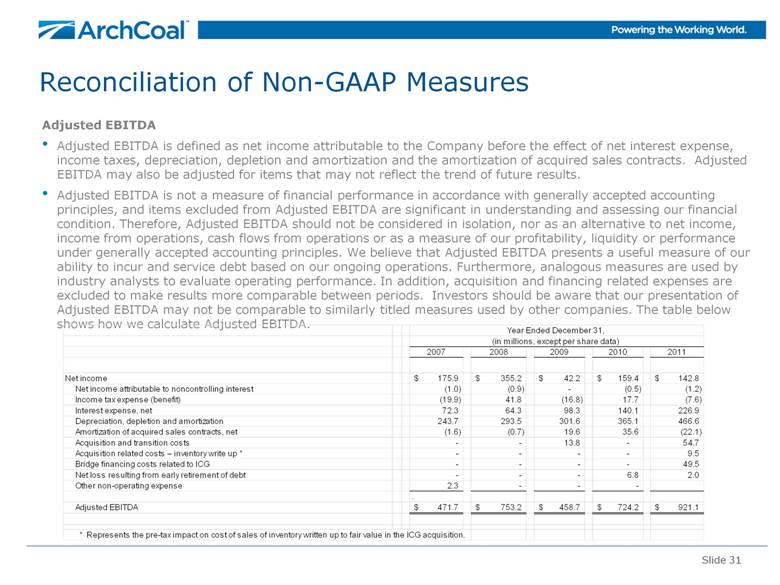
Slide 31 Reconciliation of Non-GAAP Measures Adjusted EBITDA Adjusted EBITDA is defined as net income attributable to the Company before the effect of net interest expense, income taxes, depreciation, depletion and amortization and the amortization of acquired sales contracts. Adjusted EBITDA may also be adjusted for items that may not reflect the trend of future results. Adjusted EBITDA is not a measure of financial performance in accordance with generally accepted accounting principles, and items excluded from Adjusted EBITDA are significant in understanding and assessing our financial condition. Therefore, Adjusted EBITDA should not be considered in isolation, nor as an alternative to net income, income from operations, cash flows from operations or as a measure of our profitability, liquidity or performance under generally accepted accounting principles. We believe that Adjusted EBITDA presents a useful measure of our ability to incur and service debt based on our ongoing operations. Furthermore, analogous measures are used by industry analysts to evaluate operating performance. In addition, acquisition and financing related expenses are excluded to make results more comparable between periods. Investors should be aware that our presentation of Adjusted EBITDA may not be comparable to similarly titled measures used by other companies. The table below shows how we calculate Adjusted EBITDA. 2007 2008 2009 2010 2011 Net income 175.9 $ 355.2 $ 42.2 $ 159.4 $ 142.8 $ Net income attributable to noncontrolling interest (1.0) (0.9) - (0.5) (1.2) Income tax expense (benefit) (19.9) 41.8 (16.8) 17.7 (7.6) Interest expense, net 72.3 64.3 98.3 140.1 226.9 Depreciation, depletion and amortization 243.7 293.5 301.6 365.1 466.6 Amortization of acquired sales contracts, net (1.6) (0.7) 19.6 35.6 (22.1) Acquisition and transition costs - - 13.8 - 54.7 Acquisition related costs – inventory write up * - - - - 9.5 Bridge financing costs related to ICG - - - - 49.5 Net loss resulting from early retirement of debt - - - 6.8 2.0 Other non-operating expense 2.3 - - - . Adjusted EBITDA 471.7 $ 753.2 $ 458.7 $ 724.2 $ 921.1 $ * Represents the pre-tax impact on cost of sales of inventory written up to fair value in the ICG acquisition. (in millions, except per share data) Year Ended December 31, |
|
|
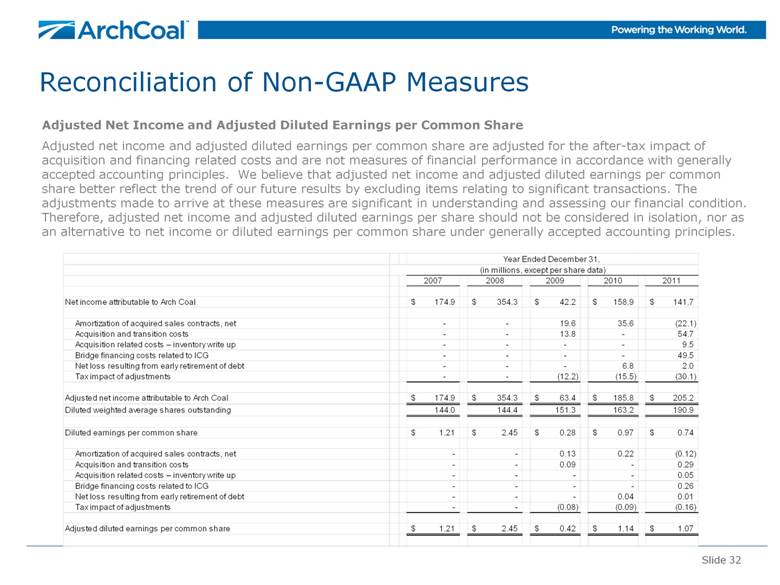
Slide 32 Reconciliation of Non-GAAP Measures Adjusted Net Income and Adjusted Diluted Earnings per Common Share Adjusted net income and adjusted diluted earnings per common share are adjusted for the after-tax impact of acquisition and financing related costs and are not measures of financial performance in accordance with generally accepted accounting principles. We believe that adjusted net income and adjusted diluted earnings per common share better reflect the trend of our future results by excluding items relating to significant transactions. The adjustments made to arrive at these measures are significant in understanding and assessing our financial condition. Therefore, adjusted net income and adjusted diluted earnings per share should not be considered in isolation, nor as an alternative to net income or diluted earnings per common share under generally accepted accounting principles. 2007 2008 2009 2010 2011 Net income attributable to Arch Coal 174.9 $ 354.3 $ 42.2 $ 158.9 $ 141.7 $ Amortization of acquired sales contracts, net - - 19.6 35.6 (22.1) Acquisition and transition costs - - 13.8 - 54.7 Acquisition related costs – inventory write up - - - - 9.5 Bridge financing costs related to ICG - - - - 49.5 Net loss resulting from early retirement of debt - - - 6.8 2.0 Tax impact of adjustments - - (12.2) (15.5) (30.1) Adjusted net income attributable to Arch Coal 174.9 $ 354.3 $ 63.4 $ 185.8 $ 205.2 $ Diluted weighted average shares outstanding 144.0 144.4 151.3 163.2 190.9 Diluted earnings per common share 1.21 $ 2.45 $ 0.28 $ 0.97 $ 0.74 $ Amortization of acquired sales contracts, net - - 0.13 0.22 (0.12) Acquisition and transition costs - - 0.09 - 0.29 Acquisition related costs – inventory write up - - - - 0.05 Bridge financing costs related to ICG - - - - 0.26 Net loss resulting from early retirement of debt - - - 0.04 0.01 Tax impact of adjustments - - (0.08) (0.09) (0.16) Adjusted diluted earnings per common share 1.21 $ 2.45 $ 0.42 $ 1.14 $ 1.07 $ (in millions, except per share data) Year Ended December 31, |