Attached files
| file | filename |
|---|---|
| 8-K - FORM 8-K - FIRST NIAGARA FINANCIAL GROUP INC | d339955d8k.htm |
Exhibit 99.1

| Annual Meeting Of Stockholders G. Thomas Bowers Chairman of the Board John R. Koelmel Chief Executive Officer Gregory W. Norwood Chief Financial Officer April 25, 2012 |

| This presentation contains forward-looking information for First Niagara Financial Group, Inc. Such information constitutes forward-looking statements (within the meaning of the Private Securities Litigation Reform Act of 1995) which involve significant risks and uncertainties. Actual results may differ materially from the results discussed in these forward-looking statements. 2 Safe Harbor Statement |

| 3 |

| 2012 Annual Meeting Agenda Business Meeting Annual Report to Shareholders 4 |

| Business Meeting 5 |

| Business Meeting Proposal I Election of three directors: Roxanne J. Coady Carl A. Florio Nathaniel D. Woodson Proposal II Advisory (Non-binding) vote to approve executive compensation 6 |

| Business Meeting Proposal III Approve the 2012 Equity Incentive Plan Proposal IV Approve the Executive Annual Incentive Plan Proposal V Ratification of the appointment of KPMG as the independent registered public accounting firm 7 |

| Final Polling 8 |

| 9 |

| 10 Election Report |

| 11 |

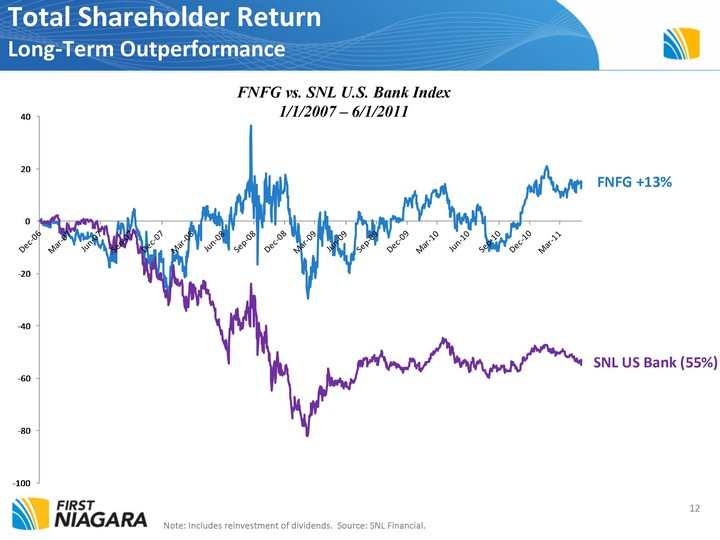
| FNFG vs. SNL U.S. Bank Index 1/1/2007 - 6/1/2011 12 FNFG +13% SNL US Bank (55%) Total Shareholder Return Long-Term Outperformance Note: Includes reinvestment of dividends. Source: SNL Financial. |

| Total Shareholder Return Event Driven Underperformance FNFG vs. SNL U.S. Bank Index 6/1/11 - 12/31/11 13 FNFG (36%) S&P Downgrades U.S. debt Fed Reserve Announces low interest rates till mid- 2013 SNL US Bank (16%) Note: Includes reinvestment of dividends. Source: SNL Financial. |

| 14 2011: A Tale of Two Years FNFG vs. Selected Bank Indexes (23%) (24%) (38%) "Event-driven Underperformance" 700+ bps Outperformance |

| 15 |

| 16 |

| Operating EPS increases 13%1 year-over-year; consistent revenue growth Organic commercial loan growth leading top quartile peers Superior credit performance continues Capital structure adequate for low-risk balance sheet Financially NewAlliance conversion and integration successfully completed New product and service investments continue Operational excellence is the focus during M&A pause Commercial bank evolution continues; Dialog and relationship with new regulators constructive Operationally Talent and culture investments driving brand value Retail franchise driven by new leadership and key investments HSBC branch acquisition accelerates key retail initiatives Commercial business increasing specialty capabilities Strategically 1 Operating EPS used in calculation. Operating EPS is a non-GAAP measure and excludes the merger and integration costs related to the acquisitions and other non-operating items. Refer to the Appendix for further details. 2011: Delivering on our Commitments 17 |

| Positioned for Continuing Success Northeast Regional Footprint 18 |

| Thrift to Top-25 Commercial Bank Balances are period end and in millions except FTEs, which are actual Pro Forma for HSBC acquisition, scheduled to close on May 18, 2012 Deposits Loans Total Assets Full Time Employees 19 |

| Annual Operating Earnings1 Pre-Tax, Pre-Provision Operating Earnings1 1 Operating net income is a non-GAAP measure and excludes the merger and integration costs related to the acquisitions and other non-operating items. Refer to the Appendix for further details. Provision for credit losses Differentiated Performance Superior operating results 20 |

| Operating Revenue Per Share 1 Net Operating Preprovision Earnings Per Share 2 1 Year Growth 2011 vs. 2010 5 Year Growth 2011 vs. 2006 Non-GAAP - Excludes gain/loss on sale of securities and nonrecurring revenue as classified by SNL. Non-GAAP - Excludes tax-effected goodwill impairment, nonrecurring revenue and expenses as classified by SNL and gain/loss on sale of securities. Refer to the Appendix for a list of peer banks. Differentiated Performance Superior earnings growth on a per share basis 3 Year Growth 2011 vs. 2008 Top-Line revenue driving operating earnings growth 21 |

| 22 |

| Commercial Banking: Recognized for Best-in-Class Service Eight #1 ratings in 2011 Greenwich Associates survey "I can trust this bank." "It delivers on what it promises." "It treats me with respect." "If a problem arises, I can count on a fair resolution." "I would recommend this bank to colleagues, friends and family in the future." "I'll continue using this bank for current services." "I would use this bank for additional services." Greenwich Associates -"Best in Class" is the highest observed score in each category for Corporate and Business Banking services. Peer group consists of 20 of the top 50 banks as listed in the Wall Street Journal (August 2011). 23 |

| What are we doing? Outperforming the very best Nine consecutive quarters of double-digit commercial loan growth Growth across entire footprint How are we doing it? Right people in place Right products in place Cross-selling in our DNA Empowering regional leaders to drive growth Selecting quality, profitable clients within the bank's high credit standards Year-over-Year Organic Loan Growth Note: Peer growth rates normalized for bank acquisitions. 1Q12 peer data includes only those banks that have reported earnings before April 24, 2012. Refer to the Appendix for a list of peer banks. Best-in-Class Organic Loan Growth 24 |

| Commercial Banking -- Strong Loan Growth Across Entire Footprint Eastern PA Upstate NY Western PA New England Total Commercial Loan Balances $ millions 25 |

| Commercial Banking -- Newer Product Lines Drive Growth 2007 2011 Note: Other specialty banking includes the following business lines: Community Development, Financial Services and Government Banking. Fee Income Loans by Business Unit EOP balances 26 |

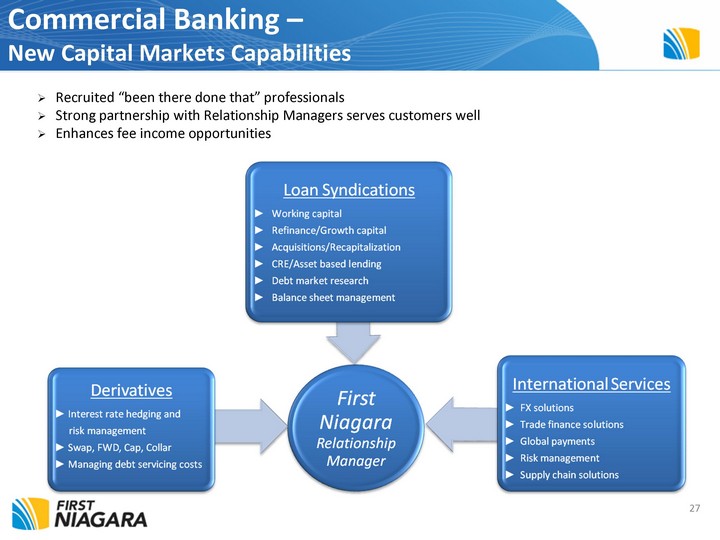
| Commercial Banking - New Capital Markets Capabilities Recruited "been there done that" professionals Strong partnership with Relationship Managers serves customers well Enhances fee income opportunities 27 |

| Commercial Banking -- Capital Markets Winning With Proven Team 1Q12 U.S. Traditional Middle Market Book-runner Market Share 28 |

| 29 |

| Access to Growth Markets Well Positioned to Take Market Share Note: Upstate NY includes Buffalo, Rochester, Syracuse, and Albany MSAs. Market share data excludes home office deposits. Source: SNL. Based on June 2011 deposit data. Retail Banking - Positioned Well for Success Sizable markets with Very Desirable Customer Demographics HSBC Drives Upstate Leadership Position $ in Billions National City Harleysville NewAlliance HSBC Date of Close Sept 2009 April 2010 April 2011 May 2012 Assets 3.9 5.6 8.7 6.2 % of First Niagara assets 34% 38% 41% 19% Loans 0.8 3.5 4.9 1.7 % of First Niagara loans 12% 48% 46% 10% Deposits 3.9 4.1 5.1 11.0 % of First Niagara deposits 62% 42% 38% 58% 30 |

| Retail: Deposit Franchise Drives Value Creation $ in billions Growth in New Checking Account Sales Year-over-Year1 ~ Deposits per Branch Total Deposits & Composition Transactional deposits represent noninterest-bearing and NOW accounts In millions Transactor, Saver, Borrower2 Percentage represent organic growth rates Ratio is the percentage of households in each region that hold a checking account, savings account or investment and a loan with First Niagara 31 |

| Retail Banking -- CALIBER Drives Sales and Service Culture and Performance Interactive branch scorecard Measures sales activity and performance across every sales associate, branch and region Branch sales personnel evaluated based on seven key performance metrics Daily, immediate-activity based measures used for management to prioritize and drive coaching and decisions Metrics are aligned with retail incentive plan Focus on: Core customer acquisition Customer Engagement and Activation Cross-selling: Transactor / Saver / Borrower Cross-business referrals 32 |

| Retail Banking -- Recognized for Excellence in Small Business Service Six #1 Small Business National Awards - Overall Satisfaction Treasury Management Services Relationship Manager Performance Branch Satisfaction Treasury Management Product Capabilities Treasury Management Operations Accuracy And #1 Regional winner in Overall Satisfaction. Greenwich Associates -2011 Greenwich Excellence Awards for Small Business Banking 33 |

| 34 |

| Consumer Loan Originations1 1 Residential Real Estate, Home Equity and Other Consumer; dollars in millions Originations in Upstate NY up 55% over 2010 Growing a strong presence in New England Consistent originations in Pennsylvania markets Originations accelerated in Q1'12 - nearly 2x Q1'11 levels in legacy markets Consumer Finance -- New and Legacy Markets Driving Increased Originations 35 |

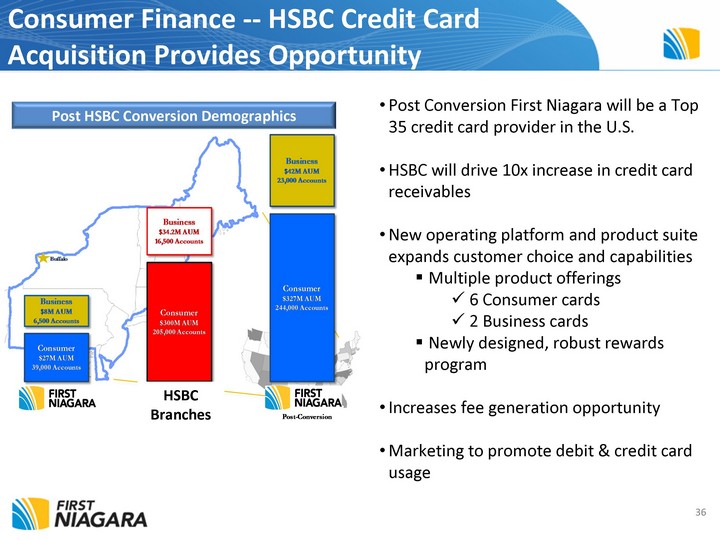
| Consumer Finance -- HSBC Credit Card Acquisition Provides Opportunity Post Conversion First Niagara will be a Top 35 credit card provider in the U.S. HSBC will drive 10x increase in credit card receivables New operating platform and product suite expands customer choice and capabilities Multiple product offerings 6 Consumer cards 2 Business cards Newly designed, robust rewards program Increases fee generation opportunity Marketing to promote debit & credit card usage Post HSBC Conversion Demographics 36 HSBC Branches |

| Opportunity Exists in Indirect Auto to Obtain Valuable Assets Source: U.S. Department of Commerce: Bureau of Economic Analysis. Forecast Source: Automotive News Millions of Units Light Weight Vehicle Sales Forecast National Automobile Market Assessment The Northeast Region comprises ~20% of the Current Auto Loans Outstanding Nationally Source: U.S. Department of Commerce: Bureau of Economic Analysis, TransUnion LLC, JD Power PIN 37 |

| Consumer Finance -- Indirect Auto Accelerates Balance Sheet Rotation Number of Dealers Participating Loans Outstanding $2B Strong start in just three months Provides new customer and balance acquisition channel Hired experienced teams with proven market knowledge Established in 9 states in the Northeast 500 1,000 1,500 $30M $500M $2B 38 |

| Operating EPS increases 13%1 year-over-year; consistent revenue growth Organic commercial loan growth leading top quartile peers Superior credit performance continues Capital structure adequate for low-risk balance sheet Financially NewAlliance conversion and integration successfully completed New product and service investments continue Operational excellence is the focus during M&A pause Commercial bank evolution continues; Dialog and relationship with new regulators constructive Operationally Talent and culture investments driving brand value Retail franchise driven by new leadership and key investments HSBC branch acquisition accelerates key retail initiatives Commercial business increasing specialty capabilities Strategically 1 Operating EPS used in calculation. Operating EPS is a non-GAAP measure and excludes the merger and integration costs related to the acquisitions and other non-operating items. Refer to the Appendix for further details. 2011: Delivering on our Commitments 39 |

| 40 |

| Annual Meeting Of Stockholders G. Thomas Bowers Chairman of the Board John R. Koelmel Chief Executive Officer Gregory W. Norwood Chief Financial Officer April 25, 2012 |

| 42 |

| 43 (1) Peer group represents commercial banks with total assets between $20 -$100 billion with similar business models. Benchmarking Peer Group (1) |

| Non-GAAP Measures - This presentation contains financial information determined by methods other than in accordance with accounting principles generally accepted in the United States of America (GAAP). The Company believes that these non-GAAP financial measures provide a meaningful comparison of the underlying operational performance of the Company, and facilitate investors' assessments of business and performance trends in comparison to others in the financial services industry. In addition, the Company believes the exclusion of these non-operating items enables management to perform a more effective evaluation and comparison of the Company's results and to assess performance in relation to the Company's ongoing operations. These disclosures should not be viewed as a substitute for financial measures determined in accordance with GAAP, nor are they necessarily comparable to non-GAAP performance measures that may be presented by other companies. Where non-GAAP disclosures are used in this presentation, the comparable GAAP financial measure, as well as the reconciliation to the comparable GAAP financial member, can be found in this Appendix. 44 GAAP to Non-GAAP Reconciliation |

| 45 GAAP to Non-GAAP Reconciliation |
