Attached files
| file | filename |
|---|---|
| 8-K - FORM 8-K - Avery Dennison Corp | d339409d8k.htm |
| EX-99.1 - PRESS RELEASE, DATED APRIL 25, 2012 - Avery Dennison Corp | d339409dex991.htm |
Exhibit 99.2
AVERY DENNISON
First Quarter 2012 Financial Review and Analysis
(preliminary, unaudited)
Supplemental Presentation Materials April 25, 2012
Unless otherwise indicated, the discussion of the company’s results is focused on its continuing operations
Certain statements contained in this document are “forward-looking statements” intended to qualify for the safe harbor from liability established by the Private Securities Litigation Reform Act of 1995. These forward-looking statements and financial or other business targets are subject to certain risks and uncertainties. Actual results and trends may differ materially from historical or anticipated results depending on a variety of factors, including but not limited to risks and uncertainties relating to the following: fluctuations in demand affecting sales to customers; the financial condition and inventory strategies of customers; changes in customer order patterns; worldwide and local economic conditions; fluctuations in cost and availability of raw materials; ability of the company to generate sustained productivity improvement; ability of the company to achieve and sustain targeted cost reductions; impact of competitive products and pricing; loss of significant contract(s) or customer(s); collection of receivables from customers; selling prices; business mix shift; changes in tax laws and regulations, and uncertainties associated with interpretations of such laws and regulations; outcome of tax audits; timely development and market acceptance of new products, including sustainable or sustainably-sourced products; investment in development activities and new production facilities; fluctuations in foreign currency exchange rates and other risks associated with foreign operations; integration of acquisitions and completion of pending dispositions; amounts of future dividends and share repurchases; customer and supplier concentrations; successful implementation of new manufacturing technologies and installation of manufacturing equipment; disruptions in information technology systems; successful installation of new or upgraded information technology systems; volatility of financial markets; impairment of capitalized assets, including goodwill and other intangibles; credit risks; ability of the company to obtain adequate financing arrangements and maintain access to capital; fluctuations in interest and tax rates; fluctuations in pension, insurance and employee benefit costs; impact of legal and regulatory proceedings, including with respect to environmental, health and safety; changes in governmental laws and regulations; changes in political conditions; impact of epidemiological events on the economy and the company’s customers and suppliers; acts of war, terrorism, and natural disasters; and other factors.
The company believes that the most significant risk factors that could affect its financial performance in the near-term include (1) the impact of economic conditions on underlying demand for the company’s products; (2) the degree to which higher costs can be offset with productivity measures and/or passed on to customers through selling price increases, without a significant loss of volume; and (3) competitors’ actions, including pricing, expansion in key markets, and product offerings.
For a more detailed discussion of these and other factors, see “Risk Factors” and “Management’s Discussion and Analysis of Results of Operations and Financial Condition” in the company’s 2011 Form 10-K, filed on February 27, 2012 with the Securities and Exchange Commission. The forward-looking statements included in this document are made only as of the date of this document, and the company undertakes no obligation to update these statements to reflect subsequent events or circumstances.
Use of Non-GAAP Financial Measures
This presentation contains certain non-GAAP financial measures as defined by SEC rules. Reconciliations of non-GAAP financial measures to the most directly comparable GAAP financial measures, including limitations associated with these non-GAAP financial measures, are provided in the financial schedules accompanying the earnings news release for the quarter, along with certain supplemental analysis provided in this document. (See Attachments A-2 through A-4 to news release dated April 25, 2012.)
The company’s non-GAAP financial measures exclude the impact of certain events, activities or strategic decisions. The accounting effects of these events, activities or decisions, which are included in the GAAP financial measures, may make it difficult to assess the underlying performance of the company in a single period. By excluding certain accounting effects, both positive and negative, of certain items (e.g., restructuring costs, asset impairments, legal settlements, certain effects of strategic transactions and related costs, loss from debt extinguishments, loss from curtailment and settlement of pension obligations, gains or losses on sale of certain assets and other items), the company believes that it is providing meaningful supplemental information to facilitate an understanding of the company’s core operating results and liquidity measures. These non-GAAP financial measures are used internally to evaluate trends in the company’s underlying businesses, as well as to facilitate comparison to the results of competitors for a single period. While some of the items excluded from GAAP financial measures may recur, they tend to be disparate in amount, frequency, and timing.
The company uses the following non-GAAP financial measures in this presentation:
• Organic sales change refers to the increase or decrease in sales excluding the estimated impact of currency translation, acquisitions and divestitures;
• Adjusted operating margin refers to earnings before interest expense and taxes, excluding restructuring costs and
other items, as a percentage of sales;
• Adjusted tax rate refers to the anticipated full year GAAP tax rate adjusted for certain discrete events;
• Adjusted EPS refers to as reported net income per common share, assuming dilution, adjusted for the tax-effected restructuring costs and
other items; and
• Free cash flow refers to cash flow from operations, less net payments for property, plant, and equipment, software and other
deferred charges, plus (minus) net proceeds from sale (purchase) of investments. Free cash flow excludes mandatory debt service
requirements and other uses of cash that do not directly or immediately support the underlying business (such as discretionary
debt reductions, dividends, share repurchases, and certain effects of acquisitions and divestitures).
This document has been furnished (not filed) on Form 8-K with the SEC and may be found on the company’s website at www.investors.averydennison.com.
First Quarter Overview
First quarter results in line with expectations
• Sales levels consistent with recent trends; down approx. 1% on organic basis as volumes declined modestly, partially offset by pricing
• Operating margin improved 30 basis points due to productivity initiatives and higher prices, which more than offset the impact of lower volume
» Excluding costs associated with restructuring, operating margin improved 60 basis points
• Free cash flow, including discontinued operations, improved to negative $21 mil. (estimated negative $30 mil. from continuing operations), reflecting lower bonus payments for 2011 and improvements in working capital
Increasing return of cash to shareholders
• Repurchased 2.4 mil. shares in 1Q12
• Maintaining strong balance sheet
No change to guidance for 2012 EPS and free cash flow
| 4 |
|
First Quarter 2012 Financial Review and Analysis | April 25, 2012 |
AVERY DENNISON
First Quarter P&L Summary
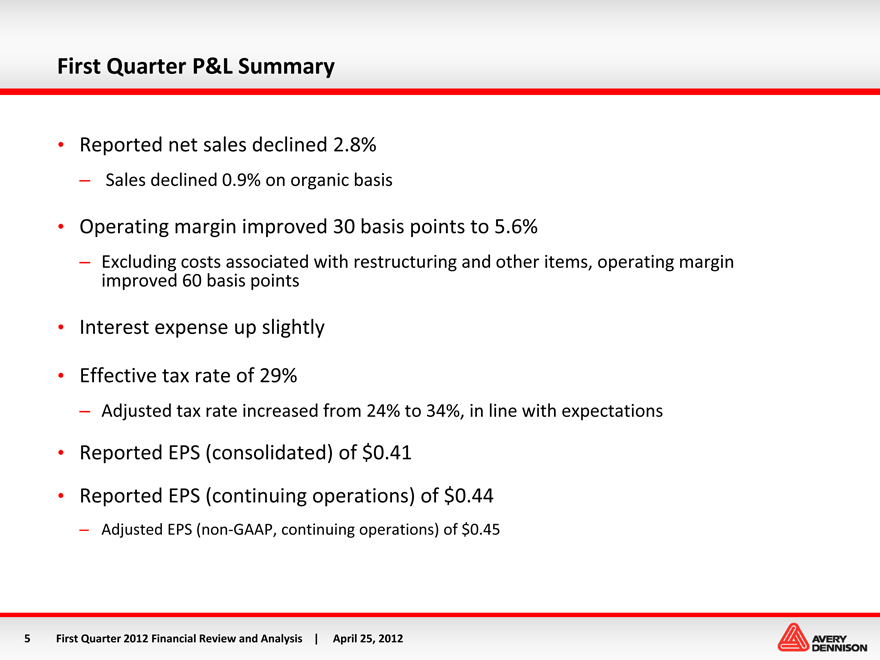
Reported net sales declined 2.8%
Sales declined 0.9% on organic basis
Operating margin improved 30 basis points to 5.6%
Excluding costs associated with restructuring and other items, operating margin improved 60 basis points
Interest expense up slightly
Effective tax rate of 29%
Adjusted tax rate increased from 24% to 34%, in line with expectations
Reported EPS (consolidated) of $0.41
Reported EPS (continuing operations) of $0.44
Adjusted EPS (non-GAAP, continuing operations) of $0.45
| 5 |
|
First Quarter 2012 Financial Review and Analysis | April 25, 2012 |
AVERY DENNISON
Sales Trend Analysis
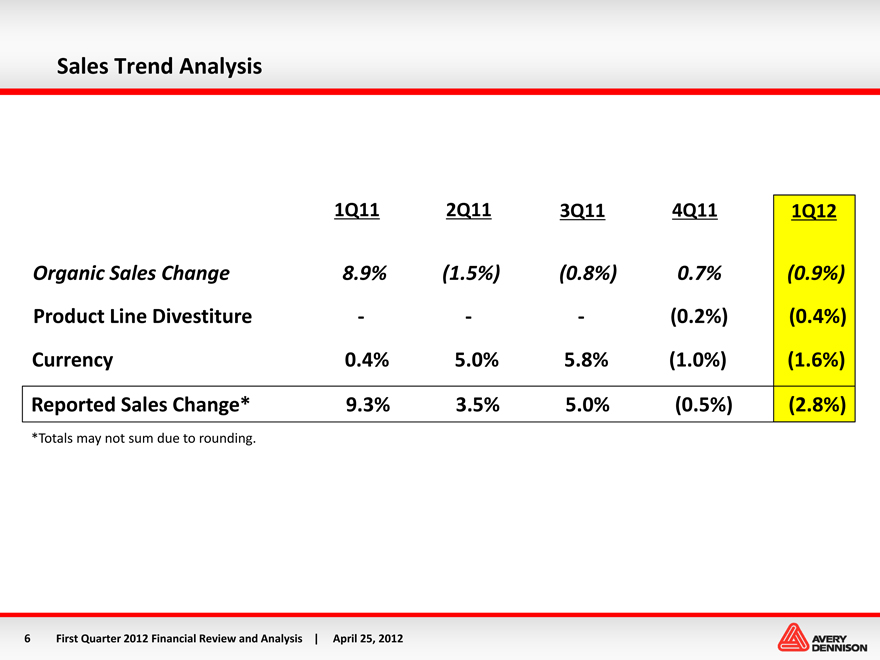
1Q11 2Q11 3Q11 4Q11 1Q12
Organic Sales Change 8.9% (1.5%) (0.8%) 0.7% (0.9%)
Product Line Divestiture —— (0.2%) (0.4%) Currency 0.4% 5.0% 5.8% (1.0%) (1.6%)
Reported Sales Change* 9.3% 3.5% 5.0% (0.5%) (2.8%)
*Totals may not sum due to rounding.
| 6 |
|
First Quarter 2012 Financial Review and Analysis | April 25, 2012 |
AVERY DENNISON
Margin Analysis
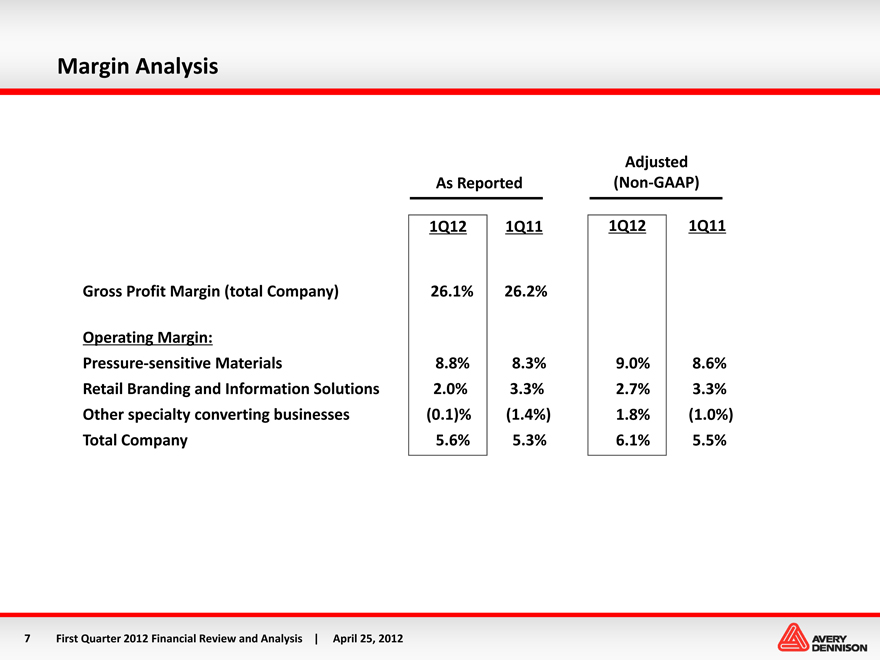
1Q12 1Q11 1Q12 1Q11
Adjusted
As Reported (Non-GAAP)
Gross Profit Margin (total Company) 26.1% 26.2%
Operating Margin:
Pressure-sensitive Materials 8.8% 8.3% 9.0% 8.6% Retail Branding and Information Solutions 2.0% 3.3% 2.7% 3.3% Other specialty converting businesses (0.1)% (1.4%) 1.8% (1.0%) Total Company 5.6% 5.3% 6.1% 5.5%
| 7 |
|
First Quarter 2012 Financial Review and Analysis | April 25, 2012 |
AVERY DENNISON
First Quarter Segment Overview
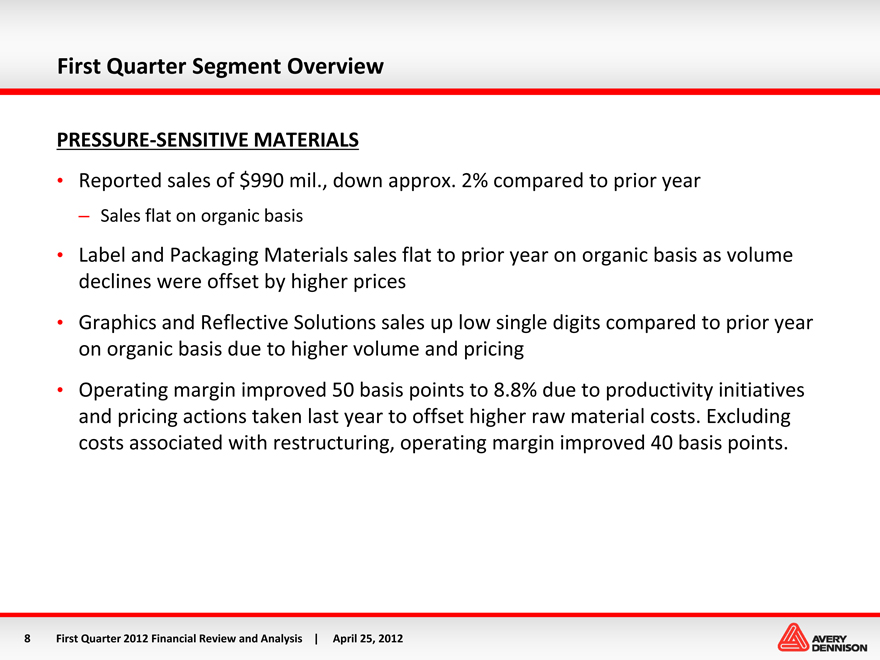
PRESSURE-SENSITIVE MATERIALS
Reported sales of $990 mil., down approx. 2% compared to prior year
Sales flat on organic basis
Label and Packaging Materials sales flat to prior year on organic basis as volume declines were offset by higher prices
Graphics and Reflective Solutions sales up low single digits compared to prior year on organic basis due to higher volume and pricing
Operating margin improved 50 basis points to 8.8% due to productivity initiatives and pricing actions taken last year to offset higher raw material costs. Excluding costs associated with restructuring, operating margin improved 40 basis points.
| 8 |
|
First Quarter 2012 Financial Review and Analysis | April 25, 2012 |
AVERY DENNISON
First Quarter Segment Overview (continued)
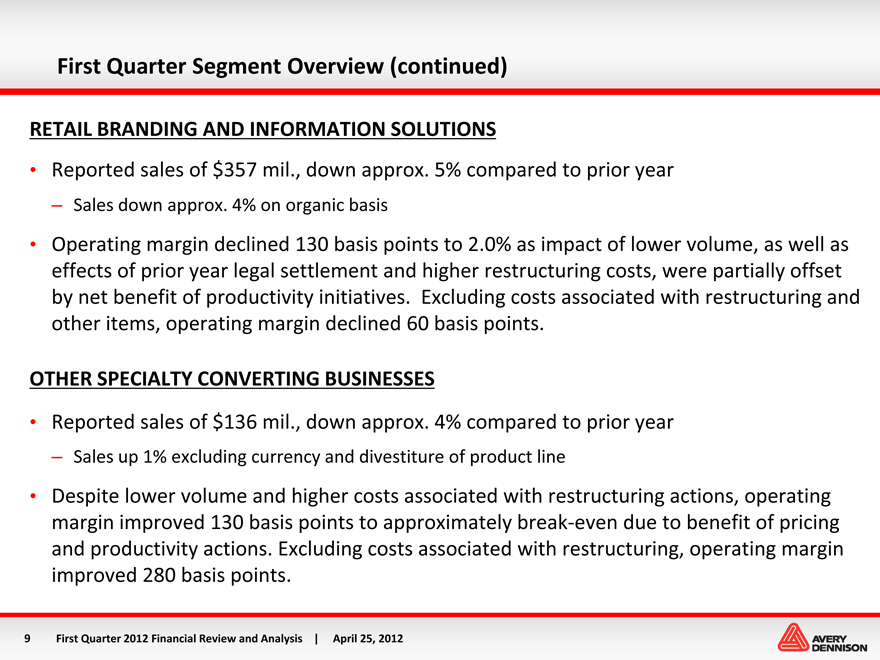
RETAIL BRANDING AND INFORMATION SOLUTIONS
Reported sales of $357 mil., down approx. 5% compared to prior year
Sales down approx. 4% on organic basis
Operating margin declined 130 basis points to 2.0% as impact of lower volume, as well as effects of prior year legal settlement and higher restructuring costs, were partially offset by net benefit of productivity initiatives. Excluding costs associated with restructuring and other items, operating margin declined 60 basis points.
OTHER SPECIALTY CONVERTING BUSINESSES
Reported sales of $136 mil., down approx. 4% compared to prior year
Sales up 1% excluding currency and divestiture of product line
Despite lower volume and higher costs associated with restructuring actions, operating margin improved 130 basis points to approximately break-even due to benefit of pricing and productivity actions. Excluding costs associated with restructuring, operating margin improved 280 basis points.
AVERY DENNISON
9 First Quarter 2012 Financial Review and Analysis | April 25, 2012
Contributing Factors to 2012 Results
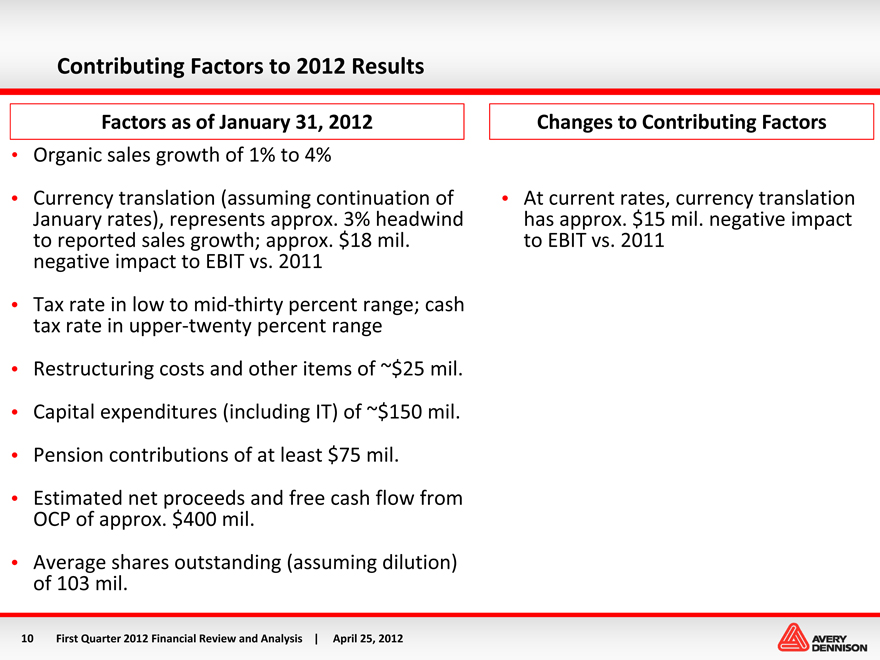
Factors as of January 31, 2012 Changes to Contributing Factors
Organic sales growth of 1% to 4%
Currency translation (assuming continuation of • At current rates, currency translation January rates), represents approx. 3% headwind has approx. $15 mil. negative impact to reported sales growth; approx. $18 mil. to EBIT vs. 2011 negative impact to EBIT vs. 2011
Tax rate in low to mid-thirty percent range; cash tax rate in upper-twenty percent range
Restructuring costs and other items of ~$25 mil.
Capital expenditures (including IT) of ~$150 mil.
Pension contributions of at least $75 mil.
Estimated net proceeds and free cash flow from OCP of approx. $400 mil.
Average shares outstanding (assuming dilution) of 103 mil.
10 First Quarter 2012 Financial Review and Analysis | April 25, 2012
AVERY DENNISON
2012 EPS and Free Cash Flow Guidance (Continuing Operations)
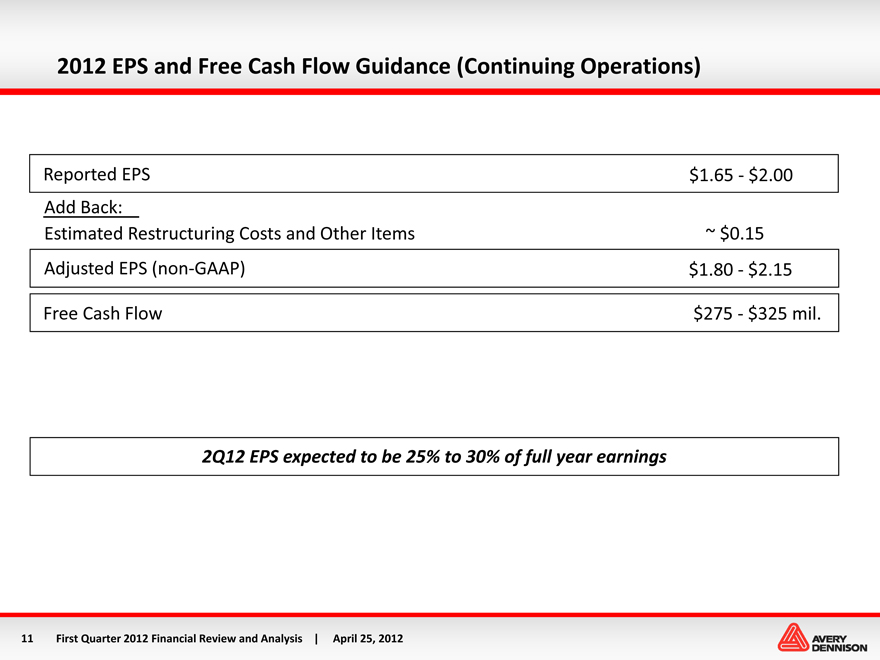
Reported EPS $1.65—$2.00
Add Back:
Estimated Restructuring Costs and Other Items ~ $0.15
Adjusted EPS (non-GAAP) $1.80—$2.15
Free Cash Flow $275—$325 mil.
2Q12 EPS expected to be 25% to 30% of full year earnings
11 First Quarter 2012 Financial Review and Analysis | April 25, 2012
AVERY DENNISON