Attached files
| file | filename |
|---|---|
| 8-K - FORM 8-K - Western Union CO | d338747d8k.htm |
| EX-99.1 - PRESS RELEASE OF THE WESTERN UNION COMPANY - Western Union CO | d338747dex991.htm |
 Western Union
First Quarter 2012
Earnings Webcast & Conference Call
April 24, 2012
Exhibit 99.2 |
 Mike
Salop Senior Vice President, Investor Relations
*
*
*
*
*
*
*
*
* |
 New segment structure beginning Q1 2012
Consumer-to-Consumer (C2C) now reporting six regions:
Europe and Commonwealth of Independent States (CIS)
North America including US, Canada, Mexico
Middle East and Africa
Asia Pacific including India and South Asia (APAC)
Latin America and the Caribbean (LACA)
westernunion.com (from all geographic regions)
Consumer-to-Business (C2B)
Business Solutions
Other (primarily Retail Money Order, Prepaid and Mobile
Money Transfer)
3
Q1 New Segment Structure |
 Safe
Harbor 4
This presentation contains certain statements that are forward-looking within
the meaning of the Private Securities Litigation Reform Act of 1995. These statements are
not
guarantees
of
future
performance
and
involve
certain
risks,
uncertainties
and
assumptions
that
are
difficult
to
predict.
Actual
outcomes
and
results
may
differ
materially
from
those
expressed
in,
or
implied
by,
our
forward-looking
statements.
Words
such
as
“expects,”
“intends,”
“anticipates,”
“believes,”
“estimates,”
“guides,”
“provides
guidance,”
“provides
outlook”
and
other
similar
expressions
or
future
or
conditional
verbs
such
as
“will,”
“should,”
“would”
and
“could”
are
intended
to
identify
such
forward-looking
statements.
Readers
of
this
presentation
by
The
Western
Union
Company
(the
“Company,”
“Western
Union,”
“we,”
“our”
or
“us”)
should
not
rely
solely
on
the
forward-looking
statements
and
should
consider
all
uncertainties
and
risks
throughout
the
Annual
Report
on
Form
10-K
for
the
year
ended
December
31,
2011, including those described under “Risk Factors”. The statements are
only as of the date they are made, and the Company undertakes no obligation to update any
forward-looking statement.
Possible events or factors that could cause results or performance to differ
materially from those expressed in our forward-looking statements include the following: (i)
events
related
to
our
business
and
industry,
such
as:
deterioration
in
consumers'
and
clients'
confidence
in
our
business,
or
in
money
transfer
and
payment
service
providers generally; changes in general economic conditions and economic conditions
in the regions and industries in which we operate, including global economic
downturns
and
financial
market
disruptions;
political
conditions
and
related
actions
in
the
United
States
and
abroad
which
may
adversely
affect
our
business
and
economic
conditions
as
a
whole;
interruptions
of
United
States
government
relations
with
countries
in
which
we
have
or
are
implementing
material
agent
contracts;
changes
in,
and
failure
to
manage
effectively
exposure
to,
foreign
exchange
rates,
including
the
impact
of
the
regulation
of
foreign
exchange
spreads
on
money
transfers
and
payment
transactions;
changes
in
immigration
laws,
interruptions
in
immigration
patterns
and
other
factors
related
to
migrants;
our
ability
to
adapt
technology
in
response
to
changing
industry
and
consumer
needs
or
trends;
our
failure
to
develop
and
introduce
new
services
and
enhancements,
and
gain
market
acceptance
of
such
services;
mergers,
acquisitions
and
integration
of
acquired
businesses
and
technologies
into
our
Company,
and
the
realization
of
anticipated
financial
benefits
from
these
acquisitions;
decisions
to
downsize,
sell
or
close
units,
or
to
transition
operating
activities
from
one
location
to
another
or
to
third
parties,
particularly transitions from the United States to other countries; decisions to
change our business mix; failure to manage credit and fraud risks presented by our agents,
clients and consumers or non-performance by our banks, lenders, other financial
services providers or insurers; adverse movements and volatility in capital markets and
other
events
which
affect
our
liquidity,
the
liquidity
of
our
agents
or
clients,
or
the
value
of,
or
our
ability
to
recover
our
investments
or
amounts
payable
to
us;
any
material
breach
of
security
or
safeguards
of
or
interruptions
in
any
of
our
systems;
our
ability
to
attract
and
retain
qualified
key
employees
and
to
manage
our
workforce
successfully;
our
ability
to
maintain
our
agent
network
and
business
relationships
under
terms
consistent
with
or
more
advantageous
to
us
than
those
currently
in
place;
adverse rating actions by credit rating agencies; failure to compete effectively in
the money transfer industry with respect to global and niche or corridor money transfer
providers,
banks
and
other
money
transfer
services
providers,
including
telecommunications
providers,
card
associations,
card-based
payment
providers
and
electronic
and
Internet
providers;
our
ability
to
protect
our
brands
and
our
other
intellectual
property
rights;
our
failure
to
manage
the
potential
both
for
patent
protection
and
patent
liability
in
the
context
of
a
rapidly
developing
legal
framework
for
intellectual
property
protection;
changes
in
tax
laws
and
unfavorable
resolution
of
tax
contingencies;
cessation
of
various
services
provided
to
us
by
third-party
vendors;
material
changes
in
the
market
value
or
liquidity
of
securities
that
we
hold;
restrictions
imposed
by
our
debt
obligations;
significantly
slower
growth
or
declines
in
the
money
transfer
market
and
other
markets
in
which
we
operate;
changes
in
industry
standards
affecting
our
business;
(ii)
events
related
to
our
regulatory
and
litigation
environment,
such
as:
the
failure
by
us,
our
agents
or
their
subagents
to
comply
with
laws
and
regulations
designed
to
detect
and
prevent
money
laundering,
terrorist
financing,
fraud
and
other
illicit
activity;
changes
in
United
States
or
foreign
laws,
rules
and
regulations
including
the
Internal
Revenue
Code,
governmental
or
judicial
interpretations
thereof
and
industry
practices
and
standards;
liabilities
resulting
from
a
failure
of
our
agents or subagents to comply with laws and regulations; increased costs due to
regulatory initiatives and changes in laws, regulations and industry practices and
standards affecting our agents; liabilities and unanticipated developments
resulting from governmental investigations and consent agreements with, or enforcement
actions by, regulators, including those associated with compliance with, or a
failure to comply with the settlement agreement with the State of Arizona; the impact on our
business of the Dodd-Frank Wall Street Reform and Consumer Protection Act, the
rules promulgated there-under and the creation of the Consumer Financial Protection
Bureau; liabilities resulting from litigation, including class-action lawsuits
and similar matters, including costs, expenses, settlements and judgments; failure to comply
with regulations regarding consumer privacy and data use and security; effects of
unclaimed property laws; failure to maintain sufficient amounts or types of regulatory
capital to meet the changing requirements of our regulators worldwide; changes in
accounting standards, rules and interpretations; and (iii) other events, such as:
adverse
consequences
from
our
spin-off
from
First
Data
Corporation;
catastrophic
events;
and
management's
ability
to
identify
and
manage
these
and
other
risks. |
 Hikmet Ersek
President
& Chief Executive Officer
*
*
*
*
*
*
*
*
* |
 C2C revenue growth accelerated
4% reported, or 5% constant currency*
Reached 500,000 Agent locations in April
Business Solutions integration on track
Pro forma revenue growth 5%, or 4% constant currency*
Strong progress in Ventures
westernunion.com money transfer revenue increased 39%
6
Q1 Highlights
Returned over $200 million
through
buyback and dividends
*Note: See appendix for reconciliation of Non-GAAP to GAAP financial measures.
|
 New services
WU Pay electronics payment platform launched
Key agreements
Mobile money transfer to integrate with Ericsson’s platforms
Acxsys agreement for international account based money
transfer for customers of Canadian banks
Business Solutions launched pension payment services for
Mercer Outsourcing in the U.K. enabling payments to 80
countries
7
Q1 Highlights |
 Scott Scheirman
Executive Vice President
Chief Financial Officer & Global Operations
*
*
*
*
*
*
*
*
* |
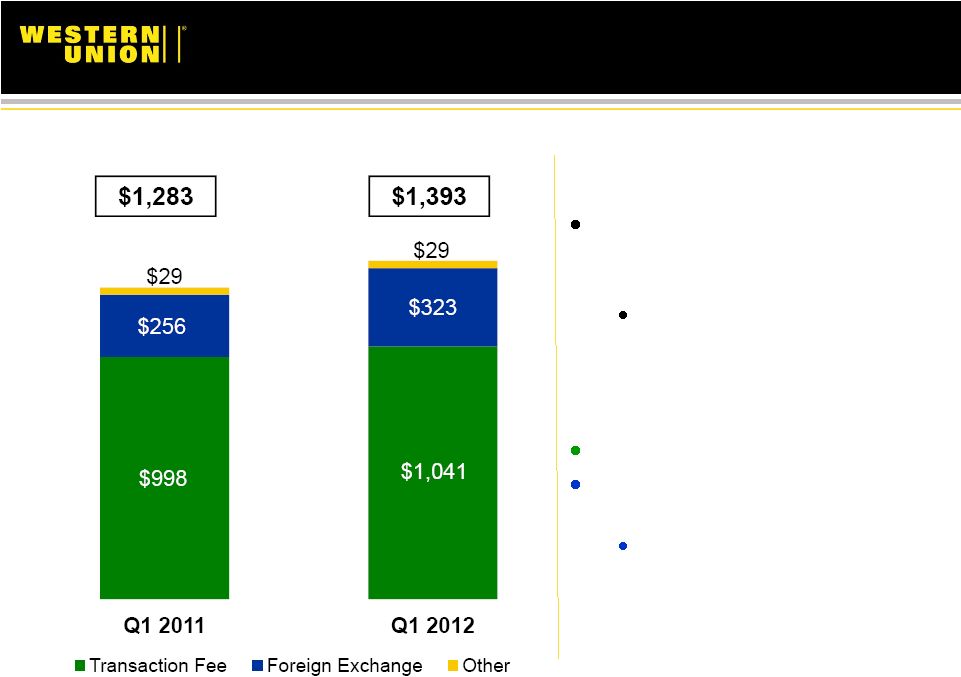 Revenue
9
($ in millions)
*Note: See appendix for reconciliation of Non-GAAP to GAAP financial measures.
Consolidated revenue up 9%
reported and constant currency
adjusted*
Pro forma revenue increase
4%, or 5% constant currency,
including Travelex Global
Business Payments (TGBP) in
prior period*
Transaction fees increased 4%
Foreign exchange revenue
increased 26%
TGBP acquisition aided FX
revenue |
 Consumer-to-Consumer
10
C2C 81% of Company revenue
C2C revenue growth of 4% reported, or 5% constant currency*
Transaction growth of 7%
Total Q1 Western Union cross-border principal of $18 billion
Increased 2% on a reported basis
Increased 3% constant currency*
Principal per transaction
Declined 4% on a reported basis
Declined 3% on a constant currency basis*
*Note: See appendix for reconciliation of Non-GAAP to GAAP financial measures.
|
 Consumer-to-Consumer
11
Regions
Revenue
Growth
Transaction
Growth
% of Total
Revenue
Europe and CIS
0%
1%
22%
North America
5%
6%
21%
Middle East and Africa
6%
9%
15%
Asia Pacific
7%
6%
12%
Latin America and Caribbean
2%
8%
9%
westernunion.com
39%
41%
2%
Q1 2012 |
 Electronic Channels & Prepaid Highlights
Account-based money transfer
Revenue increased 43%
Agreements in place with nearly 90 banks globally
westernunion.com
C2C revenue increased 39%
Total WU.com revenue increased 37% (includes C2B)
Prepaid
Revenue increased 17%
Over $260 million loaded through 600,000 loads
12
Electronic Channels Revenue Growth 38% |
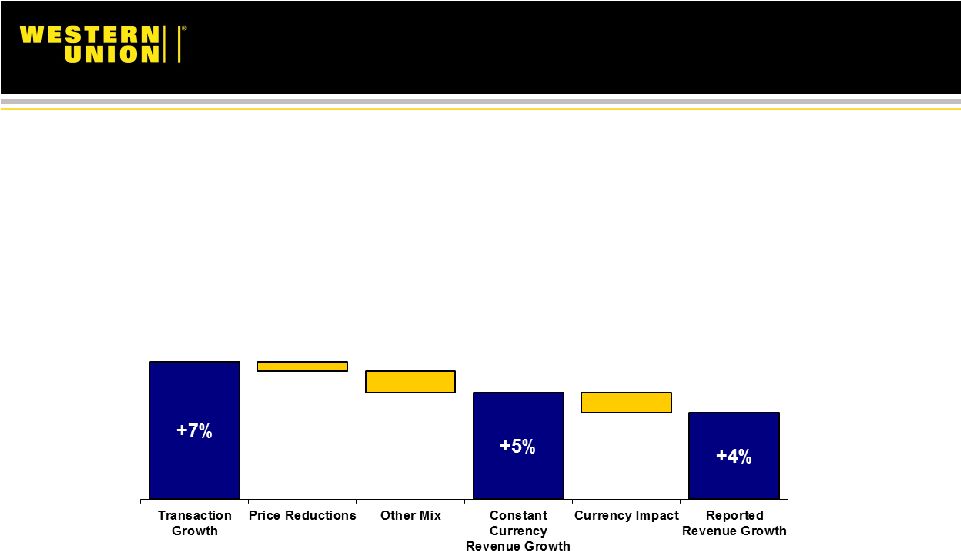 C2C
Transaction and Revenue Growth 13
Q1 2012
*Note: See appendix for reconciliation of Non-GAAP to GAAP financial measures.
|
 Consumer-to-Business
14
C2B 11% of Company revenue
Revenue increased 1%, or 3% constant currency*
Led by growth in South America
*Note: See appendix for reconciliation of Non-GAAP to GAAP financial measures.
|
 Business Solutions
15
Business Solutions 6% of Company revenue
Pro forma revenue increased 5%*, or 4% constant currency*, including
TGBP in the prior year period
Strong growth in Australia, softness in North America and the U.K.
New customer acquisitions remain strong
Integration of TGBP progressing on track
*Note: See appendix for reconciliation of Non-GAAP to GAAP financial measures.
|
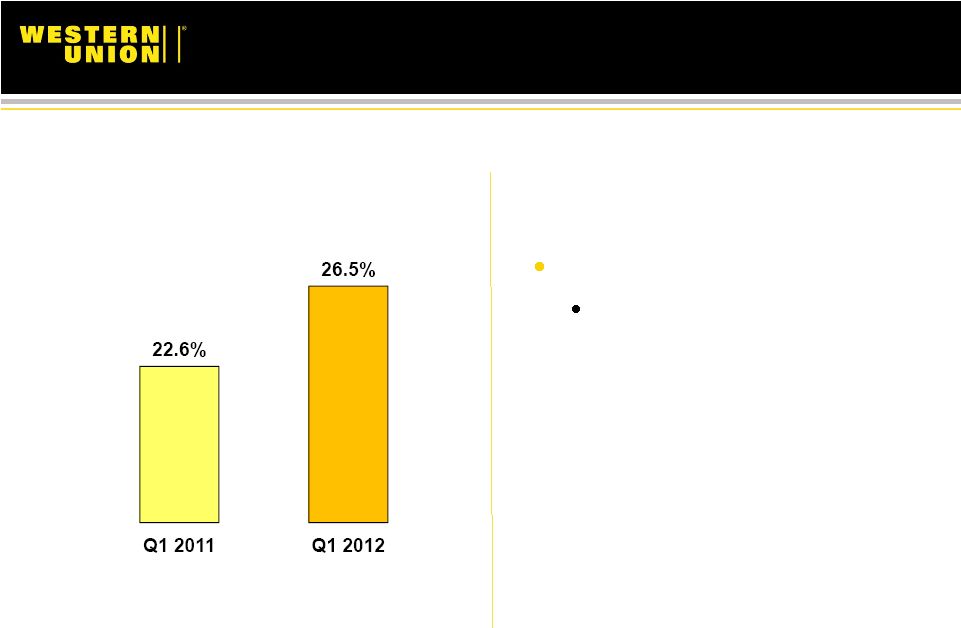
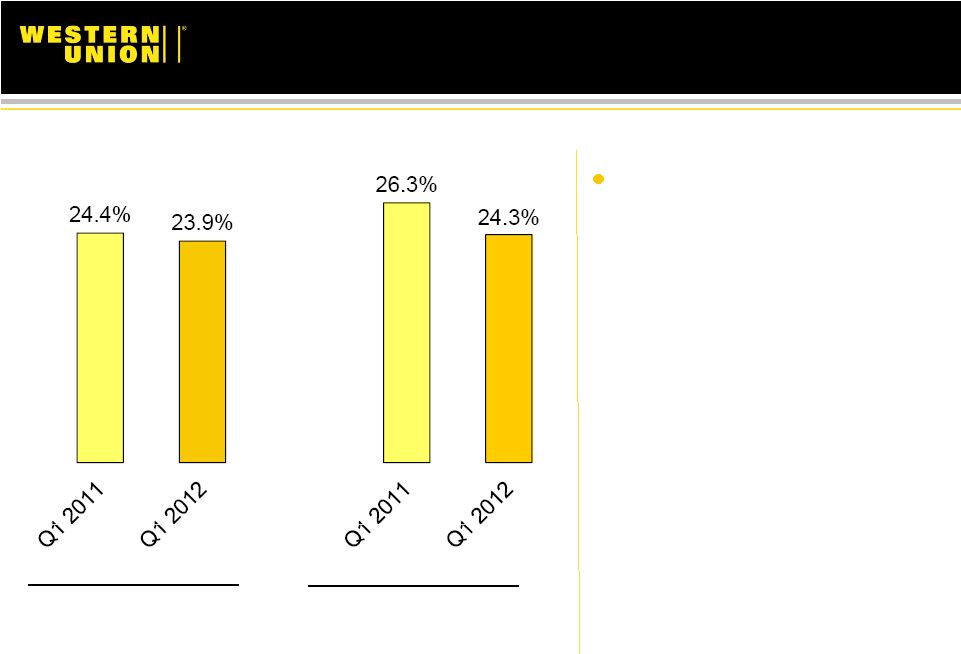 16
Operating Margin
GAAP
Excluding
Restructuring and
TGBP Integration
Expenses*
Operating margin excluding
restructuring expense and TGBP
integration expense declined 200
basis points
•
Business Solutions results
negatively impacted margin,
including $10 million of
incremental TGBP intangibles
amortization
•
Higher marketing, additional
investments, compliance
costs, and timing of expenses,
partially offset by benefits from
revenue leverage, currency,
restructuring savings and
reduced bank fees
•
Expect full year margin to be in
line with financial outlook
*Note: See appendix for reconciliation of Non-GAAP to GAAP financial measures.
|
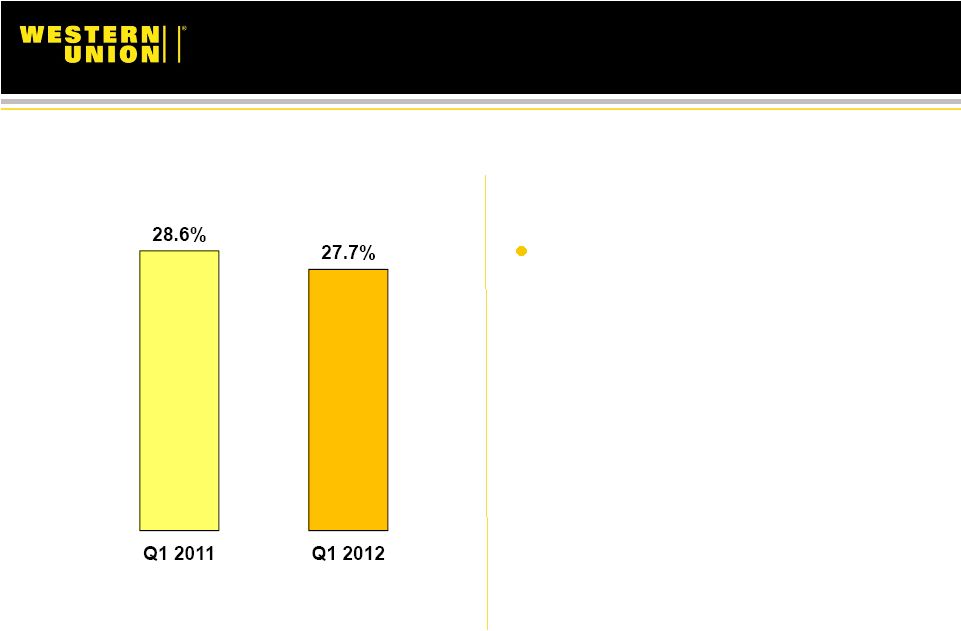 17
C2C Operating Margin
Operating margin decreased 90 basis
points from prior year
•
Increased marketing, Costa and
Finint acquisition related expenses,
investments in WU.com and
compliance costs
•
Partially offset by benefits from
revenue leverage, currency, and
restructuring savings |
 18
C2B Operating Margin
Operating margin improvement
Primarily due to the benefit of
lower debit processing expenses
related to Durbin |
 19
Business Solutions Operating Margin
Operating Loss
Operating loss of $15 million compared to an operating loss of $4
million in the prior year period
Includes $14 million of intangibles amortization in current quarter and
$4 million in the prior year period
Includes $6 million of integration expenses in the current quarter
|
 20
Financial Strength
1Q 2012
Cash Flow from Operations*
$215 million
Capital Expenditures
$76 million
Stock Repurchases
$147 million
Dividends Paid
$62 million
Cash Balance, March 31, 2012
$1.4 billion
Debt Outstanding, March 31, 2012
$3.6 billion
*
Note:
Includes
the
impact
of
tax
payments
of
approximately
$65
million
relating
to
the
agreement with the U.S. Internal Revenue Service announced December 15, 2011
|
 2012
Outlook 21
February 2012 Outlook Affirmed
Constant currency revenue growth in the range of 6% to 8%*, including 4%
benefit from a full year of TGBP
GAAP revenue growth 2% lower than constant currency
Operating margins expected to be similar to 2011
GAAP operating margin of approximately 25%
Operating margin excluding TGBP integration costs of approximately 26%*
EBITDA margin of approximately 30% excluding TGBP integration costs*
GAAP EPS in a range of $1.65 to $1.70, or $1.70 to $1.75 excluding TGBP
integration expense*
GAAP
cash
flows
from
operations
in
range
of
$1.0
billion
to
$1.1
billion,
or
$1.2
billion to $1.3 billion excluding estimated tax payments of approximately $200
million related to the IRS agreement*
*Note: See appendix for reconciliation of Non-GAAP to GAAP financial measures.
|
 Questions & Answers
*
*
*
*
*
*
*
*
* |
 Appendix
First Quarter 2012 Earnings
Webcast & Conference Call
April 24, 2012
23 |
 Non-GAAP Measures
24
Western Union's management believes the non-GAAP financial measures presented
provide meaningful supplemental information regarding our operating results
to assist management, investors, analysts, and others in understanding our
financial results and to better analyze trends in our underlying business,
because they provide consistency and comparability to prior periods. These
non-GAAP financial measures include revenue change constant currency
adjusted, pro forma revenue change TGBP adjusted, pro forma revenue change
TGBP and constant currency adjusted, operating income margin excluding restructuring
and TGBP integration expense, EBITDA margin excluding restructuring and TGBP
integration expense, earnings per share restructuring, IRS Agreement and
TGBP integration expense adjusted, Consumer-to- Consumer segment
revenue change constant currency adjusted, Consumer-to-Consumer segment
principal per transaction change constant currency adjusted,
Consumer-to-Consumer segment cross- border principal change
constant currency adjusted, Consumer-to-Business segment revenue change
constant
currency
adjusted,
Business
Solutions
segment
pro
forma
revenue
change
TGBP
adjusted,
Business Solutions segment pro forma revenue change TGBP and constant currency
adjusted, 2012 revenue change outlook constant currency adjusted, 2012
operating income margin outlook TGBP integration expense adjusted, 2012
EBITDA margin outlook TGBP integration expense adjusted, 2012 earnings per
share outlook TGBP integration expense adjusted, and 2012 operating cash flow outlook IRS
Agreement adjusted.
A non-GAAP financial measure should not be considered in isolation or as a
substitute for the most comparable GAAP financial measure. A non-GAAP
financial measure reflects an additional way of viewing aspects of our
operations that, when viewed with our GAAP results and the reconciliation to the
corresponding GAAP financial measure, provide a more complete understanding of our
business. Users of the financial statements are encouraged to review our
financial statements and publicly-filed reports in their entirety and
not to rely on any single financial measure. A reconciliation of non-GAAP financial measures to
the
most
directly
comparable
GAAP
financial
measures
is
included
below.
All adjusted year-over-year changes were calculated using prior year
reported amounts, unless indicated otherwise. Amounts included below
are in millions, unless indicated otherwise. |
 Reconciliation of Non-GAAP Measures
25
1Q11
2Q11
3Q11
4Q11
FY2011
1Q12
Consolidated Metrics
Revenues, as reported (GAAP)
1,283.0
$
1,366.3
$
1,410.8
$
1,431.3
$
5,491.4
$
1,393.4
$
Foreign currency translation impact (a)
2.3
(32.5)
(18.2)
10.4
(38.0)
8.1
Revenues, constant currency adjusted
1,285.3
$
1,333.8
$
1,392.6
$
1,441.7
$
5,453.4
$
1,401.5
$
Prior year revenues, as reported (GAAP)
1,232.7
$
1,273.4
$
1,329.6
$
1,357.0
$
5,192.7
$
1,283.0
$
Pro forma prior year revenues, TGBP adjusted (b)
N/A
N/A
N/A
N/A
N/A
1,338.0
$
Revenue change, as reported (GAAP)
4
%
7
%
6
%
5
%
6
%
9
%
Revenue change, constant currency adjusted
4
%
5
%
5
%
6
%
5
%
9
%
Pro forma revenue change, TGBP adjusted
N/A
N/A
N/A
N/A
N/A
4
%
Pro forma revenue change, TGBP and constant currency adjusted
N/A
N/A
N/A
N/A
N/A
5
%
Operating income, as reported (GAAP)
312.9
$
350.7
$
363.0
$
358.4
$
1,385.0
$
332.5
$
Reversal of restructuring and related expenses (c)
24.0
8.9
13.9
-
46.8
-
Reversal of TGBP integration expense (d)
N/A
N/A
N/A
4.8
4.8
6.4
Operating income, excl. restructuring and TGBP integration
expense 336.9
$
359.6
$
376.9
$
363.2
$
1,436.6
$
338.9
$
Operating income margin, as reported (GAAP)
24.4%
25.7%
25.7%
25.0%
25.2%
23.9%
Operating income margin, excl. restructuring
26.3%
26.3%
26.7%
25.0%
26.1%
23.9%
Operating income margin, excl. restructuring and TGBP integration
expense N/A
N/A
N/A
25.4%
26.2%
24.3%
Operating income, as reported (GAAP)
312.9
$
350.7
$
363.0
$
358.4
$
1,385.0
$
332.5
$
Reversal of depreciation and amortization (e)
44.7
46.6
45.9
55.4
192.6
63.9
EBITDA (e)
357.6
$
397.3
$
408.9
$
413.8
$
1,577.6
$
396.4
$
Reversal of restructuring and related expenses (c)
23.4
8.2
13.9
-
45.5
-
Reversal of TGBP integration expense (d)
N/A
N/A
N/A
4.8
4.8
6.4
EBITDA, excl. restructuring and TGBP integration expense
381.0
$
405.5
$
422.8
$
418.6
$
1,627.9
$
402.8
$
EBITDA margin
27.9%
29.1%
29.0%
28.9%
28.7%
28.4%
EBITDA margin, excl. restructuring and TGBP integration expense
29.7%
29.7%
30.0%
29.2%
29.6%
28.9%
Net income, as reported (GAAP)
210.2
$
263.2
$
239.7
$
452.3
$
1,165.4
$
247.3
$
Reversal of restructuring and related expenses, net of
income tax benefit (c) 16.4
5.9
9.7
-
32.0
-
Net income, restructuring adjusted
226.6
$
269.1
$
249.4
$
452.3
$
1,197.4
$
247.3
$
Reversal of IRS Agreement tax provision benefit (f)
N/A
N/A
N/A
(204.7)
(204.7)
-
Net income, restructuring and IRS Agreement adjusted
226.6
$
269.1
$
249.4
$
247.6
$
992.7
$
247.3
$
Reversal
of
TGBP
integration
expense,
net
of
income
tax
benefit
(d)
N/A
N/A
N/A
3.1
3.1
4.3
Net income, restructuring, IRS Agreement and TGBP integration expense
adjusted 226.6
$
269.1
$
249.4
$
250.7
$
995.8
$
251.6
$
Diluted
earnings
per
share
("EPS"),
as
reported
(GAAP)
($
-
dollars)
0.32
$
0.41
$
0.38
$
0.73
$
1.84
$
0.40
$
Impact
from
restructuring
and
related
expenses,
net
of
income
tax
benefit
(c)
($
-
dollars)
0.03
0.01
0.02
-
0.05
-
Diluted
EPS,
restructuring
adjusted
($
-
dollars)
0.35
$
0.42
$
0.40
$
0.73
$
1.89
$
0.40
$
Impact
from
IRS
Agreement
tax
provision
benefit
(f)
($
-
dollars)
N/A
N/A
N/A
(0.33)
(0.32)
-
Diluted
EPS,
restructuring
and
IRS
Agreement
adjusted
($
-
dollars)
0.35
$
0.42
$
0.40
$
0.40
$
1.57
$
0.40
$
Impact
from
TGBP
integration
expense,
net
of
income
tax
benefit
(d)
($
-
dollars)
N/A
N/A
N/A
-
-
-
Diluted
EPS,
restructuring,
IRS
Agreement
and
TGBP
integration
expense
adjusted
($
-
dollars)
0.35
$
0.42
$
0.40
$
0.40
$
1.57
$
0.40
$
Diluted weighted-average shares outstanding
652.1
635.8
627.1
621.7
634.2
621.9 |
 Reconciliation of Non-GAAP Measures
26
1Q11
2Q11
3Q11
4Q11
FY2011
1Q12
Consumer-to-Consumer Segment
Revenues, as reported (GAAP)
1,078.1
$
1,155.1
$
1,193.3
$
1,181.9
$
4,608.4
$
1,124.6
$
Foreign currency translation impact (a)
2.2
(31.4)
(17.9)
8.0
(39.1)
5.2
Revenues, constant currency adjusted
1,080.3
$
1,123.7
$
1,175.4
$
1,189.9
$
4,569.3
$
1,129.8
$
Prior year revenues, as reported (GAAP)
1,030.2
$
1,073.1
$
1,128.3
$
1,151.8
$
4,383.4
$
1,078.1
$
Revenue change, as reported (GAAP)
5
%
8
%
6
%
3
%
5
%
4
%
Revenue change, constant currency adjusted
5
%
5
%
4
%
3
%
4
%
5
%
Principal
per
transaction,
as
reported
($
-
dollars)
360
$
365
$
366
$
349
$
360
$
346
$
Foreign
currency
translation
impact
(a)
($
-
dollars)
(1)
(14)
(11)
2
(6)
3
Principal
per
transaction,
constant
currency
adjusted
($
-
dollars)
359
$
351
$
355
$
351
$
354
$
349
$
Prior
year
principal
per
transaction,
as
reported
($
-
dollars)
357
$
351
$
355
$
356
$
355
$
360
$
Principal per transaction change, as reported
1
%
4
%
3
%
(2)%
1
%
(4)%
Principal per transaction change, constant currency adjusted
1
%
0
%
0
%
(1)%
0
%
(3)%
Cross-border
principal,
as
reported
($
-
billions)
17.1
$
18.6
$
19.0
$
18.5
$
73.2
$
17.5
$
Foreign
currency
translation
impact
(a)
($
-
billions)
-
(0.8)
(0.6)
0.2
(1.2)
0.2
Cross-border
principal,
constant
currency
adjusted
($
-
billions)
17.1
$
17.8
$
18.4
$
18.7
$
72.0
$
17.7
$
Prior
year
cross-border
principal,
as
reported
($
-
billions)
16.1
$
16.8
$
17.6
$
18.1
$
68.6
$
17.1
$
Cross-border principal change, as reported
7
%
10
%
8
%
2
%
7
%
2
%
Cross-border principal change, constant currency adjusted
6
%
6
%
5
%
3
%
5
%
3
%
Consumer-to-Business Segment
Revenues, as reported (GAAP)
153.2
$
153.5
$
155.3
$
153.9
$
615.9
$
155.1
$
Foreign currency translation impact (a)
1.3
1.1
1.5
2.5
6.4
2.9
Revenues, constant currency adjusted
154.5
$
154.6
$
156.8
$
156.4
$
622.3
$
158.0
$
Prior year revenues, as reported (GAAP)
N/A
N/A
N/A
N/A
610.7
$
153.2
$
Revenue change, as reported (GAAP)
(2)%
2
%
2
%
2
%
1
%
1
%
Revenue change, constant currency adjusted
(1)%
2
%
3
%
3
%
2
%
3
%
Business Solutions Segment
Revenues, as reported (GAAP)
27.9
$
31.4
$
33.6
$
68.2
$
161.1
$
86.9
$
Foreign currency translation impact (a)
(1.3)
(2.2)
(2.1)
(0.1)
(5.7)
(0.1)
Revenues, constant currency adjusted
26.6
$
29.2
$
31.5
$
68.1
$
155.4
$
86.8
$
Prior year revenues, as reported (GAAP)
N/A
N/A
N/A
N/A
106.7
$
27.9
$
Pro forma prior year revenues, TGBP adjusted (b)
N/A
N/A
N/A
N/A
N/A
82.9
$
Revenue change, as reported (GAAP)
13
%
15
%
31
%
***
***
***
Revenue change, constant currency adjusted
8
%
7
%
22
%
***
***
***
Pro forma revenue change, TGBP adjusted
N/A
N/A
N/A
N/A
N/A
5
%
Pro forma revenue change, TGBP and constant currency adjusted
N/A
N/A
N/A
N/A
N/A
4
%
*** Calculation of growth percentage is not meaningful due to the impact
of the TGBP acquisition in November 2011. |
 Reconciliation of Non-GAAP Measures
27
2012 Outlook Metrics
Revenue change (GAAP)
4
%
6
%
Foreign currency translation impact (g)
2
%
2
%
Revenue change, constant currency adjusted
6
%
8
%
Operating income margin (GAAP)
25
%
TGBP integration expense impact (d)
1
%
Operating income margin, TGBP integration expense adjusted
26
%
Operating income margin (GAAP)
25
%
Depreciation and amortization impact (e)
4
%
TGBP integration expense impact (d)
1
%
EBITDA margin, TGBP integration expense adjusted
30
%
EPS guidance (GAAP)
1.65
$
1.70
$
TGBP
integration
expense
impact,
net
of
tax
benefit
(d)
0.05
0.05
EPS guidance, TGBP integration expense adjusted
1.70
$
1.75
$
Operating cash flow (GAAP)
1.0
$
1.1
$
Payments on IRS Agreement (f)
0.2
0.2
Operating cash flow, IRS Agreement adjusted ($ -
1.2
$
1.3
$
Range
Range
Range
billions)
($ -
dollars)
($ -
dollars)
($ -
dollars)
($ -
billions)
($ -
billions) |
 Footnote explanations
28
Non-GAAP related notes:
(a)
(b)
(c)
(d)
(e)
(f)
(g)
Represents the estimated impact from the fluctuation in exchange rates
between all foreign currency denominated amounts and the United States dollar. Constant currency results exclude any estimated
benefit or loss caused by foreign exchange fluctuations between
foreign currencies and the United States dollar, net of foreign currency hedges, which would not have occurred if there had been a constant
exchange rate.
Represents the impact from the tax benefit in December 2011 due to the
agreement with the IRS resolving substantially all issues related to the restructuring of our international operations in 2003 of $204.7
million. Additionally, represents the impact of the anticipated
tax payments of approximately $190 million related to the agreement with the IRS discussed above.
TGBP integration expense consists primarily of severance and other
benefits, retention, direct and incremental expense consisting of facility relocation, consolidation and closures; IT systems integration; and
other expenses such as training, travel and professional fees.
Integration expense does not include costs related to the completion of the TGBP acquisition.
Represents the impact from the fluctuation in exchange rates between
all foreign currency denominated amounts and the United States dollar. Constant currency results exclude any benefit or loss caused
by foreign exchange fluctuations between foreign currencies and the
United States dollar, net of foreign currency hedges, which would not have occurred if there had been a constant exchange rate. In pro
forma calculations, also includes the currency impact of $0.3 million
for the three months ended March 31, 2012 associated with the acquisition of Travelex Global Business Payments ("TGBP").
Represents the pro forma incremental impact of TGBP on Consolidated
and Business Solutions segment revenues. Pro forma revenues presents the results of operations of the Company and its Business
Solutions segment as they may have appeared had the acquisition of
TGBP occurred as of January 1, 2011. The pro forma information is provided for illustrative purposes only and does not purport to
present what the actual results of operations would have been had the
acquisition actually occurred on the date indicated. The results of operations for TGBP have been included in Consolidated and
Business Solutions segment revenues from November 7, 2011, the date of
acquisition. Restructuring and related expenses consist of
direct and incremental expenses including the impact from fluctuations in exchange rates associated with restructuring and related activities, consisting of
severance, outplacement and other related benefits; facility closure
and migration of the Company's IT infrastructure; and other expenses related to the relocation of various operations to new or existing
Company facilities and third-party providers, including hiring,
training, relocation, travel, and professional fees. Also included in the facility closure expenses are non-cash expenses related to fixed asset and
leasehold improvement write-offs and the acceleration of
depreciation and amortization. Restructuring and related expenses were not allocated to the segments.
Earnings before Interest, Taxes, Depreciation and Amortization
(EBITDA) results from taking operating income and adjusting for depreciation and amortization expenses. |