Attached files
| file | filename |
|---|---|
| 8-K - 8-K - FIRSTMERIT CORP /OH/ | fmer-8kq12012.htm |
| EX-99.1 - PRESS RELEASE - FIRSTMERIT CORP /OH/ | ex991_q12012.htm |

First Quarter 2012 Earnings Conference Call Supplemental Information April 24, 2012 FIRSTMERIT Corporation

Forward-Looking Statements Disclosure This presentation contains forward-looking statements relating to present or future trends or factors affecting the banking industry, and specifically the financial condition and results of operations, including without limitation, statements relating to the earnings outlook of the Corporation, as well as its operations, markets and products. Actual results could differ materially from those indicated. Among the important factors that could cause results to differ materially are interest rate changes, continued softening in the economy, which could materially impact credit quality trends and the ability to generate loans, changes in the mix of the Corporation's business, competitive pressures, changes in accounting, tax or regulatory practices or requirements and those risk factors detailed in the Corporation's periodic reports and registration statements filed with the Securities and Exchange Commission. The Corporation undertakes no obligation to release revisions to these forward-looking statements or reflect events or circumstances after the date of this release. 2

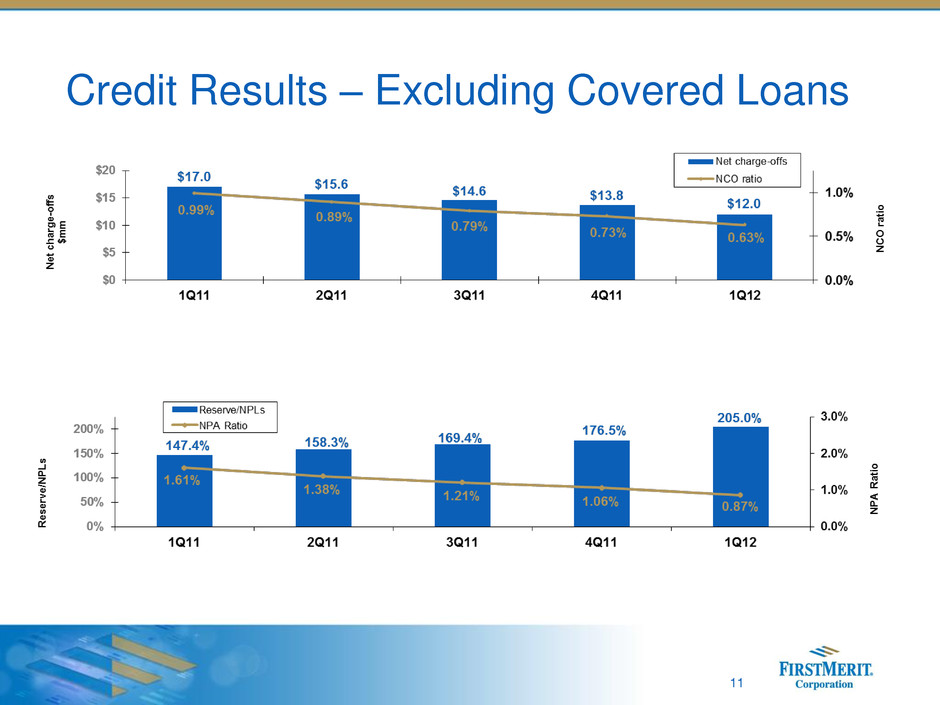
3 52nd consecutive quarter of profitability Net income of $30.3 million/$0.28 per diluted share • Return on average assets of 0.84% • Return on average equity of 7.72% Dividend of $0.16 per share Solid asset quality trends compared with 4Q11, including $1.8 million, or 12.96%, decline in NCOs and $13.1 million, or 16.18% decline in NPAs • NCO ratio at 0.63%, compared with 0.73% in 4Q11 • NPA ratio at 0.87%, compared with 1.06% in 4Q11 Average commercial loan growth of $93.6 million, or 1.85%, compared with 4Q11 Average core deposit growth of $203.6 million, or 2.13%, compared with 4Q11 Robust tangible common equity ratio of 7.86% at 3/31/12 1Q 2012 Highlights

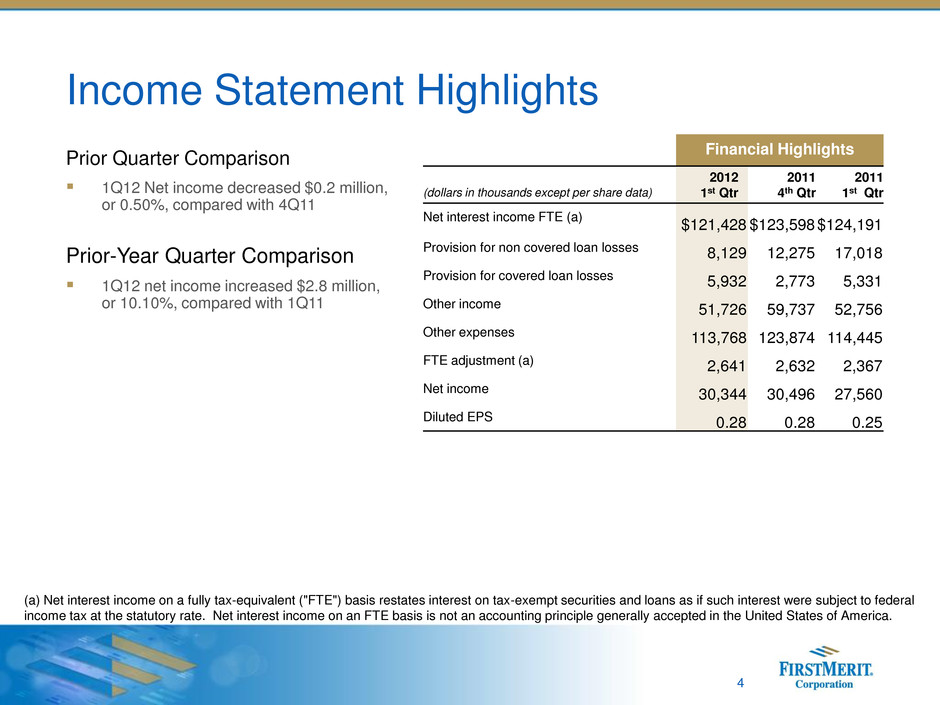
4 Income Statement Highlights Financial Highlights (dollars in thousands except per share data) 2012 1st Qtr 2011 4th Qtr 2011 1st Qtr Net interest income FTE (a) $121,428 $123,598 $124,191 Provision for non covered loan losses 8,129 12,275 17,018 Provision for covered loan losses 5,932 2,773 5,331 Other income 51,726 59,737 52,756 Other expenses 113,768 123,874 114,445 FTE adjustment (a) 2,641 2,632 2,367 Net income 30,344 30,496 27,560 Diluted EPS 0.28 0.28 0.25 Prior Quarter Comparison 1Q12 Net income decreased $0.2 million, or 0.50%, compared with 4Q11 Prior-Year Quarter Comparison 1Q12 net income increased $2.8 million, or 10.10%, compared with 1Q11 (a) Net interest income on a fully tax-equivalent ("FTE") basis restates interest on tax-exempt securities and loans as if such interest were subject to federal income tax at the statutory rate. Net interest income on an FTE basis is not an accounting principle generally accepted in the United States of America.

Fee Income 5 Prior Quarter Comparison 1Q12 Noninterest income, net of securities transactions, decreased $2.5 million, or 4.60%, compared with 4Q11 Prior-Year Quarter Comparison 1Q12 Noninterest income, net of securities transactions, decreased $1.3 million, or 18.84%, compared with 1Q11 Noninterest Income (dollars in thousands) 2012 1st Qtr 2011 4th Qtr 2011 1st Qtr Trust department income $5,627 $5,413 $5,514 Service charges on deposits 14,409 15,622 14,910 Credit card fees 10,180 10,182 12,207 ATM and other service fees 3,790 3,920 2,917 Bank owned life insurance income 3,056 3,381 5,241 Investment services and insurance 2,247 1,844 2,447 Investment securities gains, net 260 5,790 0 Loan sales and servicing income 6,691 5,102 2,785 Other operating income 5,466 8,483 6,735 Total other income 51,726 59,737 52,756

Noninterest Expense 6 Noninterest Expense (dollars in thousands) 2012 1st Qtr 2011 4th Qtr 2011 1st Qtr Salaries, wages, pension, and employee benefits $63,973 $62,546 $59,871 Net occupancy expense 8,592 7,270 8,594 Equipment expense 7,104 7,234 6,836 Taxes, other than federal income taxes 1,955 1,389 1,960 Stationary, supplies and postage 2,143 2,719 2,705 Bankcard, loan processing and other costs 7,653 7,948 7,562 Advertising 1,684 2,275 2,384 Professional services 3,352 5,763 5,793 Telephone 1,398 1,525 1,486 Amortization of intangibles 483 543 543 FDIC expense 3,720 5,119 4,366 Other operating expenses 11,711 19,543 12,345 Total noninterest expense 113,768 123,874 114,445 Prior Quarter Comparison Total noninterest expense for 1Q12 decreased $10.1 million, or 8.16%, compared with 4Q11 Prior-Year Quarter Comparison Total noninterest expense for 1Q12 decreased $0.7 million, or 0.59%, compared with 1Q11

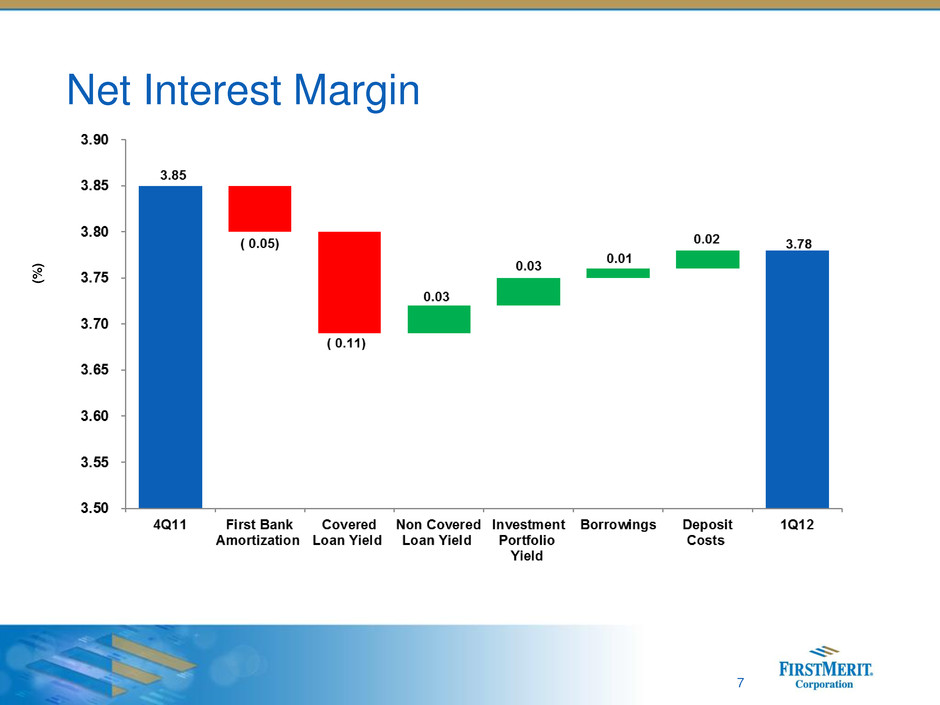
Net Interest Margin 7 (% )

Asset Yields / Liability Costs* 8 (dollars in thousands) March 31, 2012 December 31, 2011 March 31, 2011 Total investment securities and federal funds sold 3,690,822 3.08% 3,480,508 3.08% 3,419,715 3.17% Non-Covered loans 7,781,449 4.27% 7,673,913 4.34% 7,201,581 4.71% Covered loans 1,436,430 5.73% 1,569,232 5.90% 1,917,043 6.48% Total loans 9,217,879 4.50% 9,243,145 4.62% 9,118,624 5.10% Total earning assets 12,935,184 4.10% 12,747,868 4.20% 12,560,913 4.57% Demand – non interest bearing 3,036,590 -- 3,013,543 -- 2,874,884 -- Demand – interest bearing 1,066,132 0.09% 991,456 0.09% 841,545 0.09% Savings and money market accounts 5,675,052 0.36% 5,569,213 0.43% 4,978,773 0.64% Certificates and other time deposits 1,694,247 0.84% 1,842,334 0.69% 2,624,607 1.05% Total deposits 11,472,021 0.31% 11,416,5426 0.33% 11,319,809 0.53% Borrowings 1,072,374 0.53% 1,224,725 0.60% 1,173,465 0.88% Total interest bearing liabilities 9,507,805 0.44% 9,627,758 0.46% 8,618,390 0.73% (*) FTE average quarterly balances and yields/costs

Deposits Average Core Deposits* $ in millions Average Total Deposits 9 (*) Core deposits include all deposits less certificates of deposit

10 Average Commercial Loans $ in millions Commercial Loan Composition Commercial Loan Portfolio* (*) Excluding covered loans, commercial loan composition as of 3/31/12

Credit Results – Excluding Covered Loans 11

Capital Position 12 (dollars in thousands) March 31, 2012 December 31, 2011 March 31, 2011 Consolidated Total Equity $ 1,584,105 10.80% $ 1,565,953 10.84% $ 1,519,957 10.51% Common Equity 1,584,105 10.80% 1,565,953 10.84% 1,519,957 10.51% Tangible common equity (a) 1,116,304 7.86% 1,097,670 7.86% 1,050,045 7.50% Tier 1 capital (b) 1,136,705 11.55% 1,119,892 11.48% 1,074,020 11.68% Total risk-based capital (c) 1,260,064 12.80% 1,242,177 12.73% 1,189,389 12.94% Leverage (d) 1,136,705 8.16% 1,119,892 7.95% 1,074,020 7.81% (a) Common equity less all intangibles; computed as a ratio to total assets less intangible assets. (b) Shareholders’ equity less goodwill; computed as a ratio to risk adjusted assets, as defined in the 1992 risk based capital guidelines. (c) Tier 1 capital plus qualifying loan less allowance, computed as a ratio to risk adjusted assets as defined in the 1992 risk based capital guidelines. (d) Tier 1 capital computed as a ratio to the latest quarter’s average assets less goodwill.

First Quarter 2012 Earnings Conference Call Supplemental Information April 24, 2012 FIRSTMERIT Corporation
