Attached files
| file | filename |
|---|---|
| 8-K - WESTERN ALLIANCE BANCORPORATION 8-K - WESTERN ALLIANCE BANCORPORATION | a50244555.htm |
| EX-99.1 - EXHIBIT 99.1 - WESTERN ALLIANCE BANCORPORATION | a50244555ex99_1.htm |
Exhibit 99.2
1st Quarter 2012 Earnings Call Western Alliance Bancorporation (NYSE: WAL) April 20, 2012
This presentation contains forward-looking statements that relate to expectations, beliefs, projections, future plans and strategies, anticipated events or trends and similar expressions concerning matters that are not historical facts. The forward-looking statements contained herein reflect our current views about future events and financial performance and are subject to risks, uncertainties, assumptions and changes in circumstances that may cause our actual results to differ significantly from historical results and those expressed in any forward-looking statement. Some factors that could cause actual results to differ materially from historical or expected results include: factors listed in the Company’s annual report on Form 10-K as filed with the Securities and Exchange Commission; changes in general economic conditions, either nationally or locally in the areas in which we conduct or will conduct our business; inflation, interest rate, market and monetary fluctuations; increases in competitive pressures among financial institutions and businesses offering similar products and services; higher defaults on our loan portfolio than we expect; changes in management’s estimate of the adequacy of the allowance for loan losses; legislative or regulatory changes or changes in accounting principles, policies or guidelines; supervisory actions by regulatory agencies which may limit our ability to pursue certain growth opportunities; management’s estimates and projections of interest rates and interest rate policy; the execution of our business plan; and other factors affecting the financial services industry generally or the banking industry in particular. We do not intend and disclaim any duty or obligation to update or revise any industry information or forward-looking statements set forth in this presentation to reflect new information, future events or otherwise. Forward-Looking Information
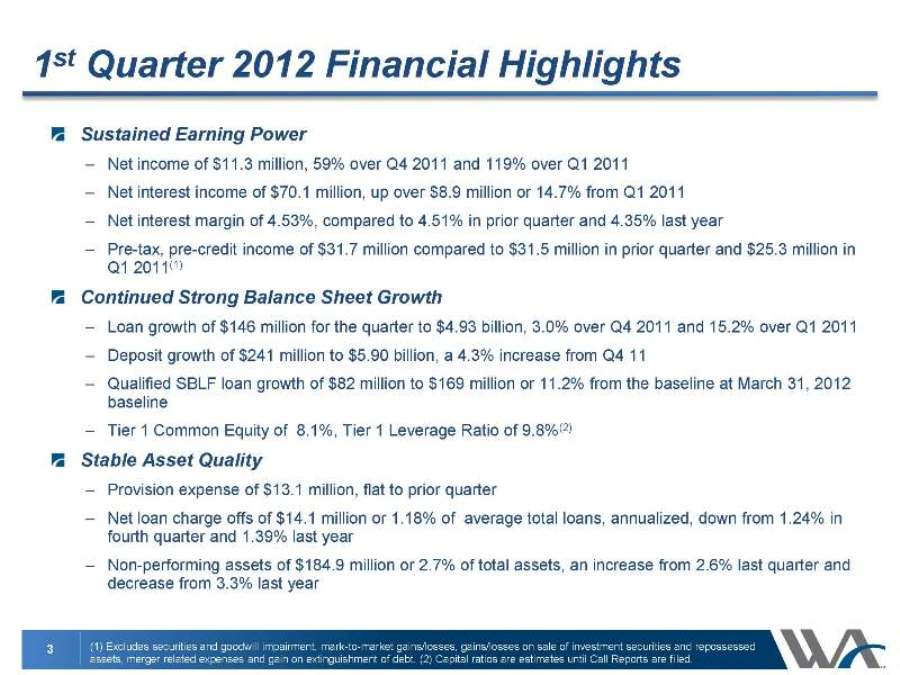
1st Quarter 2012 Financial Highlights Sustained Earning Power –Net income of $11.3 million, 59% over Q4 2011 and 119% over Q1 2011 –Net interest income of $70.1 million, up over $8.9 million or 14.7% from Q1 2011–Net interest margin of 4.53%, compared to 4.51% in prior quarter and 4.35% last year –Pre-tax, pre-credit income of $31.7 million compared to $31.5 million in prior quarter and $25.3 million in Q1 2011(1) Continued Strong Balance Sheet Growth –Loan growth of $146 million for the quarter to $4.93 billion, 3.0% over Q4 2011 and 15.2% over Q1 2011 –Deposit growth of $241 million to $5.90 billion, a 4.3% increase from Q4 11–Qualified SBLF loan growth of $82 million to $169 million or 11.2% from the baseline at March 31, 2012 baseline –Tier 1 Common Equity of 8.1%, Tier 1 Leverage Ratio of 9.8%(2) Stable Asset Quality –Provision expense of $13.1 million, flat to prior quarter –Net loan charge offs of $14.1 million or 1.18% of average total loans, annualized, down from 1.24% in fourth quarter and 1.39% last year –Non-performing assets of $184.9 million or 2.7% of total assets, an increase from 2.6% last quarter and decrease from 3.3% last year (1) Excludes securities and goodwill impairment, mark-to-market gains/losses, gains/losses on sale of investment securities and repossessed assets, merger related expenses and gain on extinguishment of debt. (2) Capital ratios are estimates until Call Reports are filed.
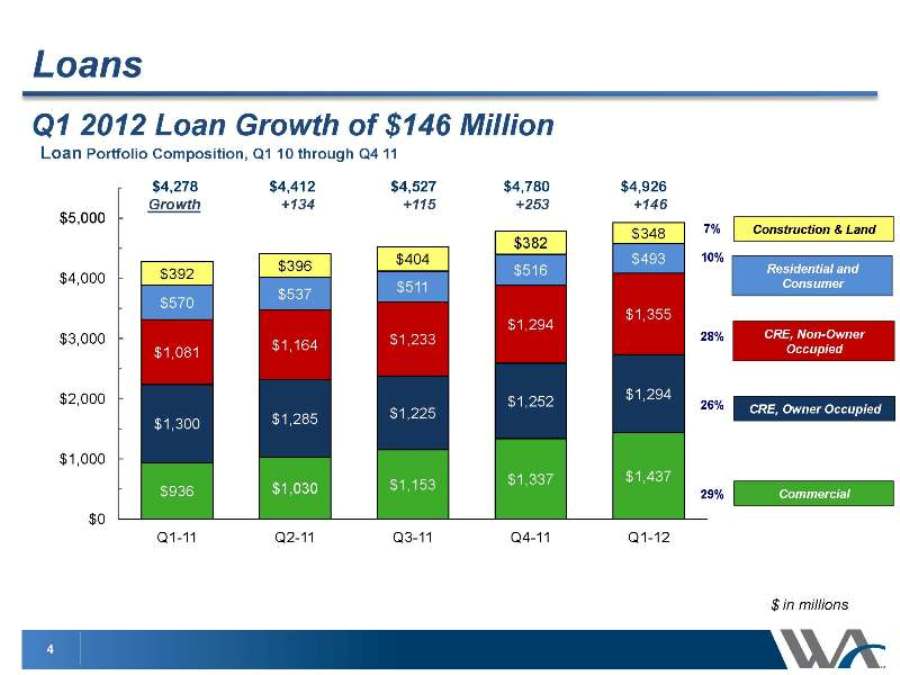
Loans Q1 2012 Loan Growth of $146 Million Loan Portfolio Composition, Q1 10 through Q4 11 $936 $1,030 $1,153 $1,337 $1,437 $1,300 $1,285 $1,225 $1,252 $1,294 $1,081 $1,164 $1,233 $1,294 $1,355$570 $537 $511 $516 $493 $392 $396 $404 $382 $348 $0 $1,000 $2,000 $3,000 $4,000 $5,000 Q1-11 Q2-11 Q3-11 Q4-11 Q1-12 Commercial CRE, Owner Occupied CRE, Non-Owner Occupied Construction & Land Residential and Consumer 29% 10% 28% 26% 7% $ in millions $4,278 $4,412 $4,527 $4,780 $4,926 Growth +134 +115 +253 +146
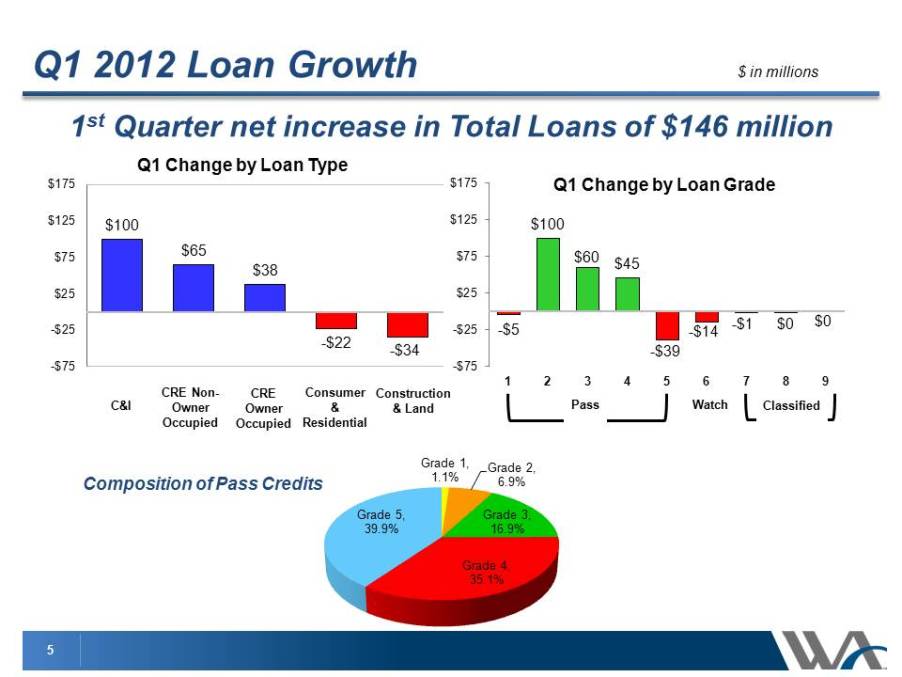
Q1 2012 Loan Growth 1st Quarter net increase in Total Loans of $146 million $100 $65 $38 -$22 -$34 -$75 -$25 $25 $75 $125 $175 Q1 Change by Loan Type -$5 $100 $60 $45 -$39 -$14 -$1 $0 $0 -$75 -$25 $25 $75 $125 $175 1 2 3 4 5 6 7 8 9 Q1 Change by Loan Grade Pass Watch Classified C&I CRE Non- Owner Occupied CRE Owner Occupied Consumer & Residential Construction & Land Composition of Pass Credits Grade 1, 1.1% Grade 2, 6.9% Grade 3, 16.9% Grade 4, 35.1%
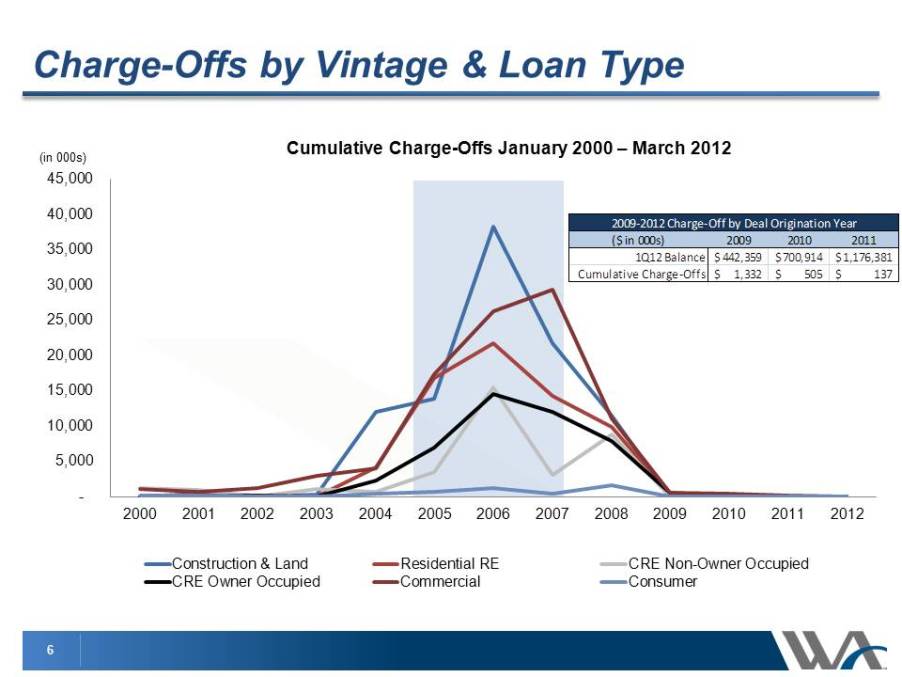
5,000 10,000 15,000 20,000 25,000 30,000 35,000 40,000 45,000 2000 2001 2002 2003 2004 2005 2006 2007 2008 2009 2010 2011 2012 Cumulative Charge-Offs January 2000 – March 2012 Construction & Land Residential RE CRE Non-Owner Occupied CRE Owner Occupied Commercial Consumer Charge- 1Q12 Balance 442,359 $ 700,914 $ 1,176,381 $ Cumulative Charge‐Offs 1,332 $ 505 $ 137 $ ($ in 000s) 2009 2010 2011
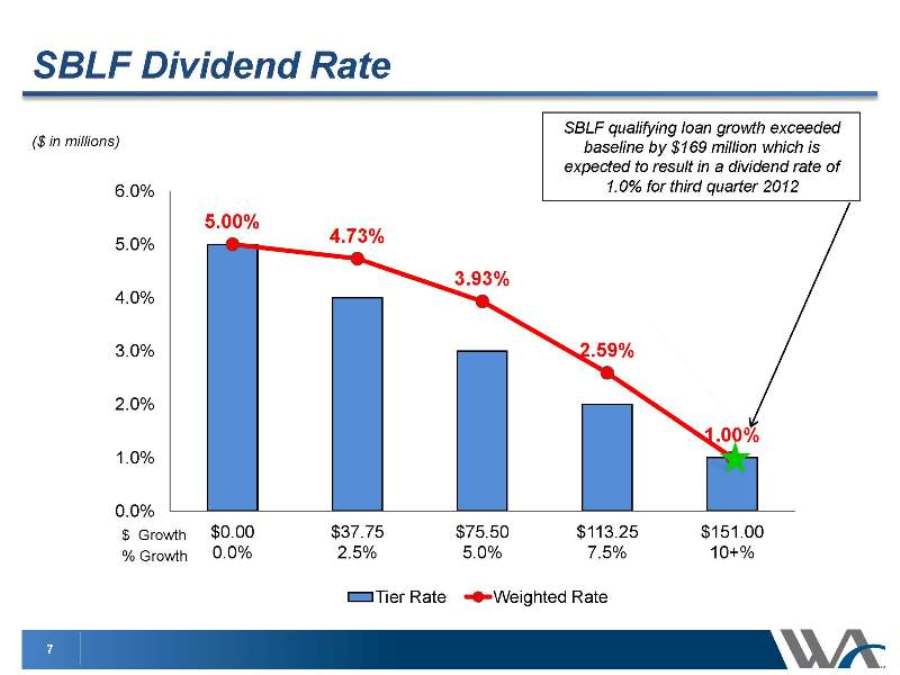
5.00% 4.73% 3.93% 2.59% 1.00% 0.0% 1.0% 2.0% 3.0% 4.0% 5.0% 6.0% $0.00 0.0% $37.75 2.5% $75.50 5.0% $113.25 7.5% $151.00 10+% Tier Rate Weighted Rate $ Growth % Growth SBLF Dividend Rate ($ in millions) SBLF qualifying loan growth exceeded baseline by $169 million which is expected to result in a dividend rate of 1.0% for third quarter 2012
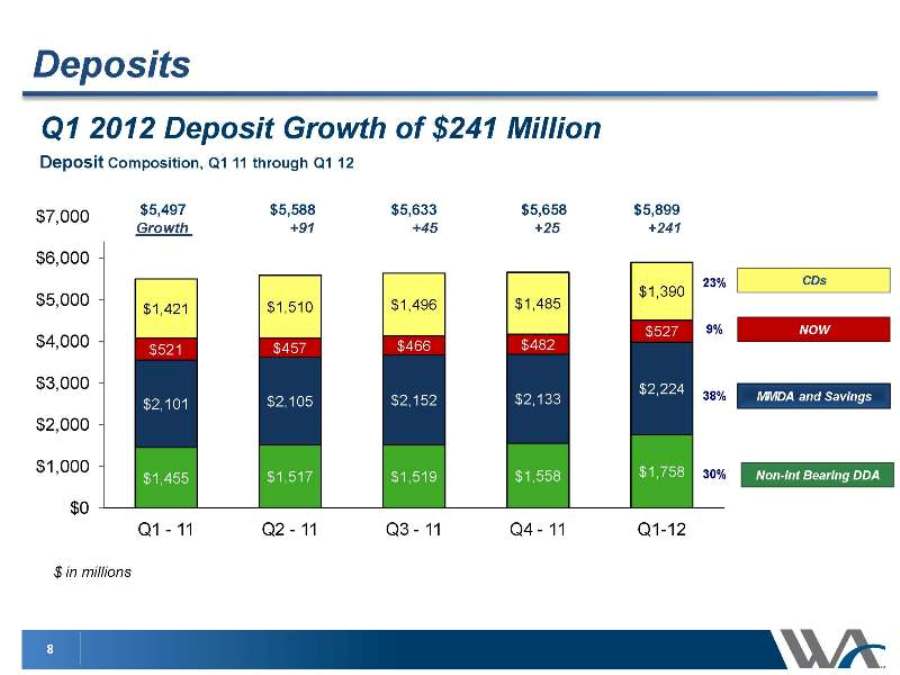
Deposits Q1 2012 Deposit Growth of $241 Million $1,455 $1,517 $1,519 $1,558 $1,758 $2,101 $2,105 $2,152 $2,133 $2,224 $521 $457 $466 $482 $527 $1,421 $1,510 $1,496 $1,485 $1,390 $0 $1,000 $2,000 $3,000 $4,000 $5,000 $6,000 $7,000 Q1 - 11 Q2 - 11 Q3 - 11 Q4 - 11 Q1-12 Deposit Composition, Q1 11 through Q1 12 $5,497 $5,588 $5,633 $5,658 $5,899 Growth +91 +45 +25 +241 MMDA and Savings NOW CDs Non-Int Bearing DDA 9% 38% 30% 23% $ in millions
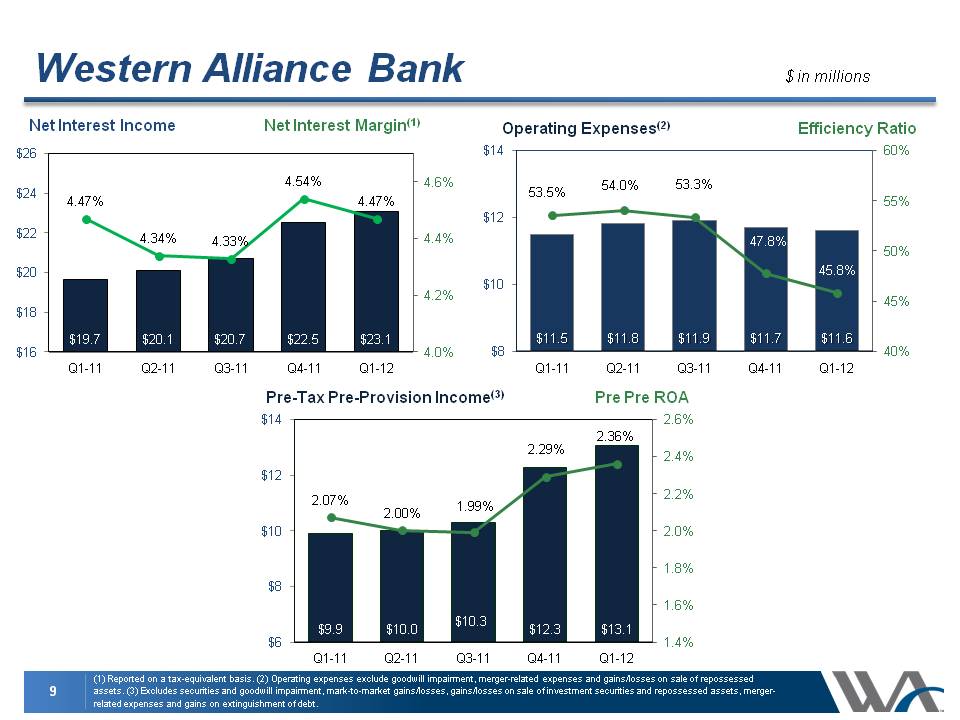
Western Alliance Bank (1) Reported on a tax-equivalent basis. (2) Operating expenses exclude goodwill impairment, merger-related expenses and gains/losses on sale of repossessed assets. (3) Excludes securities and goodwill impairment, mark-to-market gains/losses, gains/losses on sale of investment securities and repossessed assets, mergerrelated expenses and gains on extinguishment of debt. $11.5 $11.8 $11.9 $11.7 $11.6 53.5% 54.0% 53.3% 47.8% 46.9% 45% 50% 55% 60% $8 $10 $12 $14 Q1-11 Q2-11 Q3-11 Q4-11 Q1-12 $9.9 $10.0 $10.3 $12.3 $13.1 2.07% 2.00% 1.99% 2.29% 2.36% 1.4% 1.6% 1.8% 2.0% 2.2% 2.4% 2.6% $6 $8 $10 $12 $14 Q1-11 Q2-11 Q3-11 Q4-11 Q1-12 Net Interest Income Operating Expenses(2) Pre-Tax Pre-Provision Income(3) $ in millions Net Interest Margin(1) Efficiency Ratio 1 4.47% 4.34% 4.33% 4.54% 4.47% 4.0% 4.2% 4.4% 4.6% $16 $18 $20 $22 $24 $ (1) Reported on a tax-equivalent basis. (2) Operating expenses exclude goodwill impairment, merger-related expenses and gains/losses on sale of repossessed assets. (3) Excludes securities and goodwill impairment, mark-to-market gains/losses, gains/losses on sale of investment securities and repossessed assets, mergerrelated expenses and gains on extinguishment of debt.
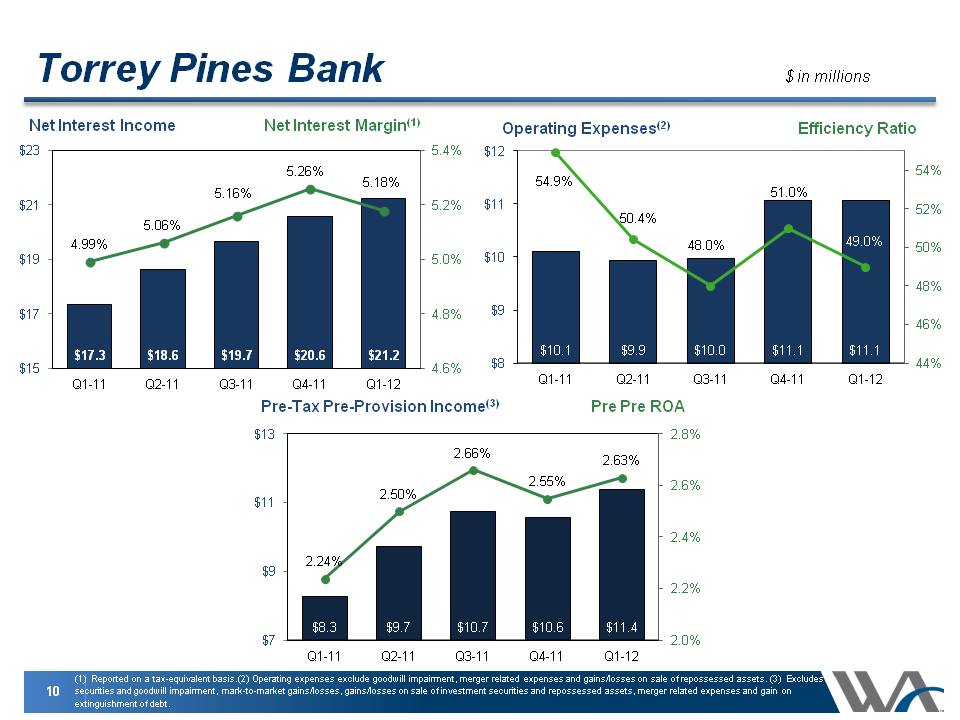
Torrey Pines Bank $10.1 $9.9 $10.0 $11.1 $11.1 54.9% 50.4% 48.0% 51.0% 49.3% 44% 46% 48% 50% 52% 54% 56% $8 $9 $10 $11 $12 Q1-11 Q2-11 Q3-11 Q4-11 Q1-12 $8.3 $9.7 $10.7 $10.6 $11.4 2.24% 2.50% 2.66% 2.55% 2.63% 2.0% 2.2% 2.4% 2.6% 2.8% $7 $9 $11 $13 Q1-11 Q2-11 Q3-11 Q4-11 Q1-12 (1) Reported on a tax-equivalent basis.(2) Operating expenses exclude goodwill impairment, merger related expenses and gains/losses on sale of repossessed assets. (3) Excludes securities and goodwill impairment, mark-to-market gains/losses, gains/losses on sale of investment securities and repossessed assets, merger related expenses and gain on extinguishment of debt. $ in millions Net Interest Income Net Interest Margin(1) Operating Expenses(2) Efficiency Ratio Pre-Tax Pre-Provision Income(3) Pre Pre ROA 21.2 4.99% 5.06% 5.16% 5.26% 5.18% 4.6% 4.8% 5.0% 5.2% 5.4% $15 $17 $19 $21 $ Q1-11 Q2-11 Q3-11 Q4-11 Q1-12
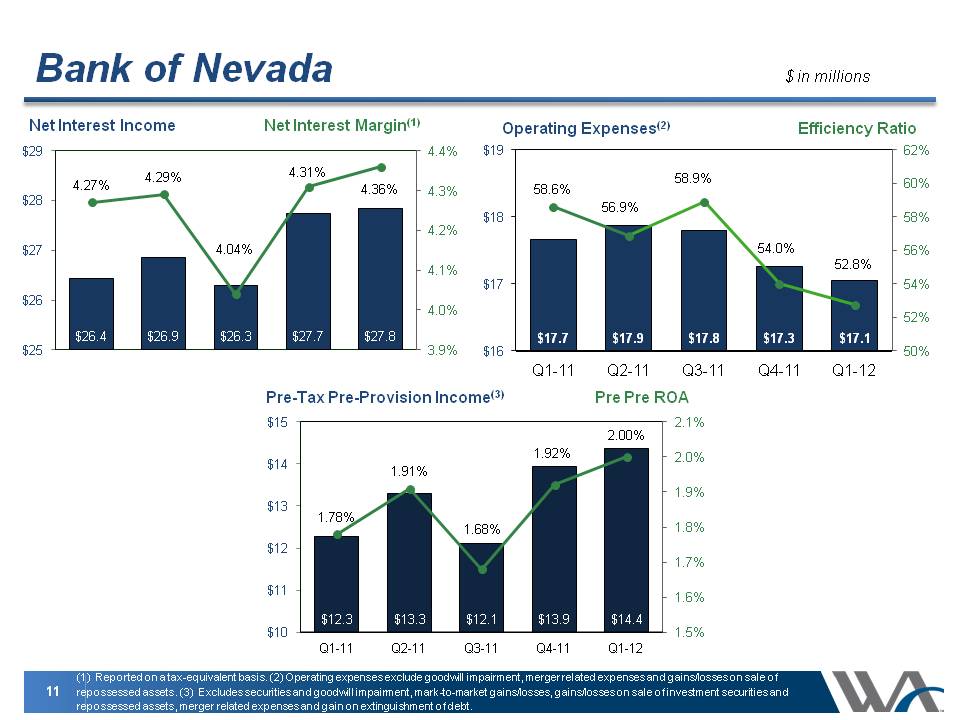
Bank of Nevada $17.7 $17.9 $17.8 $17.3 $17.1 58.6% 56.9% 58.9% 54.0% 54.3% 50% 52% 54% 56% 58% 60% 62% $16 $17 $18 $19 Q1-11 Q2-11 Q3-11 Q4-11 Q1-12 $12.3 $13.3 $12.1 $13.9 $14.4 1.63% 1.72% 1.70% 1.88% 1.86% 1.5% 1.6% 1.7% 1.8% 1.9% 2.0% 2.1% $10 $11 $12 $13 $14 $15 Q1-11 Q2-11 Q3-11 Q4-11 Q1-12 (1) Reported on a tax-equivalent basis. (2) Operating expenses exclude goodwill impairment, merger related expenses and gains/losses on sale of repossessed assets. (3) Excludes securities and goodwill impairment, mark-to-market gains/losses, gains/losses on sale of investment securities and repossessed assets, merger related expenses and gain on extinguishment of debt. $ in millions Net Interest Income Net Interest Margin(1) Operating Expenses(2) Efficiency Ratio Pre-Tax Pre-Provision Income(3) Pre Pre ROA $26.3 $27.7 $27.8 4.27% 4.29% 4.04% 4.31% 4.36% 3.9% 4.0% 4.1% 4.2% 4.3% 4.4% $25 $26 $27 $28 $29
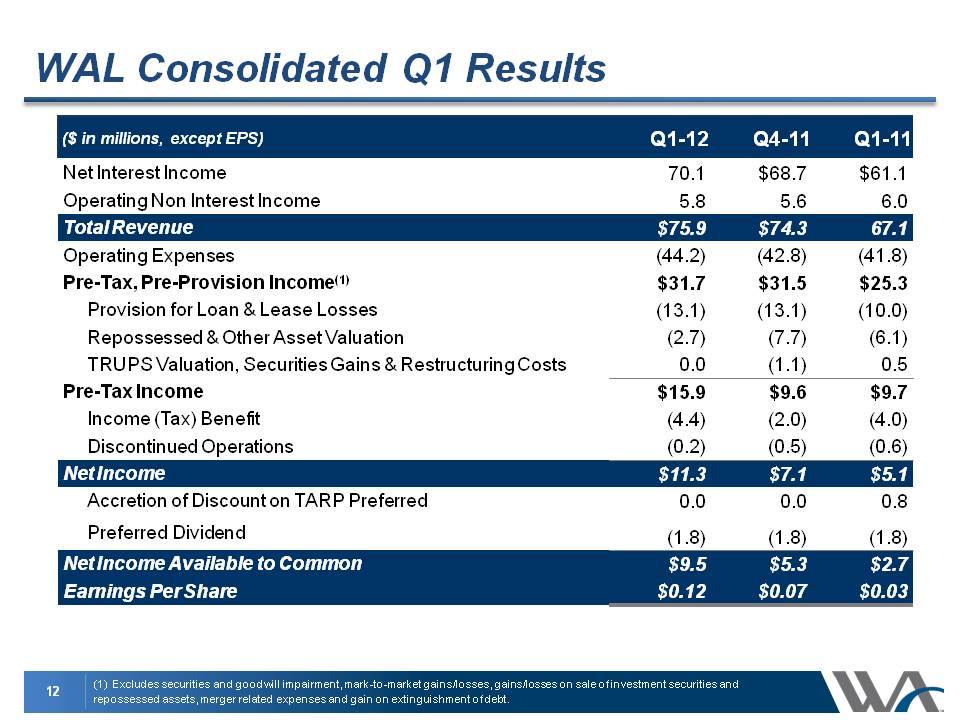
WAL Consolidated Q1 Results (1) Excludes securities and goodwill impairment, mark-to-market gains/losses, gains/losses on sale of investment securities and repossessed assets, merger related expenses and gain on extinguishment of debt. ($ in millions, except EPS) Q1-12 Q4-11 Q1-11 Net Interest Income 70.1 $68.7 $61.1 Operating Non Interest Income 5.8 5.6 6.0 Total Revenue $75.9 $74.3 67.1 Operating Expenses (44.2) (42.8) (41.8) Pre-Tax, Pre-Provision Income(1) $31.7 $31.5 $25.3 Provision for Loan & Lease Losses (13.1) (13.1) (10.0) Repossessed & Other Asset Valuation (2.7) (7.7) (6.1) TRUPS Valuation, Securities Gains & Restructuring Costs 0.0 (1.1) 0.5 Pre-Tax Income $15.9 $9.6 $9.7 Income (Tax) Benefit (4.4) (2.0) (4.0) Discontinued Operations (0.2) (0.5) (0.6) Net Income $11.3 $7.1 $5.1 Accretion of Discount on TARP Preferred 0.0 0.0 0.8 Preferred Dividend (1.8) (1.8) (1.8) Net Income Available to Common $9.5 $5.3 $2.7 Earnings Per Share $0.12 $0.07 $0.03
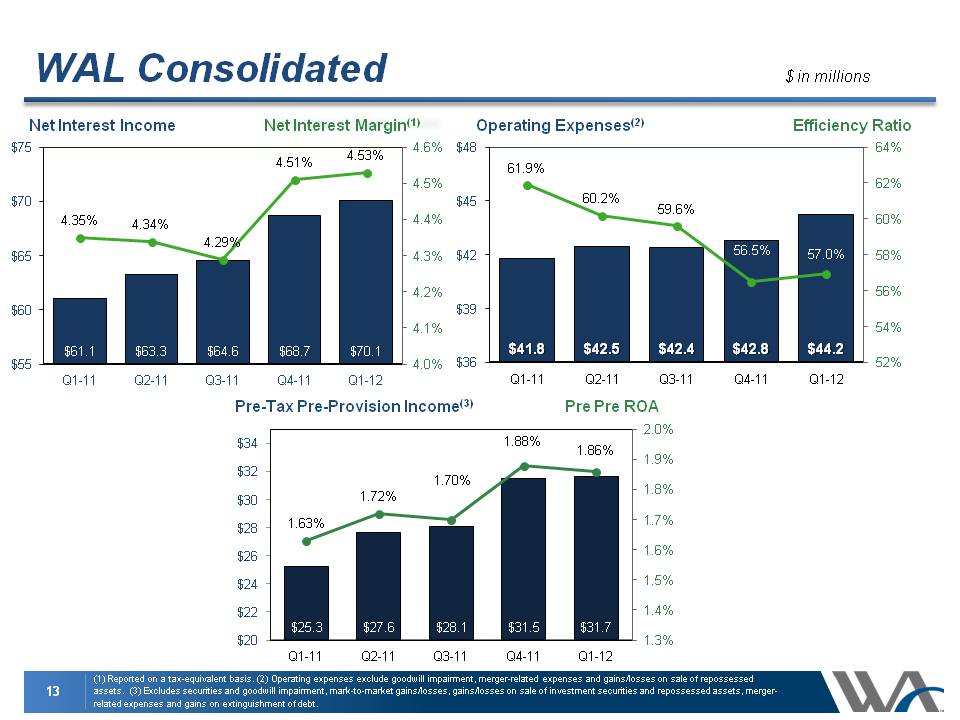
WAL Consolidated (1) Reported on a tax-equivalent basis. (2) Operating expenses exclude goodwill impairment, merger-related expenses and gains/losses on sale of repossessed assets. (3) Excludes securities and goodwill impairment, mark-to-market gains/losses, gains/losses on sale of investment securities and repossessed assets, mergerrelated expenses and gains on extinguishment of debt. $41.8 $42.5 $42.4 $42.8 $44.2 61.9% 60.2% 59.6% 56.5% 57.0% 52% 54% 56% 58% 60% 62% 64% $36 $39 $42 $45 $48 Q1-11 Q2-11 Q3-11 Q4-11 Q1-12 $ in millions Net Interest Income Net Interest Margin(1) Operating Expenses(2) Efficiency Ratio Pre-Tax Pre-Provision Income(3) Pre Pre ROA $25.3 $27.6 $28.1 $31.5 $31.7 1.63% 1.72% 1.70% 1.88% 1.86% 1.3% 1.4% 1.5% 1.6% 1.7% 1.8% 1.9% 2.0% $20 $22 $24 $26 $28 $30 $32 $34 Q1-11 Q2-11 Q3-11 Q4-11 Q1-12 4.35% 4.34% 4.29% 4.51% 4.53% 4.0% 4.1% 4.2% 4.3% 4.4% 4.5% 4.6% $55 $60 $65 $70 $61.1 $63.3 $64.6 $68.7 $70.1 4.35% 4.34% 4.29% 4.51% 4.53% 4.0% 4.1% 4.2% 4.3% 4.4% 4.5% 4.6% $55 $60 $65 $70 $75 Q1-11 Q2-11 Q3-11 Q4-11 Q1-12
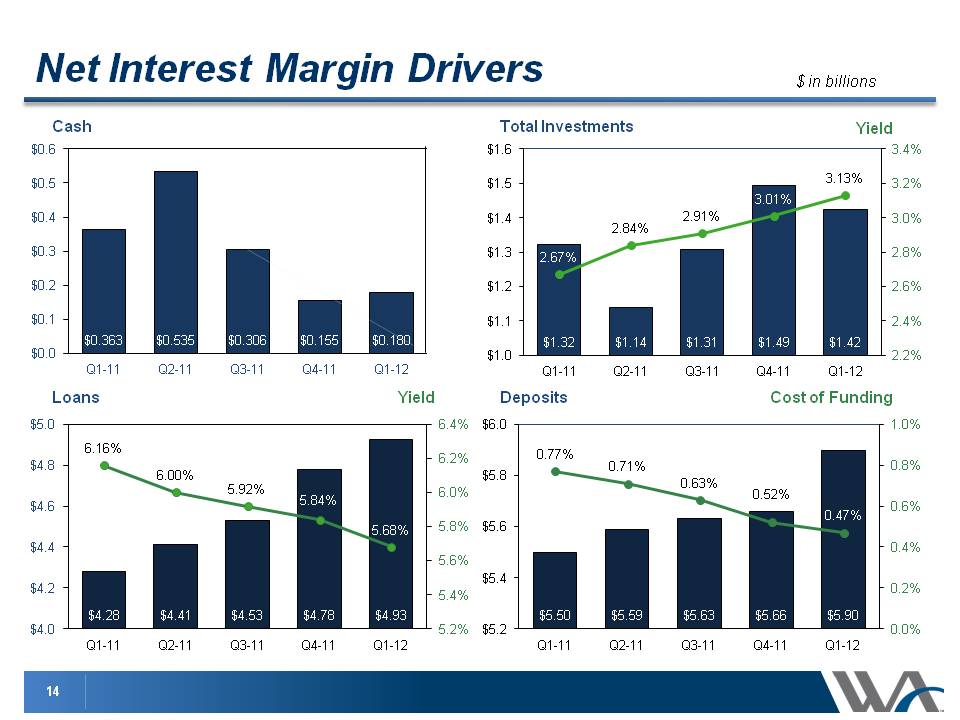
Net Interest Margin Drivers $ in billions 3.01% 3.13% 3.2% 3.4% $1.5 $1.6 $0.5 $0.6 Cash Total Investments Yield 2.67% 2.84% 2.91% 2.6% 2.8% 3.0% $1.2 $1.3 $1.4 $0.2 $0.3 $0.4 $1.32 $1.14 $1.31 $1.49 $1.42 2.2% 2.4% $1.0 $1.1 Q1-11 Q2-11 Q3-11 Q4-11 Q1-12 $0.363 $0.535 $0.306 $0.155 $0.180 $0.0 $0.1 Q1-11 Q2-11 Q3-11 Q4-11 Q1-12 Deposits Loans Yield Cost of Funding 6.16% 6.00% 5.92% 5.84% 6.0% 6.2% 6.4% $4.6 $4.8 $5.0 0.77% 0.71% 0.63% 0.52% 0 47% 0.6% 0.8% 1.0% $5.8 $6.0 $4 28 $4 41 $4 53 $4 78 $4 93 5.68% 5.4% 5.6% 5.8% $4.2 $4.4 $5 50 $5 59 $5 63 $5 66 $5 90 0.47% 0.2% 0.4% $5.4 $5.6 14 4.28 4.41 4.53 4.78 4.93 5.2% $4.0 Q1-11 Q2-11 Q3-11 Q4-11 Q1-12 5.50 5.59 5.63 5.66 5.90 0.0% $5.2 Q1-11 Q2-11 Q3-11 Q4-11 Q1-12
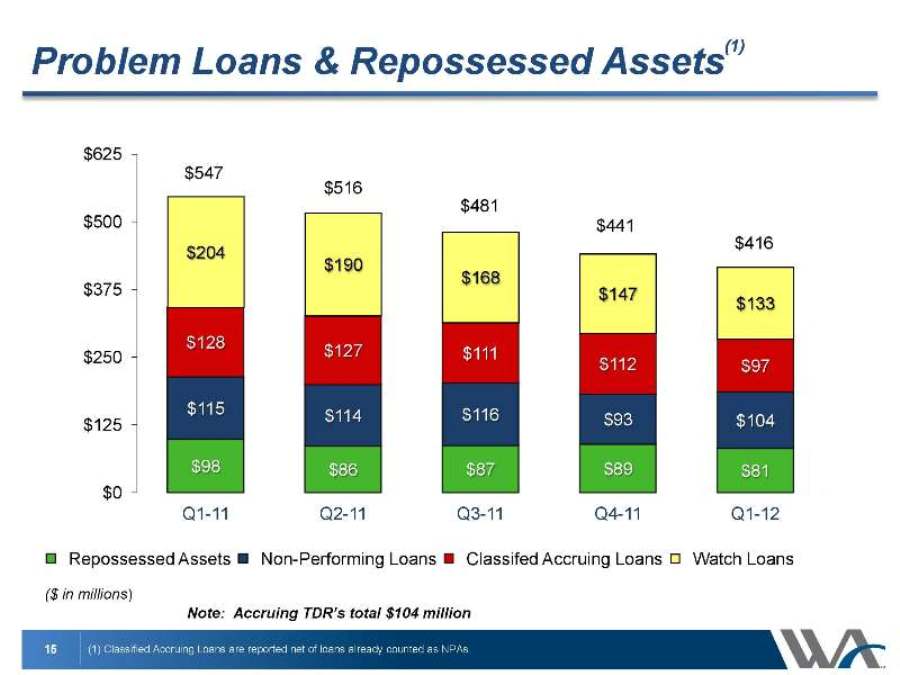
$98 $86 $87 $89 $81 $115 $114 $116 $93 $104 $128 $127 $111 $112 $97 $204 $190 $168 $147 $133 $0 $125 $250 $375 $500 $625 Q1-11 Q2-11 Q3-11 Q4-11 Q1-12 Repossessed Assets Non-Performing Loans Classifed Accruing Loans Watch Loans $547 $481 $441 $416 Problem Loans & Repossessed Assets(1)(1) Classified Accruing Loans are reported net of loans already counted as NPAs. ($ in millions) $516 Note: Accruing TDR’s total $104 million
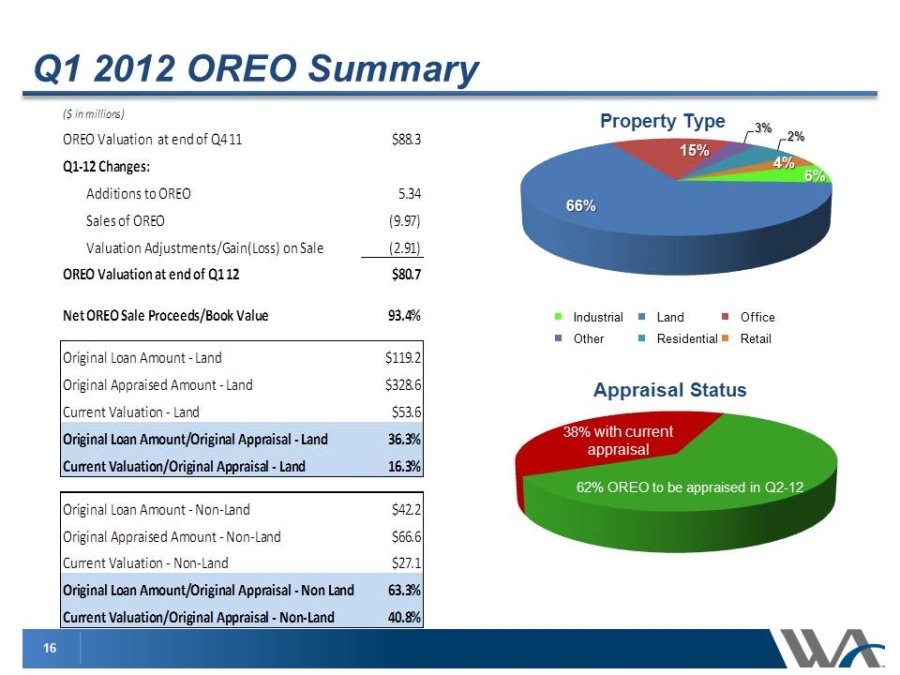
Q1 2012 OREO Summary 6% 15% 3% 2% 4% Property Type ($ in millions) OREO Valuation at end of Q4 11 $88.3 Q1‐12 Changes: Additions 5 34 66% to OREO 5.34 Sales of OREO (9.97) Valuation Adjustments/Gain(Loss) on Sale (2.91) OREO Valuation at end of Q1 12 $80.7 Industrial Land Office Other Residential Retail A Net OREO Sale Proceeds/Book Value 93.4% Original Loan Amount ‐ Land $119.2 Original $328 6 Appraisal Status 38% with current appraisal Appraised Amount ‐ Land 328.6 Current Valuation ‐ Land $53.6 Original Loan Amount/Original Appraisal ‐ Land 36.3% Current Valuation/Original Appraisal ‐ Land 16.3% 62% OREO to be appraised in Q2-12 Original Loan Amount ‐ Non‐Land $42.2 Original Appraised Amount ‐ Non‐Land $66.6 Current Valuation ‐ Non‐Land $27.1 1 Original Loan Amount/Original Appraisal ‐ Non Land 63.3% Current Valuation/Original Appraisal ‐ Non‐Land 40.8% 16
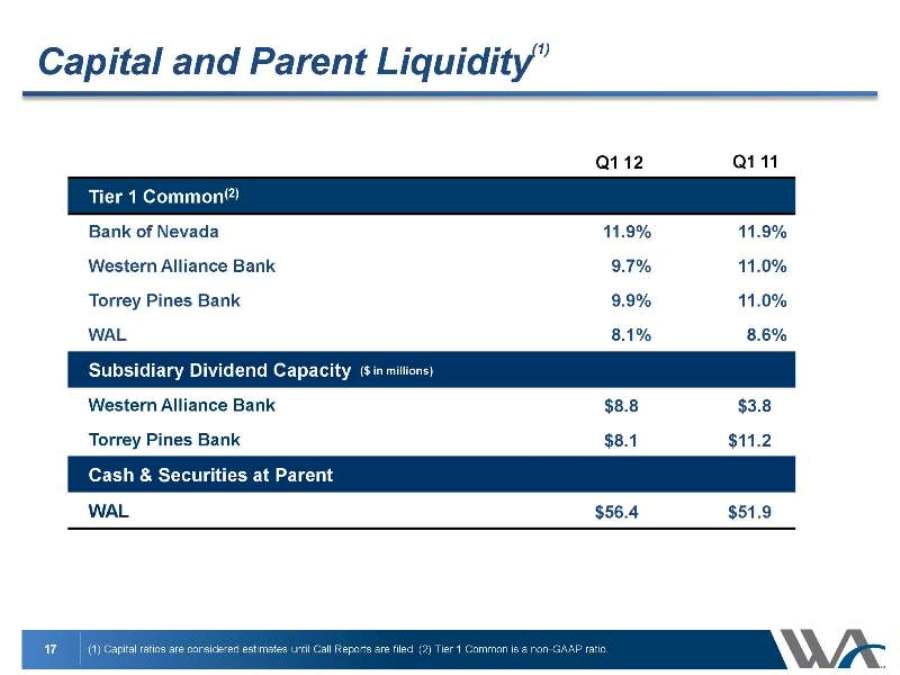
Capital and Parent Liquidity(1) (1) Capital ratios are considered estimates until Call Reports are filed. (2) Tier 1 Common is a non-GAAP ratio. Tier 1 Common(2) Bank of Nevada 11.9% 11.9% Western Alliance Bank 9.7% 11.0% Torrey Pines Bank 9.9% 11.0% WAL 8.1% 8.6% Subsidiary Dividend CapacityWestern Alliance Bank $8.8 $3.8 Torrey Pines Bank $8.1 $11.2 Cash & Securities at Parent WAL $56.4 $51.9 Q1 12 Q1 11 ($ in millions)
Loan and deposit growth Net interest margin Efficiency ratio Asset quality Branch strategy Outlook 2012
Question & Answer