Attached files
| file | filename |
|---|---|
| 8-K - 8-K - KEYCORP /NEW/ | d335896d8k.htm |
| EX-99.3 - EX-99.3 - KEYCORP /NEW/ | d335896dex993.htm |
| EX-99.1 - EX-99.1 - KEYCORP /NEW/ | d335896dex991.htm |
| KeyCorp
First Quarter 2012 Earnings Review
April 19, 2012
Beth E. Mooney
Chairman and
Chief Executive Officer
Jeffrey B. Weeden
Chief Financial Officer
Exhibit 99.2 |
 2
FORWARD-LOOKING STATEMENTS AND ADDITIONAL
INFORMATION DISCLOSURE
This presentation contains and we may, from time to time, make forward-looking statements within
the meaning of the Private Securities Litigation Reform Act of 1995, including statements about
Key’s financial condition, results of operations, earnings outlook, asset quality trends, capital levels and profitability. Forward-
looking statements are not historical facts but instead represent only management’s current
expectations and forecasts regarding future events, many of which, by their nature, are
inherently uncertain and outside of Key’s control. Forward-looking statements usually can be identified by the use of words such as “goal,”
“objective,” plan,” “expect,” “anticipate,”
“intend,” “project,” “believe,” “estimate” or other words of similar meaning.
Our forward-looking statements are subject to the following principal risks and
uncertainties: the economic recovery may face challenges causing its momentum to falter
or a further recession; the Dodd-Frank Wall Street Reform and Consumer Protection Act and other reforms will subject us to a variety of new and more
stringent legal and regulatory requirements, including increased scrutiny from our regulators; changes
in local, regional and international business, economic or political conditions in the regions
where we operate or have significant assets; changes in trade, monetary and fiscal policies of various governmental bodies and
central banks could affect the economic environment in which we operate; our ability to effectively
deal with an economic slowdown or other economic or market difficulty; adverse changes in
credit quality trends; our ability to determine accurate values of certain assets and liabilities; adverse behaviors in foreign exchange
rates, securities, public debt, and capital markets, including changes in market liquidity and
volatility; our ability to anticipate interest rate changes correctly and manage interest
rate risk presented through unanticipated changes in our interest rate risk position and/or short- and long-term interest rates; unanticipated
changes in our liquidity position, including but not limited to our ability to enter the financial
markets to manage and respond to any changes to our liquidity position; adequacy of our
risk management program; reduction of the credit ratings assigned to KeyCorp and KeyBank; increased competitive pressure due to
industry consolidation; unanticipated adverse affects of acquisitions and dispositions of assets,
business units or affiliates; and operational or risk management failures due to technological,
cybersecurity threats or other factors. We provide greater detail regarding some of these factors in our 2011 Form 10-K, including in Item
1A. Risk Factors and in Item 7. Management’s Discussion and Analysis of Financial
Condition and Results of Operation under the heading “Risk Management,” as well as in our subsequent SEC filings, all of which are
accessible on our website at www.key.com/ir and on the SEC’s website at www.sec.gov.
Key does not undertake any obligation to update the forward-looking statements to reflect the
impact of circumstances or events that may arise after the date of the forward-looking
statements. Actual results or future events could differ, possibly materially, from those anticipated in forward-looking statements, as well as
from historical performance.
This presentation also includes certain Non-GAAP financial measures related to “tangible
common equity, “Tier 1 common equity,” and “pre-provision net
revenue.” Management believes these ratios may assist investors, analysts and regulators in
analyzing Key’s financials. Although Key has procedures in place to ensure that
these measures are calculated using the appropriate GAAP or regulatory components, they have limitations as analytical tools and should not be
considered in isolation, or as a substitute for analysis of results under GAAP. For more
information on these calculations and to view the reconciliations to the most comparable GAAP
measures, please refer to the Appendix to this presentation or our most recent earnings press release, which is accessible at
www.key.com/ir.
Web addresses referenced in this slide are inactive textual references only. Information on
these websites is not part of this document. |
 3
Delivering sustainable profitability
Continued improvement in credit quality
Disciplined expense management
Growth in average loans driven by CF&A
Growth in engaged clients
Continued investment to drive future growth
Growing the
Franchise
No objection from Federal Reserve on capital plan
Board authorized common stock repurchase program
Maintaining peer leading capital levels
Positioned to meet Basel III requirements
Execution of
Business Plan
Investor Highlights –
First Quarter 2012
Strategic statement: Key grows by building enduring relationships
through client-focused solutions and extraordinary service
Disciplined
Capital
Management |
 4
(a)
Continuing operations, unless otherwise noted
(b)
Represents period-end consolidated total loans and loans held for sale
(excluding education loans in the securitization trusts) divided by
period-end consolidated total deposits (excluding deposits in foreign office)
Executing Business Plan: Progress on Targets for Success
KEY Business
Model
KEY Metrics
(a)
KEY
1Q12
KEY
4Q11
Targets
Action Plans
Core funded
Loan to deposit ratio
(b)
87%
87%
90-100%
Leverage integrated model to grow
relationships and loans
Improve deposit mix
Returning to a
moderate risk
profile
NCOs to average loans
.82%
.86%
40-50 bps
Focus on relationship clients
Exit noncore portfolios
Limit concentrations
Focus on risk-adjusted returns
Growing high
quality, diverse
revenue streams
Net interest margin
3.16%
3.13%
>3.50%
Improve funding mix
Focus on risk-adjusted returns
Grow client relationships
Leverage Key’s total client solutions and
cross-selling capabilities
Noninterest income
to total revenue
46%
42%
>40%
Creating positive
operating
leverage
Efficiency ratio
68%
73%
60-65%
Improve efficiency and effectiveness
Leverage technology
Change cost base to more variable from
fixed
Executing our
strategies
Return on average
assets
1.02%
1.01%
1.00-1.25%
Execute our client insight-driven
relationship model
Focus on operating leverage
Improved funding mix with lower cost core
deposits |
 5
Financial Review |
 6
Financial Summary –
First Quarter 2012
Capital
(b)
Asset Quality
(a)
Financial
Performance
(a)
TE = Taxable equivalent, EOP = End of Period
(a)
From continuing operations
(b)
From consolidated operations
(c)
3-31-12 ratios are estimated
(d)
Non-GAAP measure: see slide 20 of Appendix for reconciliation.
Income from continuing operations attributable to Key
$.21
$.21
$.21
common shareholders
Net interest margin (TE)
3.16%
3.13%
3.25%
Return on average total assets
1.02
1.01
1.32
Tier 1 common equity
(c), (d)
11.5%
11.3%
10.7%
Tier 1 risk-based capital
(c)
13.3
13.0
13.5
Tangible common equity to tangible assets
(d)
10.3
9.9
9.2
Book value per common share
$10.26
$10.09
$9.58
Net loan charge-offs to average loans
.82%
.86%
1.59%
NPLs to EOP portfolio loans
1.35
1.47
1.82
NPAs to EOP portfolio loans + OREO + Other NPAs
1.55
1.73
2.23
Allowance for loan losses to period-end loans
1.92
2.03
2.83
Allowance for loan losses to NPLs
141.7
138.1
155.0
Metrics
1Q12
4Q11 1Q11 |
 7
Average balances grew for the second
consecutive quarter, driven by strong growth in
CF&A loans
Loan commitments increased 20% to $8.3 billion in
1Q12 from $6.9 billion in 1Q11
Positioned to continue to grow loans by
leveraging integrated business model and
focusing on targeted segments
$0
$10
$20
$30
$40
$50
$60
1Q11
2Q11
3Q11
4Q11
1Q12
Loan Growth
$ in billions
Highlights
Average Commercial, Financial & Agricultural Loans
CF&A loans
Utilization rate
Quarterly % Change in Average CF&A Loans
Average Loans
Exit Portfolios
Home Equity & Other
CF&A & Leasing
Commercial Real Estate
$ in billions
$49.3
$48.5
$19.6
$18.3
$17.4
$16.9
$16.3
46.9%
46.3%
44.4%
43.4%
43.2%
$0
$5
$10
$15
$20
$25
1Q11
2Q11
3Q11
4Q11
1Q12
30%
40%
50%
60%
(5.2)%
(5.7)%
(4.4)%
(2.3)%
(1.5)%
2.7%
5.4%
7.2%
3.7%
(12.0)%
(8.0)%
(4.0)%
.0%
4.0%
8.0%
1Q10
2Q10
3Q10
4Q10
1Q11
2Q11
3Q11
4Q11
1Q12
$48.0
$48.7
$49.4 |
 8
$10.1
$10.8
$11.7
$12.4
$13.6
2.60%
2.59%
2.66%
2.53%
2.48%
$0
$5
$10
$15
$20
1Q11
2Q11
3Q11
4Q11
1Q12
.00%
1.00%
2.00%
3.00%
4.00%
5.00%
$45.4
$45.3
$46.5
$48.2
$48.8
.12%
.13%
.18%
.15%
.17%
$20
$30
$40
$50
1Q11
2Q11
3Q11
4Q11
1Q12
.00%
.10%
.20%
.30%
Improving Deposit Mix
Highlights
Average Non-time Deposits
(a)
Higher cost CDs continue to decline, while lower
cost deposits have remained strong
Improved funding mix has reduced the cost of
total deposits, which is down 4 bps from 4Q11
Total CD maturities and average cost
–
2012 Q2: $2.5 billion at 1.54%
–
2012 Q3: $1.9 billion at 2.92%
–
2012 Q4: $1.1 billion at 2.64%
–
2013 & beyond: $4.4 billion at 2.70%
Average
CD Balances
$ in billions
$ in billions
(a) Excludes time deposits and deposits in foreign office
(b) Represents period-end consolidated total loans and loans held for
sale (excluding education loans in the securitization trusts) divided by
period-end consolidated total deposits (excluding deposits in foreign office)
Loan to Deposit Ratio
(b)
Continuing operations
Discontinued operations
91%
Cost of non-time deposits
Non-time deposits
Average rate on CDs
Total average CDs
86%
86%
87%
87% |
 9
$767
$859
$914
$950
$1,089
1.35%
1.47%
1.64%
1.76%
1.82%
$0
$400
$800
$1,200
$1,600
1Q11
2Q11
3Q11
4Q11
1Q12
0.00%
1.00%
2.00%
3.00%
$944
$1,004
$1,131
$1,230
$1,372
2.57%
2.35%
2.83%
2.03%
1.92%
$0
$400
$800
$1,200
$1,600
1Q11
2Q11
3Q11
4Q11
1Q12
0.00%
1.00%
2.00%
3.00%
4.00%
141.7%
138.1%
143.5%
146.1%
155.0%
0%
50%
100%
150%
200%
1Q11
2Q11
3Q11
4Q11
1Q12
$193
$134
$109
$105
$101
$42
$(22)
$10
$(8)
$(40)
1.59%
1.11%
.86%
.
82%
.90%
-$100
$0
$100
$200
$300
1Q11
2Q11
3Q11
4Q11
1Q12
-1.00%
.00%
1.00%
2.00%
3.00%
Nonperforming Assets
Net Charge-offs & Provision for Loan and Lease Losses
NPLs
NPLs to period-end loans
NCOs
Provision for loan and
lease losses
NCOs to average loans
Allowance for Loan and Lease Losses
Allowance to Nonperforming Loans
Allowance for loan
and lease losses
ALLL to period-end loans
$ in millions
$ in millions
$ in millions
NPLs held for sale,
OREO & other NPAs
Continued Improvement in Asset Quality |
 10
Total Revenue
TE = Taxable equivalent
$ in millions
Continuing Operations
Net interest margin
Net interest income
Highlights
Net Interest Margin (TE) Trend
Net interest margin increased 3 bps from 4Q11, a
result of improved funding costs and a decrease
in lower-yielding short-term investments
Higher noninterest income primarily driven by
principal investing income and a gain from the
termination of a leveraged lease
New client acquisition and execution of
relationship-based model provide opportunities
to grow noninterest income
Noninterest Income and % of Total Revenue
Noninterest income
Noninterest income to
total revenue
$ in millions
$559
$563
$555
$570
$604
3.19%
3.09%
3.25%
3.13%
3.16%
$0
$150
$300
$450
$600
$750
1Q11
2Q11
3Q11
4Q11
1Q12
0.00%
2.00%
4.00%
6.00%
$457
$454
$483
$414
$472
45.8%
42.4%
43.1%
46.5%
44.3%
$0
$200
$400
$600
1Q11
2Q11
3Q11
4Q11
1Q12
30.0%
40.0%
50.0%
60.0% |
 11
$371
$380
$382
$387
$385
$330
$300
$310
$330
$318
$0
$200
$400
$600
$800
1Q11
2Q11
3Q11
4Q11
1Q12
Focused Expense Management
Noninterest Expense
Personnel expense
$ in millions
Highlights
Noninterest expense declined $14 million from
4Q11, with improvement in both personnel and
non-personnel expense
Key remains focused on operating leverage
–
Shifting FTE mix towards client-facing
positions
–
Leveraging continuous improvement
practices
–
Strengthening processes, alignment and
accountability across the organization
Average FTEs
Non-personnel expense
$680
$701
15,665
15,381
15,584
15,772
15,424
15,301
15,349
15,490
15,404
14,000
15,000
16,000
17,000
18,000
1Q10
2Q10
3Q10
4Q10
1Q11
2Q11
3Q11
4Q11
1Q12
$692
$717
$703 |
 12
$1,031
$703
$328
Total revenue
Noninterest
expense
PPNR
1Q12 Pre-Provision Net Revenue
Pre-Provision Net Revenue Trend
Pre-Provision Net Revenue
(a), (b)
and ROAA
(c)
(a)
Net interest income plus taxable-equivalent adjustment and noninterest income
less noninterest expense (b)
Non-GAAP measure: see slide 20 of Appendix for reconciliation.
(c)
From continuing operations
Return on Average Assets
$ in millions
$ in millions
Noninterest
income
46%
Personnel
expense
55%
$360
$344
$346
$260
$328
$0
$100
$200
$300
$400
$500
1Q11
2Q11
3Q11
4Q11
1Q12
1.02%
1.01%
1.14%
1.23%
1.32%
.00%
.50%
1.00%
1.50%
2.00%
1Q11
2Q11
3Q11
4Q11
1Q12
Net interest
income
54%
Non-personnel
expense
45% |
 13
No objection from Federal Reserve on capital plan
–
Board authorized stock repurchase program
–
Dividend increase will be evaluated at May
Board meeting
Peer leading capital position supports growth
Disciplined approach to capital management
Positioned for successful transition to Basel III
Tier 1 Common Equity
(a), (b)
Tangible Common Equity to Tangible Assets
(b)
Strong Capital Ratios
Highlights
Book Value per Share
10.3%
9.9%
9.2%
9.7%
9.8%
0.00%
3.00%
6.00%
9.00%
12.00%
1Q11
2Q11
3Q11
4Q11
1Q12
$10.26
$10.09
$9.58
$9.88
$10.09
$8.00
$8.50
$9.00
$9.50
$10.00
$10.50
1Q11
2Q11
3Q11
4Q11
1Q12
11.5%
11.3%
10.7%
11.1%
11.3%
0.00%
3.00%
6.00%
9.00%
12.00%
1Q11
2Q11
3Q11
4Q11
1Q12
(a)
3-31-12 ratio is estimated
(b)
Non-GAAP measure: see slide 20 of Appendix for reconciliation.
|
 14
Appendix |
 15
Average Total Investment Securities
Highlights
Average AFS securities
$ in billions
High Quality Investment Portfolio
Portfolio composed of Agency or GSE backed:
GNMA, Fannie & Freddie
–
No private label MBS or financial paper
Average portfolio life at 3/31/12: 2.4 years
Unrealized net gain of $505 million on available-
for-sale securities portfolio at 3/31/12
Mortgage paydowns in 4Q11 and 1Q12 were
$1.5 billion
Yield decline in 1Q12 from paydowns of higher
yielding mortgage investments and purchases of
lower yielding investments
Securities to Total Assets
(a)
(a) Includes end of period held-to-maturity and
available-for-sale securities 20.2%
20.4%
21.6%
21.1%
21.0%
0%
5%
10%
15%
20%
25%
1Q11
2Q11
3Q11
4Q11
1Q12
Average yield
Average HTM securities
$17.5
$18.4
$18.5
$19.0
$21.2
3.01%
3.07%
3.15%
3.20%
3.19%
$0
$5
$10
$15
$20
$25
1Q11
2Q11
3Q11
4Q11
1Q12
0.00%
1.00%
2.00%
3.00%
4.00%
5.00% |
 16
N/M = Not Meaningful
(a)
Net loan charge-off amounts are annualized in calculation. NCO ratios for
discontinued operations and consolidated Key exclude education loans in the
securitization trusts since valued at fair-market value (b)
3-31-12 allowance by portfolio is estimated. Allowance/period loans ratios
for discontinued operations and consolidated Key exclude education loans in
the securitization trusts since valued at fair-market value Credit
Quality Credit Quality by Portfolio
$ in millions
Allowance /
period-end
loans
(b)
Allowance /
NPLs
Net loan
charge-offs
Net loan
charge-offs
(a)
/
average loans
Nonperforming
loans
Ending
allowance
(b)
Period-end
loans
Average
loans
3/31/12
1Q12
1Q12
4Q11
1Q12
4Q11
3/31/12
12/31/11
3/31/12
3/31/12
3/31/12
Allowance /
period-end
loans
(b)
Allowance /
NPLs
Net loan
charge-offs
Net loan
charge-offs
(a)
/
average loans
Nonperforming
loans
Ending
allowance
(b)
Commercial, financial and agricultural
$19,787
$19,638
$15
$28
.31
%
.61
%
$168
$188
$316
1.60
%
188.10
%
Commercial real estate:
Commercial mortgage
7,807
7,993
21
23
1.06
1.13
175
218
263
3.37
150.29
Construction
1,273
1,284
10
(6)
3.13
(1.72)
66
54
56
4.40
84.85
Commercial lease financing
5,755
5,846
-
-
-
-
22
27
68
1.18
309.09
Real estate - residential mortgage
1,967
1,950
5
7
1.03
1.45
82
87
36
1.83
43.90
Home equity:
Key Community Bank
9,153
9,173
23
20
1.01
.86
109
108
94
1.03
86.24
Other
507
521
7
9
5.40
6.46
12
12
28
5.52
233.33
Consumer other— Key Community Bank
1,212
1,193
9
9
3.03
3.00
1
1
37
3.05
N/M
Consumer other:
Marine
1,654
1,714
10
14
2.35
3.05
30
31
45
2.72
150.00
Other
111
118
1
1
3.41
3.12
1
1
1
.90
100.00
Continuing total
$49,226
$49,430
$101
$105
.82
%
.86
%
$666
$727
$944
1.92
%
141.74
%
Discontinued operations - education
lending business
5,715
5,745
19
25
2.51
3.19
19
23
90
3.00
473.68
Consolidated total
$54,941
$55,175
$120
$130
.92
%
1.00
%
$685
$750
$1,034
1.98
%
150.95
% |
 17
Community Bank –
Home Equity
Exit Portfolio –
Home Equity
$ in millions, except average loan size
(a)
Home Equity Loans –
3/31/12
Vintage (% of Loans)
Loan Balances
Average Loan
Size ($)
Average
FICO
Average
LTV
% of Loans
LTV>90%
2011 and
later
2010
2009
2008
2007 and
prior
Home equity loans and lines
First lien
22
$
22,785
$
746
33
%
.4
%
-
-
-
2
%
98
%
Second lien
486
24,570
730
82
32.5
-
-
-
2
98
Total home equity loans and lines
509
$
24,485
$
731
80
31.1
-
-
-
1
99
Nonaccrual loans
First lien
1
$
20,525
$
735
25
%
-
-
-
-
-
100
%
Second lien
11
27,989
705
83
33.9
%
-
-
-
1
%
99
Total home equity nonaccrual loans
12
$
27,423
$
706
81
32.0
-
-
-
1
99
Exit Portfolio - Home Equity
First quarter net charge-offs
7
$
-
-
-
4
%
96
%
Net loan charge-offs to average loans
5.40
%
(a) Average LTVs are at origination. Current average LTVs for Community Bank total home equity
loans and lines is approximately 81%, which compares to 78% at the end of the fourth quarter
2011. |
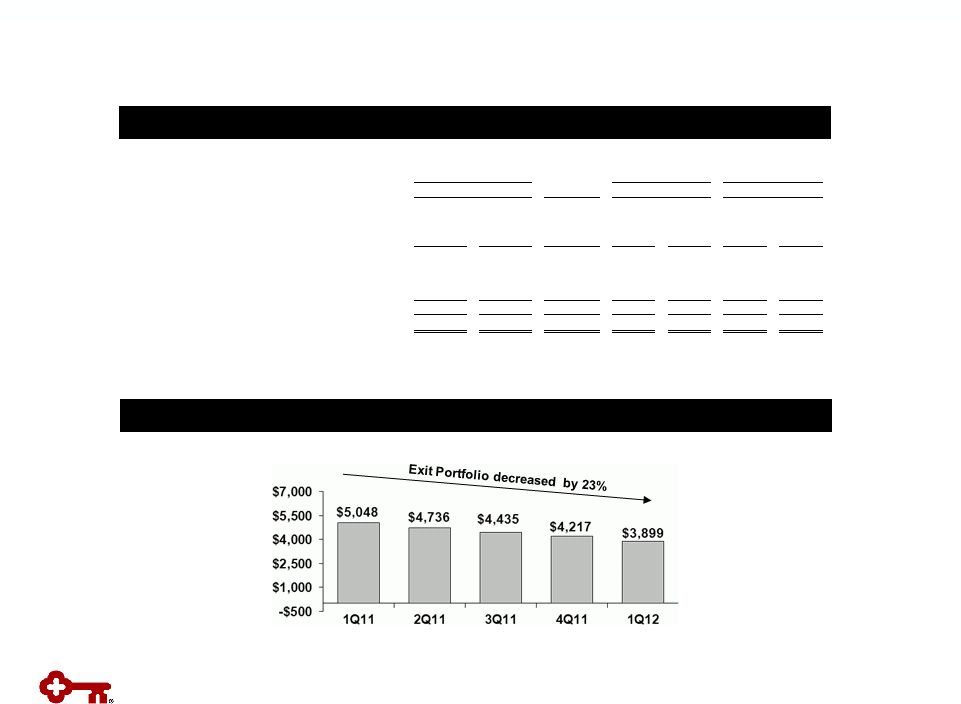 18
Exit Loan Portfolio Trend (Excluding Discontinued Operations)
Exit Loan Portfolio
$ in millions
Exit Loan Portfolio
Change
3-31-12 vs.
3-31-12
12-31-11
12-31-11
1Q12
(c)
4Q11
(c)
3-31-12
12-31-11
Residential properties –
homebuilder
$34
$41
$(7)
$2
$(2)
$17
$23
Marine and RV floor plan
59
81
(22)
7
2
32
45
Commercial lease financing
(a)
1,534
1,669
(135)
(1)
(2)
11
7
Total commercial loans
1,627
1,791
(164)
8
(2)
60
75
Home equity –
Other
507
535
(28)
7
9
12
12
Marine
1,654
1,766
(112)
10
14
31
31
RV and other consumer
111
125
(14)
1
1
-
1
Total consumer loans
2,272
2,426
(154)
18
24
43
44
Total exit loans in loan portfolio
$3,899
$4,217
$(318)
$26
$22
$103
$119
Discontinued operations -
education
lending business (not included in exit loans above)
(b)
$5,715
$5,812
$(97)
$19
$25
$19
$23
Balance on
Nonperforming
Status
Balance
Outstanding
Charge-offs
Net Loan
$ in millions
(a) Includes the business aviation, commercial vehicle, office products, construction and industrial
leases, and Canadian lease financing portfolios;
and all remaining balances related to lease in, lease out; sale in,
sale out; service contract leases; and qualified technological equipment leases
(b) Includes loans in Key’s consolidated education loan securitization trusts (c) Credit amounts
indicate recoveries exceeded charge-offs
|
 19
Credit Quality Trends
Quarterly Change in Criticized Outstandings
(a)
Delinquencies to Period-end Total Loans
(a)
Loan and Lease Outstandings
.85%
.89%
.99%
.97%
.98%
.95%
1.29%
1.14%
1.14%
1.59%
1.72%
1.61%
1.87%
.34%
.33%
.24%
.25%
.32%
.48%
.30%
.45%
.78%
.56%
.60%
.82%
.62%
0.00%
0.50%
1.00%
1.50%
2.00%
2.50%
30 –
89 days delinquent
90+ days delinquent
(6.8)%
(13.6)%
(10.2)%
(12.3)%
(11.2)%
(16.7)%
(14.3)%
(12.8)%
(1.0)%
(8.1)%
(2.0)%
2.8%
35.1%
-20%
-10%
0%
10%
20%
30%
40%
1Q09
2Q09
3Q09
4Q09
1Q10
2Q10
3Q10
4Q10
1Q11
2Q11
3Q11
4Q11
1Q12 |
 GAAP
to Non-GAAP Reconciliation (a)
Includes net unrealized gains or losses on securities available for sale (except for net unrealized
losses on marketable equity securities), net gains or losses on cash flow hedges, and amounts
resulting from the December 31, 2006, adoption and subsequent application of the applicable accounting guidance for defined benefit and
other postretirement plans.
(b)
Other assets deducted from Tier 1 capital and net risk-weighted assets consist of disallowed
deferred tax assets of $47 million at March 31, 2011, disallowed intangible assets (excluding
goodwill) and deductible portions of nonfinancial equity investments. There were no disallowed deferred tax assets at March 31, 2012
and December 31, 2011.
(c)
3-31-12 amount is estimated.
20 |