Attached files
| file | filename |
|---|---|
| 8-K - FORM 8-K - BlackRock Inc. | d333385d8k.htm |
| EX-99.1 - PRESS RELEASE DATED APRIL 18, 2012 ISSUED BY THE COMPANY - BlackRock Inc. | d333385dex991.htm |
 Q1
2012 Earnings Press Release Supplement
April 18, 2012
Exhibit 99.2 |
 1
Important Notes
This presentation, and other statements that BlackRock may make, may contain forward-looking
statements within the meaning of the Private Securities Litigation Reform Act, with respect to
BlackRock’s future financial or business performance, strategies or expectations.
Forward-looking statements are typically identified by words or phrases such as “trend,”
“potential,” “opportunity,” “pipeline,” “believe,”
“comfortable,” “expect,” “anticipate,” “current,”
“intention,” “estimate,” “position,” “assume,” “outlook,” “continue,” “remain,” “maintain,”
“sustain,” “seek,” “achieve,” and similar expressions, or future or
conditional verbs such as “will,” “would,” “should,” “could,” “may” or
similar expressions.
BlackRock cautions that forward-looking statements are subject to numerous assumptions, risks and
uncertainties, which change over time. Forward-looking statements speak only as of
the date they are made, and BlackRock assumes no duty to and does not undertake to update
forward-looking statements. Actual results could differ materially from those anticipated in forward-looking statements and
future results could differ materially from historical performance. In
addition to risk factors previously disclosed in BlackRock’s Securities and Exchange Commission (“SEC”) reports and those identified
elsewhere in this presentation the following factors, among others, could cause actual results to
differ materially from forward-looking statements or historical performance: (1) the
introduction, withdrawal, success and timing of business initiatives and strategies; (2)
changes and volatility in political, economic or industry conditions, the interest rate environment, foreign exchange rates or financial
and capital markets, which could result in changes in demand for products or services or in the value
of assets under management; (3) the relative and absolute investment performance of
BlackRock’s investment products; (4) the impact of increased competition; (5) the impact of
future acquisitions or divestitures; (6) the unfavorable resolution of legal proceedings; (7) the extent and timing of any share
repurchases; (8) the impact, extent and timing of technological changes and the adequacy of
intellectual property and information security protection; (9) the impact of legislative
and regulatory actions and reforms, including the Dodd-Frank Wall Street Reform and
Consumer Protection Act, and regulatory, supervisory or enforcement actions of government agencies
relating to BlackRock, Barclays Bank PLC or The PNC Financial Services Group, Inc.; (10)
terrorist activities, international hostilities and natural disasters, which may adversely
affect the general economy, domestic and local financial and capital markets, specific industries or BlackRock; (11) the ability
to attract and retain highly talented professionals; (12) fluctuations in the carrying value of
BlackRock’s economic investments; (13) the impact of changes to tax legislation, including
taxation on products or transactions which could affect the value proposition to clients and,
generally, the tax position of the Company; (14) BlackRock’s success in maintaining the
distribution of its products; (15) the impact of BlackRock electing to provide support to its
products from time to time; and (16) the impact of problems at other financial institutions or
the failure or negative performance of products at other financial institutions. This
presentation also includes non-GAAP financial measures. You can find our presentations on the most directly comparable GAAP
financial measures calculated in accordance with GAAP and our reconciliations in our current earnings
release dated April 18, 2012, and BlackRock’s
other periodic reports, which are available on BlackRock’s web site at www.blackrock.com |
 2
Diluted EPS increased to $3.16
Operating and Net Income, as adjusted ($ in millions)
Diluted Earnings Per Share, as adjusted
For further information and reconciliation between GAAP and as adjusted, see the
appendix, notes (a) through (e) in the current earnings release as well as previously filed Form 10-Ks, 10-Qs and 8-Ks.
Operating Income
Net Income |
 3
40.0%
38.6%
40.1%
39.7%
37.4%
38.7%
38.2%
36.8%
39.3%
39.1%
2007
2008
2009
2009
2010
Q1 2011
Q2 2011
Q3 2011
Q4 2011
Q1 2012
Sequential operating margin reflected strength in core business and seasonal
factors Operating Margin, as adjusted
For further information and reconciliation between GAAP and as adjusted, see the
appendix, notes (a) through (e) in the current earnings release as well as previously filed Form 10-Ks, 10-Qs and 8-Ks.
Full Year 2011 = 39.7%
BGI/BLK
Pro Forma
Sequential operating margin reflected seasonal effect of performance fees and payroll
taxes |
 Equity
markets trended higher in Q1 2012 but non-US markets still below Q1 2011
level 4
All equity markets trended higher in Q1 2012 compared to Q4 2011. While US markets
are above levels of Q1 2011, major non-US markets are still below the
levels of Q1 2011 Average Index Level
Q1 12 vs.
Q1 11
Q4 11
Q1 12
Q1 11
Q4 11
S&P 500
1,303
1,225
1,347
3.3%
9.9%
MSCI Barra World Index
1,320
1,169
1,268
(3.9%)
8.5%
MSCI Europe Index
97
82
90
(7.2%)
10.1%
MSCI AC Asia Pacific Index
137
115
124
(9.4%)
7.3%
S&P Global Natural Resources
3,958
3,291
3,533
(10.7%)
7.4%
MSCI Emerging Markets Index
1,128
931
1,026
(9.1%)
10.2%
Index |
 Year-over-year
Q1 2012 vs. Q1 2011
5 |
 6
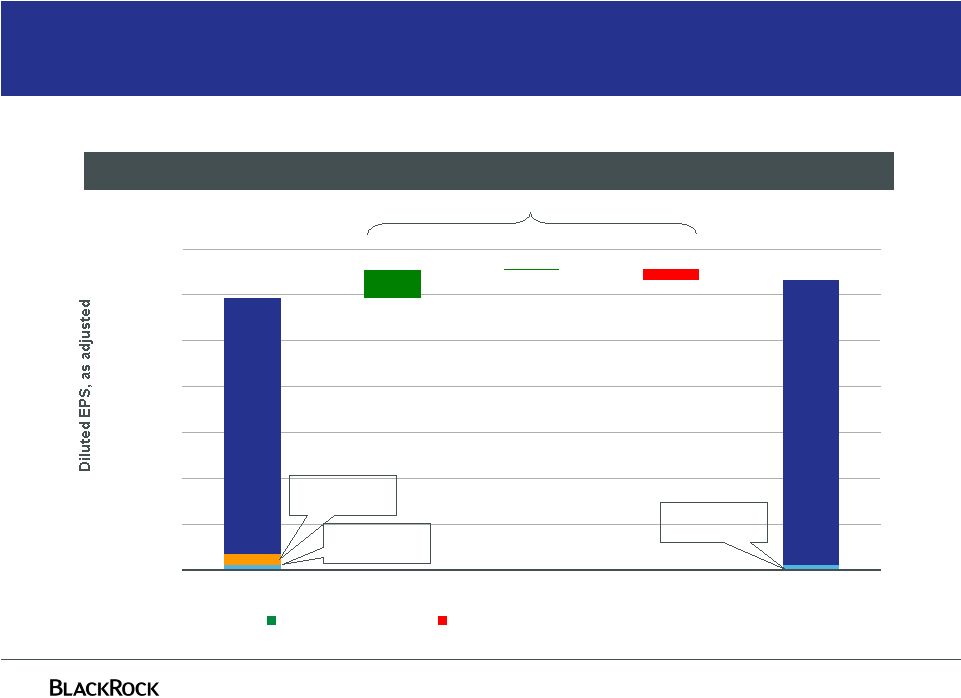
Year-over-year EPS up 7%
Q1-12 Compared to Q1-11, as adjusted
$0.31
$0.01
($0.12)
$2.79
$3.10
$0.00
$0.50
$1.00
$1.50
$2.00
$2.50
$3.00
$3.50
Q1-11 EPS
Operating EPS
Non-Operating EPS
Tax Adjustment
Q1-12 EPS
Total EPS:
$3.16
Total EPS:
$2.96
Non-Operating:
$0.05
Operating
EPS:
Operating
EPS:
For further information and reconciliation between GAAP and as adjusted, see the
appendix and notes (a) through (e) in the current earnings release.
Non-Operating:
$0.06
Decreasing EPS
$0.20
Tax Adjustment:
$0.12
Increasing EPS |
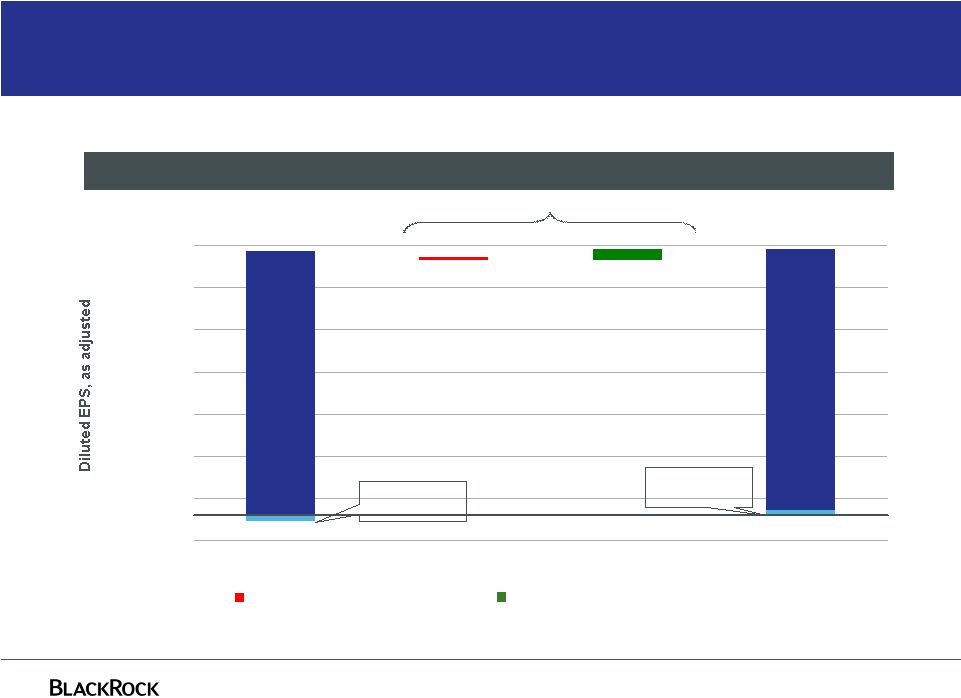
 7
Year-over-year
operating
income
reflected
expense
discipline
and
market
effects
Q1-12 Compared to Q1-11, as adjusted
For further information and reconciliation between GAAP and as adjusted, see the
appendix and notes (a) through (e) in the current earnings release.
Decreasing Expenses
Decreasing Revenue
$0
$6 million
$825
$819
$39
($33)
$600
$700
$800
$900
Q1-11
Revenue
Expenses
Q1-12 |
 8
Year-over-year long-term base fee growth offset by market trends out of
cash products
Q1-12 Compared to Q1-11
Total Revenue
Q1-11
$2.28 billion
Q1-12
$2.25 billion
Decreasing Revenue
Increasing Revenue |
 9
Year-over-year base fees up in majority of long-term asset classes
Decreasing Base Fees
Increasing Base Fees
Q1-12 Compared to Q1-11
Q1-12
$1.98 billion
Base fees
Q1-11
$1.98 billion
$0
$1,600
$1,700
$1,800
$1,900
$2,000
$2,100 |
 $0
10
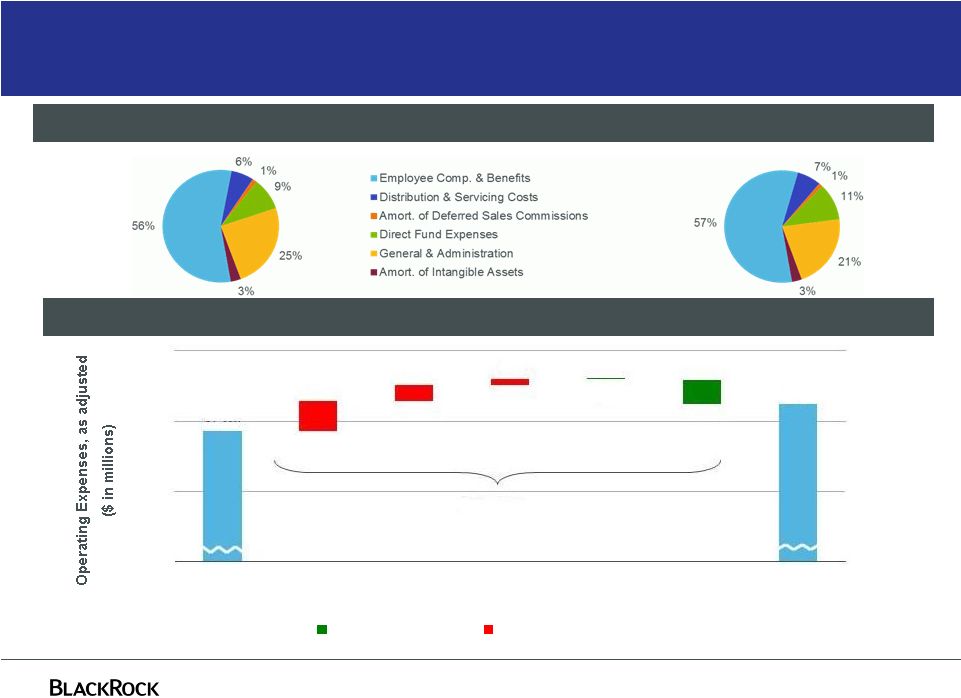
Year-over-year expenses declined in the majority of categories
Increasing Expenses
Decreasing Expenses
Q1-12
$1.42 billion
Expenses, as adjusted, by Category
Q1-12 Compared to Q1-11, as adjusted
For further information and reconciliation between GAAP and as adjusted, see the
appendix and notes (a) through (e) in the current earnings release. ($39)
million Q1-11
$1.46 billion
$1,424
$1,463
($33)
($14)
($6)
($1)
$6
$9
$1,300
$1,400
$1,500
Q1-11
Direct Fund
Expenses
Compensation
& Benefits
Amort.-
Intangible
Assets
Amort.-
Deferred
Commissions
Distribution
& Servicing
G&A
Q1-12 |
 Sequential Quarters
Q1 2012 vs. Q4 2011
11 |
 12
Sequential EPS growth of 3% benefited from improved global markets
Increasing EPS
For further information and reconciliation between GAAP and as adjusted, see the
appendix and notes (a) through (e) in the current earnings release. Q1-12
Compared to Q4-11, as adjusted ($0.04)
$0.14
$3.14
$3.10
($0.30)
$0.20
$0.70
$1.20
$1.70
$2.20
$2.70
$3.20
Q4-11 EPS
Operating EPS
Non-Operating EPS
Q1-12 EPS
Total EPS:
$3.06
Total EPS:
$3.16
Operating
EPS:
Non-Operating:
($0.08)
Non-Operating:
$0.06
Operating
EPS:
Decreasing EPS
$0.10 |
 13
Q1 2012 operating income reflected higher base fees offset by seasonal factors
Q1-12 Compared to Q4-11, as adjusted
For further information and reconciliation between GAAP and as adjusted, see the
appendix and notes (a) through (e) in the current earnings release.
Increasing Expense
Increasing Revenue
$0
$600
$700
$800
$900
($16) million
$841
$825
($38)
$22
Q4-11
Revenue
Expenses
Q1-12 |
 14
Sequential growth in base fees partially offset by seasonally high Q4 performance fee
“locks” Decreasing Revenue
Q1-12 Compared to Q4-11
Increasing Revenue
Total Revenue
Q1-12
$2.25 billion
Q4-11
$2.23 billion
$0
$2,000
$2,200
$2,400
$22 million
$2,249
$2,227
$1
($26)
$114
($67)
Q4-11
Base Fees
Other Revenue /
Distribution Fees
BRS & Advisory
Performance Fees
Q1-12 |
 15
Sequential base fees increased across all products
$114 million
Increasing Base Fees
Base Fees
$0
Q1-12 Compared to Q4-11
Q4-11
$1.86 billion
Q1-12
$1.98 billion
$1,863
$1,700
$1,800
$1,900
$2,000
Q4-11
iShares
Equity
Multi-Asset
Active
Equity
Institutional
Index Equity
iShares
Fixed
Income
Alternatives
Cash
Institutional
Index Fixed
Income
Active
Fixed
Income
Q1-12
$1,977
$1
$2
$4
$10
$11
$16
$23
$43
$4 |
 16
Sequential expenses reflected revenue growth, seasonal factors and cost
discipline
Increasing Expenses
Decreasing Expenses
$0
Q4-11
$1.39 billion
Expense, as adjusted, by Category
Q1-12 Compared to Q4-11, as adjusted
For further information and reconciliation between GAAP and as adjusted, see the
appendix and notes (a) through (e) in the current earnings release. $38
million Q1-12
$1.42 billion
$1,424
$1,386
($34)
($2)
$8
$24
$42
$1,300
$1,400
$1,500
Q4-11
Compensation &
Benefits
Direct Fund
Expenses
Distribution &
Servicing
Amort.-
Deferred
Commissions
G&A
Q1-12 |
 Non-operating and cash flow
17 |
 18
For further information and reconciliation between GAAP and as adjusted, see the
appendix and notes (a) through (e) in the current earnings release. Q1 2012
investment gains reflected favorable market movements $21
$28
$1
$6
($1)
($40)
($40)
($30)
($20)
($10)
$0
$10
$20
$30
Private Equity
Real Estate
Distressed Credit/
Mortgage Funds
Hedge Funds/
Funds of Hedge
Funds
Other Investments
Net Interest
Expense
Q1-12 $15 million Non-Operating Income by Category, as adjusted
Investment
Losses/
Net
Interest
Expense
Investment Gains
$55 million Net
Investment Gains |
 19
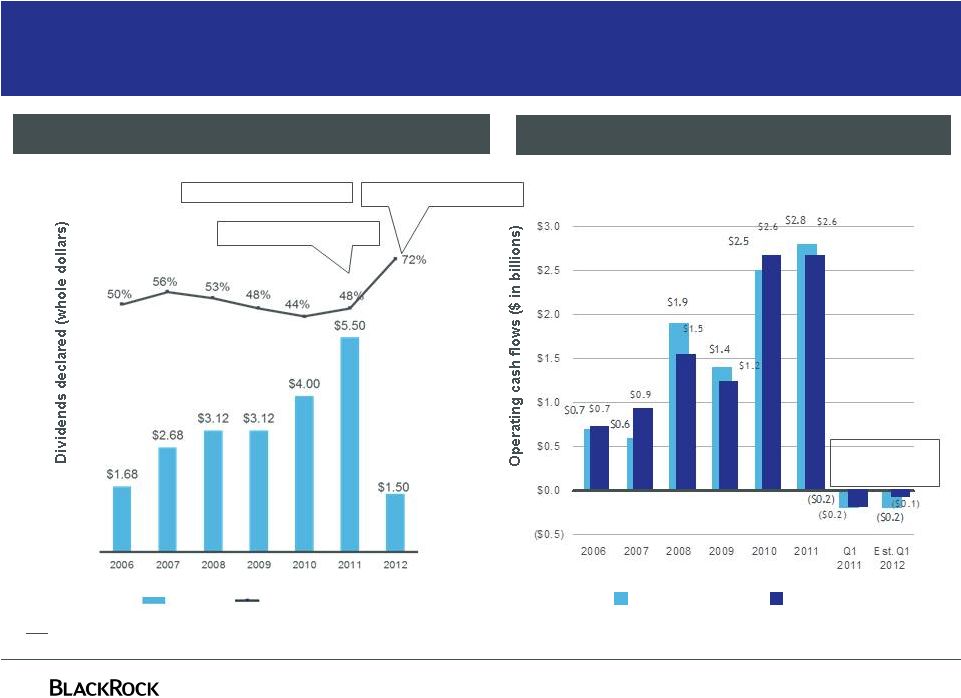
Operating cash flow and payout ratio
Notes:
(A)
(B)
Strong cash flow supports Q1 2012 increase in dividend and
increase in share repurchase authorizations
Operating cash flow
GAAP
as adjusted
For further information and reconciliation between GAAP and as adjusted, see the
Company’s previously filed Form 10-Ks, Form 10-Qs and
8-Ks. 157% with $2.5 bn May buyback
Includes $125 m Q1 buyback
Excludes $2.5 bn May buyback
Annual incentive
compensation payout
in Q1
Payout Ratio (A)
Dividend
Payout ratio = (dividends + share repurchases) / GAAP net income.
2/17/06 2/27/07
2/15/08 N/A 2/25/10 2/24/11
2/23/12
Dividend Change
Declared:
Q1 |
 Appendix
20 |
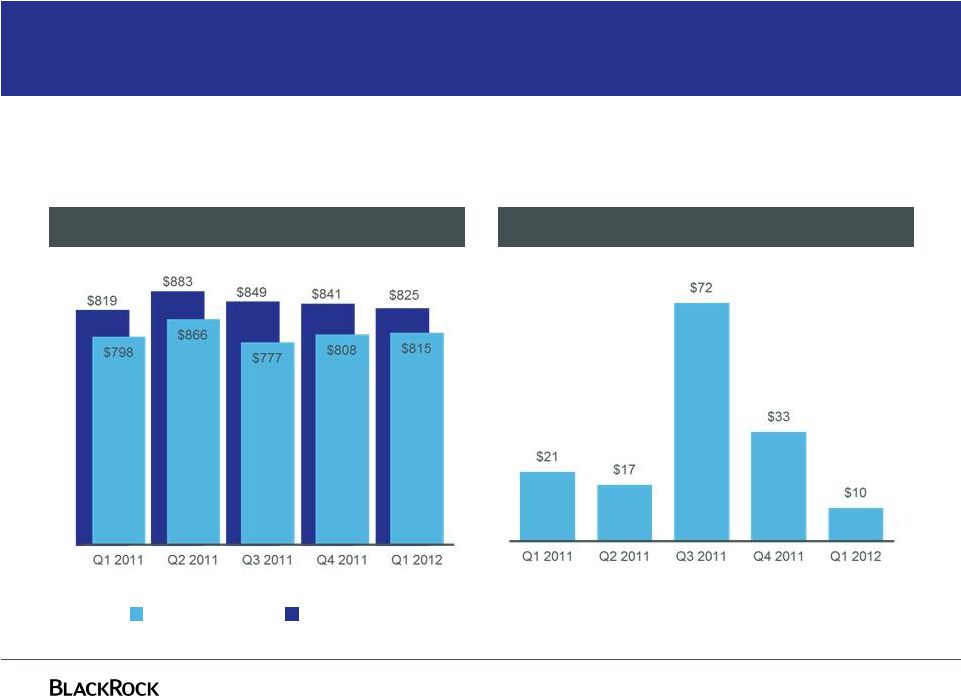 21
Quarterly operating income –
GAAP and as adjusted
GAAP
as adjusted
Operating Income ($ in millions)
Non-GAAP Adjustments ($ in millions)
Non-GAAP adjustments include PNC LTIP funding obligation, Merrill Lynch
compensation contribution, UK lease exit costs, restructuring charges, and
compensation related to appreciation (depreciation) on certain deferred compensation
plans
For further information and reconciliation between GAAP and as adjusted, see the
appendix and notes (a) through (e) in the current earnings release as well as previously filed Form 10-Ks, 10-Qs and 8-Ks. |
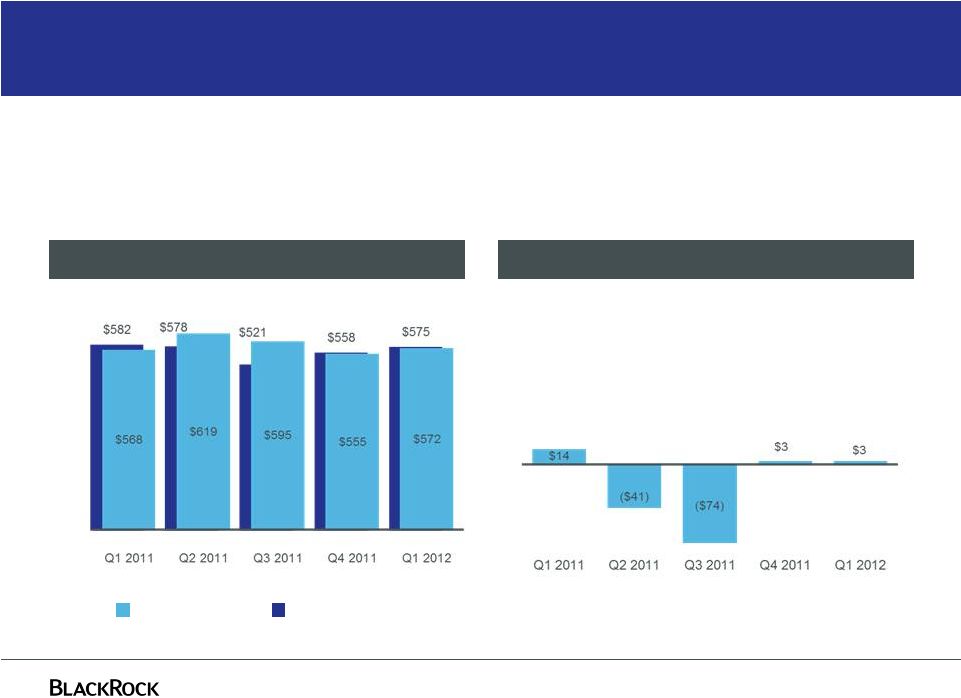 22
Quarterly net income –
GAAP and as adjusted
Net Income ($ in millions)
Non-GAAP Adjustments ($ in millions)
Non-GAAP adjustments include PNC LTIP funding obligation, Merrill Lynch
compensation contribution, UK lease exit costs,
restructuring
charges,
income
tax
law
changes
and
a
state
tax
election
GAAP
as adjusted
For further information and reconciliation between GAAP and as adjusted, see the
appendix and notes (a) through (e) in the current earnings release as well as previously filed Form 10-Ks, 10-Qs and 8-Ks. |
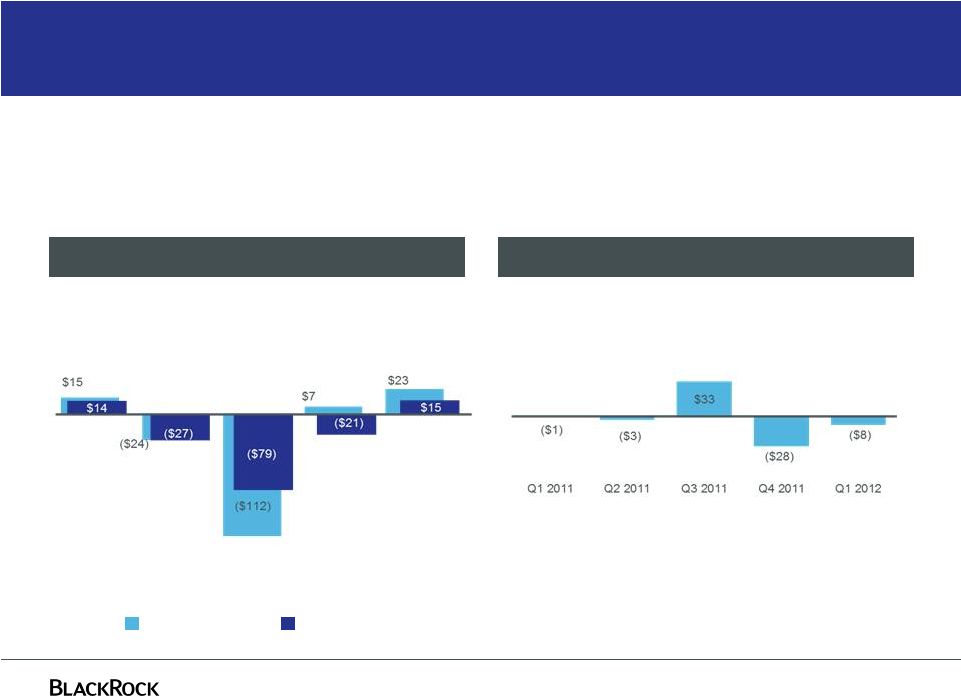 23
GAAP
as adjusted
Quarterly non-operating income –
GAAP and as adjusted
Non-Operating Income (Expense) ($ in millions)
Non-GAAP Adjustments ($ in millions)
Non-GAAP adjustments include net income (loss) attributable to
non-controlling interests and compensation expense related to
(appreciation) depreciation on certain deferred compensation plans Q1
2011
Q2
2011
Q3
2011
Q4
2011
Q1
2012
For further information and reconciliation between GAAP and as adjusted, see the
appendix and notes (a) through (e) in the current earnings release as well as previously filed Form 10-Ks, 10-Qs and 8-Ks. |
 24
Q1 2012 long-term AUM up 7% from prior quarter
Q4-11 Compared to Q1-12
$207 billion
Long-term AUM
Q4-11
$3.138 trillion
Q1-12
$3.345 trillion
Decreasing AUM
Increasing AUM
Q1 2012 net new business excludes the effect of a previously announced institutional
fixed income index redemption that totaled $36.0 billion from a single client resulting from the decision to insource.
($36)
$3,345
$3,138
$26
$201
$8
$8
$3,100
$3,200
$3,300
$3,400
Q4-11
Net New Business
Acquisition
Market
FX
Q1-12
$0 |
 25
Q1 2012 long-term AUM up 3% year-over-year
Q1-11 Compared to Q1-12
$0
$100 billion
Long-term AUM
Q1-11
$3.245 trillion
Q1-12
$3.345 trillion
Decreasing AUM
Increasing AUM
M/Q represents outflows due to manager concentration considerations prior to third
quarter 2011. Q1 2012 net new business excludes the effect of a previously
announced institutional fixed income index redemption that totaled $36.0 billion from a single client resulting from the decision to insource.
($36)
$3,345
($16)
($10)
$8
$58
$96
$3,245
$3,100
$3,200
$3,300
$3,400
Q1-11
Net New
Business
M/Q
Acquisition
Market
FX
Q1-12 |
 Q1
2012 mix by product, client type, style and region 26
Base and performance fees of $2.0
billion
Long-term Assets Under Management
of $3.345 trillion
Q1 2012 Long-term Base and
Performance Fees of $1.968 billion
Long-term Assets Under Management
of $3.345 trillion at March 31, 2012 |
 |