Attached files
| file | filename |
|---|---|
| 8-K - 8-K - Antero Resources LLC | a12-8000_168k.htm |
Exhibit 99.1
|
|
June 2011 Company Overview |
|
|
This presentation contains forward-looking statements within the meaning of Section 27A of the Securities Act of 1933 and Section 21E of the Securities Exchange Act of 1934. All statements, other than statements of historical facts, included in this presentation that address activities, events or developments that Antero Resources LLC and its subsidiaries (collectively, the “Company”) expects, believes or anticipates will or may occur in the future are forward-looking statements. The words “believe,” “expect,” “anticipate,” “plan,” “intend,” “foresee,” “should,” “would,” “could,” or other similar expressions are intended to identify forward-looking statements, which are generally not historical in nature. However, the absence of these words does not mean that the statements are not forward-looking. Without limiting the generality of the foregoing, forward-looking statements contained in this presentation specifically include estimates of the Company’s reserves, expectations of plans, strategies, objectives and anticipated financial and operating results of the Company, including as to the Company’s drilling program, production, hedging activities, capital expenditure levels and other guidance included in this presentation. These statements are based on certain assumptions made by the Company based on management’s experience and perception of historical trends, current conditions, anticipated future developments and other factors believed to be appropriate. Such statements are subject to a number of assumptions, risks and uncertainties, many of which are beyond the control of the Company, which may cause actual results to differ materially from those implied or expressed by the forward-looking statements. These include the factors discussed or referenced in the Company’s filings with the SEC. Any forward-looking statement speaks only as of the date on which such statement is made and the Company undertakes no obligation to correct or update any forward-looking statement, whether as a result of new information, future events or otherwise, except as required by applicable law. Forward Looking Statements 1 |
|
|
The U.S. Securities and Exchange Commission (SEC) permits oil and gas companies, in their filings with the SEC, to disclose only proved, probable and possible reserve estimates (3P). Antero has provided internally generated estimates for proved, probable and possible reserves in this presentation in accordance with SEC guidelines and definitions. The estimates of reserves included in this presentation have not been prepared or reviewed by Antero’s third-party engineers. Antero’s estimate of probable and possible reserves was prepared by Antero’s internal reserve engineers and is provided in this presentation because management believes it is useful information that is widely used by the investment community in the valuation, comparison and analysis of companies. Antero does not plan to include probable and possible reserve estimates in its filings with the SEC. We use certain other terms in this presentation relating to estimates of hydrocarbon volumes that the SEC’s guidelines prohibit us from including in filings with the SEC. These estimates are by their nature more speculative than estimates of proved, possible or probable reserves as defined by SEC regulations and accordingly are substantially less certain and no discount or other adjustment is included in the presentation of such numbers. Actual quantities that may be ultimately recovered from Antero’s interests may differ substantially from the estimates in this presentation. Factors affecting ultimate recovery include the scope of our ongoing drilling program, which will be directly affected by commodity prices, the availability of capital, drilling and production costs, availability of drilling services and equipment, drilling results, lease expirations, transportation constraints, regulatory approvals and other factors; and actual drilling results, including geological and mechanical factors affecting recovery rates. In this presentation: “3P reserves” refer to Antero’s estimated aggregate proved, probable and possible reserves as of March 31, 2011. The SEC prohibits companies from aggregating proved, probable and possible reserves in filings with the SEC due to the different levels of certainty associated with each reserve category. “EUR,” or Estimated Ultimate Recovery, refers to Antero’s internal estimates of per well hydrocarbon quantities that may be potentially recovered from a hypothetical future well completed as a producer in the area. These quantities do not necessarily constitute or represent reserves within the meaning of the Society of Petroleum Engineer’s Petroleum Resource Management System or the SEC’s oil and natural gas disclosure rules. Cautionary Note Regarding Hydrocarbon Quantities 2 |
|
|
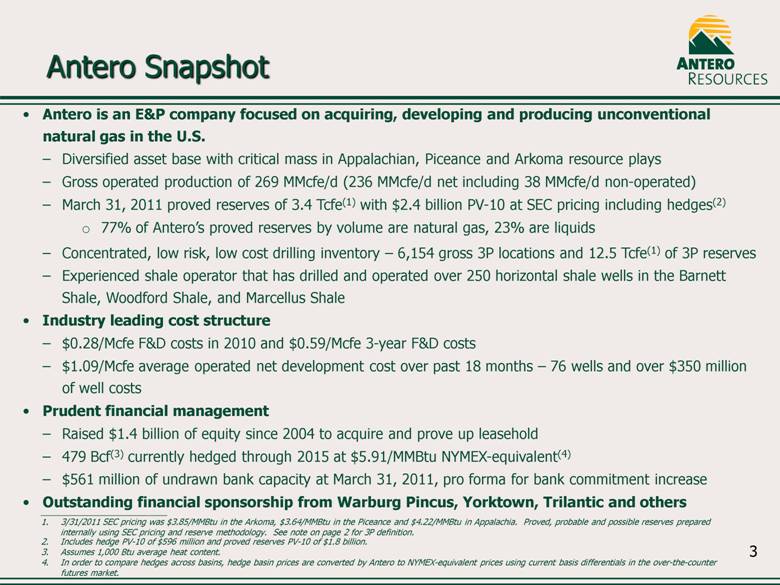
Antero Snapshot Antero is an E&P company focused on acquiring, developing and producing unconventional natural gas in the U.S. Diversified asset base with critical mass in Appalachian, Piceance and Arkoma resource plays Gross operated production of 269 MMcfe/d (236 MMcfe/d net including 38 MMcfe/d non-operated) March 31, 2011 proved reserves of 3.4 Tcfe(1) with $2.4 billion PV-10 at SEC pricing including hedges(2) 77% of Antero’s proved reserves by volume are natural gas, 23% are liquids Concentrated, low risk, low cost drilling inventory – 6,154 gross 3P locations and 12.5 Tcfe(1) of 3P reserves Experienced shale operator that has drilled and operated over 250 horizontal shale wells in the Barnett Shale, Woodford Shale, and Marcellus Shale Industry leading cost structure $0.28/Mcfe F&D costs in 2010 and $0.59/Mcfe 3-year F&D costs $1.09/Mcfe average operated net development cost over past 18 months – 76 wells and over $350 million of well costs Prudent financial management Raised $1.4 billion of equity since 2004 to acquire and prove up leasehold 479 Bcf(3) currently hedged through 2015 at $5.91/MMBtu NYMEX-equivalent(4) $561 million of undrawn bank capacity at March 31, 2011, pro forma for bank commitment increase Outstanding financial sponsorship from Warburg Pincus, Yorktown, Trilantic and others 3/31/2011 SEC pricing was $3.85/MMBtu in the Arkoma, $3.64/MMBtu in the Piceance and $4.22/MMBtu in Appalachia. Proved, probable and possible reserves prepared internally using SEC pricing and reserve methodology. See note on page 2 for 3P definition. Includes hedge PV-10 of $596 million and proved reserves PV-10 of $1.8 billion. Assumes 1,000 Btu average heat content. In order to compare hedges across basins, hedge basin prices are converted by Antero to NYMEX-equivalent prices using current basis differentials in the over-the-counter futures market. 3 |
|
|
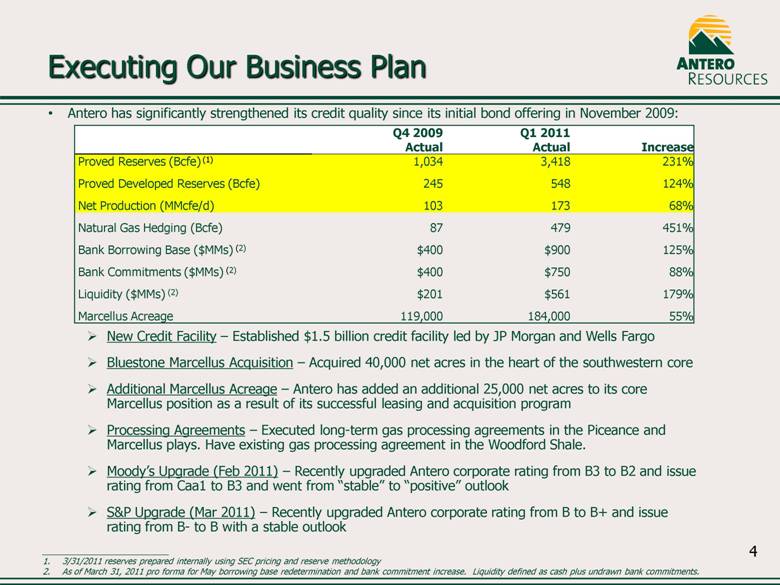
Antero has significantly strengthened its credit quality since its initial bond offering in November 2009: New Credit Facility – Established $1.5 billion credit facility led by JP Morgan and Wells Fargo Bluestone Marcellus Acquisition – Acquired 40,000 net acres in the heart of the southwestern core Additional Marcellus Acreage – Antero has added an additional 25,000 net acres to its core Marcellus position as a result of its successful leasing and acquisition program Processing Agreements – Executed long-term gas processing agreements in the Piceance and Marcellus plays. Have existing gas processing agreement in the Woodford Shale. Moody’s Upgrade (Feb 2011) – Recently upgraded Antero corporate rating from B3 to B2 and issue rating from Caa1 to B3 and went from “stable” to “positive” outlook S&P Upgrade (Mar 2011) – Recently upgraded Antero corporate rating from B to B+ and issue rating from B- to B with a stable outlook Executing Our Business Plan Q4 2009 Actual Q1 2011 Actual Increase Proved Reserves (Bcfe) (1) 1,034 3,418 231% Proved Developed Reserves (Bcfe) 245 548 124% Net Production (MMcfe/d) 103 173 68% Natural Gas Hedging (Bcfe) 87 479 451% Bank Borrowing Base ($MMs) (2) $400 $900 125% Bank Commitments ($MMs) (2) $400 $750 88% Liquidity ($MMs) (2) $201 $561 179% Marcellus Acreage 119,000 184,000 55% 3/31/2011 reserves prepared internally using SEC pricing and reserve methodology As of March 31, 2011 pro forma for May borrowing base redetermination and bank commitment increase. Liquidity defined as cash plus undrawn bank commitments. 4 |
|
|
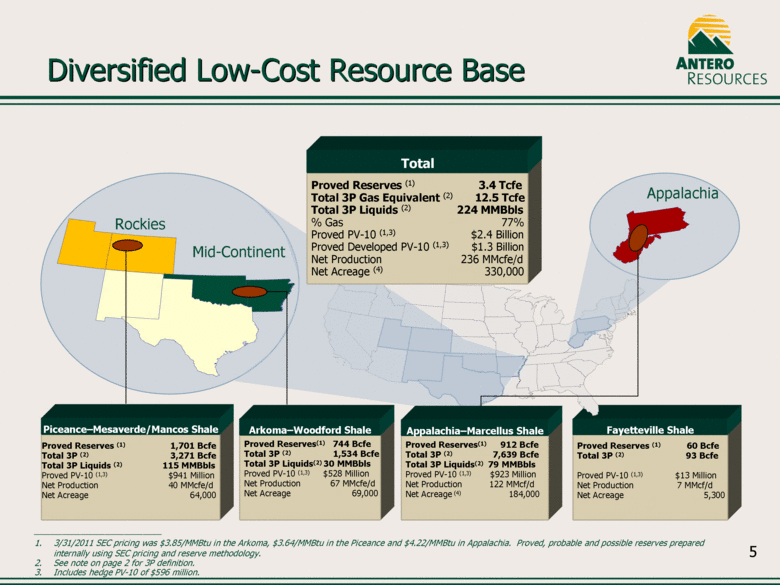
Proved Reserves (1) 60 Bcfe Total 3P (2) 93 Bcfe Proved PV-10 (1,3) $13 Million Net Production 7 MMcf/d Net Acreage 5,300 Fayetteville Shale Proved Reserves (1) 1,701 Bcfe Total 3P (2) 3,271 Bcfe Total 3P Liquids (2) 115 MMBbls Proved PV-10 (1,3) $941 Million Net Production 40 MMcfe/d Net Acreage 64,000 Piceance–Mesaverde/Mancos Shale Proved Reserves(1) 912 Bcfe Total 3P (2) 7,639 Bcfe Total 3P Liquids(2) 79 MMBbls Proved PV-10 (1,3) $923 Million Net Production 122 MMcf/d Net Acreage (4) 184,000 Proved Reserves(1) 744 Bcfe Total 3P (2) 1,534 Bcfe Total 3P Liquids(2) 30 MMBbls Proved PV-10 (1,3) $528 Million Net Production 67 MMcfe/d Net Acreage 69,000 Arkoma–Woodford Shale Appalachia Rockies Mid-Continent Proved Reserves (1) 3.4 Tcfe Total 3P Gas Equivalent (2) 12.5 Tcfe Total 3P Liquids (2) 224 MMBbls % Gas 77% Proved PV-10 (1,3) $2.4 Billion Proved Developed PV-10 (1,3) $1.3 Billion Net Production 236 MMcfe/d Net Acreage (4) 330,000 Total Appalachia–Marcellus Shale Diversified Low-Cost Resource Base 5 3/31/2011 SEC pricing was $3.85/MMBtu in the Arkoma, $3.64/MMBtu in the Piceance and $4.22/MMBtu in Appalachia. Proved, probable and possible reserves prepared internally using SEC pricing and reserve methodology. See note on page 2 for 3P definition. Includes hedge PV-10 of $596 million. |
|
|
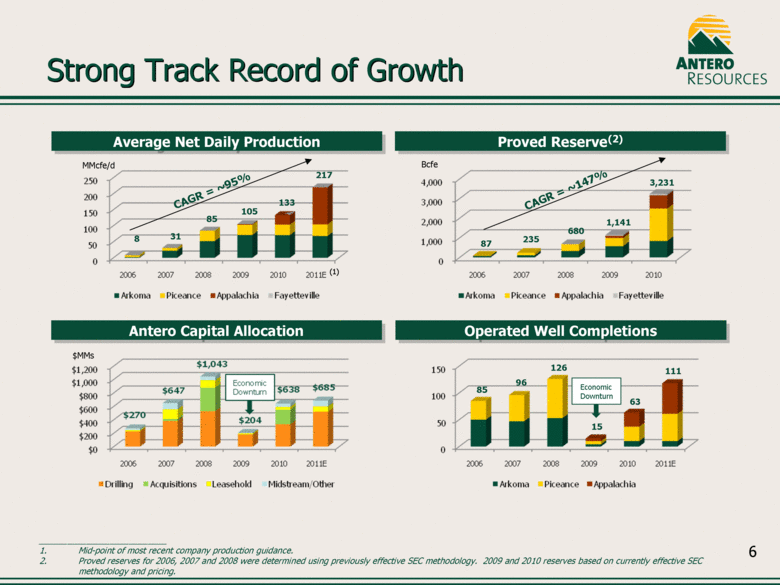
Strong Track Record of Growth Mid-point of most recent company production guidance. Proved reserves for 2006, 2007 and 2008 were determined using previously effective SEC methodology. 2009 and 2010 reserves based on currently effective SEC methodology and pricing. 31 85 8 105 CAGR = ~95% 85 96 126 87 235 680 CAGR = ~147% Antero Capital Allocation Operated Well Completions Average Net Daily Production Proved Reserve(2) 1,141 15 133 3,231 63 MMcfe/d Bcfe 217 111 Economic Downturn 6 $MMs (1) |
|
|
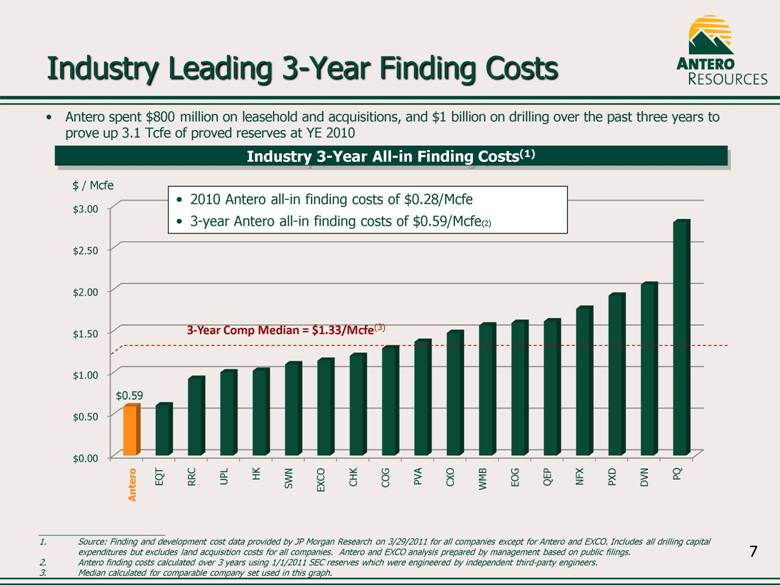
Industry Leading 3-Year Finding Costs Industry 3-Year All-in Finding Costs(1) 3-Year Comp Median = $1.33/Mcfe(3) 2010 Antero all-in finding costs of $0.28/Mcfe 3-year Antero all-in finding costs of $0.59/Mcfe(2) $ / Mcfe Antero spent $800 million on leasehold and acquisitions, and $1 billion on drilling over the past three years to prove up 3.1 Tcfe of proved reserves at YE 2010 Antero Source: Finding and development cost data provided by JP Morgan Research on 3/29/2011 for all companies except for Antero and EXCO. Includes all drilling capital expenditures but excludes land acquisition costs for all companies. Antero and EXCO analysis prepared by management based on public filings. Antero finding costs calculated over 3 years using 1/1/2011 SEC reserves which were engineered by independent third-party engineers. Median calculated for comparable company set used in this graph. 7 |
|
|
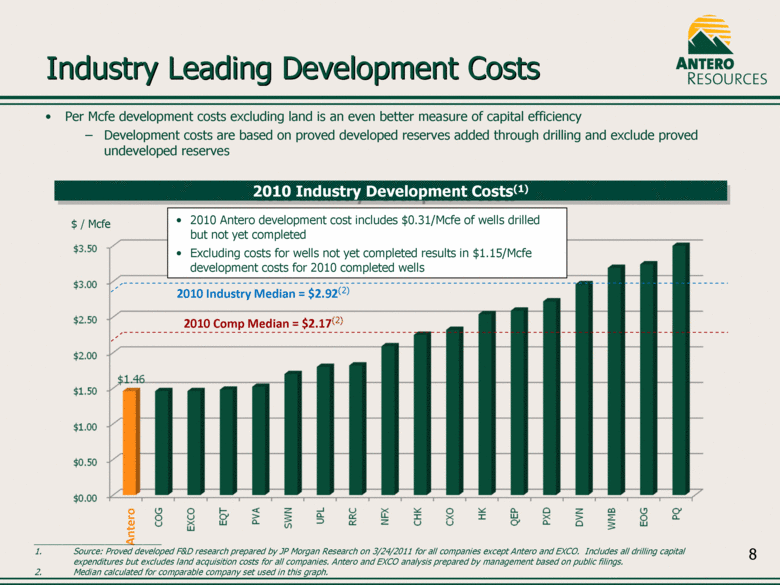
2010 Industry Development Costs(1) Antero 2010 Comp Median = $2.17(2) 2010 Antero development cost includes $0.31/Mcfe of wells drilled but not yet completed Excluding costs for wells not yet completed results in $1.15/Mcfe development costs for 2010 completed wells $ / Mcfe Per Mcfe development costs excluding land is an even better measure of capital efficiency Development costs are based on proved developed reserves added through drilling and exclude proved undeveloped reserves Industry Leading Development Costs 8 Source: Proved developed F&D research prepared by JP Morgan Research on 3/24/2011 for all companies except Antero and EXCO. Includes all drilling capital expenditures but excludes land acquisition costs for all companies. Antero and EXCO analysis prepared by management based on public filings. Median calculated for comparable company set used in this graph. 2010 Industry Median = $2.92(2) |
|
|
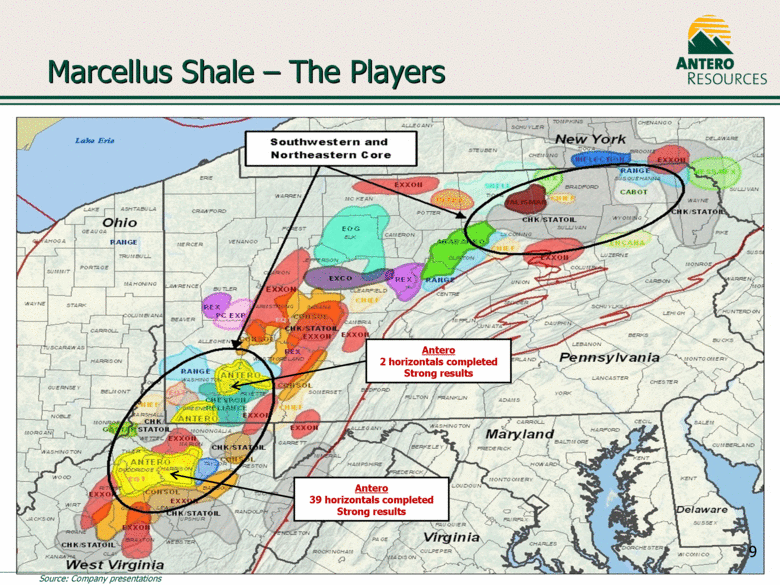
Marcellus Shale – The Players Antero 2 horizontals completed Strong results Antero 39 horizontals completed Strong results 9 Source: Company presentations |
|
|
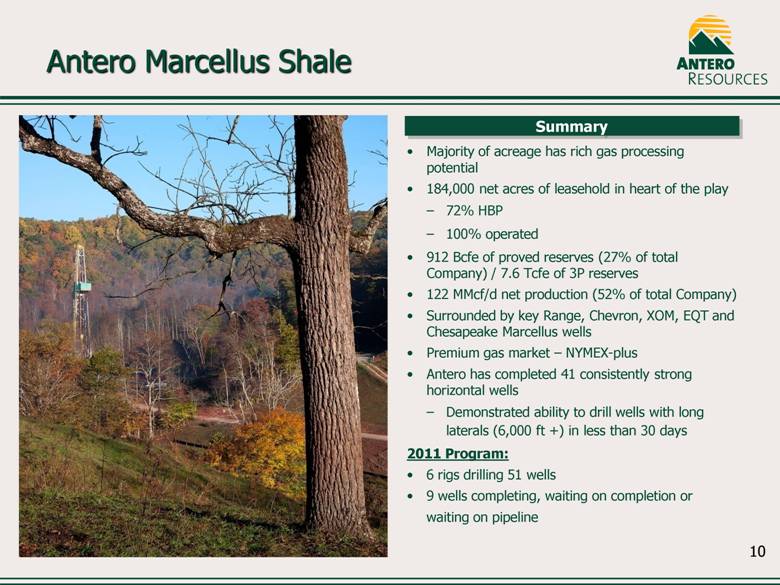
Majority of acreage has rich gas processing potential 184,000 net acres of leasehold in heart of the play 72% HBP 100% operated 912 Bcfe of proved reserves (27% of total Company) / 7.6 Tcfe of 3P reserves 122 MMcf/d net production (52% of total Company) Surrounded by key Range, Chevron, XOM, EQT and Chesapeake Marcellus wells Premium gas market – NYMEX-plus Antero has completed 41 consistently strong horizontal wells Demonstrated ability to drill wells with long laterals (6,000 ft +) in less than 30 days 2011 Program: 6 rigs drilling 51 wells 9 wells completing, waiting on completion or waiting on pipeline Antero Marcellus Shale Summary 10 |
|
|
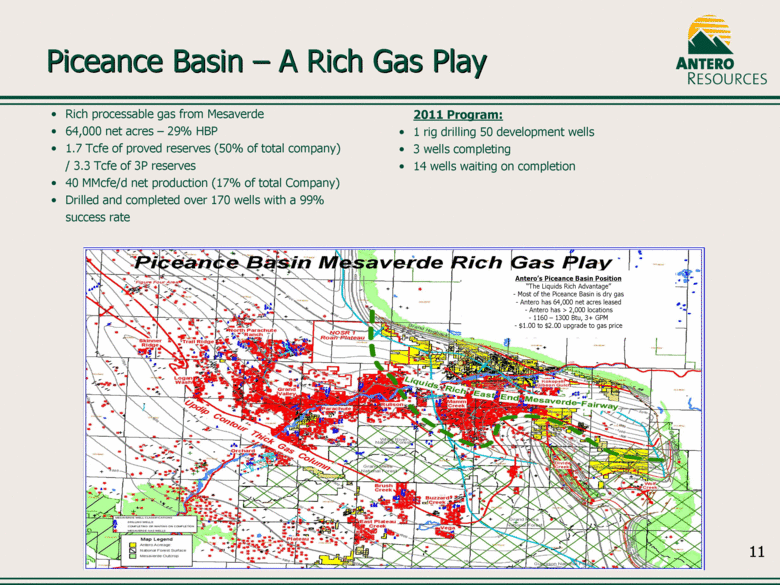
Piceance Basin – A Rich Gas Play Rich processable gas from Mesaverde 64,000 net acres – 29% HBP 1.7 Tcfe of proved reserves (50% of total company) / 3.3 Tcfe of 3P reserves 40 MMcfe/d net production (17% of total Company) Drilled and completed over 170 wells with a 99% success rate 2011 Program: 1 rig drilling 50 development wells 3 wells completing 14 wells waiting on completion 11 Antero’s Piceance Basin Position “The Liquids Rich Advantage” Most of the Piceance Basin is dry gas Antero has 64,000 net acres leased Antero has > 2,000 locations 1160 – 1300 Btu, 3+ GPM $1.00 to $2.00 upgrade to gas price |
|
|
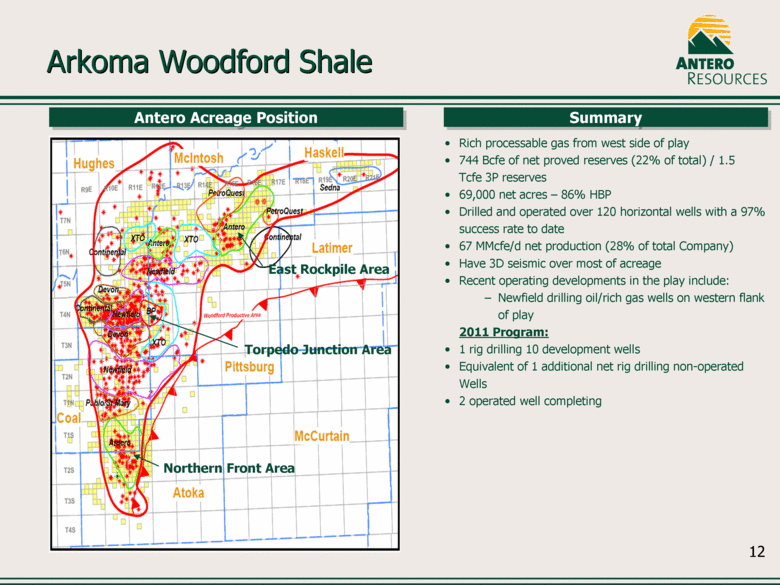
Arkoma Woodford Shale Antero Acreage Position Summary East Rockpile Area Torpedo Junction Area Northern Front Area 12 Rich processable gas from west side of play 744 Bcfe of net proved reserves (22% of total) / 1.5 Tcfe 3P reserves 69,000 net acres – 86% HBP Drilled and operated over 120 horizontal wells with a 97% success rate to date 67 MMcfe/d net production (28% of total Company) Have 3D seismic over most of acreage Recent operating developments in the play include: Newfield drilling oil/rich gas wells on western flank of play 2011 Program: 1 rig drilling 10 development wells Equivalent of 1 additional net rig drilling non-operated Wells 2 operated well completing |
|
|
Conservative Financial Philosophy Assumes 1,000 Btu average heat content. Antero has historically employed a sound and disciplined financial philosophy Antero credit objectives: Target net debt / EBITDAX of 2.0x to 3.0x (3.4x 3/31/2011) Target net debt / proved reserves of $0.25 to $0.75 / Mcfe ($0.21/Mcfe 3/31/2011) Target net debt / proved developed reserves of $1.00 to $1.50 / Mcfe ($1.31/Mcfe 3/31/2011) Invest well within cash flow plus liquidity while balancing capital efficiency and drilling economics Continue our active/opportunistic hedging strategy to protect cash flow and returns, insulating our capital program 479 Bcfe(1) hedged through 2015 at approximately $5.91/MMBtu NYMEX-equivalent Strong counterparties – all collateralized, all but one in bank group Maintain strong bank group Led by JPMorgan with 12 other banks Term out bank debt in bond market over time Antero is comfortable spending beyond its cash flow over the next couple of years due to its strong liquidity, large fixed-price hedge position and de-risked, diversified, low cost reserve base 13 |
|
|
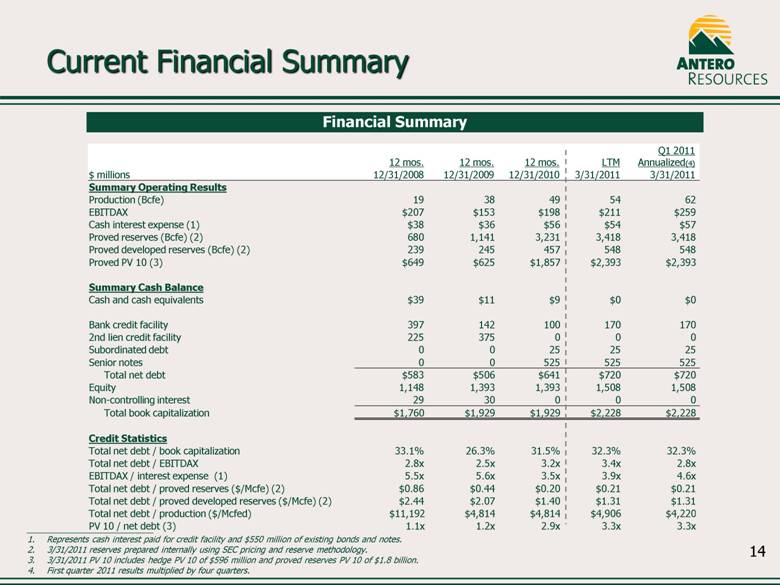
12 mos. 12 mos. 12 mos. LTM Q1 2011 Annualized(4) $ millions 12/31/2008 12/31/2009 12/31/2010 3/31/2011 3/31/2011 Summary Operating Results Production (Bcfe) 19 38 49 54 62 EBITDAX $207 $153 $198 $211 $259 Cash interest expense (1) $38 $36 $56 $54 $57 Proved reserves (Bcfe) (2) 680 1,141 3,231 3,418 3,418 Proved developed reserves (Bcfe) (2) 239 245 457 548 548 Proved PV 10 (3) $649 $625 $1,857 $2,393 $2,393 Summary Cash Balance Cash and cash equivalents $39 $11 $9 $0 $0 Bank credit facility 397 142 100 170 170 2nd lien credit facility 225 375 0 0 0 Subordinated debt 0 0 25 25 25 Senior notes 0 0 525 525 525 Total net debt $583 $506 $641 $720 $720 Equity 1,148 1,393 1,393 1,508 1,508 Non-controlling interest 29 30 0 0 0 Total book capitalization $1,760 $1,929 $1,929 $2,228 $2,228 Credit Statistics Total net debt / book capitalization 33.1% 26.3% 31.5% 32.3% 32.3% Total net debt / EBITDAX 2.8x 2.5x 3.2x 3.4x 2.8x EBITDAX / interest expense (1) 5.5x 5.6x 3.5x 3.9x 4.6x Total net debt / proved reserves ($/Mcfe) (2) $0.86 $0.44 $0.20 $0.21 $0.21 Total net debt / proved developed reserves ($/Mcfe) (2) $2.44 $2.07 $1.40 $1.31 $1.31 Total net debt / production ($/Mcfed) $11,192 $4,814 $4,814 $4,906 $4,220 PV 10 / net debt (3) 1.1x 1.2x 2.9x 3.3x 3.3x Current Financial Summary Financial Summary Represents cash interest paid for credit facility and $550 million of existing bonds and notes. 3/31/2011 reserves prepared internally using SEC pricing and reserve methodology. 3/31/2011 PV 10 includes hedge PV 10 of $596 million and proved reserves PV 10 of $1.8 billion. First quarter 2011 results multiplied by four quarters. 14 |
|
|
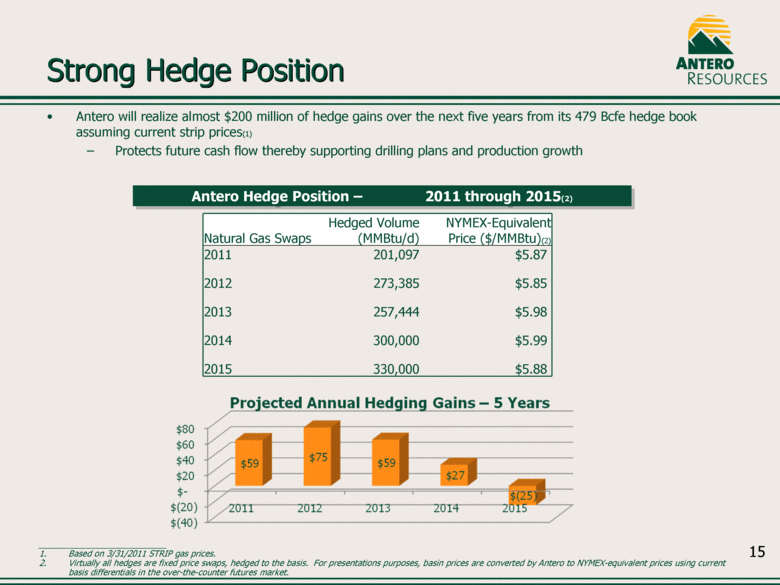
Strong Hedge Position Antero will realize almost $200 million of hedge gains over the next five years from its 479 Bcfe hedge book assuming current strip prices(1) Protects future cash flow thereby supporting drilling plans and production growth Antero Hedge Position – 2011 through 2015(2) Natural Gas Swaps Hedged Volume (MMBtu/d) NYMEX-Equivalent Price ($/MMBtu)(2) 2011 201,097 $5.87 2012 273,385 $5.85 2013 257,444 $5.98 2014 300,000 $5.99 2015 330,000 $5.88 1. Based on 3/31/2011 STRIP gas prices. Virtually all hedges are fixed price swaps, hedged to the basis. For presentations purposes, basin prices are converted by Antero to NYMEX-equivalent prices using current basis differentials in the over-the-counter futures market. 15 |
|
|
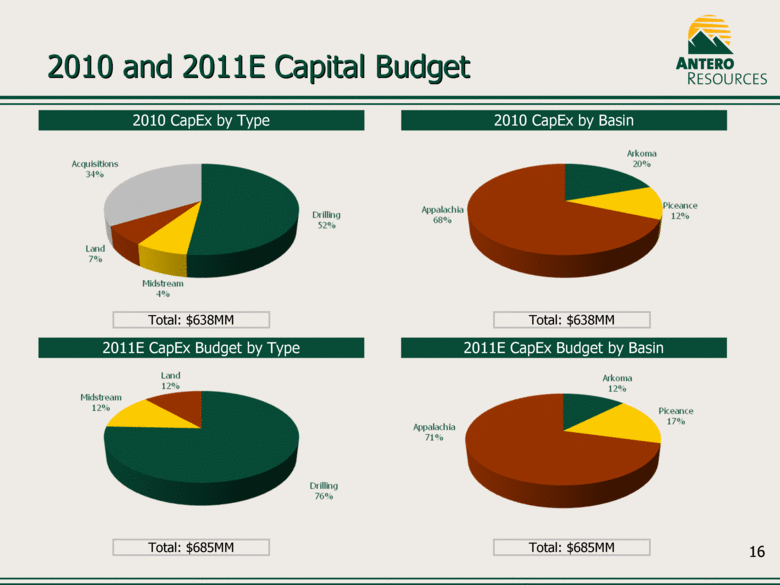
2010 CapEx by Type 2010 CapEx by Basin Total: $638MM Total: $638MM 2011E CapEx Budget by Type 2011E CapEx Budget by Basin Total: $685MM Total: $685MM 2010 and 2011E Capital Budget 16 |
|
|
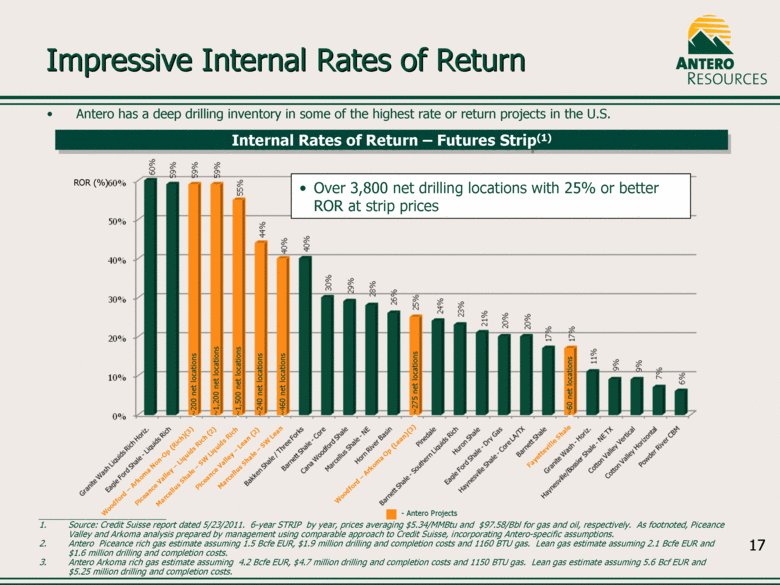
Woodford – Arkoma Op (Lean)(3) Impressive Internal Rates of Return Internal Rates of Return – Futures Strip(1) - Antero Projects Marcellus Shale – SW Liquids Rich Piceance Valley – Liquids Rich (2) Marcellus Shale – SW Lean Fayetteville Shale Piceance Valley – Lean (2) Woodford – Arkoma Non-Op (Rich)(3) Source: Credit Suisse report dated 5/23/2011. 6-year STRIP by year, prices averaging $5.34/MMBtu and $97.58/Bbl for gas and oil, respectively. As footnoted, Piceance Valley and Arkoma analysis prepared by management using comparable approach to Credit Suisse, incorporating Antero-specific assumptions. Antero Piceance rich gas estimate assuming 1.5 Bcfe EUR, $1.9 million drilling and completion costs and 1160 BTU gas. Lean gas estimate assuming 2.1 Bcfe EUR and $1.6 million drilling and completion costs. Antero Arkoma rich gas estimate assuming 4.2 Bcfe EUR, $4.7 million drilling and completion costs and 1150 BTU gas. Lean gas estimate assuming 5.6 Bcf EUR and $5.25 million drilling and completion costs. 17 ROR (%) ~1,500 net locations ~200 net locations ~1,200 net locations ~460 net locations ~240 net locations ~60 net locations ~275 net locations Over 3,800 net drilling locations with 25% or better ROR at strip prices Antero has a deep drilling inventory in some of the highest rate or return projects in the U.S. |
|
|
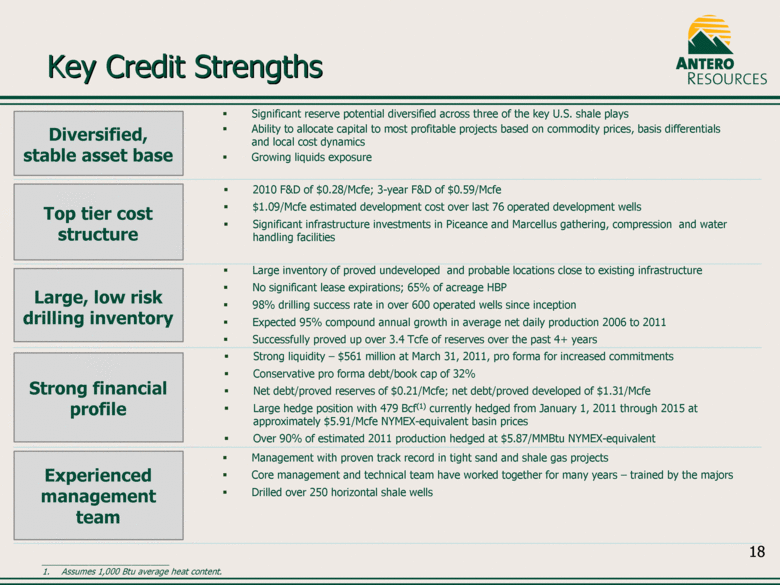
Key Credit Strengths Significant reserve potential diversified across three of the key U.S. shale plays Ability to allocate capital to most profitable projects based on commodity prices, basis differentials and local cost dynamics Growing liquids exposure Diversified, stable asset base Large inventory of proved undeveloped and probable locations close to existing infrastructure No significant lease expirations; 65% of acreage HBP 98% drilling success rate in over 600 operated wells since inception Expected 95% compound annual growth in average net daily production 2006 to 2011 Successfully proved up over 3.4 Tcfe of reserves over the past 4+ years Top tier cost structure Strong liquidity – $561 million at March 31, 2011, pro forma for increased commitments Conservative pro forma debt/book cap of 32% Net debt/proved reserves of $0.21/Mcfe; net debt/proved developed of $1.31/Mcfe Large hedge position with 479 Bcf(1) currently hedged from January 1, 2011 through 2015 at approximately $5.91/Mcfe NYMEX-equivalent basin prices Over 90% of estimated 2011 production hedged at $5.87/MMBtu NYMEX-equivalent Large, low risk drilling inventory Management with proven track record in tight sand and shale gas projects Core management and technical team have worked together for many years – trained by the majors Drilled over 250 horizontal shale wells Experienced management team 2010 F&D of $0.28/Mcfe; 3-year F&D of $0.59/Mcfe $1.09/Mcfe estimated development cost over last 76 operated development wells Significant infrastructure investments in Piceance and Marcellus gathering, compression and water handling facilities Strong financial profile Assumes 1,000 Btu average heat content. 18 |
|
|
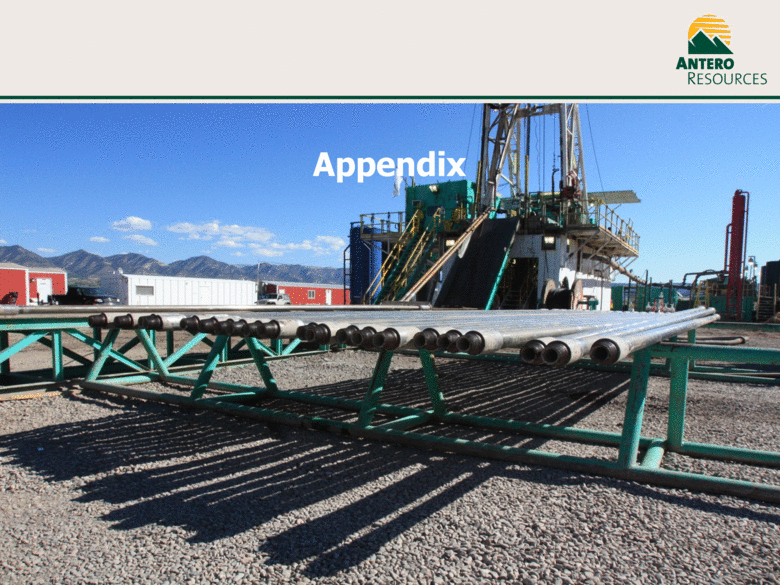
Appendix |
|
|
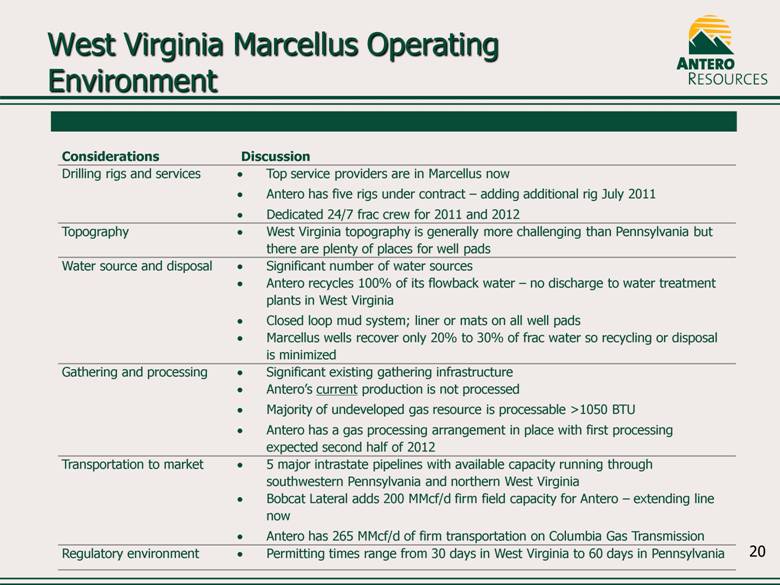
West Virginia Marcellus Operating Environment Considerations Discussion Drilling rigs and services Top service providers are in Marcellus now Antero has five rigs under contract – adding additional rig July 2011 Dedicated 24/7 frac crew for 2011 and 2012 Topography West Virginia topography is generally more challenging than Pennsylvania but there are plenty of places for well pads Water source and disposal Significant number of water sources Antero recycles 100% of its flowback water – no discharge to water treatment plants in West Virginia Closed loop mud system; liner or mats on all well pads Marcellus wells recover only 20% to 30% of frac water so recycling or disposal is minimized Gathering and processing Significant existing gathering infrastructure Antero’s current production is not processed Majority of undeveloped gas resource is processable >1050 BTU Antero has a gas processing arrangement in place with first processing expected second half of 2012 Transportation to market 5 major intrastate pipelines with available capacity running through southwestern Pennsylvania and northern West Virginia Bobcat Lateral adds 200 MMcf/d firm field capacity for Antero – extending line now Antero has 265 MMcf/d of firm transportation on Columbia Gas Transmission Regulatory environment Permitting times range from 30 days in West Virginia to 60 days in Pennsylvania 20 |
|
|
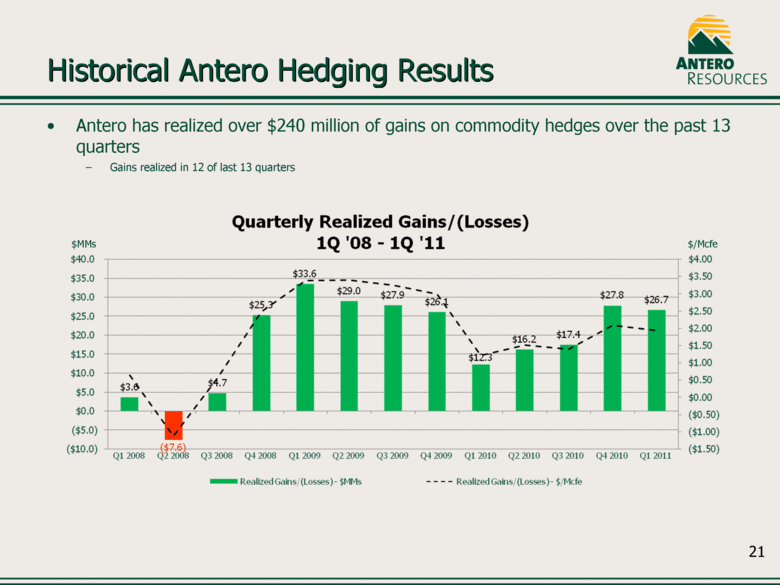
Antero has realized over $240 million of gains on commodity hedges over the past 13 quarters Gains realized in 12 of last 13 quarters $MMs $/Mcfe Historical Antero Hedging Results 21 |
|
|
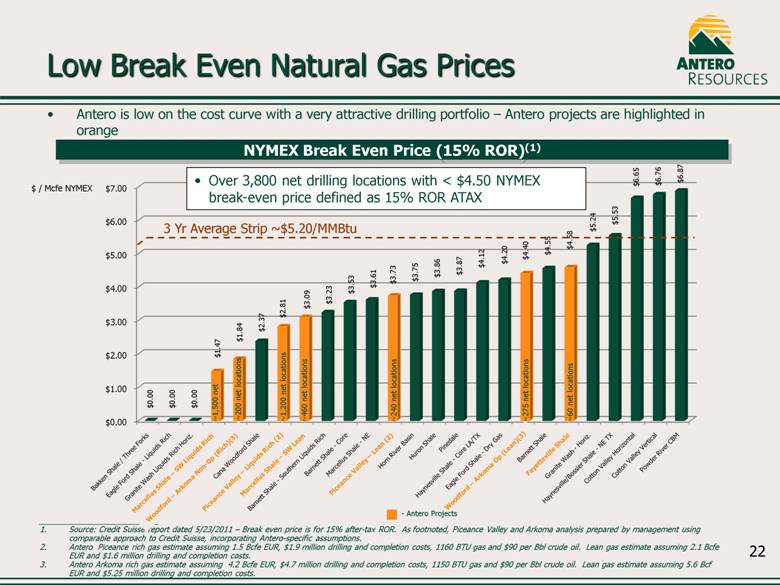
Source: Credit Suisse report dated 5/23/2011 – Break even price is for 15% after-tax ROR. As footnoted, Piceance Valley and Arkoma analysis prepared by management using comparable approach to Credit Suisse, incorporating Antero-specific assumptions. Antero Piceance rich gas estimate assuming 1.5 Bcfe EUR, $1.9 million drilling and completion costs, 1160 BTU gas and $90 per Bbl crude oil. Lean gas estimate assuming 2.1 Bcfe EUR and $1.6 million drilling and completion costs. Antero Arkoma rich gas estimate assuming 4.2 Bcfe EUR, $4.7 million drilling and completion costs, 1150 BTU gas and $90 per Bbl crude oil. Lean gas estimate assuming 5.6 Bcf EUR and $5.25 million drilling and completion costs. Woodford – Arkoma Op (Lean)(3) Low Break Even Natural Gas Prices Antero is low on the cost curve with a very attractive drilling portfolio – Antero projects are highlighted in orange NYMEX Break Even Price (15% ROR)(1) - Antero Projects 3 Yr Average Strip ~$5.20/MMBtu Marcellus Shale – SW Liquids Rich Piceance Valley – Liquids Rich (2) Marcellus Shale – SW Lean Fayetteville Shale ~1,500 net ~460 net locations ~1,200 net locations ~275 net locations ~60 net locations Piceance Valley – Lean (2) Woodford – Arkoma Non-Op (Rich)(3) ~240 net locations ~200 net locations Over 3,800 net drilling locations with < $4.50 NYMEX break-even price defined as 15% ROR ATAX 22 $ / Mcfe NYMEX |