Attached files
| file | filename |
|---|---|
| 8-K - 8-K - Antero Resources LLC | a12-8000_278k.htm |
Exhibit 99.1
|
|
December 2011 Wells Fargo Securities Energy Conference |
|
|
This presentation contains forward-looking statements within the meaning of Section 27A of the Securities Act of 1933 and Section 21E of the Securities Exchange Act of 1934. All statements, other than statements of historical facts, included in this presentation that address activities, events or developments that Antero Resources LLC and its subsidiaries (collectively, the “Company”) expects, believes or anticipates will or may occur in the future are forward-looking statements. The words “believe,” “expect,” “anticipate,” “plan,” “intend,” “foresee,” “should,” “would,” “could,” or other similar expressions are intended to identify forward-looking statements, which are generally not historical in nature. However, the absence of these words does not mean that the statements are not forward-looking. Without limiting the generality of the foregoing, forward-looking statements contained in this presentation specifically include estimates of the Company’s reserves, expectations of plans, strategies, objectives and anticipated financial and operating results of the Company, including as to the Company’s drilling program, production, hedging activities, capital expenditure levels and other guidance included in this presentation. These statements are based on certain assumptions made by the Company based on management’s experience and perception of historical trends, current conditions, anticipated future developments and other factors believed to be appropriate. Such statements are subject to a number of assumptions, risks and uncertainties, many of which are beyond the control of the Company, which may cause actual results to differ materially from those implied or expressed by the forward-looking statements. These include the factors discussed or referenced in the Company’s filings with the SEC. Any forward-looking statement speaks only as of the date on which such statement is made and the Company undertakes no obligation to correct or update any forward-looking statement, whether as a result of new information, future events or otherwise, except as required by applicable law. Forward Looking Statements 1 |
|
|
The U.S. Securities and Exchange Commission (SEC) permits oil and gas companies, in their filings with the SEC, to disclose only proved, probable and possible reserve estimates (3P). Antero has provided internally generated estimates for proved, probable and possible reserves in this presentation in accordance with SEC guidelines and definitions. The estimates of proved reserves included in this presentation have been audited by Antero’s third-party engineers. Antero’s estimate of probable and possible reserves was prepared by Antero’s internal reserve engineers, has not been reviewed by third-party engineers, and is provided in this presentation because management believes it is useful information that is widely used by the investment community in the valuation, comparison and analysis of companies. Antero does not plan to include probable and possible reserve estimates in its filings with the SEC. We use certain other terms in this presentation relating to estimates of hydrocarbon volumes that the SEC’s guidelines prohibit us from including in filings with the SEC. These estimates are by their nature more speculative than estimates of proved, possible or probable reserves as defined by SEC regulations and accordingly are substantially less certain and no discount or other adjustment is included in the presentation of such numbers. Actual quantities that may be ultimately recovered from Antero’s interests may differ substantially from the estimates in this presentation. Factors affecting ultimate recovery include the scope of our ongoing drilling program, which will be directly affected by commodity prices, the availability of capital, drilling and production costs, availability of drilling services and equipment, drilling results, lease expirations, transportation constraints, regulatory approvals and other factors; and actual drilling results, including geological and mechanical factors affecting recovery rates. In this presentation: “3P reserves” refer to Antero’s estimated aggregate proved, probable and possible reserves as of June 30, 2011. The SEC prohibits companies from aggregating proved, probable and possible reserves in filings with the SEC due to the different levels of certainty associated with each reserve category. “Unrisked Resource” refers to Antero’s internal estimates of hydrocarbon quantities that Antero’s management believes may be potentially discovered through exploratory drilling or recovered with additional drilling. Unrisked resource may not constitute reserves within the meaning of the Society of Petroleum Engineer’s Petroleum Resource Management System or the SEC’s oil and natural gas disclosure rules. Actual quantities that may be ultimately recovered from Antero’s interests will differ substantially. Factors affecting ultimate recovery include the scope of our ongoing drilling program, which will be directly affected by commodity prices, the availability of capital, drilling and production costs, availability of drilling services and equipment, drilling results, lease expirations, transportation constraints, regulatory approvals and other factors; and actual drilling results, including geological and mechanical factors affecting recovery rates. Estimates of unrisked resource may change significantly as development of Antero's resource plays provides additional data. “EUR,” or Estimated Ultimate Recovery, refers to Antero’s internal estimates of per well hydrocarbon quantities that may be potentially recovered from a hypothetical future well completed as a producer in the area. These quantities do not necessarily constitute or represent reserves within the meaning of the Society of Petroleum Engineer’s Petroleum Resource Management System or the SEC’s oil and natural gas disclosure rules. Cautionary Note Regarding Hydrocarbon Quantities 2 |
|
|
Antero Resources Snapshot ___________________________ Assumes 1000 Btu average heat content. In order to compare hedges across basins, hedged basin prices are converted by Antero to NYMEX-equivalent prices using current basis differentials in the over-the-counter futures market. Estimates per 6/30/2011 mid-year audited SEC reserves using a 6/30/2011 NYMEX STRIP price deck of $4.35/MMBtu, $4.67/MMBtu, $5.02/MMBtu, $5.30/MMBtu, $5.60/MMBtu for 2011, 2012, 2013, 2014, and 2015/thereafter, respectively. WTI STRIP price averaged $98.73/Bbl. Oil and NGLs converted to Mcfe on 6:1 ratio. Pro forma for 66 Bcfe of net proved and 500 Bcfe net 3P reserves acquired from Consol on September 26, 2011. Borrowing base increased to $1.2 billion with $850 million of bank commitments as of October 27, 2011 pro forma for 9/30/2011 balance sheet. Private E&P company headquartered in Denver, focused on unconventional resource plays Private equity backed by Warburg Pincus, Yorktown, Trilantic and five other institutions Drilled and operated 300 horizontal shale wells in Barnett, Woodford and Marcellus Shales Diversified asset base – Marcellus Shale, Upper Devonian Shale, Piceance Mesaverde, Mancos/Niobrara Shale, Woodford Shale, Fayetteville Shale 70% of net 3P reserves are in Marcellus and 70% of capital budget is focused on Marcellus Almost 60% of Antero’s current net production is from Marcellus High production growth – 110% year-over-year to 317 MMcfe/d net today Low cost leader – $0.59/Mcfe 3-year all-in F&D costs and $1.05/Mcfe average operated net development cost over past two years Rapidly growing liquids exposure – 6% by production volume today estimated to grow to over 35% by 2014 Large long-term hedge position – 610 Bcfe(1) hedged at $5.73/MMBtu NYMEX-equivalent(2) through 2016 18 Tcfe(3) net 3P reserves at strip pricing – will feed high growth in proved and proved developed reserves 730 Bcfe net proved developed and 4.2 Tcfe net proved at June 30, 2011(3) Strong liquidity to fuel low cost growth – Over $900 million(4) of undrawn borrowing base capacity Solid, 14-bank group co-led by JP Morgan and Wells Fargo Ready access to high yield bond market (2 issues with 2017 and 2019 maturities, rated B3/B) 3 |
|
|
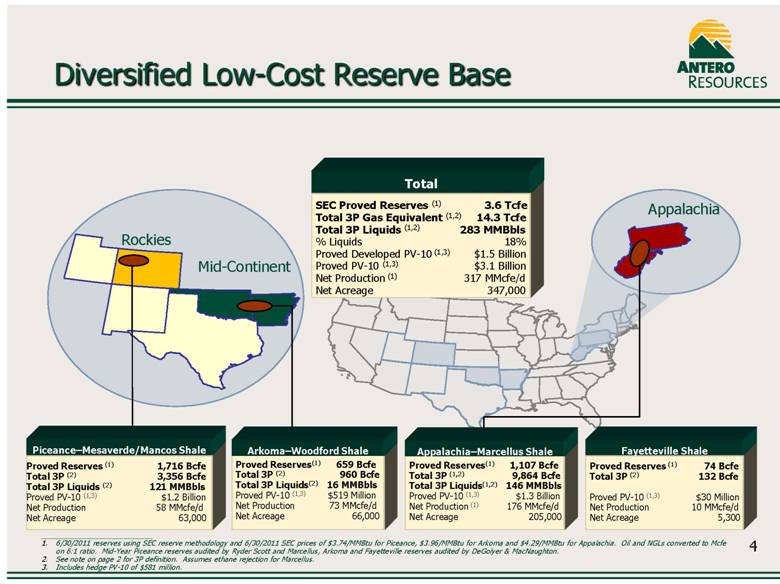
Proved Reserves (1) 74 Bcfe Total 3P (2) 132 Bcfe Proved PV-10 (1,3) $30 Million Net Production 10 MMcfe/d Net Acreage 5,300 Fayetteville Shale Proved Reserves (1) 1,716 Bcfe Total 3P (2) 3,356 Bcfe Total 3P Liquids (2) 121 MMBbls Proved PV-10 (1,3) $1.2 Billion Net Production 58 MMcfe/d Net Acreage 63,000 Piceance–Mesaverde/Mancos Shale Proved Reserves(1) 1,107 Bcfe Total 3P (1,2) 9,864 Bcfe Total 3P Liquids(1,2) 146 MMBbls Proved PV-10 (1,3) $1.3 Billion Net Production (1) 176 MMcfe/d Net Acreage 205,000 Proved Reserves(1) 659 Bcfe Total 3P (2) 960 Bcfe Total 3P Liquids(2) 16 MMBbls Proved PV-10 (1,3) $519 Million Net Production 73 MMcfe/d Net Acreage 66,000 Arkoma–Woodford Shale Appalachia Rockies Mid-Continent SEC Proved Reserves (1) 3.6 Tcfe Total 3P Gas Equivalent (1,2) 14.3 Tcfe Total 3P Liquids (1,2) 283 MMBbls % Liquids 18% Proved Developed PV-10 (1,3) $1.5 Billion Proved PV-10 (1,3) $3.1 Billion Net Production (1) 317 MMcfe/d Net Acreage 347,000 Total 6/30/2011 reserves using SEC reserve methodology and 6/30/2011 SEC prices of $3.74/MMBtu for Piceance, $3.96/MMBtu for Arkoma and $4.29/MMBtu for Appalachia. Oil and NGLs converted to Mcfe on 6:1 ratio. Mid-Year Piceance reserves audited by Ryder Scott and Marcellus, Arkoma and Fayetteville reserves audited by DeGolyer & MacNaughton. See note on page 2 for 3P definition. Assumes ethane rejection for Marcellus. Includes hedge PV-10 of $581 million. Appalachia–Marcellus Shale Diversified Low-Cost Reserve Base 4 |
|
|
Strong Track Record of Growth Proved reserves for 2006, 2007 and 2008 were determined using previously effective SEC methodology. 2009, 2010 and MY2011 reserves based on currently effective SEC methodology and pricing. Preliminary guidance. Capital budget for 2012 not yet board approved – only drilling and completion costs shown. Average Net Daily Production Net Proved SEC Reserves (1) Antero Capital Allocation Operated Well Completions CAGR= ~96% CAGR= ~94% Economic Downturn 8 31 85 105 133 245 87 235 680 1,141 3,231 3,557 $270 $647 $1,043 $204 $627 $881 85 96 126 15 63 100 5 Economic Downturn $863 158 425 0 200 400 600 800 1,000 1,200 2006 2007 2008 2009 2010 2011E 2012E(2) $MMs Acquisitions Leasehold Drilling Midstream/Other 0 50 100 150 200 2006 2007 2008 2009 2010 2011E 2012E(2) 5 26 45 94 Gross Wells Arkoma Piceance Appalachia 0 100 200 300 400 500 2006 2007 2008 2009 2010 2011E 2012E(2) MMcfe/d Arkoma Piceance Appalachia 0 1,000 2,000 3,000 4,000 2006 2007 2008 2009 2010 6/30/2011 Bcfe Arkoma Piceance Appalachia Fayetteville |
|
|
Industry Leading 3-Year Finding Costs Industry 3-Year All-in Finding Costs(1) 3-Year Comp Median = $1.33/Mcfe(3) 2010 Antero all-in finding costs of $0.28/Mcfe 3-year Antero all-in finding costs of $0.59/Mcfe(2) $ / Mcfe Antero Source: Finding and development cost data provided by JP Morgan Research on 3/29/2011 for all companies except for Antero and EXCO. Includes all drilling capital expenditures and includes land and acquisition costs for all companies. Antero and EXCO analysis prepared by management based on public filings. Antero finding costs calculated over 3 years using 1/1/2011 SEC reserves which were engineered by independent third-party engineers. Median calculated for comparable company set used in this graph. Includes land and acquisition costs - Marcellus comparables 6 |
|
|
2010 Industry Development Costs(1) Antero – 1H 2011 2010 Comp Median = $2.17(2) 2010 Antero development cost includes $0.31/Mcfe of wells drilled but not yet completed Excluding costs for wells not yet completed results in $1.15/Mcfe development costs for 2010 completed wells $ / Mcfe Per Mcfe development costs excluding land is an even better measure of capital efficiency Industry Leading Development Costs 2010 Industry Median = $2.92 Source: PD F&D and RODD research prepared by JP Morgan Research on 3/24/2011. Includes all drilling but excludes land and acquisition costs for all companies. Antero and EXCO analysis prepared by management based on public filings. Defined as drilling capital expenditures for the period divided by PDP volumes added after adding back production for the period. Median calculated for comparable company set used in this graph. Antero - Marcellus comparables 7 |
|
|
Marcellus Shale Position Antero 2 horizontals completed Strong results Antero 58 horizontals completed Strong results 8 Southwestern and Northeastern Cores Rich Gas Window in Southwestern Core Representation of key acreage positions from Company presentations. |
|
|
205,000 net acres of leasehold in heart of the play 63% HBP, 20% 2016+ expiration 100% operated Majority of gas is processable 1.1 Tcfe of proved reserves / 9.9 Tcfe of 3P reserves(1) 176 MMcf/d net production (55% of total Company) Surrounded by key Range, Chevron, Exxon, EQT and Chesapeake Marcellus wells Premium gas market Antero has completed 60 consistently strong horizontal wells Demonstrated ability to drill wells with long laterals (6,300 ft average) in less than 30 days Plan to drill up to 4 Upper Devonian horizontal wells over the next 6 months Fully integrated 200 MMcf/d processing plant estimated to be online August 2012 – fully dedicated to Antero 625,000 MMBtu/d of long-haul firm transportation or firm sales secured Committed to ethane takeaway capacity Antero Marcellus Shale Overview Summary 9 Estimates per 6/30/2011 mid-year audited SEC reserves. 2P and 3P reserves use same assumptions but are unaudited. |
|
|
Strong Marcellus Growth Antero has rapidly grown its Marcellus production over the past two years while building out midstream infrastructure Antero Gross Operated Marcellus Production 10 |
|
|
Antero Marcellus Type Curve 24-hour peak 30-day avg. rate 60-day avg. rate 90-day avg. rate 180-day avg. rate 365-day avg. rate 545-day avg. rate MMcfd 13.1 7.0 6.2 5.6 4.4 3.4 3.0 # of wells 60 55 53 51 37 20 10 Antero Type Curve Antero has up to two years of production history to support its Marcellus type curve as demonstrated by the graph and table below All wells normalized to time zero and averaged. 11 (1) 0 1 2 3 4 5 6 7 8 0 1 2 3 4 5 6 7 8 0 1 2 3 4 5 6 7 8 9 10 Cumulative Bcf MMcfd Production Year Daily Rate (30-day average) Normalized Actual Production (30-day average) Cumulative Production Average EUR: 9.1 Bcf Average Lateral: 6,294' |
|
|
Piceance Basin – A Rich Gas Play Rich processable gas from Mesaverde 63,000 net acres – 40% HBP, 17% 2016+ expiration 1.7 Tcfe of proved reserves / 3.4 Tcfe of 3P reserves (1) 58 MMcfe/d net production including 3,000 Bbls/d of NGLs and oil (23% of total Company) Drilled and completed over 200 wells with a 99% success rate 2011 Program: 1 rig drilling 45 development wells 3 wells completing 10 wells waiting on completion Deep Mancos/Niobrara Shale Potential: Encana drilling successful horizontal wells Highly over-pressured zone in Mamm Creek/Gravel Trend Antero has 7 vertical Mancos completions Antero plans horizontal well in 2012 12 Antero’s Piceance Basin Position “The Liquids Rich Advantage” Most of the Piceance Basin is dry gas Antero has 63,000 net acres leased Antero has > 2,000 locations 1100 – 1200 Btu, 3+ GPM $1.00 to $2.00 upgrade to gas price Estimates per 6/30/2011 mid-year audited SEC reserves. 2P and 3P reserves use same assumptions but are unaudited. |
|
|
Arkoma Woodford Shale Antero Acreage Position Summary East Rockpile Area Torpedo Junction Area Northern Front Area 13 Rich processable gas from west side of play 659 Bcfe of net proved reserves / 1.0 Tcfe 3P reserves (1) 66,000 net acres – 86% HBP Drilled and operated over 130 horizontal wells with a 97% success rate to date 73 MMcfe/d net production including non-operated production and 500 Bbls/d of NGLs (23% of total Company) Have 3D seismic over most of acreage Recent operating developments in the play include: Newfield drilling oil/rich gas wells on western flank of play 2011 Program: 1 rig drilling 10 development wells Equivalent of 1 additional net rig drilling non-operated Wells 2 operated rich gas wells waiting on completion Estimates per 6/30/2011 mid-year audited SEC reserves. 2P and 3P reserves use same assumptions but are unaudited. |
|
|
2011E Capex Budget by Type 2011E Capex Budget by Basin Total: $881MM Total: $881MM 2011E Capital Budget |
|
|
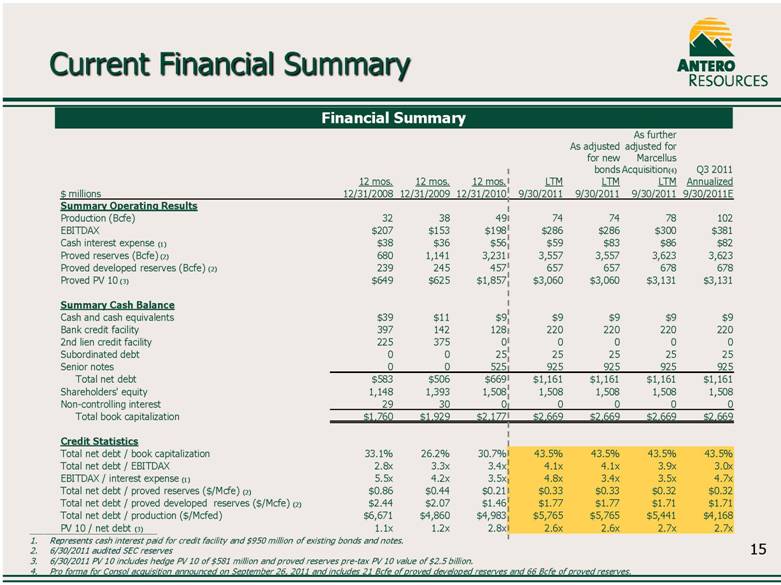
As adjusted for new bonds As further adjusted for Marcellus Acquisition(4) Q3 2011 12 mos. 12 mos. 12 mos. LTM LTM LTM Annualized $ millions 12/31/2008 12/31/2009 12/31/2010 9/30/2011 9/30/2011 9/30/2011 9/30/2011E Summary Operating Results Production (Bcfe) 32 38 49 74 74 78 102 EBITDAX $207 $153 $198 $286 $286 $300 $381 Cash interest expense (1) $38 $36 $56 $59 $83 $86 $82 Proved reserves (Bcfe) (2) 680 1,141 3,231 3,557 3,557 3,623 3,623 Proved developed reserves (Bcfe) (2) 239 245 457 657 657 678 678 Proved PV 10 (3) $649 $625 $1,857 $3,060 $3,060 $3,131 $3,131 Summary Cash Balance Cash and cash equivalents $39 $11 $9 $9 $9 $9 $9 Bank credit facility 397 142 128 220 220 220 220 2nd lien credit facility 225 375 0 0 0 0 0 Subordinated debt 0 0 25 25 25 25 25 Senior notes 0 0 525 925 925 925 925 Total net debt $583 $506 $669 $1,161 $1,161 $1,161 $1,161 Shareholders' equity 1,148 1,393 1,508 1,508 1,508 1,508 1,508 Non-controlling interest 29 30 0 0 0 0 0 Total book capitalization $1,760 $1,929 $2,177 $2,669 $2,669 $2,669 $2,669 Credit Statistics Total net debt / book capitalization 33.1% 26.2% 30.7% 43.5% 43.5% 43.5% 43.5% Total net debt / EBITDAX 2.8x 3.3x 3.4x 4.1x 4.1x 3.9x 3.0x EBITDAX / interest expense (1) 5.5x 4.2x 3.5x 4.8x 3.4x 3.5x 4.7x Total net debt / proved reserves ($/Mcfe) (2) $0.86 $0.44 $0.21 $0.33 $0.33 $0.32 $0.32 Total net debt / proved developed reserves ($/Mcfe) (2) $2.44 $2.07 $1.46 $1.77 $1.77 $1.71 $1.71 Total net debt / production ($/Mcfed) $6,671 $4,860 $4,983 $5,765 $5,765 $5,441 $4,168 PV 10 / net debt (3) 1.1x 1.2x 2.8x 2.6x 2.6x 2.7x 2.7x Current Financial Summary Financial Summary Represents cash interest paid for credit facility and $950 million of existing bonds and notes. 6/30/2011 audited SEC reserves 6/30/2011 PV 10 includes hedge PV 10 of $581 million and proved reserves pre-tax PV 10 value of $2.5 billion. Pro forma for Consol acquisition announced on September 26, 2011 and includes 21 Bcfe of proved developed reserves and 66 Bcfe of proved reserves. 15 |
|
|
Antero will realize over $500 million of hedge gains over the next five years from its 610 Bcfe hedge book assuming current strip prices(1) Protects future cash flow which supports drilling plans and production growth Antero Hedge Position – 2012 through 2016(2) Natural Gas Swaps Hedged Volume (MMBtu/d) NYMEX-Equivalent Price ($/MMBtu)(2) 2012 280,537 $5.78 2013 357,020 $5.48 2014 360,000 $5.78 2015 360,000 $5.87 2016 312,500 $5.74 1. Based on December 1, 2011 STRIP gas prices. Virtually all hedges are fixed price swaps, hedged to the basis. Basin prices are converted by Antero to NYMEX-equivalent prices using current basis differentials in the over-the-counter futures market. 16 Strong Hedge Position |
|
|
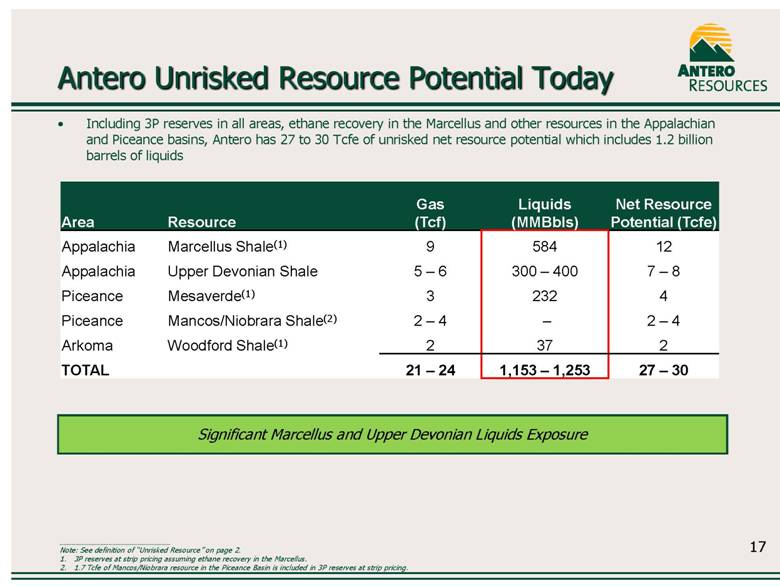
Antero Unrisked Resource Potential Today Area Resource Gas (Tcf) Liquids (MMBbls) Net Resource Potential (Tcfe) Appalachia Marcellus Shale(1) 9 584 12 Appalachia Upper Devonian Shale 5 – 6 300 – 400 7 – 8 Piceance Mesaverde(1) 3 232 4 Piceance Mancos/Niobrara Shale(2) 2 – 4 – 2 – 4 Arkoma Woodford Shale(1) 2 37 2 TOTAL 21 – 24 1,153 – 1,253 27 – 30 Significant Marcellus and Upper Devonian Liquids Exposure 17 Including 3P reserves in all areas, ethane recovery in the Marcellus and other resources in the Appalachian and Piceance basins, Antero has 27 to 30 Tcfe of unrisked net resource potential which includes 1.2 billion barrels of liquids Note: See definition of “Unrisked Resource” on page 2. 3P reserves at strip pricing assuming ethane recovery in the Marcellus. 1.7 Tcfe of Mancos/Niobrara resource in the Piceance Basin is included in 3P reserves at strip pricing. |
|
|
Key Credit Strengths Significant reserve potential diversified across three of the key U.S. shale plays Ability to allocate capital to most profitable projects based on commodity prices, basis differentials and local cost dynamics Growing liquids exposure Diversified, stable asset base Large inventory of proved undeveloped and probable locations close to existing infrastructure No significant lease expirations; 63% of acreage HBP 98% drilling success rate in over 600 operated wells since inception 98% compound annual growth in average net daily production 2006 to 2011 Successfully proved up over 3.6 Tcfe of reserves over the past 4+ years Top tier cost structure Strong liquidity – $961 million(1) at September 30, 2011, pro forma for recent borrowing base increase Conservative pro forma debt/book cap of 44% Net debt/proved reserves of $0.33/Mcfe; net debt/proved developed of $1.77/Mcfe Large hedge position with 610 Bcf(2) currently hedged from January 1, 2012 through 2016 at approximately $5.73/Mcfe NYMEX-equivalent basin prices Over 60% of estimated 2012 production hedged at $5.78/MMBtu NYMEX-equivalent Large, low risk drilling inventory Management with proven track record in tight sand and shale gas projects Core management and technical team have worked together for many years – trained by the majors Drilled and operated 300 horizontal shale wells Experienced management team 2010 F&D of $0.28/Mcfe; 3-year F&D of $0.59/Mcfe $1.05/Mcfe estimated development cost over last 125 operated development wells Significant infrastructure investments in Piceance and Marcellus gathering, compression and water handling facilities Strong financial profile Borrowing base increased to $1.2 billion with $850 million of bank commitments as of October 27, 2011 pro forma for 9/30/2011 balance sheet. Assumes 1,000 Btu average heat content. 18 |