Attached files
| file | filename |
|---|---|
| 8-K - 8-K - MFA FINANCIAL, INC. | a12-9370_18k.htm |
Exhibit 99.1
|
|
April 2012 |

|
|
2 When used in this presentation or other written or oral communications, statements that are not historical in nature, including those containing words such as “will,” “believe,” “expect,” “anticipate,” “estimate,” “plan,” “continue,” “intend,” “should,” “could,” “would,” “may” or similar expressions, are intended to identify “forward-looking statements” for purposes of Section 27A of the Securities Act of 1933, as amended, and Section 21E of the Securities Exchange Act of 1934, as amended, and, as such, may involve known and unknown risks, uncertainties and assumptions. These forward-looking statements include information about possible or assumed future results with respect to our business, financial condition, liquidity, results of operations, plans and objectives. Statements regarding the following subjects, among others, may be forward-looking: changes in interest rates and the market value of MFA’s MBS; changes in the prepayment rates on the mortgage loans securing MFA’s MBS; MFA’s ability to borrow to finance its assets; implementation of or changes in government regulations or programs affecting MFA’s business; MFA’s ability to maintain its qualification as a REIT for federal income tax purposes; MFA’s ability to maintain its exemption from registration under the Investment Company Act of 1940, including statements regarding the Concept Release issued by the Securities and Exchange Commission relating to interpretive issues under the 1940 Act with respect to the status under the 1940 Act of companies that are engaged in the business of acquiring mortgages and mortgage-related interests; and risks associated with investing in real estate assets, including changes in business conditions and the general economy. These and other risks, uncertainties and factors, including those described in the annual, quarterly and/or current reports that MFA files with the SEC, could cause MFA’s actual results to differ materially from those projected in any forward-looking statements that it makes. These forward-looking statements are based on beliefs, assumptions and expectations of MFA’s future performance, taking into account all information currently available. Readers are cautioned not to place undue reliance on these forward-looking statements, which speak only as of the date on which they are made. New risks and uncertainties arise over time and it is not possible to predict those events or how they may affect MFA. Except as required by law, MFA is not obligated to, and does not intend to, update or revise any forward-looking statements, whether as a result of new information, future events or otherwise. Forward Looking Statements |
|
|
3 MFA is an internally managed REIT positioned to benefit from investment in both Agency and Non-Agency Residential MBS |
|
|
4 Investment opportunities exist in RMBS, particularly in the Non-Agency sector. Agency MBS investment returns continue to benefit from a steep yield curve. Despite governmental actions, refinancing rates are not spiking. In this period of economic uncertainty, our goal remains to generate double-digit returns on equity with an appropriate level of leverage. Experienced Management Team Focused on Residential MBS Opportunities |
|
|
5 14.5% Annual Return Since January 2000 Source: Bloomberg *Through December 31, 2011. Includes reinvestment of dividends. Total Return* |
|
|
6 MFA Asset Allocation Strategy Investment in Residential MBS Including Both Agency MBS and Non-Agency MBS At December 31, 2011 Agency MBS Non - Agency MBS (1) Cash Other, net Total (Dollars in Thousands) Amortized Cost $ 6,921,275 $ 4,154,746 $ 409,524 $ (49,884) $ 11,435,661 Market Value $ 7,137,531 $ 4,001,415 $ 409,524 $ (49,884) $ 11,498,586 Less Payable for Unsettled Purchases - (27,056) - - (27,056) Less Repurchase Agreements (6,198,829) (1,485,227) - - (7,684,056) Less Multi - year Collateralized Financing - (300,000) - - (300,000) Arrangements (2) Less Securitized Debt - (875,520) - - (875,520) Equity Allocated $ 938,702 $ 1,313,612 $ 409,524 $ (49,884) $ 2,611,954 Less Swaps at Market Value - - - (114,194) (114,194) Net Equity Allocated $ 938,702 $ 1,313,612 $ 409,524 $ (164,078) $ 2,497,760 Debt/Net Equity Ratio (3) 6.60 x 2.05 x - - - For the quarter ended December 31, 2011 Yield on Average Interest Earning Assets 3.14 % 7.06 % 0.03 % 4.42 % Less Average Cost of Funds 1.71 (4) 1.78 (4) - 1.73 Net Interest Rate Spread 1.43 % 5.28 % 0.03 % 2.69 % For additional detail regarding the above table, see the Company’s fourth quarter 2011 earnings release dated February 16, 2012. (1) Information presented with respect to Non - Agency MBS, related repurchase agreement borrowings and resulting totals are presented on a non - GAAP basis. See the accompanying Reconciliation of Non - GAAP Financial Measures. (2) Multi - year collateralized financing arrangements are viewed by management as having an effective term of 3.0 years, but for GAAP reporting purposes are disclosed within repurchase agreements and as having a contractual term of over 30 days to 90 days. (3) Represents the sum of borrowings under repurchase agreements, multi - year collateralized financing arrangements, payable fo r unsettled purchases and securitized debt as a multiple of net equity allocated. (4) Includes effect of Swaps. |
|
|
7 Low premium exposure: Agency Portfolio average amortized cost basis is 102.6%. MFA’s Agency MBS portfolio has limited exposure to HARP 2.0: The majority of MFA’s securities that could be affected have underlying mortgages that are currently in their interest-only period (limiting the incentive to refinance into a fully amortizing 30-year fixed rate mortgage). Agency funding costs are expected to decline: Approximately $958 million of interest rate swaps at a pay rate of 3.87% will mature in the next 12 months. * All Agency MBS portfolio information is as of December 31, 2011 Balanced Portfolio of Hybrid ARMs (~75%) and 15-Year Fixed (~25%) MFA Strategy – Agency MBS* |
|
|
8 MFA owned $4.0 billion market value of Non-Agency MBS with an average amortized cost of 73% of par. In the fourth quarter of 2011, these assets generated a loss adjusted yield of 7.06% on an unlevered basis. These assets are less sensitive to changes in the yield curve and interest rates. Returns on discounted Non-Agency MBS increase if prepayments increase. MFA Strategy – Non-Agency MBS *Information presented as of December 31, 2011. Includes $226.0 million fair value of Non-Agency MBS underlying Linked Transactions at December 31, 2011. Non-Agency MBS are presented on a non-GAAP basis. For a GAAP reconciliation of such items, see Annex 1. Increasing Non-Agency MBS Portfolio* |
|
|
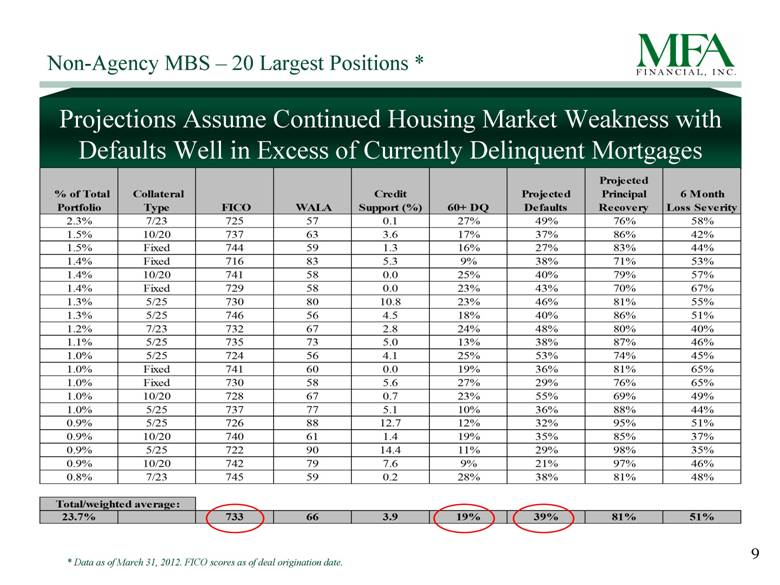
9 Non-Agency MBS – 20 Largest Positions Data as of March 31, 2012. FICO scores as of deal origination date. Projections Assume Continued Housing Market Weakness with Defaults Well in Excess of Currently Delinquent Mortgages % of Total Portfolio Collateral Type FICO WALA Credit Support (%) 60+ DQ Projected Defaults Projected Principal Recovery 6 Month Loss Severity 2.3% 7/23 725 57 0.1 27% 49% 76% 58% 1.5% 10/20 737 63 3.6 17% 37% 86% 42% 1.5% Fixed 744 59 1.3 16% 27% 83% 44% 1.4% Fixed 716 83 5.3 9% 38% 71% 53% 1.4% 10/20 741 58 0.0 25% 40% 79% 57% 1.4% Fixed 729 58 0.0 23% 43% 70% 67% 1.3% 5/25 730 80 10.8 23% 46% 81% 55% 1.3% 5/25 746 56 4.5 18% 40% 86% 51% 1.2% 7/23 732 67 2.8 24% 48% 80% 40% 1.1% 5/25 735 73 5.0 13% 38% 87% 46% 1.0% 5/25 724 56 4.1 25% 53% 74% 45% 1.0% Fixed 741 60 0.0 19% 36% 81% 65% 1.0% Fixed 730 58 5.6 27% 29% 76% 65% 1.0% 10/20 728 67 0.7 23% 55% 69% 49% 1.0% 5/25 737 77 5.1 10% 36% 88% 44% 0.9% 5/25 726 88 12.7 12% 32% 95% 51% 0.9% 10/20 740 61 1.4 19% 35% 85% 37% 0.9% 5/25 722 90 14.4 11% 29% 98% 35% 0.9% 10/20 742 79 7.6 9% 21% 97% 46% 0.8% 7/23 745 59 0.2 28% 38% 81% 48% 23.7% 733 66 3.9 19% 39% 81% 51% Total/weighted average: |
|
|
10 Example of Loss-Adjusted Yield In general, MFA’s yields are based on estimated future cash flows utilizing credit assumptions similar to those used in the slow speed, loss-adjusted illustration. MFA Strategy – Non-Agency MBS For Illustrative Purposes Only Prepay Scenario Price Coupon Defaults Severity Speed Yield Historic Base Case 72 4.50% 0% 0% 15% 14% Slow Speed 72 4.50% 0% 0% 6% 10% Slow Speed Loss Adjusted 72 4.50% 44% 50% 6% 7% |
|
|
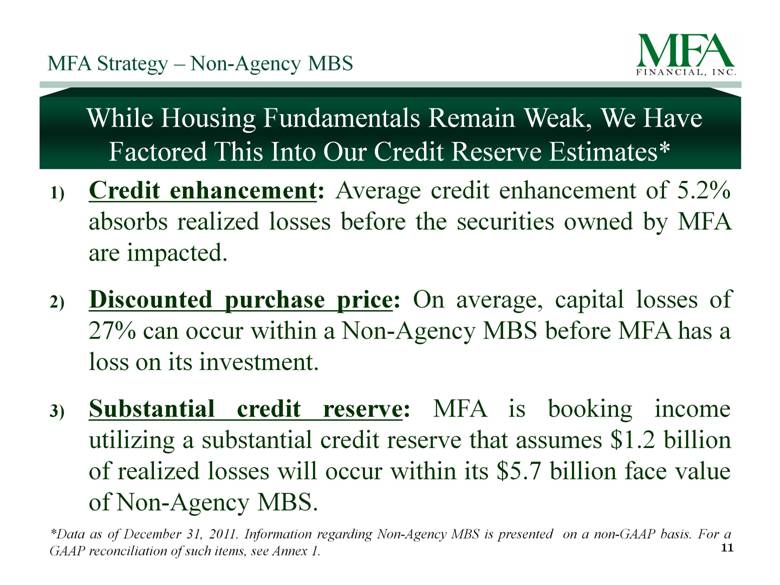
11 MFA Strategy – Non-Agency MBS While Housing Fundamentals Remain Weak, We Have Factored This Into Our Credit Reserve Estimates* Credit enhancement: Average credit enhancement of 5.2% absorbs realized losses before the securities owned by MFA are impacted. Discounted purchase price: On average, capital losses of 27% can occur within a Non-Agency MBS before MFA has a loss on its investment. Substantial credit reserve: MFA is booking income utilizing a substantial credit reserve that assumes $1.2 billion of realized losses will occur within its $5.7 billion face value of Non-Agency MBS. *Data as of December 31, 2011. Information regarding Non-Agency MBS is presented on a non-GAAP basis. For a GAAP reconciliation of such items, see Annex 1.1) 2) 3) |
|
|
12 MFA Strategy – Non-Agency MBS Deeply Discounted Purchase Price, Substantial Credit Reserve and 5.2% Credit Enhancement mitigate Credit Risk * Information regarding Non-Agency MBS is presented on a non-GAAP basis. For a GAAP reconciliation of such items, see Annex 1. Non-Agency Portfolio As of December 31, 2011* Dollars in Millions Current Face $5,703.9 Accretable Discount, Net $274.7 5% Purchase Discount, Net $1,494.7 26% OTTI $54.5 1% Purchase Price $4,154.7 73% Credit Reserve plus OTTI $1,274.5 22% |
|
|
13 Non-Agency MBS We are Adding Financing Structures that Reduce our Reliance on Short-Term Non-Agency Repurchase Arrangements As of the first quarter of 2012, we have entered into a three-year collateralized financing arrangement that effectively provides $500 million of financing for Non-Agency MBS. While this multi-year financing is incrementally more expensive than short-term financing by approximately 100-150 basis points, we believe that the certainty of the committed term outweighs the cost. In February 2012, $187 of senior bonds rated “AAA” by DBRS, Inc. were issued to third-party investors via a Wells Fargo Trust. These bonds, with an average life of 1.9 years, were priced at 2.75% yield. |
|
|
14 Less Than One-Third of MFA Non-Agency MBS Funded with Short-Term Repo* Non- Agency Financing $ % Market value of Non-Agency MBS $ 4.2 Billion 100% Repo (less than 12 months) $ 1.2 Billion 29% Securitized Debt $ 1.0 Billion 24% Multi-year Collateralized Financing $ .5 Billion 12% Equity $ 1.5 Billion 35% * Data as of February 29, 2012. |
|
|
15 MFA Financial, Inc. Internally managed. Goal is to generate double-digit returns on equity. 14.5% annual return since 2000 (including reinvestment of dividends). While housing fundamentals do remain weak, we believe this has been appropriately factored into our cash flow projections and credit reserve estimates. Diverse funding sources for Non-Agency MBS Portfolio including securitized debt, structured financing and equity, in addition to repo. |
|
|
[LOGO] |

|
|
Information pertaining to MFA’s Non-Agency MBS that are a component of Linked Transactions are reconciled below as of and for the three months ended December 31, 2011 with the most directly comparable financial measure calculated in accordance with GAAP, as follows: 17 ANNEX 1 – Reconciliations of Non-GAAP Financial Measures Adjustments to Include Assets/Liabilities GAAP Based Underlying Linked Non-GAAP (Dollars in Thousands) Information Transactions Presentation At December 31, 2011: Repurchase Agreement Borrowings $ 7,813,159 $ 170,897 (1) $ 7,984,056 Securitized Debt 875,520 - 875,520 Obligation to Return Securities 306,401 - 306,401 Obtained as Collateral Payable for Unsettled Purchases 27,056 - 27,056 Total Borrowings (Debt) $ 9,022,136 $ 170,897 (1) $ 9,193,033 Stockholders' Equity $ 2,497,760 2,504 $ 2,500,264 Debt-to-Equity (Debt/Stockholders' Equity) 3.6 x 3.7 x For the Three Months Ended December 31, 2011: Average Interest Earning Assets $ 11,403,662 $ 241,947 (2) $ 11,645,609 Interest Income $ 123,994 $ 4,706 $ 128,700 Yield on Average Interest Earning Assets 4.35 % 7.78 % 4.42 % Average Total Borrowings $ 8,899,013 $ 187,665 (1) $ 9,086,678 Interest Expense $ 38,811 $ 857 $ 39,668 Average Cost of Funds 1.73 % 1.81 % 1.73 % Net Interest Rate Spread 2.62 % 5.97 % 2.69 % (1) Represents borrowings under repurchase agreements underlying Linked Transactions. (2) Represents Non-Agency MBS underlying Linked Transactions. |
|
|
The table below reconciles MFA’s Non-Agency MBS and related repurchase agreement borrowings and securitized debt on a GAAP basis to reflect on a combined basis its Non-Agency MBS and related repurchase agreements underlying its Linked Transactions, which is a Non-GAAP financial measure. Based on this Non-GAAP presentation, MFA has also presented certain resulting performance measures (reflected in the table below) on a Non-GAAP basis. 18 ANNEX 1 – Reconciliations of Non-GAAP Financial Measures (cont) Adjustments to Include Assets/Liabilities GAAP Based Underlying Linked Non-GAAP (Dollars in Thousands) Information (1) Transactions (2) Presentation At Decembe r 31, 2011: Amortized Cost of Non-Agency MBS $ 3,936,211 $ 218,535 (3) $ 4,154,746 (3) Fair Value of Non-Agency MBS $ 3,775,446 $ 225,969 $ 4,001,415 Face/Par Value of Non-Agency MBS $ 5,414,353 $ 289,536 $ 5,703,889 Purchase (Discount) Designated as Credit Reserve and OTTI $ (1,228,766) (4) $ (45,735) $ (1,274,501) (5) Net Purchase (Discount) Designated as Accretable $ (249,376) $ (25,266) (3) $ (274,642) (3) Total Pur chase (Discount) of Non-Agency MBS $ (1,478,142) (4) $ (71,001) $ (1,549,143) (5) Non-Agency Repurchase Agreements and $ 2,489,850 $ 170,897 $ 2,660,747 Securitized Debt For the Three Months Ended December 31, 2011: Non-Agency MBS Average Amortized Cost $ 3,881,220 $ 241,947 $ 4,123,167 Non-Agency Average Total Borrowings $ 2,497,368 $ 187,665 $ 2,685,0 33 Coupon Interest on Non-Agency MBS $ 58,890 $ 3,926 $ 62,816 Effective Yield Adjustment (6) $ 9,194 $ 780 $ 9,974 Interest Income on Non-Agency MBS $ 68,084 $ 4,706 $ 72,790 Interest Expense on Non-Agency Total Borrowings $ 11,202 $ 857 $ 12,059 Yield on Average Interest Earning Non-Agency MBS 7.02 % 7.78 % 7.06 % Non-Agency Average Cost of Funds 1.78 % 1.8 1 % 1.78 % Non-Agency Interest Rate Spread 5.24 % 5.97 % 5.28 % (1) Includes Non-Agency MBS transferred to consolidated VIE. (2) Adjustment to reflect Non-Agency MBS underlying Linked Transactions , borrowings under repurchase agreements underlying Linked Transactions and yield adjustments for de-linked Non-Agency MBS. (3) Includes adjustment of $19.1 million related to yield adjustments for de - linked Non-Agency MBS. (4) Amounts disclosed reflect purchase discount designated as credit reserve of $1.174 billion and OTTI of $54.5 million. (5) Amounts disclosed reflect purchase discount designated as credit reserve of $1.220 billion and OTTI of $54.5 million. (6) The effective yield adjustment on Non-Agency MBS is the difference between net income calculated using the net yield on average interest earning Non-Agency MBS, which is based on management's estimates of future cash flows for Non-Agency MBS, less the current coupon yield. |
|
|
[LOGO] |