Attached files
| file | filename |
|---|---|
| 8-K - FORM 8-K - United Financial Bancorp, Inc. | d326776d8k.htm |
|
|

Transition • Values • Success Transition • Values • Success NASDAQ Global Select Market RCKB Analyst Presentation April 3, 2012
|
|
2 This Presentation contains forward-looking statements that are within the meaning of the Private Securities Litigation Reform Act of 1995. Such statements are based upon the current beliefs and expectations of our management and are subject to significant risks and uncertainties. These risks and uncertainties could cause our results to differ materially from those set forth in such forward-looking statements. Forward-looking statements can be identified by the fact that they do not relate strictly to historical or current facts. Words such as “believes,” “anticipates,” “expects,” “intends,” “plans,” “estimates,” “targeted” and similar expressions, and future or conditional verbs, such as “will,” “would,” “should,” “could” or “may” are intended to identify forward-looking statements but are not the only means to identify these statements. Forward-looking statements involve risks and uncertainties. Actual conditions, events or results may differ materially from those contemplated by a forward-looking statement. Factors that could cause this difference — many of which are beyond our control — include without limitation the following: Any forward-looking statements made by or on behalf of us in this Presentation speak only as of the date of this Presentation. We do not undertake to update forward-looking statements to reflect the impact of circumstances or events that arise after the date the forward-looking statement was made. The reader should; however, consult any further disclosures of a forward-looking nature we may make in future filings. With regard to presentations related to recently converted second step conversions, the peer companies include: PBNY, BRKL, OCFC, ESBF, UBNK, WFD, ESSA, BFED, NHTB, HIFS, HARL, and THRD. The data presented in this presentation relating to the peer companies is based on the calendar year. Data for peers is sourced from SNL Financial LLC. Forward Looking Statements
|
|
3 Table of Contents Page Why Rockville Financial 5 Infrastructure Investment 6 Recent Strategic Initiatives 10 Strategic Priorities 11 Financial Performance 14 Loans 19 Deposits 23 Asset Quality 28 Institutional Ownership 30 Appendix—Peer Analysis 32
|
|

4 Corporate Contacts William H. W. Crawford, IV President & Chief Executive Officer Marino J. Santarelli Executive Vice President, Chief Operating Officer Scott C. Bechtle Executive Vice President, Chief Risk Officer John T. Lund Executive Vice President, Chief Financial Officer & Treasurer Mark A. Kucia Executive Vice President, Commercial Banking Executive Investor Information: Marliese L. Shaw Senior Vice President, Investor Relations Officer 860-291-3622 or mshaw@rockvillebank.com
|
|
5 Why Rockville Financial Commercial loan growth 17.0% 3-year CAGR. Demand deposit growth 20.9% 3-year CAGR. Low cost core deposit growth 16.4% 3-year CAGR. Assets increased $72 million YTD 2011; growth was diminished by $122 million pay down of FHLB advances Q2 2011. Residential mortgage $39 million decline YTD 2011 due to intentional sales of long duration, low coupon mortgages to the secondary market for interest sensitivity purposes. Transitioning this product line to a fee based income business. Year over year 16.0% revenue growth and 7% NIE increase in Q4 2011. Record Q3 and Q4 profits; ROAA of 0.94% and 0.92%, respectively. Strong asset quality – NCOs/average loans 0.09% YTD 2011. Strong credit review program—Third party review of commercial loan portfolio and new originations four times a year, in addition to new origination review by CRO and EVP/Commercial Banking. Stock buybacks – 10% Plan commenced after completion of Federal Reserve Bank of Boston supervisory review March 12, 2012 . Dividend increased 15% in November 2011 and 7% in February 2012.
|
|
6 Infrastructure Investment Preparing for Prudent Growth Opportunities As the Company continues to prepare to prudently leverage capital and accelerate growth, while also positioning for the evolving regulatory environment, staff additions have been implemented in the areas of Risk Management, Compliance, Information Technology, Commercial Banking, Cash Management, Retail Banking and Treasury. All of these staff additions were achieved without the assistance of an executive recruitment firm.
|
|
7 Infrastructure Investment Recruited Experienced Management Team Name Title Years in Industry Prior Experience William H. W. Crawford, IV President and Chief Executive Officer 23 Wells Fargo Bank, Wachovia Bank and SouthTrust Bank Marino J. Santarelli Executive Vice President, Chief Operating Officer 38 Wells Fargo Bank, Wachovia Bank and United Penn Bank Scott C. Bechtle Executive Vice President, Chief Risk Officer 29 Florida Shores Bank, SouthTrust Bank and Bank of America (fka Barnett Banks) John T. Lund Executive Vice President, Chief Financial Officer and Treasurer 18 FDIC Examiner, Capital Markets Specialist Mark A. Kucia Executive Vice President, Head Commercial Banking Officer 24 Liberty Bank, Mechanics Bank, BayBank, National Westminster PLC Steve Koniecki Executive Vice President, Information Technology and Operations Officer 30 Space Coast Credit Union, West Bank Tammy Howe Vice President, Operations Officer 10 Chicopee Savings Bank, West Bank Eric Newell Senior Vice President, Treasury Officer 8 Alliance Bernstein, Fitch Ratings, and FDIC. CFA designation Gina Esposito Vice President, Branch Administration Officer 27 NewAlliance Bank
|
|
8 Infrastructure Investment Risk Management Name Title Years in Industry Prior Experience Jay Peters Vice President, BSA/AML, Red Flags Officer 36 NewAlliance Bank, Webster Bank, Bank of Southern Connecticut, Dime Savings Bank Beth Donna Vice President, Internal Audit Manager, Enterprise Risk Management 17 NewAlliance Bank, Dime Savings Bank Christine Keeney Vice President, Information Security Officer 20 NewAlliance Bank, Savings Bank of Manchester Deborah Gabinelle Vice President, Senior Credit Risk Officer 25 Webster Bank, Fleet Bank, Federal Reserve Bank of New York Nathan Kelley Vice President, Credit Risk Officer 9 NewAlliance Bank, FirstFed America Bankcorp The Company strengthened Risk Management with the following new positions:
|
|
9 Infrastructure Investment Commercial Banking Expansion Name Title Years in Industry Prior Experience Stephen Villecco Senior Vice President, Regional Commercial Banking Officer 23 Headed up NewAlliance Bank’s $0.5 billion Commercial and Industrial department since 1998 Thomas Reid Senior Vice President, Commercial Banking Officer 36 Headed up NewAlliance Bank’s $1.2 billion Commercial Real Estate department since 2003 Matt Proto Vice President, Senior Commercial Banking Officer 15 Bank of Southern Connecticut and NewAlliance Bank Raymond Kostka Vice President, Commercial Banking Officer 32 NewAlliance Bank Robert Landfear Vice President, Commercial Banking Officer 17 NewAlliance Bank Michael Kelleher Vice President, Commercial Banking Officer 34 NewAlliance Bank Joseph Tartaglia Vice President, Senior Cash Management Officer 20 First Vice President, Cash Management Sales Manager NewAlliance Bank Kristine Carlson-Koehler Assistant Vice President, Cash Management Officer 24 NewAlliance Bank, Tolland Bank
|
|
10 Recent Strategic Initiatives Recruited Chief Operating Officer and Chief Risk Officer Significantly enhanced Risk Management, IT/Operations, Finance and Retail delivery departments as the Company prepares to leverage capital Recruited NewAlliance Bank’s heads of C&I lending, Commercial Real Estate lending and Cash Management/Treasury services along with five commercial relationship managers doubling Rockville’s customer facing commercial banking staff. Received regulatory approval and opened New Haven County Commercial Banking Office. Balance sheet restructure: Liquidated $14.5 million (materially all) available for sale equity securities in June, realizing a pre-tax gain of $6.2 million and removing significant risk of market volatility from the balance sheet. Extinguished $122.2 million of FHLB debt in June with a 4.17% weighted average cost, eliminating approximately $5.4 million in annualized pre-tax interest expense. After the restructure, the Company had $51 million of remaining FHLB debt maturing in Q3 and Q4 2011 with a 3.75% weighted average cost . Retail organization focused on growing core deposits and reducing cost of funds. Positioning the Company for prudent future growth
|
|
Strategic Priorities
Complete comprehensive enterprise wide 5-year Strategic Plan with Board of Directors in Q2 2012
Continue managing asset/liability and liquidity risk
Continue focus on superior customer service, risk management, asset quality and being regulatory best practice
Continue to become the employer of choice to obtain and retain the best talent in Connecticut and to serve our communities
Enterprise wide NIE efficiency exercise lead by project team. NIE/Average Asset ratio 2.69% at 12/31/11, among the best of peers
Review branch network efficiency, de novo branch strategy, and retail delivery/residential mortgage model per strategic planning
Achieve optimal balance between core deposit growth and total funding cost by driving commercial DDA, municipal deposits and low cost core deposits versus higher cost CDs
Increase Net Interest Margin
Expand market share via organic growth in Tolland, Harford, New London on and New Haven counties
Execute on current commercial banking opportunity created by large in-market merger while maintaining discipline on loan pricing and asset quality diligence
11
|
|
Strategic Priorities continued
Strategic Priorities continued12
Acquisitions
- Management has a disciplined approach to protecting tangible book value, enhancing franchise value and on the effective use of excess capital. At this time, Management believes quality organic growth, our 10% share repurchase plan, and dividend strategy are a more effective path for total shareholder return.
Capital Management
- The Company is overcapitalized with a 25.40% total risk based capital ratio as of December 31, 2011
- The Company announced a 10% stock buyback plan on March 2, 2012. The Company has paid dividends for 23 consecutive quarters, most recent a 7% increase to $0.08 per share
- At December 31, 2011 closing price was $10.36, tangible book value was $11.26, and price to tangible book value was 92%. At March 30, 2012 the closing price was $11.65
- The Company is focused on effective and efficient use of excess capital
12
|
|
13 Strategic Priorities continued 13
Expansion of the management team was accomplished without recruitment fees, except for the CEO
New management team members were added by personal invitation from the CEO or executive management-We know them…They know us… They know our market
Long term focus on superior customer service
For the seventh consecutive year, readers of “The North Central News” (Conn.) have Rockville Bank as the area’s Best Financial Institution”. Rockville Bank has received this recognition from the readers every year since the paper’s annual Best of readers’ poll was established in 2005.
$5.0 million contribution to the Rockville Bank Foundation in Q1 2011 in association with the conversion to a fully public company
The Bank and the Foundation support 343 organizations through donations and employee volunteerism
|
|
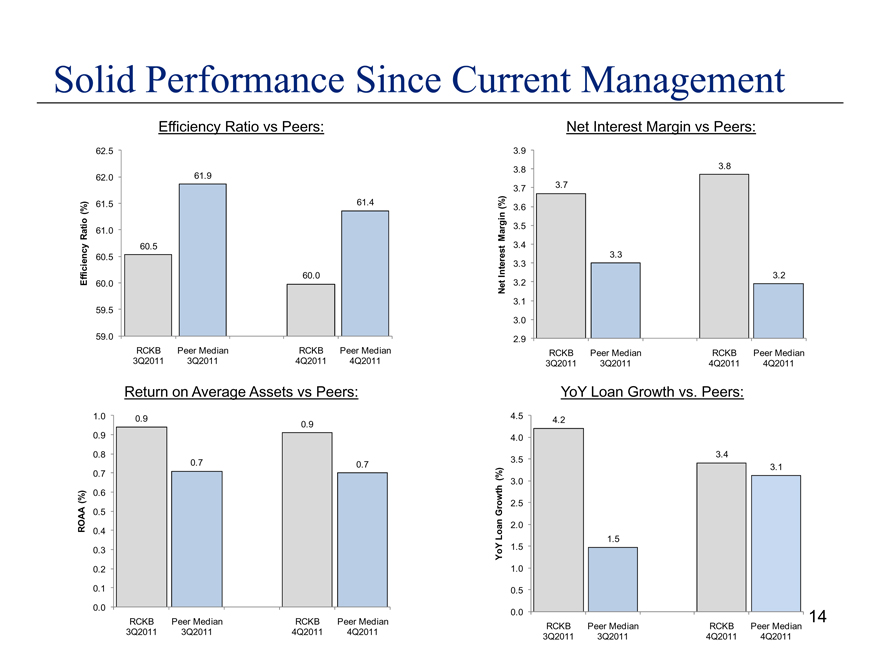
Solid Performance Since Current Management
Return on Average Assets vs Peers: YoY Loan Growth vs. Peers: 14 Efficiency Ratio vs Peers: Net Interest Margin vs Peers: Solid Performance Since Current Management
|
|
Total Assets
Despite a difficult operating environment and the repayment of $122.2 million of Federal Home Loan Bank of Boston Advances in 2011, we were able to grow assets at a CAGR of 7.3% through a disciplined growth strategy.
2,000,000
1,600,000
1,200,000
800,000
400,000
0
2006Y
2007Y
2008Y
2009Y
2010Y
2011Y
Total Assets ($000)
1,232,836
1,327,012
1,533,073
1,571,134
1,678,073
1,678,073
1,749,872
CAGAR=7.3%
|
|
16 Capital Ratios The Company continues to be well capitalized. At December 31, 2011, our core capital ratio was 18.90% of total adjusted tangible assets In addition, our Tier 1 Capital to Risk-Weighted Assets and Total Capital to Risk-Weighted Assets were 24.20% and 25.40%, respectively. (CHART)
30.00%
25.00%
20.00%
15.00%
10.00%
5.00%
0.00%
18.90%
4.00%
24.20%
4.00%
25.40%
8.00%
Tler 1 Leverage
Tler 1 Risk-based
Total Risk-based
Rockvlle Financial. Inc Requirement
|
|
17 Total Shareholder Return Favorable in comparison to SNL Thrift Index Source: SNL Financial
-RCKB (+15.10%) – SNL U.S. Thrift (-5.23%)
23
10
0
-10
-20 Total Return (%)
May 2011
Jul 2011
Sep 2011
Nov 2011
Jan 2012
Mar 2012
2,500
2,000
1,500
1,000
0 Thousands
|
|
18 Dividend History
Historical Dividend
$0.08
$0.07
$0.06
$0.05
$0.04
$0.03
$0.02
$0.01
$0.00
Dividend Per Share
1Q09
2Q09
3Q09
4Q09
1Q10
2Q10
3Q10
4Q10
1Q11
2Q11
3Q11
4Q11
Payout Ratio
Dividend
100%
90%
80%
70%
60%
50%
40%
30%
20%
10%
0%
Payment Ratio
|
|
19 Loan Growth 5 Year Organic Growth History, CAGR = 7.1%
|
|
20 Loan Mix Note: Yield on loans for the respective quarter ends
|
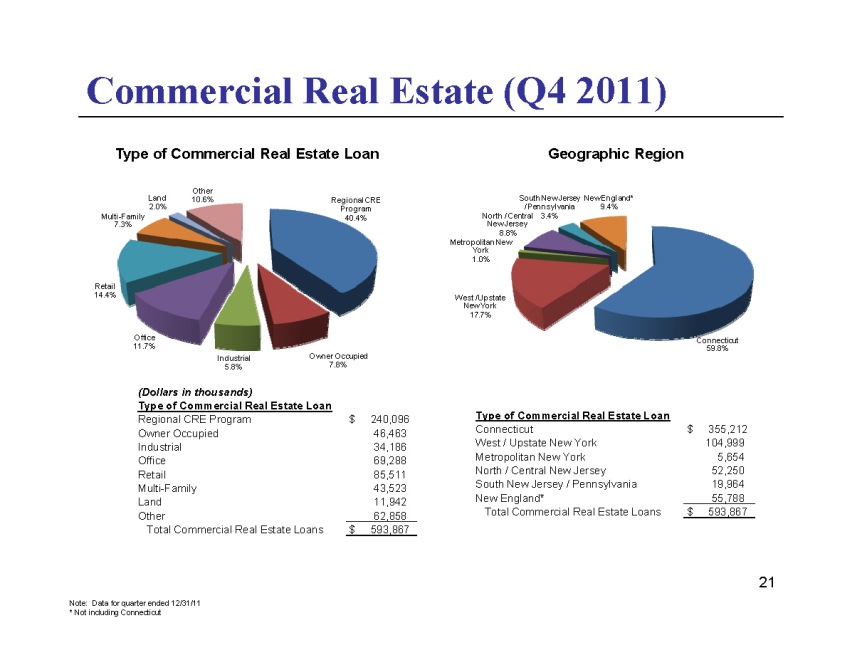
Commercial Real Estate (Q4 2011)
Type of Commercial Real Estate Loan
Geographic Region
(Dollars in thousands)
Type of Commercial Real Estate Loan
Regional CRE Program $ 240,096
Owner Occupied 46,463
Industrial 34,186
Office 69,288
Retail 85,511
Multi-Family 43,523
Land 11,942
Other 62,858
Total Commercial Real Estate Loans $ 593,867
Type of Commercial Real Estate Loan
Connecticut $ 355,212
West / Upstate New York 104,999
Metropolitan New York 5,654
North / Central New Jersey 52,250
South New Jersey / Pennsylvania 19,964
New England* 55,788
Total Commercial Real Estate Loans $ 593,867
Note: Data for quarter ended 12/31/11
| * |
|
Not including Connecticut |
21
|
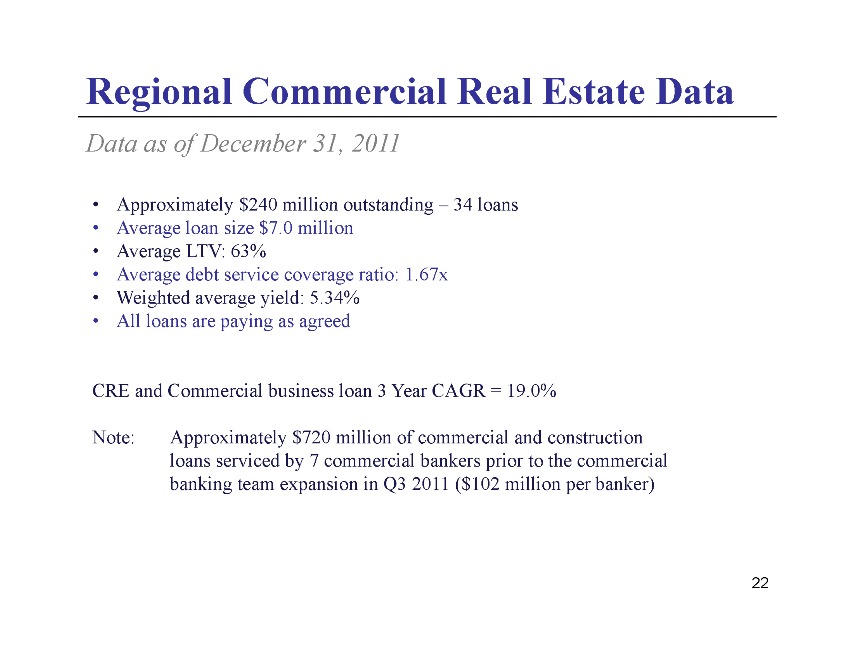
Regional Commercial Real Estate Data
Data as of December 31, 2011
• Approximately $240 million outstanding – 34 loans
• Average loan size $7.0 million
• Average LTV: 63%
• Average debt service coverage ratio: 1.67x
• Weighted average yield: 5.34%
• All loans are paying as agreed
CRE and Commercial business loan 3 Year CAGR = 19.0%
Note: Approximately $720 million of commercial and construction loans serviced by 7 commercial bankers prior to the commercial banking team expansion in Q3 2011 ($102 million per banker)
22
|
|
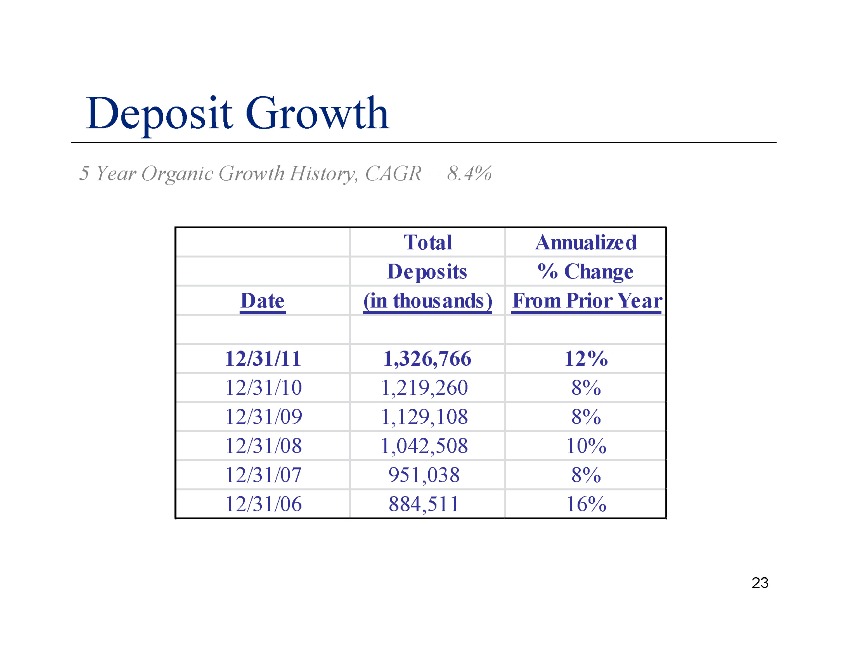
Deposit Growth
| 5 |
|
Year Organic Growth History, CAGR = 8.4% |
Total Annualized
Deposits % Change
Date (in thousands) From Prior Year
12/31/11 1,326,766 12%
12/31/10 1,219,260 8%
12/31/09 1,129,108 8%
12/31/08 1, 042,508 10%
12/31/07 951,038 8%
12/31/06 884,511 16%
23
|
|
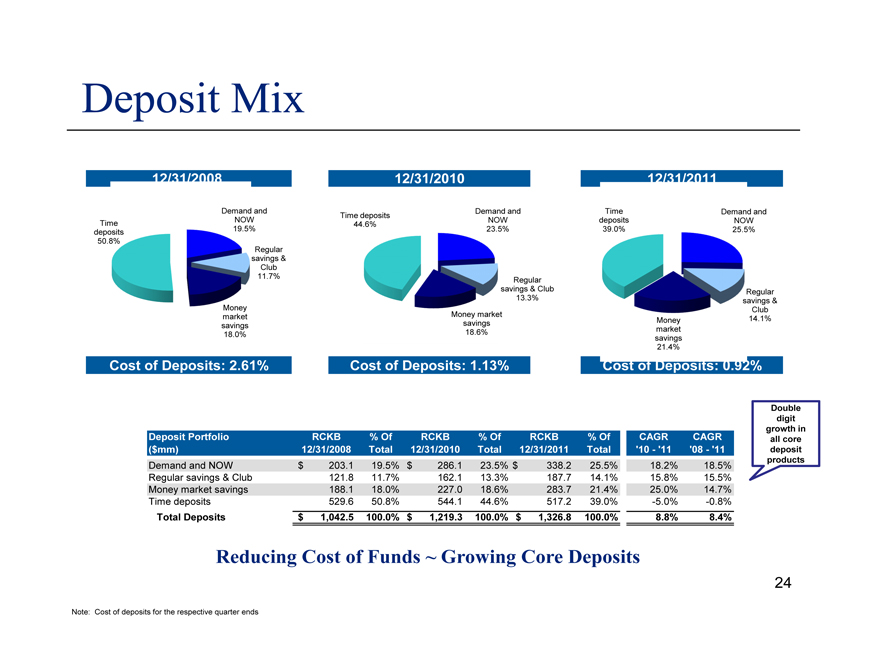
Deposit Mix
12/31/2008
12/31/2010
12/31/2011
Cost of Deposits: 2.61%
Cost of Deposits: 1.13%
21.4%
Cost of Deposits: 0.92%
Deposit Portfolio RCKB % Of RCKB % Of RCKB % Of CAGR CAGR
($mm) 12/31/2008 Total 12/31/2010 Total 12/31/2011 Total ‘10—‘11 ‘08—‘11
Demand and NOW $ 203.1 19.5% $ 286.1 23.5% $ 338.2 25.5% 18.2% 18.5%
Regular savings & Club 121.8 11.7% 162.1 13.3% 187.7 14.1% 15.8% 15.5%
Money market savings 188.1 18.0% 227.0 18.6% 283.7 21.4% 25.0% 14.7%
Time deposits 529.6 50.8% 544.1 44.6% 517.2 39.0% -5.0% -0.8%
Total Deposits $ 1,042.5 100.0% $ 1,219.3 100.0% $ 1,326.8 100.0% 8.8% 8.4%
Double digit growth in all core deposit products
Reducing Cost of Funds ~ Growing Core Deposits
Note: Cost of deposits for the respective quarter ends
24
|
|
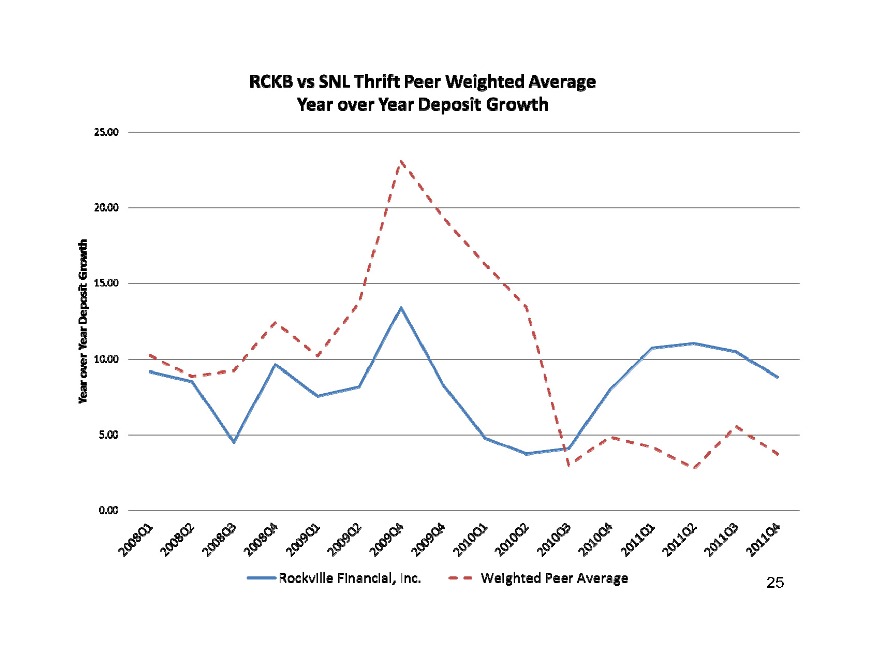
25
|
|
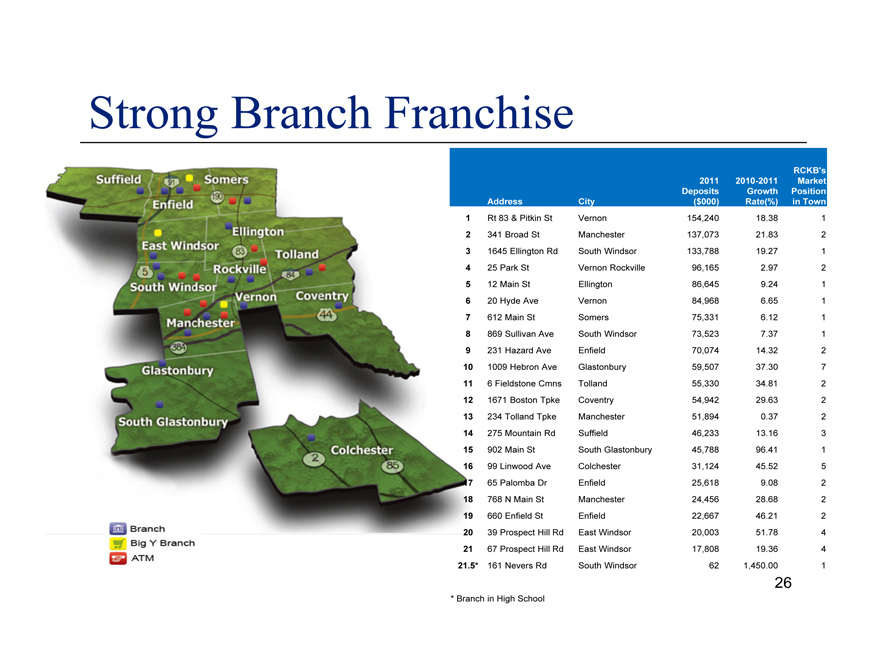
Strong Branch Franchise
RCKB’s
2011 2010-2011 Market
Deposits Growth Position
Address City ($000) Rate(%) in Town
| 1 |
|
Rt 83 & Pitkin St Vernon 154,240 18.38 1 |
| 2 |
|
341 Broad St Manchester 137,073 21.83 2 |
| 3 |
|
1645 Ellington Rd South Windsor 133,788 19.27 1 |
| 4 |
|
25 Park St Vernon Rockville 96,165 2.97 2 |
| 5 |
|
12 Main St Ellington 86,645 9.24 1 |
| 6 |
|
20 Hyde Ave Vernon 84,968 6.65 1 |
| 7 |
|
612 Main St Somers 75,331 6.12 1 |
| 8 |
|
869 Sullivan Ave South Windsor 73,523 7.37 1 |
9 231 Hazard Ave Enfield 70,074 14.32 2
10 1009 Hebron Ave Glastonbury 59,507 37.30 7
11 6 Fieldstone Cmns Tolland 55,330 34.81 2
12 1671 Boston Tpke Coventry 54,942 29.63 2
13 234 Tolland Tpke Manchester 51,894 0.37 2
14 275 Mountain Rd Suffield 46,233 13.16 3
15 902 Main St South Glastonbury 45,788 96.41 1
16 99 Linwood Ave Colchester 31,124 45.52 5
17 65 Palomba Dr Enfield 25,618 9.08 2
18 768 N Main St Manchester 24,456 28.68 2
19 660 Enfield St Enfield 22,667 46.21 2
20 39 Prospect Hill Rd East Windsor 20,003 51.78 4
21 67 Prospect Hill Rd East Windsor 17,808 19.36 4
21.5* 161 Nevers Rd South Windsor 62 1,450.00 1
| * |
|
Branch in High School |
26
|
|
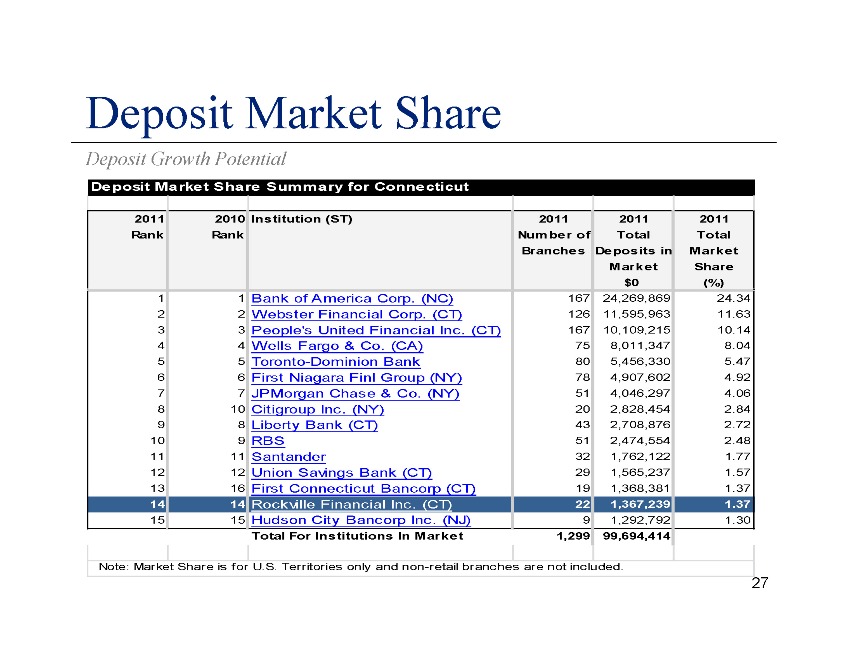
Deposit Market Share
Deposit Growth Potential
Deposit Market Share Summary for Connecticut
2011 2010 Institution (ST) 2011 2011 2011
Rank Rank Number of Total Total
Branches Deposits in Market
Market Share
$0 (%)
| 1 |
|
1 Bank of America Corp. (NC) 167 24,269,869 24.34 |
| 2 |
|
2 Webster Financial Corp. (CT) 126 11,595,963 11.63 |
| 3 |
|
3 People’s United Financial Inc. (CT) 167 10,109,215 10.14 |
| 4 |
|
4 Wells Fargo & Co. (CA) 75 8,011,347 8.04 |
| 5 |
|
5 Toronto-Dominion Bank 80 5,456,330 5.47 |
| 6 |
|
6 First Niagara Finl Group (NY) 78 4,907,602 4.92 |
| 7 |
|
7 JPMorgan Chase & Co. (NY) 51 4,046,297 4.06 |
| 8 |
|
10 Citigroup Inc. (NY) 20 2,828,454 2.84 |
9 8 Liberty Bank (CT) 43 2,708,876 2.72
10 9 RBS 51 2,474,554 2.48
11 11 Santander 32 1,762,122 1.77
12 12 Union Savings Bank (CT) 29 1,565,237 1.57
13 16 First Connecticut Bancorp (CT) 19 1,368,381 1.37
14 14 Rockville Financial Inc. (CT) 22 1,367,239 1.37
15 15 Hudson City Bancorp Inc. (NJ) 9 1,292,792 1.30
Total For Institutions In Market 1,299 99,694,414
Note: Market Share is for U.S. Territories only and non-retail branches are not included.
27
|
|
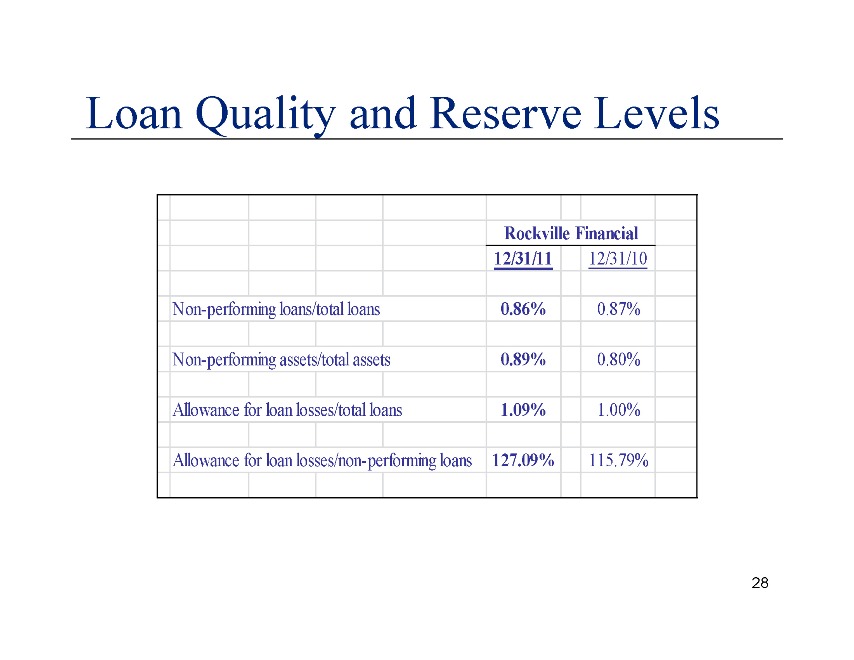
Loan Quality and Reserve Levels
Rockville Financial
12/31/11 12/31/10
Non-performing loans/total loans 0.86% 0.87%
Non-performing assets/total assets 0.89% 0.80%
Allowance for loan losses/total loans 1.09% 1.00%
Allowance for loan losses/non-performing loans 127.09% 115.79%
28

Solid Asset Quality Despite Tough Environment
Compares Favorably to Peers
Loan Loss Reserves / Loans vs Peers:
NCOs / Avg. Loans vs Peers:
Non-Performing Loans / Total Loans vs Peers:
Note: Data for year ended 2011
29
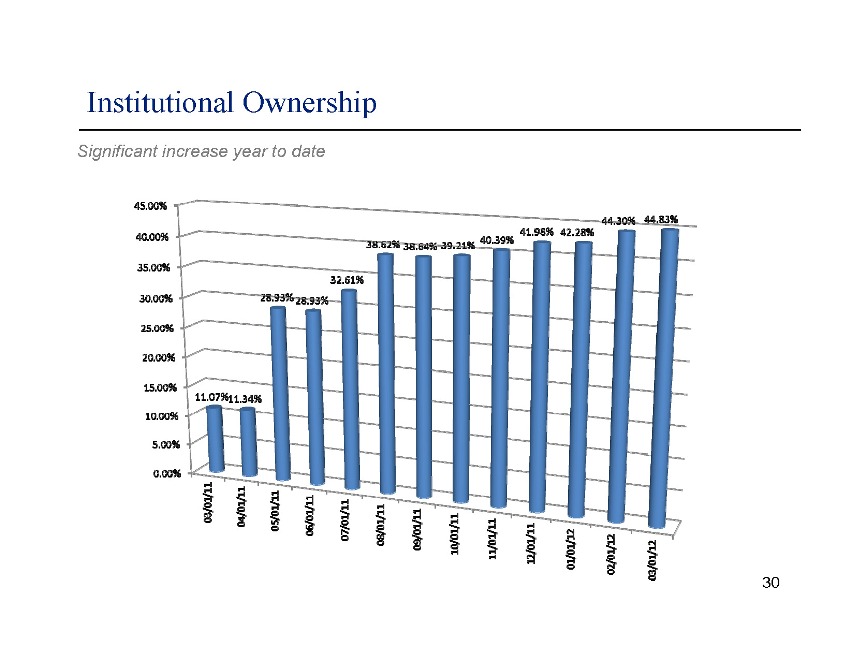
Institutional Ownership
Significant increase year to date
30
|
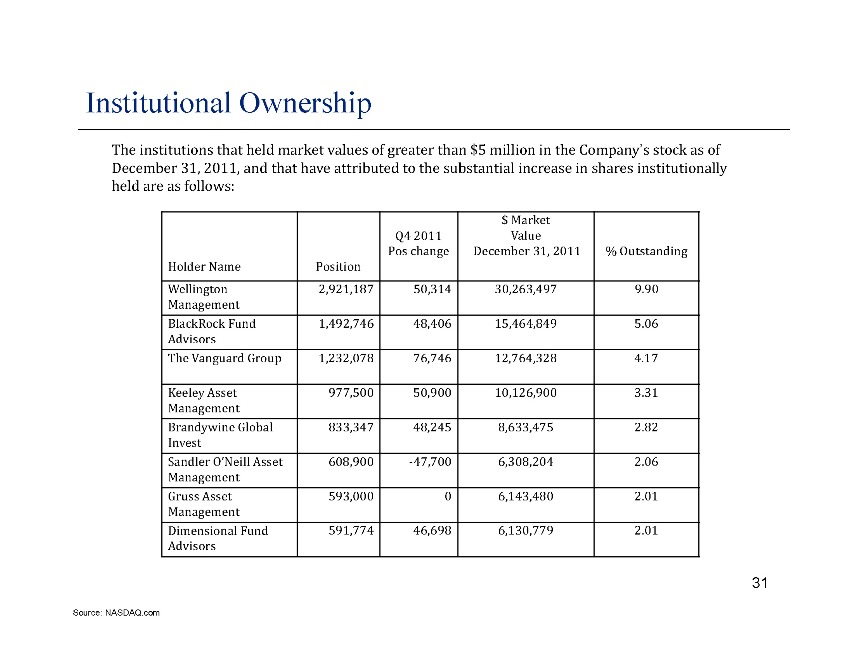
Institutional Ownership
The institutions that held lion market in values the ‘s stock Company of as December 31, 2011, and thatincrease have attributed in shares to held are as follows:
$ Market
Q4 2011 Value
Pos change December 31, 2011
Holder Name Position
Wellington 2,921,187 292118750314 50,314 30263497 30,263,497 9 990 . 90
Management
BlackRock Fund 1,492,746 48,406 15,464,849
Advisors
The Vanguard Group 1,232,078 76,746
Keeley Asset 977,500 50,900 10,126,900
Management
Brandywine Global 833,347 48,245 8,633,475
Invest
Sandler O’Neill 608,900 Asset -47,700 6,308,204
Management
Gruss Asset 593,000 0 6,143,480
Management
Dimensional Fund 591,774 46,698 6,130,779
Advisors
Source: NASDAQ.com
31
|
APPENDIX
32
|
|
Non-Interest Expense to Average Assets Peer Comparison
NIE / Average Assets (Quarterly)—Peers
12/31/2011 9/30/2011 6/30/2011 3/31/2011 12/31/2010
Fairfield County Bank CT 3.78 3.80 3.79 3.60 4.28 Newtown Savings Bank CT 3.71 3.45 3.20 3.23 3.46 Naugatuck Savings Bank CT 3.38 3.34 3.39 3.50 3.44 People’s United Financial, Inc (PBCT) CT 3.18 3.10 3.23 3.24 3.35 SI Financial Group, Inc (SIFI) CT 3.15 3.39 3.54 3.49 3.36 Farmington Bank CT 3.07 2.81 3.43 3.21 3.23 Naugatuck Valley Financial Corp (NVSL) CT 3.03 3.06 2.68 3.00 2.67 Dime Bank CT 2.96 2.92 3.01 3.22 2.95 First County Bank CT 2.94 2.90 2.93 3.01 3.03 SBT Bancorp, Inc (SBIB) CT 2.94 3.13 3.32 3.42 3.36 Union Savings Bank CT 2.89 2.88 2.92 3.03 2.69 Webster Financial Corporation (WBS) CT 2.78 2.70 2.80 2.85 2.78 Liberty Bank CT 2.72 2.71 2.72 2.78 2.56 Rockville Financial Inc (RCKB) CT 2.69 2.43 2.53 2.37 2.64 New England Bancshares, Inc (NEBS) CT 2.54 2.47 2.64 2.75 2.45 First Niagara Financial Group (FNFG) NY 2.30 2.30 2.29 2.61 2.54
Source: SNL Financial; FDIC Call Reports
33
|
|
Efficiency Peer Comparison
Efficiency Ratio (Quarterly)—Peers
12/31/2011 9/30/2011 6/30/2011 3/31/2011 12/31/2010
Farmington Bank CT 94.11 87.80 97.61 88.13 85.95
Newtown Savings Bank CT 85.55 86.50 81.94 80.83 76.16
First County Bank CT 83.34 84.62 85.68 85.96 82.83
Union Savings Bank CT 82.82 79.13 75.61 84.65 74.57
SBT Bancorp, Inc (SBIB) CT 82.23 88.13 92.38 92.69 81.17
SI Financial Group, Inc (SIFI) CT 79.06 87.05 88.73 90.98 82.12
Naugatuck Savings Bank CT 76.84 78.24 79.47 82.50 79.44
Fairfield County Bank CT 74.47 72.30 79.62 72.22 91.91
Dime Bank CT 74.28 55.28 77.35 80.52 74.96
New England Bancshares, Inc (NEBS) CT 73.20 69.76 75.53 78.99 71.03
Webster Financial Corporation (WBS) CT 69.75 65.08 67.71 70.80 67.94
Naugatuck Valley Financial Corp (NVSL) CT 69.23 65.95 69.93 83.45 66.45
People’s United Financial, Inc (PBCT) CT 69.14 67.00 67.36 67.74 74.20
United Financial Bancorp, Inc. (UBNK) MA 67.76 69.39 72.85 73.23 70.11
Liberty Bank CT 64.53 66.91 67.71 71.83 63.85
Rockville Financial Inc (RCKB) CT 63.21 60.54 76.64 72.13 68.27
First Niagara Financial Group (FNFG) NY 59.61 58.71 57.21 61.31 60.20
NII %Ch QoQ
2.7%
1.8% -1.1% -0.7%
1.7% -0.1%
2.0% -1.6% -4.7%
1.2% -0.5% -1.9%
0.9% -1.2%
4.3%
1.4%
3.0%
Source: SNL Financial; FDIC Call Reports
34
|
|
Peer Comparison(1)
General Information: Profitability: Capital: Asset Quality: Pricing Info: Dividends:
Total Adj 2/22/2012 Price / Current
Oper. Oper. Eff. Capital Loans / LLR / Texas NPAs / Market Stock Tang. Div. Annual
Assets ROA ROE NIM Ratio Ratio Deposits Loans Ratio Assets Cap Price Book Yield Div.
Institution Ticker Headquarters ($mm) (%) (%) (%) (%) (%) (%) (%) (%) (%) ($mm) ($) (X) (%) ($)
Rockville Financial, Inc. RCKB Vernon Rockville, CT 1,750 0.40 2.31 3.42 66.62 25.40 109.85 1.09 4.48 0.89 339 11.47 1.02 2.79 0.32
Peer Group:
Provident New York Bancorp (2) PBNY Montebello, NY 3,137 0.40 2.75 3.61 72.99 12.97 73.15 1.63 19.95 1.64 335 8.86 1.26 2.71 0.24
Brookline Bancorp, Inc. BRKL Brookline, MA 3,299 0.94 5.72 3.76 51.75 17.05 119.39 1.17 0.00 0.00 546 9.22 1.21 3.69 0.34
OceanFirst Financial Corp. OCFC Toms River, NJ 2,302 0.91 9.88 3.56 56.76 16.40 92.16 1.15 19.56 2.00 260 13.90 1.20 3.45 0.48
ESB Financial Corporation ESBF Ellwood City, PA 1,965 0.81 8.90 2.67 57.99 15.10 56.12 1.00 9.54 0.89 195 13.10 1.35 3.05 0.40
United Financial Bancorp, Inc. UBNK West Springfield, MA 1,624 0.70 4.94 3.51 70.60 17.08 90.49 0.99 3.94 0.56 252 16.02 1.15 2.25 0.36
Westfield Financial, Inc. WFD Westfield, MA 1,263 0.47 2.65 2.67 74.02 30.47 74.55 1.40 7.99 0.32 219 8.14 0.96 2.95 0.24
ESSA Bancorp, Inc. (2) ESSA Stroudsburg, PA 1,097 0.48 3.16 2.78 75.12 28.54 115.78 1.09 1.50 1.45 115 9.67 0.72 2.07 0.20
Hingham Institution for Savings HIFS Hingham, MA 1,127 1.14 15.32 3.50 40.11 13.55 107.90 0.88 11.82 0.94 112 52.70 1.36 1.90 1.00
Beacon Federal Bancorp, Inc. (2) BFED East Syracuse, NY 1,032 0.50 5.09 3.03 54.61 13.42 117.40 1.88 12.88 1.56 90 13.94 0.82 2.01 0.28
New Hampshire Thrift Bancshares, Inc. NHTB Newport, NH 1,042 0.75 7.71 3.11 75.78 15.01 89.46 1.25 26.80 1.73 70 12.00 1.20 4.33 0.52
Harleysville Savings Financial Corp (2) HARL Harleysville, PA 836 0.63 9.77 2.23 63.71 12.94 98.87 0.63 9.05 0.65 65 17.16 1.13 4.43 0.76
TF Financial Corporation THRD Newtown, PA 682 0.57 5.17 3.74 67.38 18.56 89.72 1.61 4.74 0.55 70 24.84 0.97 0.81 0.20
Average: 0.69 6.76 3.18 63.40 17.59 93.75 1.22 10.65 1.02 1.11 2.80 0.42
Median: 0.67 5.45 3.31 65.55 15.75 91.32 1.16 9.29 0.91 1.17 2.83 0.35
Note: Data through year end 12/31/11, unless otherwise noted and has been annualized where applicable. NPAs and Loan 90 Days Past Due are adjusted for covered assets Pricing data as of 2/22/12. DNBK has been removed due to merger with PBCT. Data at bank level where information was unavailable at parent level (1) Peer group companies selected by independent appraisal firm during second step conversion (2) Data as of 9/30/11
35
|
|
Recently Converted Second Step Conversions
• Second step conversions since January 1, 2010 with gross proceeds greater than $20mm
General Information Offering Information and Pro Forma Data Price Change Since IPO (%) At Ann. Gross Tg. Eq. / Price / Last NPAs / Proceeds Point in Assets Tg. Bk. Charit. 1 Day 1 Month 3 Month Close Assets Company Name Ticker ST IPO Date ($000) Range (%) (%) Fndn? (%) (%) (%) (%) (%)
Second Step Conversions
| 1 |
|
Cheviot Financial Corp. CHEVD OH 1/18/12 37,400 Minimum 14.6 66.1 NO 3.1 3.5 3.5 3.60 |
| 2 |
|
Naugatuck Valley Financial Corporation NVSL CT 6/30/11 33,384 Mid-Max 13.4 70.1 NO (1.3) 1.9 (1.8) (10.6) 2.18 |
| 3 |
|
Rockville Financial, Inc. RCKB CT 3/4/11 171,099 Supermax 17.8 92.2 YES 6.0 5.0 (5.6) 15.4 1.07 |
| 4 |
|
Alliance Bancorp, Inc. of Pennsylvania ALLB PA 1/18/11 32,585 Mid-Max 17.0 66.8 NO 10.0 11.9 10.8 13.5 3.19 |
| 5 |
|
SI Financial Group, Inc. SIFI CT 1/13/11 52,356 Min-Mid 13.0 69.9 YES 15.9 17.5 25.0 26.5 0.97 |
| 6 |
|
Capitol Federal Financial, Inc. CFFN KS 12/22/10 1,181,500 Minimum 21.0 83.9 YES 16.5 16.0 14.0 17.3 0.71 |
| 7 |
|
Heritage Financial Group, Inc. HBOS GA 11/30/10 65,918 Min-Mid 16.3 74.3 NO 2.5 25.0 31.2 19.5 2.35 |
| 8 |
|
Kaiser Federal Financial Group, Inc. KFFG CA 11/19/10 63,750 Minimum 15.7 66.3 NO (0.1) (0.4) 37.2 36.3 3.54 |
9 Colonial Financial Services, Inc. COBK NJ 7/13/10 22,950 Minimum 11.0 64.7 NO 0.5 (2.6) (2.8) 25.0 1.77
10 Oneida Financial Corp. ONFC NY 7/7/10 31,500 Midpoint 9.3 97.8 NO (6.3) (1.3) (6.8) 20.0 0.41
11 ViewPoint Financial Group, Inc. VPFG TX 7/7/10 198,573 Min-Mid 14.6 93.9 NO (5.0) (3.0) (7.0) 47.5 0.61
12 Fox Chase Bancorp, Inc. FXCB PA 6/29/10 87,125 Minimum 16.0 72.6 NO (4.1) (1.8) (4.0) 26.1 2.84
13 Oritani Financial Corp. ORIT NJ 6/24/10 413,632 Mid—Max 25.8 90.6 NO 3.1 (0.9) (2.5) 29.9 2.62
14 Eagle Bancorp Montana, Inc. EBMT MT 4/5/10 24,643 Mid—Max 15.7 81.1 NO 5.5 4.0 (2.8) (1.0) 0.46
Average: 15.8 77.9 3.3 5.3 6.5 19.2 1.88 Median: 15.7 73.5 2.8 2.7 -2.5 19.8 1.98
Note: Charter Financial Corp. (MHC) not included in above analysis due to unique structure as an incremental MHC offering Source: SNL Financial, pricing as of 2/22/12
36
|
|
Recently Converted Second Step Conversions (cont.)
General Information: Profitability: Capital: Asset Quality: Pricing Info: Dividends: Total Adj 2/22/2012 Price / Current Oper. Oper. Eff. Capital Loans / LLR / Texas NPAs / Market Stock Tang. Div. Annual Assets ROA ROE NIM Ratio Ratio Deposits Loans Ratio Assets Cap Price Book Yield Div.
Institution Ticker Headquarters ($mm) (%) (%) (%) (%) (%) (%) (%) (%) (%) ($mm) ($) (X) (%) ($)
Rockville Financial, Inc. RCKB Vernon Rockville, CT 1,750 0.40 2.31 3.42 66.62 25.40 109.85 1.09 4.48 0.89 339 11.47 1.02 2.79 0.32 Peer Group:
Capitol Federal Financial, Inc. (1) CFFN Topeka, KS 9,451 0.41 2.20 1.84 47.53 38.07 114.91 0.30 1.90 0.39 1,948 11.63 1.00 2.58 0.30 Northwest Bancshares, Inc. NWBI Warren, PA 7,957 0.80 5.24 3.68 58.51 19.78 96.04 1.28 0.00 0.00 1,219 12.50 1.24 3.84 0.48 ViewPoint Financial Group, Inc. (1) VPFG Plano, TX 2,942 0.66 5.69 2.82 69.10 18.42 79.25 0.93 6.77 0.94 516 14.81 1.30 1.62 0.24 Oritani Financial Corp. (1) ORIT Township of Washington, 2,587 1.13 4.42 3.36 34.64 35.46 123.03 1.56 3.62 0.94 721 12.99 1.12 3.85 0.50 Heritage Financial Group, Inc. HBOS Albany, GA 1,090 0.39 3.12 3.57 85.50 22.10 64.25 1.32 1.50 1.71 104 11.92 0.87 1.34 0.16 Fox Chase Bancorp, Inc. FXCB Hatboro, PA 1,016 0.45 2.36 3.04 62.81 23.90 100.89 1.77 9.74 1.92 163 12.53 0.87 1.28 0.16 SI Financial Group, Inc. (1) SIFI Willimantic, CT 926 0.34 3.70 3.12 84.19 22.21 93.59 0.78 13.97 1.23 108 10.25 1.41 1.17 0.12 Kaiser Federal Financial Group, Inc. (1) KFFG Covina, CA 856 1.00 6.62 3.49 55.69 21.87 111.55 1.61 15.61 3.00 128 13.38 0.84 2.09 0.28 Oneida Financial Corp. ONFC Oneida, NY 664 0.89 6.68 3.41 78.96 15.62 52.40 1.01 7.96 0.79 66 9.55 1.05 5.03 0.48 Colonial Financial Services, Inc. (1) COBK Vineland, NJ 590 0.67 6.83 3.21 62.66 18.39 63.21 1.09 12.67 1.57 52 12.50 0.75 0.00 0.00 Naugatuck Valley Financial Corporation NVSL Naugatuck, CT 573 0.38 3.10 3.55 70.92 17.13 116.57 1.73 28.83 4.59 49 6.97 0.94 1.72 0.12 Alliance Bancorp, Inc. of Pennsylvania ALLB Broomall, PA 469 0.25 1.37 3.33 71.76 23.10 76.93 1.38 23.66 3.95 62 11.40 1.27 1.75 0.20 Eagle Bancorp Montana, Inc. (1) EBMT Helena, MT 331 0.73 4.50 3.61 67.89 26.19 90.38 0.95 0.00 0.00 39 9.91 0.74 2.88 0.29
Average: 0.62 4.29 3.23 65.40 23.25 91.00 1.21 9.71 1.62 1.03 2.24 0.26 Median: 0.66 4.42 3.36 67.89 22.10 93.59 1.28 7.96 1.23 1.00 1.75 0.24
Note: Data for year end 2011, unless otherwise noted and has been annualized where applicable. NPAs and Loan 90 Days Past Due are adjusted for covered assets CFFN & NWBI have also been included due to their large 2nd step offerings relative to peers Pricing data as of 2/22/12. Data at bank level where information was unavailable at parent level (1) Data as of 9/30/2011
37