Attached files
| file | filename |
|---|---|
| EXCEL - IDEA: XBRL DOCUMENT - POWER SOLUTIONS INTERNATIONAL, INC. | Financial_Report.xls |
| EX-32.2 - EXHIBIT 32.2 - POWER SOLUTIONS INTERNATIONAL, INC. | d280603dex322.htm |
| EX-32.1 - EXHIBIT 32.1 - POWER SOLUTIONS INTERNATIONAL, INC. | d280603dex321.htm |
| EX-31.1 - EXHIBIT 31.1 - POWER SOLUTIONS INTERNATIONAL, INC. | d280603dex311.htm |
| EX-31.2 - EXHIBIT 31.2 - POWER SOLUTIONS INTERNATIONAL, INC. | d280603dex312.htm |
| EX-21.1 - EXHIBIT 21.1 - POWER SOLUTIONS INTERNATIONAL, INC. | d280603dex211.htm |
Table of Contents
UNITED STATES
SECURITIES AND EXCHANGE COMMISSION
Washington, D.C. 20549
FORM 10-K
| x | ANNUAL REPORT PURSUANT TO SECTION 13 OR 15(d) OF THE SECURITIES EXCHANGE ACT OF 1934 |
For the fiscal year ended December 31, 2011
OR
| ¨ | TRANSITION REPORT PURSUANT TO SECTION 13 OR 15(d) OF THE SECURITIES EXCHANGE ACT OF 1934 |
For the transition period from to
Commission file number 0-22140.
POWER SOLUTIONS INTERNATIONAL, INC.
(Name of Registrant as specified in its charter)
| Delaware | 33-0963637 | |
| (State or other jurisdiction of | (I.R.S. Employer | |
| incorporation or organization) | Identification No.) | |
| 655 Wheat Lane Wood Dale, IL |
60191 | |
| (Address of principal executive offices) | (Zip Code) | |
Registrant’s telephone number: (630) 350-9400
Securities Registered Pursuant to Section 12(b) of the Act:
None
Securities Registered Pursuant to Section 12(g) of the Act:
Common Stock, par value $0.001 per share
(Title of Class)
Indicate by check mark if the registrant is a well-known seasoned issuer, as defined in Rule 405 of the Securities Act.
YES ¨ NO x
Indicate by check mark if the registrant is not required to be file reports pursuant Section 13 and Section 15(d) of the Act.
YES ¨ NO x
Indicate by check mark whether the registrant (1) has filed all reports required to be filed by Section 13 or 15(d) of the Securities Exchange Act of 1934 during the preceding 12 months (or for such shorter period that the registrant was required to file such reports), and (2) has been subject to such filing requirements for the past 90 days. YES x NO ¨
Indicate by check mark whether the registrant has submitted electronically and posted on its corporate web site, if any, every Interactive Data File required to be submitted and posted pursuant to Rule 405 of Regulation S-T during the preceding 12 months (or for such shorter period that the registrant was required to submit and post such files). YES x NO ¨.
Indicate by check mark if disclosure of delinquent filers pursuant to Item 405 of Regulation S-K is not contained herein, and will not be contained, to the best of registrant’s knowledge, in definitive proxy or information statements incorporated by reference in Part III of this Form 10-K or any amendment to this Form 10-K. x
Indicate by check mark whether the registrant is a large accelerated filer, an accelerated filer, a non-accelerated filer or a smaller reporting company. (Check one):
| Large accelerated filer | ¨ | Accelerated filer | ¨ | |||
| Non-accelerated filer | ¨ (Do not check if a smaller reporting company) | Smaller Reporting Company | x | |||
Indicate by check mark whether the registrant is a shell company (as defined in Rule 12b-2 of the Exchange Act).
¨ YES x NO
The aggregate market value of the voting stock held by non-affiliates of the registrant as of June 30, 2011 (the last business day of the registrant’s most recently completed second fiscal quarter) was $1,675,000, based on the average of the bid and ask price on the OTC Bulletin Board on June 30, 2011 (although the total market capitalization of the registrant as of such date was approximately $23,424,931). Shares of the registrant’s Common Stock held by each executive officer and director and by each person who holds 10% or more of the outstanding Common Stock have been excluded in that such persons may be deemed to be affiliates. This determination of affiliate status is not necessarily a conclusive determination for other purposes.
As of March 20, 2012, there were 9,064,537 outstanding shares of the common stock, par value $0.001 per share, of the registrant.
Table of Contents
| Page | ||||||
| PART I | ||||||
| Item 1. | 3 | |||||
| Item 1A. | 23 | |||||
| Item 1B. | 39 | |||||
| Item 2. | 39 | |||||
| Item 3. | 39 | |||||
| PART II | ||||||
| Item 5. | Market for Registrant’s Common Equity, Related Stockholder Matters and Issuer Purchases of Equity Securities | 39 | ||||
| Item 6. | 41 | |||||
| Item 7. | Management’s Discussion and Analysis of Financial Condition and Results of Operations |
41 | ||||
| Item 9. | Changes in and Disagreements with Accountants on Accounting and Financial Disclosure |
55 | ||||
| Item 9A. | 55 | |||||
| Item 9B. | 56 | |||||
| PART III | ||||||
| Item 10. | 56 | |||||
| Item 11. | 59 | |||||
| Item 12. | Security Ownership of Certain Beneficial Owners and Management and Related Stockholder Matters |
61 | ||||
| Item 13. | Certain Relationships and Related Transactions, and Director Independence |
62 | ||||
| Item 14. | 68 | |||||
| PART IV | ||||||
| Item 15. | 68 | |||||
2
Table of Contents
Cautionary Note Regarding Forward-Looking Statements
This report includes forward-looking statements that reflect our expectations and projections about our future results, performance, prospects and opportunities. These statements can be identified by the fact that they do not relate strictly to historical or current facts. We have tried to identify forward-looking statements by using words such as “anticipate,” “believe,” “could,” “estimate,” “expect,” “intend,” “may,” “plan,” “project,” “potential,” “should,” “will,” “will be,” “would” and similar expressions, but this is not an exclusive way of identifying such statements. Our actual results, performance and achievements may differ materially from those expressed in, or implied by, the forward-looking statements contained in this report as a result of various risks, uncertainties and other factors, including those described above under the heading “Risk Factors” and elsewhere in this report.
Forward-looking statements speak only as of the date of this report. Except as expressly required under federal securities laws and the rules and regulations of the SEC, we do not undertake any obligation to update any forward-looking statements to reflect events or circumstances arising after the date of this report, whether as a result of new information or future events or otherwise. You should not place undue reliance on the forward-looking statements included in this report or that may be made elsewhere from time to time by us, or on our behalf. All forward-looking statements attributable to us are expressly qualified by these cautionary statements.
References in this Form 10-K to “we,” “us,” “our” and “our company” refer to Power Solutions International, Inc. and its subsidiaries.
Company Overview
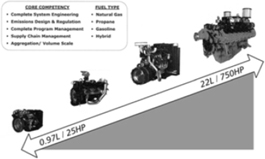
We are a global producer and distributor of a broad range of high performance, certified low emission, power systems for original equipment manufacturers of off-highway industrial equipment. Our customers include companies that are large, industry-leading and/or multinational organizations, and we are a sole source power systems provider for most of these customers. Our power systems are highly engineered, comprehensive systems which, through our technologically sophisticated development and manufacturing processes, including our in-house design, prototyping, testing and engineering capabilities and our analysis and determination of the specific components to be integrated into a given power system (driven in large part by emission standards and cost restrictions required, or desired, to be met), allow us to provide to our customers power systems customized to meet specific industrial OEM application requirements, other technical specifications of customers and requirements imposed by environmental regulatory bodies. Our power system configurations range from a basic engine block integrated with appropriate fuel system components to completely packaged power systems that include any combination of cooling systems, electronic systems, air intake systems, fuel systems, housings, power takeoff systems, exhaust systems, hydraulic systems, enclosures, brackets, hoses, tubes and other assembled componentry. We generally obtain the engines which we integrate into our power systems from third party suppliers. Of the other components which we integrate into our power systems, a substantial portion consists of internally designed components and components for which we coordinate significant design efforts with third party suppliers, with the remainder consisting largely of parts that we source off the shelf from third party suppliers. Some of the key components (including all of the engines) embody proprietary intellectual property of our suppliers. As a result of our design and manufacturing capabilities, we are able to provide to our customers a comprehensive power system which can be incorporated, using a single part number, directly into a customer’s specified application. Capitalizing on our expertise in developing and manufacturing emission-certified power systems and through our access to the latest power system technologies, we believe that we are able to provide complete “green” power systems to industrial OEMs at a low cost and fast design turnaround.
Our power systems are primarily spark-ignited, running on alternative fuels such as natural gas and propane. We design, develop, manufacture, distribute and provide after-market support for our power systems for industrial OEMs in a wide range of industries with a diversified set of applications. Our power systems are used in stationary electricity generators, oil and gas equipment, forklifts, aerial work platforms, industrial sweepers, arbor equipment, agricultural and turf equipment, aircraft ground support equipment, construction and irrigation equipment, and other industrial equipment. For these applications, our low-emission, alternative fuel power systems, which range in size from under 1 liter to over 22 liters and meet, and in many cases produce emissions at levels significantly lower than those currently required by, emission standards of the EPA and CARB, represent a cleaner, and typically less
3
Table of Contents
expensive, alternative to diesel fuel power systems. In addition, while our power systems primarily run on alternative fuels, we also supply low-emission standard fuel (such as diesel) power systems and are in the process of developing hybrid power systems. In the markets in which our diesel and alternative fuel power systems compete, substantially all of the engines are water-cooled (as opposed to air-cooled), multi-cylinder engines.
Under a distributor agreement with Perkins, a wholly-owned subsidiary of Caterpillar, packaging and distribution agreements with Caterpillar engine dealers and our association with Caterpillar, we are one of the largest suppliers of Perkins and Caterpillar diesel power systems under 275 horsepower. This makes us a prominent supplier of EPA and CARB emission-certified diesel power systems to the industrial OEM marketplace. As we do for our alternative fuel power systems, we supply components for, and apply our sophisticated application engineering and design services to, these Perkins and Caterpillar power systems in a wide range of industrial applications. We believe that the 12-state territory covered by these distribution agreements presents us with the opportunity to capitalize on the majority of all diesel industrial OEM opportunities in the United States.
Building upon our experience in developing emission-compliant power systems, and with a view to serving our customers’ needs regarding emissions compliance, we are also developing a range of hybrid power systems. We plan to apply technology from our existing green power systems and our application expertise to provide tailored, cost-efficient, emission-compliant hybrid power systems to the industrial OEM marketplace, both domestically and internationally.
We expect that growth in domestic sales of our low-emission power systems will be driven by the substantial breadth of our emission-certified products, as well as increasing U.S. demand for alternative fuel power systems resulting from the adoption of increasingly stringent engine emission regulations. Additionally, we are seeing increasing demand for our power systems from international industrial OEMs, most significantly in Asia, that manufacture industrial equipment for the U.S. import market.
In addition to our emission-certified power systems, we also produce and distribute non-emission-certified power systems for industrial OEMs for particular applications in markets which do not currently maintain emission standards for those applications (for example, oil and gas equipment used in Canada). Approximately 59% of our net sales in 2011 consisted of sales of emission-certified products, with approximately 49% of our 2011 net sales consisting of sales of emission certified products for which we hold the applicable regulatory certification and approximately 10% of our 2011 net sales consisting of sales of diesel power systems for which the diesel engine supplier holds the applicable regulatory certification. Approximately 12% of our net sales in 2011 consisted of sales of aftermarket parts and the remaining approximately 29% of our net sales in 2011 consisted of sales of our non-emission-certified power systems.
Industry and Market Overview
Industrial OEM Market
The off-highway industrial OEM market represents a diversified set of applications and industry categories that include power generation, oil and gas, material handling, aerial work platforms, sweepers, arbor, welding, airport ground support, agricultural, turf, construction and irrigation. While the power system requirements for the industrial OEM market bear similarities to the requirements for power systems used in automotive applications, there are substantial application differences between automotive and industrial equipment applications. Torque, start, stop, low speed and, with respect to certain applications, indoor use requirements make direct use of an automotive power system impractical for use in most industrial equipment applications. Recognizing these differences, the EPA and CARB have issued distinct emission standards and regulations for industrial applications,
4
Table of Contents
as compared to those for automotive applications. As a result, there is not a direct cross-over of available automotive power systems into the industrial OEM market. Power systems used in the industrial OEM market must satisfy these emission standards through a certification process with the EPA and CARB that includes durability testing of the engine emission system at zero and 5,000 hours, production line testing on a quarterly basis and field compliance audit testing. Given the level of engineering and financial resources that automotive engine manufacturers would need to dedicate to supply EPA emission-certified product into this industrial OEM marketplace, and that this marketplace does not represent a core business for these manufacturers, it is generally impractical for automotive engine manufacturers to compete in the industrial OEM marketplace.
Industrial OEM power systems use internal combustion engines (both diesel and spark-ignited), as well as electric motors. Diesel engine systems, which use compression to initiate ignition to burn fuel, in contrast to spark-ignited engine systems which use a spark plug to initiate the combustion process, currently represent the dominant power systems, depending on the specific industrial application involved. For example, diesel powered equipment is generally used in outdoor industrial applications, while electric motors and alternative fuel, spark-ignited power systems are used for indoor industrial applications where carbon monoxide and air quality issues must be addressed. Both diesel power systems and electric motors have significant limitations. Diesel power systems present unique emission compliance challenges, while electric motors are often not feasible alternatives in industrial applications as a result of limitations on battery storage capacity. These challenges present opportunities to increase demand for spark-ignited power systems within the industrial OEM marketplace.
Market Trends
The market for our power systems is continuing to grow globally as a result of several key drivers.
Increasingly Stringent Regulations and Growing Efforts to Reduce Emissions
Concerns regarding climate change and other environmental considerations have led to implementation of laws and regulations that restrict, cap or tax emissions in the automotive industry and throughout other industries. While emission standards vary significantly around the world, such standards have become increasingly more stringent. Over the last several years in particular, there has been a significant increase in regulation of off-highway equipment emissions. Industrial OEMs have experienced pressure to redesign their products to address these emission regulations, as products that are unable to meet emission standards may not be sold in the marketplace. However, we believe few suppliers to industrial OEMs have been capable of providing, or are willing to make the investments of time, financial, and other resources necessary to provide products that meet new EPA and CARB requirements.
Increased EPA and CARB emission regulations associated with diesel power systems taking effect over the next several years are expected to increase both the cost and product footprint (in other words, the size of the power system) of diesel power products. Internal combustion engines generally produce emissions of carbon monoxide, unburned hydrocarbons (organic compounds consisting entirely of hydrogen and carbon that can be emitted as a result of incomplete fuel combustion and fuel evaporation), and oxides of nitrogen (highly reactive gases formed when oxygen and nitrogen in the air react with each other during combustion), and diesel engines produce particularly high levels of these pollutants. In addition, diesel engines produce particulate matter, which is among the areas of focus of these emission regulations. In 2004, the EPA adopted rules introducing Tier 4 emission standards which significantly reduce permitted emissions of oxides of nitrogen and particulate matter, and restrict hydrocarbon emissions, for off-road diesel engines of various sizes. The most recent standards adopted were initially implemented in 2008 and will continue to be phased in through 2015. As an example of the increasingly stringent standards to which diesel engines are subject, in 2012 permitted levels of particulate matter for nonroad diesel engines will be reduced by approximately 90% from 2009 permitted levels. As a result, manufacturers and suppliers of diesel power systems, in comparison to spark-ignited and hybrid power systems, face greater challenges in complying with the new emission regulations. A manufacturer of diesel power systems must expend significant resources to develop a compliant power system, often through incorporation of additional components into a power system to reduce levels of particulate and other emissions. This can be a lengthy and expensive process. Based upon our experience with customers and suppliers, and on additional information provided by Power Systems Research, Inc., industrial OEMs are experiencing cost increases of between 30% and 100% for a comprehensive diesel power system with combustion and aftertreatments incorporated to satisfy the new requirements. Furthermore, these emission regulations will create not only a cost but also a footprint disadvantage for a diesel power system, when compared to a spark-ignited, emission-certified power system.
5
Table of Contents
Additionally, countries outside of the United States have historically adopted emission regulations aligned with those of the U.S., and accordingly, it is anticipated that regulations comparable to current and future EPA and CARB emission regulations will be implemented internationally. For example, recently implemented policies in Europe, generally referred to as Stage I, II, III and IV regulations, regulate emissions of off-road mobile equipment. Similar to emission regulations in the U.S., these regulations in Europe call for reductions in emissions of hydrocarbons, oxides of nitrogen and particulate matter, to be phased in over a period of time. If foreign jurisdictions continue to adopt emission regulations consistent with those of the U.S., it is expected that the international industrial OEM market will experience similar pressures to use cost effective, emission-certified power systems.
Increased Use of Alternative Fuels
As a result of economic considerations, the drive for energy independence and the widespread availability of alternative fuels such as natural gas and propane, in addition to environmental concerns, the market for alternative fuel technology continues to grow. We believe that providers of industrial equipment in industrial OEM categories, such as power generation, that rely significantly on coal, diesel fuel and gasoline, will face increasing pressure to use alternative fuel power systems.
In the United States, significant domestic alternative fuel reserves have been identified. These reserves include the Marcellus Gas Shale, with estimated resources recoverable using current technology of approximately 84 trillion cubic feet of natural gas, and the Bakken Formation of the Williston Basin Province, Montana and North Dakota, with estimated undiscovered volumes of 3.65 billion barrels of oil, 1.85 trillion cubic feet of natural gas in the oil and 148 million barrels of natural gas liquids. It is believed that the alternative fuel reserves identified in the United States could satisfy much of the energy needs of the U.S. for many years.
Additionally, the infrastructure supporting alternative fuel in the United States continues to expand. Further, the United States and some other countries have taken action to increase demand and support for alternative fuels, in an effort to reduce dependence on imported oil, capitalize on domestic natural gas reserves and reduce emissions from diesel engines. For example, the EPA has provided subsidies in the form of grants and other financing programs for the advancement of alternative fuel technologies (to date directed primarily towards on-road vehicles). Additionally, industry organizations, such as the Propane Education and Research Council, an organization authorized by the U.S. Congress with the passage of the Propane Education and Research Act, award grants to a wide variety of institutions, universities, and government organizations for the continued research, development, demonstration and commercialization of alternative fuel technologies.
Industrial OEM Trend Toward Outsourcing
Industrial OEMs have been following the broader marketplace trend of outsourcing non-core functions. The dynamics of global sourcing and the need for cost competitiveness have led, and should continue to lead, industrial OEMs to assess what operations and system components are core to their business model and what they should outsource to their suppliers and partners. In particular, to comply with frequently changing environmental regulations while remaining competitive, industrial OEMs have been increasingly more reliant on outsourcing to third party suppliers and partners with specialized regulatory and design expertise. By looking to outside sources for power systems, power system components and subsystems, industrial OEMs are able to focus their resources on overall design and functionality of their products, rather than on developing the sophisticated technology associated with emission-certified power systems. We expect increasingly more industrial OEMs to outsource power systems, system components and subsystems to third party suppliers with the requisite experience and technology.
Penetration by International Suppliers into Regulated Markets
The implementation of emission regulations domestically and in non-U.S. markets also impacts international suppliers of industrial equipment products outside these regulated markets. International industrial OEMs that supply into regulated industrial OEM markets, including those already doing so and those recognizing emerging opportunities to sell their products into these markets, must meet applicable emission requirements, like those imposed by the EPA and CARB in the U.S. For example, Chinese and other Asian suppliers have recognized that, in order to effectively penetrate and sell into emission regulated industrial OEM markets like North America and Western Europe, their products must be emission-certified. These international industrial OEMs generally lack the regulatory and design expertise necessary to develop their own emission-certified power systems. Furthermore, they recognize that, even if they had or could acquire the relevant expertise, it can be much less time consuming and much more cost-effective for them to acquire compliant power systems from third-party suppliers, rather than internally developing and manufacturing their own solutions. Accordingly, just as domestic industrial OEMs are outsourcing this function, so too are international industrial OEMs, and we expect this trend to continue.
6
Table of Contents
Growing Demand for Sophisticated Electronic Technology and Automotive Grade Quality Standards
Demanding automotive grade quality, as well as on-time delivery, has become standard practice in the industrial OEM marketplace. Consistent with the trend in the automotive industry, the level of technology and sophistication, including electronic controls, associated with industrial OEM power systems has advanced significantly to meet the growing demand for improved quality, reliability and performance. This has led to an ongoing reduction in the number of suppliers capable of supporting such product requirements.
Our Competitive Strengths
We have a 26-year history and reputation as a proven supplier of cost-effective, technologically advanced products to the industrial OEM marketplace. We believe that our technological superiority and the comprehensive nature of our product offerings position us to capitalize on developing trends in the industrial OEM markets and drive significant future growth.
Our Deep and Broad Array of Green Product Offerings
Alternative Fuel Power Systems
Our power systems represent a broad range of EPA and CARB emission-certified, alternative fuel products for industrial applications in the world. We are one of only a few providers of industrial OEM products that meet, and in many cases produce emissions at levels significantly lower than those currently required by, current emission standards of the EPA and CARB. We also provide advanced, standardized fuel system and component technology across our entire range of emission-certified products, using a common fuel system and electronic controls on most of our power systems. As a result, our OEM customers are able to focus internal engineering and technical support resources, and train their personnel, on one standardized fuel system and one set of electronic controls employed throughout the range of power systems they acquire from us, and are able to reduce their product design and ongoing product support costs.
Our existing capability to provide a large range of emission-certified, alternative fuel products strategically positions us to capitalize on the cost and packaging disadvantage associated with diesel power systems that will result from increased EPA and CARB emission regulations scheduled to take effect over the next several years. Given the existing dominance of diesel power systems in the industrial OEM marketplace, even a minor shift in the marketplace from diesel to spark-ignited, alternative fuel power systems will represent a significant growth opportunity for us.
Additionally, as international OEMs desire to supply industrial equipment products into the United States that must meet required EPA and CARB emission requirements, we provide a fast, certain, cost-effective route for these foreign industrial OEMs to meet these emission requirements. Specifically, because we own the EPA and CARB compliance certificates specific to our power systems, we provide foreign industrial OEMs with immediate access to EPA and CARB compliant power systems through our lineup of emission-certified product and application engineering capabilities. We have already secured commercial sales relationships with some of Asia’s largest industrial OEMs, and have begun supplying EPA and CARB compliant power systems to these industrial OEM customers for incorporation into their product lineups.
Furthermore, because we expect countries outside of the United States to implement emission regulations that are aligned with current and future U.S. emission standards, we anticipate an opportunity to further diversify and supplement our customer base with industrial OEMs that supply products outside of the U.S. If such emission regulations are implemented consistent with our expectation, we anticipate being able to provide power systems to industrial OEMs that meet applicable foreign emission standards, leveraging our technology and experience in developing our EPA and CARB emission-certified products.
In summary, we represent a “one-stop” power system solution for industrial OEMs desiring to meet the growing demands for green products with reduced emissions across their entire range of products. As such, we believe we are in a prime competitive position to continue to grow market share domestically, as well as internationally.
7
Table of Contents
Hybrid Power Systems
We believe that, as increased emission standards are implemented, our existing OEM customers and other industrial OEMs may explore power system alternatives to stand-alone combustion engines. Accordingly, in addition to alternative fuel power systems, we are developing hybrid power systems that address future emission standards and today’s environmental and cost related concerns, with the ability to operate over an extended range. We are developing versatile hybrid powertrain units for the industrial OEM market, and expect to be able to integrate our hybrid power systems within the powertrain as a parallel system, which is coupled with a traditional hydraulic pump or transmission, or series system, which is used to provide extended on-board electrical power to an electric drive system. We believe that our hybrid power systems will reduce fuel costs, increase torque and increase productivity of the power system. Additionally, our hybrid power systems are being designed to produce low levels of noise and exhaust emissions and excellent fuel economy. These systems should also enable customers to downsize current engine displacements (in other words, get the same power out of smaller engines).
Capitalizing on our extensive experience in developing both short and long term green power systems, we will be able to accurately specify the proper engine size, battery and voltage range, along with the proper integrated hybrid system and engine management controls for a specific industrial application. We believe our ability to provide fully integrated hybrid powertrain systems to our industrial OEM customers will be an advantage over our competitors and strengthen our ability to meet the alternative power system needs of industrial OEMs in the future.
Our Deep Market Penetration and Strong and Diverse Customer Base
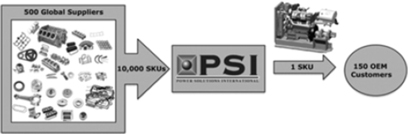
Through industrial OEMs outsourcing component products to us, we are able to take advantage of opportunities for component standardization across industry categories, while still providing each industrial OEM with the flexibility to customize as required for particular design and application specifications. We aggregate our product development efforts, and can amortize associated costs, over our large and diverse OEM customer base and across industry categories. Furthermore, we capitalize on volume, economies of scale and global supply opportunities when sourcing component products. We can, therefore, provide our OEM customers with lower cost structures than they would otherwise be able to achieve and help them reduce their part numbers and supply base by consolidating their procurement and assembly efforts down to a single part number product supplied by us. Our component sourcing relationships further enable our OEM customers to recognize resource reductions, inventory reductions and engineering support advantages.
Additionally, our relationships with international OEM customers that supply their industrial equipment into the United States generate opportunities for us to further supplement our business. We believe that, once one of our emission-certified power systems is engineered into a foreign industrial OEM’s product, that OEM is likely to also incorporate our power systems into its products that do not require emission-compliant power systems. This use by foreign industrial OEMs of our power systems for both their emission-certified and non-emission-compliant power system needs reduces ongoing engineering, aftermarket and field service support requirements, while supporting a product strategy that can easily be adjusted to any future worldwide changes in emission requirements. These relationships further provide us with growth opportunities beyond those dependent upon U.S. demand for emission regulated products, and solidify our supplier and partnership position with our foreign industrial OEM customers.
Moreover, even if our relationship with an international OEM customer is limited to United States compliant power systems, we are in an opportune position to provide additional emission-compliant power systems in the future, as emission regulations for industrial equipment begin to emerge in other countries around the world. Given our established expertise and worldwide presence, we provide a cost effective strategy to meet emerging emission regulations for both domestic and foreign industrial OEMs that can continue to benefit from our emission expertise and aggregation capabilities.
8
Table of Contents
Our Superior Technology
We are a recognized leader in providing industrial OEMs with highly engineered, technologically superior, emission-certified power systems that cover a wide range of possible fuel alternatives. Rather than dedicating the significant resources necessary to develop the in-house capabilities to design and manufacture technologically sophisticated, emission-certified power systems for their products, our OEM customers are able to take advantage of our proven power system technology, our application engineering expertise, the broad range of our EPA and CARB emission-certified power systems and our industrial equipment testing and certification processes. By using our emission-certified, technologically sophisticated power systems, our OEM customers recognize potentially significant cost reductions. They are able to focus their efforts on the development of operations and system components core to their business, without having to expend considerable resources associated with the emission certification process, which requires potentially years to perform durability testing of the engine emission system at zero and 5,000 hours, production line testing on a quarterly basis and field compliance audit testing, each of which is mandated and regulated by the EPA and CARB.
The level and range of our EPA and CARB emission-certified product offering further demonstrates the strength of our technology. Our emission-certified products meet all current existing emission standards of the EPA and CARB. We are able to maintain and enhance our position as a supplier of technologically sophisticated, emission-certified power systems through our experienced and technologically savvy team of application engineers. This team gives us the ability to support and integrate our power systems into a significant number of industrial OEM applications. We believe that our continued recruitment and development of talented personnel will augment our ability to stay ahead of emerging technologies in the industrial OEM marketplace.
Further, we are not captive to our own internal manufactured components and technology. Unlike some of our competitors that focus on developing and manufacturing most of their own product technology and components, we believe that superior technology is derived from having the flexibility to incorporate the best proven technology available in the marketplace. We focus on developing deep internal engineering and application expertise, more than on developing in-house components and technology. This affords us the flexibility to capitalize on current and emerging technology that best meets the requirements of any given application, as opposed to only using internally-developed technology that might not provide the best solution. Because we do not directly compete in the development of key technology, suppliers of underlying technology are interested in supplying their latest innovations to us. As a result, we believe we have access to the best proven technology in the marketplace. We believe this strategy puts us in a strong position to benefit from our significant OEM customer base and aggregation capabilities in order to provide the best available product and technology solutions for our OEM customers.
Our Dedicated Customer-centric Product and Application Expertise
We have a customer-centric business focus. We commit our attention and efforts first on solidifying and expanding relationships with our existing customers by staying connected with our customers, being aware of challenges they face and understanding their evolving needs. Through our extensive experience in the industrial OEM marketplace and our adaptive technology strategy that we use in developing our power systems, we accept the specific requests of our individual customers and provide tailored power systems to their power system needs. We believe that satisfaction of our current customers’ needs helps generate new opportunities for us to expand our market presence and obtain new business. In addition, we are always looking for opportunities that may develop into new customer relationships.
Our goal is to be not only a leader in technology, but also a leader in customer satisfaction at all levels of customer interaction. Our product and application experience and expertise extends beyond our extensive design, prototyping, testing and application integration engineering capability. Our entire team, from production personnel to our customer support staff, is highly experienced in both the products we sell and the OEM customer applications into which they are integrated. This experience is derived from both industry experience with industrial equipment and formal training.
We assign a customer support engineer, holding an engine technology degree, to each of our OEM customers. Each customer support engineer provides dedicated application support for our OEM customers, providing a direct line of communication between the OEM’s manufacturing line and our production operations. Our quality, field service support and service operations have similar capabilities and provide knowledgeable and responsive support to our OEM customers at every point of customer interface.
9
Table of Contents
Growth Strategy
Our core strategy is to develop comprehensive power systems for the industrial OEM marketplace. We believe that, with our competitive advantages, our continued pursuit of our core strategy will drive growth in our business. More specifically, we intend to seek future growth as follows:
Expand Products and Services Provided to Existing OEM Customers
We are continually working to capitalize on organic growth opportunities, building upon our strong existing customer relationships, which in many cases are on a sole source basis. We plan to expand our business with our existing customers, including through the natural expansion of the products and services we supply to them, as their own businesses grow, their product lines evolve and they use our power systems throughout their product lines. As economic conditions improve and our existing OEM customers’ businesses and product lines expand, including into new market categories, we expect to continue to satisfy all of their emission-compliant, power system needs across their entire range of products. We continue to build upon our current range of emission-certified power systems, including further broadening our range of alternative fuel power systems and developing our hybrid power systems, positioning us to offer comprehensive green power systems that meet the emerging needs of our existing OEM customers.
Establish New Industrial OEM Relationships
We expect to strengthen our OEM customer base by developing new relationships with industrial OEMs. We seek to acquire new clients and gain new business from OEMs that we do not presently serve by focusing our marketing efforts toward these potential customers and capitalizing on our reputation, the depth, breadth and technological sophistication of our power systems, our commitment to customer service and the cost savings we can offer, to develop these new relationships. Emphasizing our experience and reputation in market categories in which our power systems are already well-established, such as power generation, we focus on establishing new industrial OEM relationships in these market categories, thereby capturing an increasingly greater share of the market opportunity in these industrial OEM categories.
We aim to establish new relationships with, and supply our emission-certified power systems to, OEMs in a variety of industrial OEM market categories. In particular, we target expanding our OEM relationships in high-growth market categories, such as oil and gas applications, while maintaining and enhancing our penetration in market categories that are growing more slowly. As we gain traction in emerging industrial OEM categories that did not previously represent significant opportunities for our power systems, we plan to further focus our efforts on potential customers in those categories.
Expand Into New Geographic Markets
We plan to increase our penetration of international markets, expanding our business with existing and international OEM customers by satisfying their needs for EPA and CARB emission requirement compliant power systems for use in products sold in the U.S. and for non-compliant systems for use in products sold outside the U.S. Additionally, with our expertise in developing comprehensive, integrated green power systems, our expanding worldwide presence and our ability to provide beneficial cost structures to our customers as a result of our aggregation capabilities, we intend to take advantage of increases in demand for emission-compliant industrial OEM power systems from industrial OEMs that sell into international markets, as emissions regulations emerge in those markets.
Expand Into On Road Market
We are introducing a newly designed 8.8 liter, state-of-the-art fuel flexible engine that we plan to sell to industrial, bus and truck OEMs which will be a fully-integrated drop-in solution. We expect this engine to be a solution in the industrial off-road and on-road markets and have a wide range of applications, including school buses, waste-hauling trucks and light-duty delivery trucks.
Develop New Products
By leveraging the deep industry experience of our engineering and new product development teams, we are working to broaden the range of our power system product offerings, including with respect to engine classes and the industrial OEM market categories into which we supply our products. We capitalize on our technologically sophisticated, in-house design, prototyping, testing and application engineering capabilities to further refine our superior spark-ignited power system technology. We plan to apply our experience and expertise in developing comprehensive, integrated green power systems to expand our spark-ignited alternative fuel offerings and further develop our hybrid power systems. We also plan to develop new, complementary product offerings, such as MasterTrak, our telematics tool that we offer bundled with our power systems, as well as on a stand-alone basis, to our OEM customers and other businesses.
10
Table of Contents
Selectively Pursue Complementary Strategic Transactions
We may enter into strategic transactions, such as acquisitions of, or joint ventures or partnerships with, companies that present complementary non-organic growth opportunities. Specifically, we will seek opportunities that extend or supplement our presence into new geographic markets or industrial OEM market categories, expand our customer base, add new products or service applications or provide significant operating synergies. We believe that there may be domestic or international strategic opportunities available to us as the sophistication of technology and amount of resources necessary to develop and supply power systems that meet increasingly stringent emission standards continue to increase.
Company History
Founded in 1985, we sought to break the then-prevalent OEM focus on the diesel engine as a commodity by providing value-added engineering, procurement and packaging of products and services to the industrial OEM marketplace. Because of our expanded product and service offerings, we played a significant role in moving the industrial OEM marketplace from a simple, engine-centric model to a more comprehensive model. This comprehensive power system model includes engineering, procurement and packaging solutions for cooling, electronics, air intake, fuel systems, power takeoff, exhaust, hydraulics and packaging application requirements. Through implementation of our strategy, we grew our diesel power system sales and became one of the largest Perkins diesel power system distributors in the world, a position we still maintain today.
Our desire to expand our product and service offerings, coupled with the success of our strategy in the diesel marketplace, motivated us to move into the marketplace for spark-ignited power systems. From the mid-1990s going forward, we have applied our strategy to spark-ignited gasoline and alternative fuel products. In applying our extensive, prior experience developing power systems for our diesel power system OEM customers to the spark-ignited industrial OEM marketplace, and addressing the growing demand for diesel alternatives as a result of environmental and economic considerations, we have developed a comprehensive range of alternative fuel power systems. As a result, we have become a significant supplier of power systems to prominent OEM customers located throughout North America, with sales to OEM customers located (with location determined based upon the continent to which we ship a product) throughout North America representing approximately 87% of our net sales in 2011. We also sell our power systems to OEM customers located throughout Asia (approximately 12% of our net sales in 2011) and Europe (approximately 1% of our net sales in 2011), in which regions we intend to increase our sales efforts.
On April 29, 2011, The W Group, Inc. completed a reverse acquisition transaction with Format, Inc. (which is now Power Solutions International, Inc.), in which PSI Merger Sub, Inc., a Delaware corporation that was newly-created as a wholly-owned subsidiary of Format, merged into The W Group, and The W Group remained as the surviving corporation of the merger. In that transaction, The W Group became a wholly-owned subsidiary of Power Solutions International, Inc.
Format was incorporated in the State of Nevada on March 21, 2001 for the purpose of providing EDGARizing services to various commercial and corporate entities. Immediately prior to the consummation of the reverse acquisition transaction, Format was engaged, to a limited extent, in EDGARizing corporate documents for filing with the SEC, and providing limited commercial printing services, and had assets that included cash, rights under a services agreement with Format’s sole customer (which agreement was terminated in connection with the reverse recapitalization), a real property lease pursuant to which Format leased its sole office space (which lease was transferred to Ryan Neely, Format’s sole director and executive officer immediately prior to the closing of the reverse recapitalization, in connection with the reverse recapitalization) and depreciated office equipment located in Format’s transferred, leased office space. Due to the nominal operations and assets of Format immediately prior to the consummation of the reverse recapitalization and related transactions, this reverse acquisition transaction was accounted for as a recapitalization.
The reverse recapitalization transaction was consummated under Delaware corporate law pursuant to an agreement and plan of merger. Upon completion of the reverse recapitalization, Format changed its name to Power Solutions International, Inc. All of the outstanding shares of common stock of The W Group held by the three stockholders of The W Group at the closing of the reverse recapitalization converted into an aggregate of 10,000,000 shares of our common stock and 95,960.90289 shares of preferred stock. These shares represented a substantial majority of the shares of our common stock and shares of preferred stock outstanding immediately following the consummation of the reverse recapitalization transaction.
11
Table of Contents
In connection with the reverse recapitalization transaction, Format entered into a stock repurchase and debt satisfaction agreement with Ryan Neely and his wife, Michelle Neely. Pursuant to this agreement, at the time the reverse recapitalization transaction was completed, (1) Format repurchased 3,000,000 shares of Format common stock, representing approximately 79.57% of the shares of Format common stock outstanding immediately prior to the consummation of the reverse recapitalization transaction, from Ryan and Michelle Neely, and (2) Ryan Neely and Michelle Neely terminated all of their interest in, and released Format from all obligations it had with respect to, the loans made by Ryan Neely and Michelle Neely to Format from time to time, in exchange for aggregate consideration of $360,000. In addition, Ryan and Michelle Neely released Format from any obligations Format had to them in respect of any other amounts (including any accrued compensation) that may have at any time owed from Format prior to the closing of the reverse recapitalization. In connection with, but prior to, the closing of the reverse recapitalization, Format used all of its available cash to settle remaining liabilities that Format had prior to the completion of the reverse recapitalization. These included amounts owed to Format’s accountants, independent auditors and legal counsel; provided that Format’s legal counsel agreed to release Format from its obligation to pay a portion of legal fees incurred by Format in connection with the reverse recapitalization and related transactions. Further, in connection with, but prior to, the closing of the reverse recapitalization, Format entered into a termination agreement, pursuant to which Format terminated its services agreement with its sole customer. In connection with, but prior to, the closing of the reverse recapitalization, Format also transferred to Ryan Neely all of its rights and obligations under the real property lease relating to Format’s sole office space.
As a result of the reverse recapitalization, Power Solutions International, Inc. succeeded to the business of The W Group.
Pursuant to the terms of the private placement, we also agreed to consummate, and Format’s board of directors approved, a migratory merger of our company into a Delaware corporation. On August 25, 2011, we held a special meeting of our stockholders at which our stockholders approved the reverse split, the migratory merger and related matters. On August 26, 2011, Power Solutions International, Inc., a Nevada corporation, merged into its wholly-owned subsidiary, Power Solutions International, Inc., a Delaware corporation. Power Solutions International, Inc., a Delaware corporation, continued as the surviving entity of the migratory merger. Pursuant to the migratory merger, we changed our state of incorporation from Nevada to Delaware and each 32 shares of common stock of Power Solutions International, Inc., a Nevada corporation, converted into one share of common stock of the surviving entity in the migratory merger, thereby effecting a 1-for-32 reverse stock split of our common stock. As a result of the migratory merger, (1) Power Solutions International, Inc., a Delaware corporation, acquired all of the rights, privileges and powers, and became subject to all restrictions and duties, of Power Solutions International, Inc., the previously existing Nevada corporation, (2) all liabilities and obligations of Power Solutions International, Inc., the previously existing Nevada corporation, became the liabilities and obligations of Power Solutions International, Inc., a Delaware corporation, as the surviving corporation of the migratory merger and (3) Power Solutions International, Inc., a Delaware corporation, succeeded to the business of Power Solutions International, Inc., the previously existing Nevada corporation.
Further, pursuant to the Certificate of Designation for the Series A Convertible Preferred Stock and the agreement and plan of merger for the migratory merger, and upon the effective date of the migratory merger, each share of preferred stock automatically converted into a number of shares of our common stock equal to $1,000 divided by $12.00, the conversion price then in effect as adjusted for the migratory merger and the reverse split. Any stockholder of our company that was otherwise entitled to a fraction of a share of our common stock (after aggregating all fractional shares of our common stock to be received by such holder) as a result of the migratory merger, received an additional share of our common stock (in other words, the aggregate number of shares of our common stock of a stockholder resulting from the migratory merger was rounded up to the nearest whole number). The authorized shares of our capital stock and the par value of our common stock immediately following the consummation of the migratory merger are identical to the authorized shares of capital stock of Power Solutions International, Inc., a Nevada corporation, and the par value of its common stock immediately prior to the consummation of the migratory merger.
12
Table of Contents
Our Products and Industry Categories
Power Systems for Off-Highway Industrial Equipment
Our power systems are customized to meet specific industrial OEM application requirements. Power system configurations range from a basic engine block integrated with appropriate fuel system components to completely packaged power systems that include any combination of cooling systems, electronic systems, air intake systems, fuel systems, housings, power takeoff systems, exhaust systems, hydraulic systems, enclosures, brackets, hoses, tubes and other assembled componentry.
Our power systems include (1) EPA and CARB emission-certified spark-ignited water-cooled internal combustion engines ranging from 0.97 liters to 22.1 liters, which use alternative fuels and gasoline, (2) non-certified spark-ignited water-cooled internal combustion engines ranging from 0.65 liters to 22.1 liters, which similarly use alternative fuels and gasoline, and (3) emission-certified Perkins engines ranging from 0.5 liters to 7.1 liters, which use diesel fuel. Our diesel and alternative fuel power systems use water-cooled (as opposed to air-cooled), multi-cylinder engines. We are also developing hybrid power systems.
Our products are sold into a diversified set of markets within the industrial OEM industry, including power generation, oil and gas, material handling, aerial work platforms, sweepers, arbor, welding, airport ground support, agricultural, turf, construction and irrigation. Different types of power systems are used within different industry categories (from which we receive varying, unequal amounts of revenues).
Power Generation
We offer EPA and CARB emission-certified power systems, including 0.97 liter to 22.1 liter spark-ignited power systems that use alternative fuels, for stationary emergency and non-emergency power generation products. Emergency engines are stationary engines which operate solely in emergency situations and during required periodic testing and maintenance. Examples include engines used in generators to produce power for critical networks when electrical power from the local utility provider is interrupted, and stand-by engines that pump water in the event of a fire or flood. Non-emergency products include prime power generation products, which produce continuous generation of power for an extended period of time, and peak shaving products, which generate power at times of maximum power demand.
We currently supply our power systems to a substantial number of manufacturers of power generation products. We believe that our customers choose our power systems because of our broad range of emission-certified, spark-ignited power systems for this industry category. Additionally, by using a common fuel system and electronic controls across our range of power systems, we provide our customers with the opportunity to support and train their personnel on one standardized fuel system and one set of electronic controls employed throughout the range of products they acquire from us.
Oil and Gas
The oil and gas market category includes oil field pumps, progressing cavity pumps, and other components and machines used in drilling, evaluation, completion and production of oil and gas assets. Previously, OEMs competing in these markets were generally not concerned about fuel economy, cost of repair or efficiency of operation. Today, however, there is a growing focus in this market category on, and understanding of, the costs associated with down time, the value of fuel savings with more economical solutions and the benefits of using product portfolios with consistent fuel systems and aftermarket support. We believe that these factors will create significant opportunities for our power systems in this market category. Furthermore, we believe that recent discoveries of oil and gas reserves in North America will drive domestic demand for the products of oil and gas OEMs, enhancing our growth opportunities.
We are continuing to develop relationships with oil and gas companies for their well head jacks, compressors and power generators. We believe we are the only provider in this market that supplies pre-certified, as opposed to site-certified, power systems. Site certification is a tedious and costly process for oil and gas equipment OEMs that can take many hours to source components and integrate them into existing fuel system hardware (if even possible).
We also view this market category as an emerging market for our telematics tool, which further differentiates us from our competitors.
Material Handling — Forklift Trucks
The material handling market category includes forklift trucks and other mobile products used for movement, handling and storage of materials within a facility or at a specific location. We provide spark-ignited power systems into the high volume 1.5, 3.5 and 5 ton capacity forklift markets, and may expand production in the future to support the 8 and 10 ton forklift markets in connection with anticipated increases in diesel prices resulting from regulations on diesel engines taking effect through 2015.
13
Table of Contents
Demand is currently strong in the United States for our material handling power systems as a result of emission and OSHA regulations. Based upon data supplied by Power Systems Research, Inc., we believe that, in the United States, nearly 100% of the indoor forklift market uses spark-ignited liquid propane gas or electric powered units (with approximately equal market shares), in contrast to Asian and European forklift markets which currently use diesel in excess of 80% of all applications. In connection with the implementation of pending EPA Tier 4 and European Stage IV regulations, and the resulting price increases related to the compliance of diesel engines with these regulations, we expect foreign markets for spark-ignited liquid propane gas power systems to grow. We expect this growth to drive increased international demand for our power systems.
Aerial Work Platforms
The aerial work platforms market category consists of aerial work platforms, or machines used to provide access to areas typically inaccessible because of their height. Rental companies represent a majority of all purchasers in this industry category. We currently sell our liquid propane gas/gasoline dual fuel power systems to aerial work platform OEMs.
As a result of the increase in diesel engine pricing related to the implementation of EPA Tier 4 regulations, we expect to see an increase in the number of OEMs in the aerial work platforms market which consider our liquid propane gas and gasoline powered power systems as an alternative to diesel powered power systems.
Industrial Sweepers
The industrial indoor sweeper market category consists of machines that clean and sweep various indoor surfaces. The power systems for this market category use both spark-ignited and diesel engines, as well as electric motors. We currently sell our 30 to 80 horsepower liquid propane gas and gasoline power systems to industrial indoor sweeper OEMs. We believe this market category represents a growth opportunity for our hybrid power systems.
Arbor Products
The arbor products market category includes wood chippers and grinders. We currently provide engines to four of the largest OEMs of wood chippers in the United States. We also design and manufacture our own proprietary power take-off clutch, which may be applied to any of our arbor product power systems. See “— Other Engine Power Products — Power Take Off (“PTO”) Clutch Assemblies for Industrial Applications.”
We believe that our diesel power systems maintain a leading position in the market for wood chippers that use water-cooled engines. We believe that diesel regulations scheduled to take effect in the near future will cause EPA Tier 4 diesel engine packages to become more expensive and, as a result, open the market for consideration of our gasoline and other alternative fuel engine packages.
Other Industry Categories
We provide power systems within other industrial OEM markets, including welding, airport ground support, agricultural, turf, construction and irrigation.
Other Engine Power Products
Power Take Off (PTO) Clutch Assemblies for Industrial Applications
We design and manufacture our own proprietary PTO clutch assemblies, which are mechanical components that drive separate power to various parts of a given piece of industrial equipment, for industrial applications. Our PTO clutch assemblies are designed for heavy duty industrial applications.
Customized OEM Subsystems, Kits and Componentry
Through our global sourcing capabilities, we supply engine packaging, subsystems, kits and componentry associated with cooling systems, electronic systems, air intake systems, fuel systems, housings and power takeoff systems, exhaust systems, hydraulic systems and enclosures to industrial OEMs for incorporation into their applications, in addition to the complete engine power systems we provide to these OEMs.
14
Table of Contents
Connected Asset Services
We offer connected asset services through MasterTrak, our telematics tool, which consists of a hardware unit and related services. This hardware unit is integrated into OEM equipment, collects critical data from this equipment and transmits this data back to an OEM, service provider or end-user through wireless telecommunications technology. The services allow our customers to see the data and monitor the performance of their equipment. We provide services to our OEM customers that allow these OEMs and their customers to remain connected to their equipment, even as the equipment is being operated in the field. These capabilities and services are in many respects similar to General Motors Company’s “ONSTAR®” (a registered trademark of OnStar LLC) service. Our MasterTrak offering includes:
| • | GPS for location monitoring, geofencing and directions for rapid service dispatching; |
| • | Automated and continuous remote asset monitoring with automatic alerts and notifications that can be transmitted via e-mail and text messaging; |
| • | Maintenance management, which provides the ability to monitor and provide notice of impending equipment maintenance requirements based on actual equipment utilization (as opposed to random time intervals); |
| • | Real-time, bi-directional communication capability for remote testing and troubleshooting; and |
| • | Extensive web-based monitoring and reporting capability with multi-tiered system security available at all times. |
Through MasterTrak, we provide our OEM customers and their customers the ability to track the location and functional status (including maintenance requirements) of their assets in real-time via web access and automated alerts. These monitoring capabilities provide information regarding the specific utilization characteristics of a connected asset, and allow our customers and their customers to efficiently and proactively schedule service maintenance. These attributes will help reduce unexpected equipment failures, which will help to further reduce the total cost of ownership of a given piece of equipment, and may generate additional sale and service opportunities for the OEM customer.
We offer MasterTrak with our engine power systems as a bundled offering, and also on a stand-alone basis both to our OEM customers and to other businesses to which we do not currently supply our power systems. We have also developed a relationship with SmartEquip, based in Norwalk, Connecticut, to incorporate MasterTrak into SmartEquip’s aftermarket service platform for industry suppliers. This product pairs data regarding failures and faults generated by MasterTrak with OEM-provided recommendations to remedy these faults, and produces a corrective or preventative maintenance solution.
These connected asset services have not yet provided a material portion of our revenues.
Service and Support
Aftermarket and Service Parts
We have extensive aftermarket and service parts programs. These programs consist of: (1) internal aftermarket service parts programs with worldwide sales and distribution capabilities, and (2) internal OEM developed service parts programs for components and products supplied by us. Recently, we have increased our focus on, and investment in, the aftermarket portion of our business. We have grown our industrial spark-ignited engine parts business by employing experts in the gas engine aftermarket field, increasing our investment in global sourcing of parts and expanding parts books and online ordering capabilities. We have also developed stocking programs and maintenance kits that enable OEMs, service dealers and distributors to reduce downtime and increase product use.
We have focused on capturing the aftermarket sales of the value added components that we include in our power systems. With a significant portion of the selling prices of our power systems coming from value added components, this is a large, continuing growth opportunity for our aftermarket business.
Product and Warranty Support
We provide technical support and training to our OEM customers. These services include in-plant training and support through web- and phone- based field service. Our dedicated team of product and application engineers delivers high quality, responsive technical support to our OEM customers. We further support our OEM customers by engaging regional providers to perform warranty service and offer support for our power systems. In general, we reimburse these third-party regional providers for the warranty services that they perform for our power systems.
15
Table of Contents
Customers
Our customers include companies that are large, industry-leading and/or multinational organizations that demand first class engineering support, automotive grade product quality and on-time delivery. We believe that the number of competitors capable of supporting not just the sophisticated technology requirements, but also the world class automotive engineering, quality and delivery requirements emphasized by industrial OEMs is limited. We are solidly positioned to capitalize on the diminishing base of suppliers capable of meeting these increasingly stringent customer expectations. In almost every industrial OEM category, we maintain a supplier relationship with two or more of the largest OEMs in their respective industry category.
Our depth of expertise and broad range of product offerings is the underlying basis for our position as a sole source provider of products to a majority of our OEM customers. We estimate that over 70% of the power systems that we supply are provided to our major OEM customers on a sole-source basis. Our strong customer base, which includes a diversity of customers across industry categories, provides a broad range of opportunities for continued growth.
Our arrangements with our customers, including our relationships with our industrial OEM customers in Asia, generally do not fix, on other than a short-term basis, pricing terms or quantities of our power systems to be purchased and sold and typically do not mandate exclusivity. Purchases are made by customers on a purchase order basis, with pricing of our power systems driven in large part by the volume of power systems purchased by a particular customer and market-based factors, including the price of raw materials and other components incorporated into our power systems, as well as prices for comparable power systems, if any, offered by our competitors.
Our largest customers, based upon our consolidated revenues in 2011, include Bandit, Doosan, JLG, Kohler and Toyota, of which Kohler was the only one that represented more than ten percent of our 2011 consolidated revenues. Our relationships with these customers are all pursuant to terms and conditions substantially similar to the arrangements described above, including the manner in which prices are determined. Our largest customers change from time to time as a result of various factors, including prevailing market conditions, our customers’ strategies (such as their focus on marketing and sales efforts with respect to products into which our power systems are incorporated as compared to their other products) and our customers’ existing inventory of our power systems.
Operations and Research and Development
Design and Engineering / Research and Development
Our research and development efforts are market driven. Our sales team first meets to identify and define market requirements and trends and then communicates that vision to our engineering and new product development groups. Our engineering and new product development groups then review our existing power system portfolio and develop new solutions that build upon the technology within that portfolio. We maintain in-house design, prototyping, testing and application engineering capability, including specialists in EPA and CARB certification, fuel systems, electronics, cooling systems, mechanical engineering and application engineering. Our design and application engineering expertise and capabilities include expertise in (1) emissions compliance, (2) design and development of standardized and customized products for incorporation into industrial equipment, (3) three-dimensional solid modeling and finite element analysis, (4) computer-based modeling and testing, (5) rapid OEM product prototyping, (6) industrial OEM product retrofitting and testing and (7) support for application engineering and system integration.
We also rely upon engineering outsourcing relationships for design, development and product testing that allow us to fulfill demands for specialty services and satisfy fluctuating workload requirements. In particular, since 2009, we have used engineering relationships in India to quickly increase product design, development and testing services as dictated by demands from our industrial OEM customers. We have the ability to increase our outsourcing of these functions to effectively double our internal design, development and testing capabilities to meet our needs. Our arrangements with these outsourcing organizations include general pricing (based upon workers and time devoted to serving us) and other basic terms for services to be provided; however, these arrangements do not require us to engage these engineering outsourcing organizations for a minimum amount (whether in terms of time or number of workers) of design, development or product testing services. Accordingly, we are able to significantly and quickly reduce our use of these relationships as soon as our customer requirements have been satisfied. We require these third-party engineering service providers to treat all design, development and testing information provided to them as confidential. In 2011, these outsourced services accounted for approximately 5% of our research and development expenses. In addition to these engineering outsourcing relationships, where applicable, we also benefit from the design, development and testing capabilities of our supplier base.
16
Table of Contents
We provide the design, durability testing, validation testing and compliance with other engineering and administrative requirements necessary to meet and obtain EPA and CARB certification for a range of spark-ignited engines. As a result, we provide our OEM customers with emission-certified power systems, without these OEMs having to expend considerable research and development time and resources related to obtaining power system certification. We further provide the tools and services necessary to support revalidation and other EPA and CARB requirements that exist beyond the initial emission compliance requirements. As a result of such revalidation, we become the “manufacturer of record,” which is the entity that holds the applicable regulatory certifications for a power system, for the emission-certified power system.
We staff our engineering support activities associated with released product and component sourcing programs with dedicated internal engineering personnel, separate from our product and application development engineering team. This allows us to provide committed engineering and technical attention to internal operational support, customer production support and component sourcing activities, thereby helping to buffer the demands placed on our product and application development engineering group. Through such attention and support, we are able to maximize the focus of our product and application development engineering group on current and future design, prototyping, testing and application development activities resulting in shorter design, prototyping and testing cycles for our OEM customer base.
Our research and development expenditures for our fiscal years 2011, 2010 and 2009 were approximately $4.0 million, $3.0 million and $2.4 million, respectively.
Manufacturing
We currently manufacture our products at our facilities in Wood Dale, Illinois. We customize our power systems to meet specific requirements of industrial OEM applications and the needs of our industrial OEM customers. Our production operations encompass all aspects of manufacturing our power systems, which range from fitting a basic engine block with appropriate fuel system components to building a comprehensive power system that includes any combination of cooling systems, electronic systems, air intake systems, fuel systems, housings, power takeoff systems, exhaust systems, hydraulic systems, enclosures, brackets, hoses, tubes and other assembled componentry.
The manufacturing lines in our production facilities are technologically sophisticated and flexible, and we allocate production capacity on our manufacturing lines to accommodate the demand levels and product mix required by our OEM customers. Our manufacturing lines are equipped with display screens, through which our production personnel are able to monitor design and other technological specifications for each product being assembled on the manufacturing line at that time. The information displayed on these screens is supplied from a central server, which is updated in real-time with all current product information. Through this process, we ensure that the product manufacturing and other specifications used by our production personnel represent the most current information available. We have also developed efficient in-line methods to support specialized product testing, as required by a specific customer or product application.
Our engineering and manufacturing systems use sophisticated, paperless, integrated, software-based management and control systems. Our warehouse systems include computerized management systems and high speed infrastructure such as wire guided racking systems and high density automated carousel systems. We use a dynamic, software-driven inventory management system, which allows us to accurately monitor inventory levels for our comprehensive power systems, subsystems and individual components. We also incorporate within our manufacturing process software that enables us to identify and deliver components and other parts to our OEM customers.
We focus on safety, quality and on-time delivery in our manufacturing operations. We are 9001-2008 ISO Certified, the highest ISO certification available. The ISO 9000 family of quality management standards, which must be met in order to become ISO certified, is designed to help organizations monitor and improve the delivery of products and/or services to their customers. We also use Six Sigma, a business management strategy designed to minimize variability in manufacturing and business processes, 5S, a workplace organization methodology designed to maximize efficiency and effectiveness, and other disciplines in our goal of continuous improvements in quality and on-time delivery. Structured staff training is a constant priority and includes closed-loop quality monitoring and feedback systems.
17
Table of Contents
Supplier Relationships
Engine and Component Suppliers
We have established relationships with suppliers for the engines to be integrated into our comprehensive power systems, the most significant of which are General Motors, Perkins/Caterpillar and Doosan. We also source our other power system components from third party suppliers. We coordinate design efforts with suppliers for some of our key components. In addition, we internally design other parts and components for our products, own the tooling for such parts and components and globally source them from a variety of domestic and global suppliers. Because we design many of our parts and components in-house, we are generally not limited in our choice of suppliers. As such, we are able to select our supplier relationships based upon a supplier’s reliability and performance.
We aggregate our product sourcing efforts across our large and diverse OEM customer base and across industry categories, capitalizing on volume, economies of scale and global supply opportunities. Our OEM customers benefit from the aggregation of our global sourcing, procurement, assembly and packaging services, obtaining cost benefits that they might not obtain if they were to rely on their own internal resources, capabilities and more limited demand requirements. Through this process, industrial OEMs are able to reduce their part numbers and supply base by consolidating their procurement and assembly efforts down to a single part number product supplied by us. We deliver this single assembly to an industrial OEM’s production line as an integrated drop-in to the OEM’s end product.
Arrangements with Key Suppliers
We enter into various arrangements with suppliers from which we source engines and other components which are incorporated into our power systems. These arrangements generally govern the terms and conditions upon which we purchase engines, components and other raw materials for use in our power systems. In general, the prices at which we purchase engines, components and other raw materials are based on market factors, including the prices offered by other suppliers operating in the same market and the prevailing market prices of raw materials. The terms of each of the individual arrangements are negotiated with each supplier on an individual basis, but are generally consistent with typical arrangements between manufacturers and suppliers in our industry.
Under our distribution agreement with Perkins, we are the exclusive distributor of specified Perkins engines within a territory consisting of the States of North Dakota, South Dakota, Minnesota, Wisconsin, Iowa, Michigan, Ohio and Indiana, as well as portions of the State of Illinois, and are a non-exclusive distributor of specified Perkins engines within a territory consisting of the States of Nebraska and Kansas, as well as portions of the State of Missouri. In exchange for this exclusive territory, we are required to purchase from Perkins all of our requirements for the same or similar engines covered by the agreement. As described in further detail below under “Sales and Marketing; Value-Added Resellers; Distribution — Sales and Marketing; Value-Added Resellers,” under the distribution agreement, we are also required to establish a service and support network that provides various services to our customers that purchase power systems which use Perkins engines. This agreement with Perkins is currently scheduled to expire on December 31, 2013.
We are also party to a supply agreement with Doosan, under which we purchase and distribute, on a semi-exclusive basis, specified Doosan engines within a territory consisting of the United States, Canada and Mexico. Under this supply agreement, we are required to purchase from Doosan all of our requirements for the same or similar engines covered by the agreement. We are also required to purchase a minimum number of engines from Doosan during each year that the agreement is in effect and, if we do not meet these purchase requirements, then Doosan may terminate the exclusivity granted under the agreement. This supply agreement with Doosan automatically renews annually for successive one-year periods but may be terminated with six months written notice by either party prior to the end of the term.
Unlike our arrangements with Perkins and Doosan, we do not maintain an exclusive relationship with GM. We receive a pricing package each year (or sometimes more frequently) containing applicable price quotations, as if we operate as an OEM that uses GM engines as a key component of our power systems. Purchases of engines from GM are executed through purchase orders at prices listed in the pricing package under the general terms of sale that GM offers to its OEM customers.
18
Table of Contents
Sales and Marketing; Value-Added Resellers; Distribution
Sales and Marketing; Value Added Resellers
We employ a direct sales and marketing approach to maintain maximum interface with, and service support for, our OEM customers. This direct interface incorporates our internal technical sales representatives. In Asia, we currently complement our direct OEM relationships with a local, independent sales and product support organization. This local sales and support organization provides the necessary knowledge of local customs and requirements, while also providing immediate sales assistance and customer support. In general, we engage third parties to provide local service and support functions for our power systems sold to our domestic OEM customers on a case by case basis, as necessary. Further, as required by our agreement with Perkins, we have also established a service and support network in our 12-state territory that provides various services to our customers that purchase power systems using Perkins engines, including warranty support, servicing of Perkins engines, technical support and parts support (including support for aftermarket parts).
In Europe, we enter into arrangements with third parties, pursuant to which these third parties resell our power systems (in some cases sold with add-on power system components) to European OEM customers. These value-added resellers also provide application and engineering support for these power systems sold in Europe. We currently sell our power systems to value-added resellers in Europe on a similar basis as our sales to our OEM customers. At any particular point in time, we are typically selling our power systems to between one and five value-added resellers in Europe.
Aftermarket Distribution
Our aftermarket and service parts distribution organization consist of three main sales and distribution programs:
| • | OEM Customers With an In-House, Spark-Ignited Product Service Parts Program: For our OEM customers that maintain their own service parts distribution and product support programs, we supply them with the information and component products required to support an effective global OEM customer service parts program. |
| • | OEM Customers Without an In-House Product Service Parts Program: For our OEM customers that do not maintain their own service parts distribution and product support programs, we maintain a web-based and internal sales-oriented global aftermarket and service parts distribution system for our spark-ignited product and ancillary components. Through this product support program that we provide on behalf of our OEM customers, we capitalize on market opportunities that exist outside of those associated with our OEM customer base. |
| • | Perkins Diesel Service Parts Program: We provide Perkins diesel service parts through a network of established service and parts organizations located throughout our 12-state distributor territory, consisting of North Dakota, South Dakota, Minnesota, Wisconsin, Iowa, Michigan, Ohio, Indiana, Nebraska and Kansas, as well as, portions of the states of Missouri and Illinois. |
Intellectual Property
Our business depends, in substantial part, upon our proprietary technology, processes, know-how and other confidential and proprietary information. In particular, we consider portions of our emission certification process to be confidential and proprietary trade secrets. In addition to putting our OEM customers’ engines through initial emission compliance testing, including durability testing, production line testing and field compliance audit testing, we also provide the tools, and perform sophisticated testing and other services, on these engines to comply with EPA and CARB requirements. As a result of the lengthy and technologically sophisticated testing we perform to revalidate these engines, we become the “manufacturer of record” for the emission-certified power system that is incorporated into our OEM customers’ equipment. As the manufacturer of record, we are responsible for compliance with regulations as they relate to our emission-certified power systems (as more fully discussed below under “Government Regulation”). We incur the costs of certification of our power systems, as well as the risk of making sure that these systems remain compliant. Additionally, we use technologically sophisticated development, testing, launching and other manufacturing processes in connection with the manufacturing of our power systems, as well as in coordinating design efforts with power system component suppliers.
In addition, many of the components we source from our suppliers and which are integrated into our power systems embody proprietary intellectual property of such suppliers. To a limited extent, we also license proprietary software, much of which is “off the shelf,” from third parties for use in our manufacturing processes, and we also license and rely upon third party technology included in
19
Table of Contents
our telematics tool. We rely on a combination of trademark, trade secret and other intellectual property laws and various contract rights to protect our proprietary rights, as well as to protect the intellectual property rights of our suppliers and third party licensors. We do not currently own any material patents, but believe that the policies and safeguards we have in place, together with the costs associated with the development, testing, launch and marketing of competitive products, adequately protect our valuable trade secrets and other intellectual property rights.
Competition
We believe we are one of the few providers of comprehensive power systems to the industrial OEM market. However, the market for our products and related services is intensely competitive, subject to rapid change and sensitive to new product and service introductions and changes in technical requirements. Some competitors have longer operating histories, greater name recognition and greater financial and marketing resources. Competition in our markets may become more intense as additional companies enter them and as new technologies are adopted. Generally, we believe that the principal competitive factors for our business include the following:
| • | Completeness and comprehensiveness of power systems; |
| • | Range of power systems employing a common technology platform; |
| • | Emissions regulation (EPA and CARB) compliance and certification; |
| • | Ease of installation; |
| • | Pricing and cost effectiveness; |
| • | Breadth of product offerings, including system power and fuel alternatives; |
| • | Ability to tailor power systems to specific customer needs; |
| • | Performance and quality; and |
| • | Customer support and service. |
We believe that, with our current product lineup and our ongoing research and product development efforts, as well as our global procurement capabilities, we are able to compete effectively based on each of these factors.
Among our competitors are fuel system providers such as Westport Innovations, Inc., Fuel System Solutions and Woodward Governor, Inc. These companies supply engines and engine system componentry into the industrial OEM marketplace. However, we do not believe that any of the other fuel system providers with which we compete are able to provide the single assembly, integrated, comprehensive power systems that our OEM customers demand and that we provide on a cost-effective basis. Further, some of our competitors do not have the internal resources or capabilities to enable them to meet these customer requirements and, in their efforts to compete, sometimes rely upon third party logistic companies to fit and dress engine systems with specific engine parts and components which these competitors are unable to provide themselves. As a result of the changing environment of the marketplace, some fuel system providers have been forced into non-core competency areas and some have exited the marketplace entirely.
Other competitors have been automotive engine companies, but a number have ceased directly supplying power systems to industrial OEMs (although they continue to supply their standard engines and components to producers of power systems for this market). They have left this market primarily because production of emission-compliant and certified industrial engines is not in their core competency areas and because the changing regulations create difficulties for them, as engine life spans are short. More generally, we believe that the significant costs associated with developing and certifying emission-compliant power systems as applicable regulations change have led some companies to exit our markets and have deterred others from entering them.
20
Table of Contents
Government Regulation
Our Products
Our Power Systems
Our power systems are subject to extensive statutory and regulatory requirements that directly or indirectly impose standards governing exhaust emissions and noise. Our power systems are subject to compliance with all current exhaust emissions standards imposed by the EPA, state regulatory agencies in the United States, including CARB, and other regulatory agencies around the world and established for power systems used in off-highway industrial equipment. EPA and CARB regulations imposed on engines used in industrial off-highway equipment generally serve to restrict exhaust emissions, with a primary focus on oxides of nitrogen, hydrocarbons and carbon monoxide. Exhaust emission regulations for engines used in off-highway industrial equipment vary based upon the use of the equipment into which the engine is incorporated (such as stationary power generation or mobile off-highway industrial equipment), and the type of fuel used to drive the power system. Further, applicable exhaust emission thresholds differ based upon the gross power of an engine used in industrial off-highway equipment.
The first EPA emissions regulations adopted for diesel engines, known as Tier 1, applied to diesel engines used in mobile off-highway applications in the U.S., and similar standards for diesel engines, known as Stage I regulations, were implemented thereafter in Europe. The EPA and applicable agencies in Europe have continued to develop emission regulations for diesel engines in the U.S. and Europe, respectively, and have adopted more restrictive standards, with Tier 3 and Stage III regulations currently in effect in the U.S. and Europe, respectively. Recently, the EPA adopted Tier 4 diesel emission requirements, applicable to non-road diesel engines used in industrial equipment. Similarly, Europe has adopted more restrictive standards under its Stage IV regulations. Tier 4 and Stage IV regulations call for reductions in levels of particulate matter and oxides of nitrogen (by approximately 90% from current levels in a majority of power categories under the Tier 4 requirements). The phase-in of Tier 4 regulations commenced for the smallest engines (based on horsepower) at the beginning of 2008, and the final phase-in of Tier 4 regulations for engines of all sizes will be completed in 2015. The phase-in of the Stage IV regulations will commence in 2014 and be completed in 2015. Because we do not sell diesel power systems in Europe, only the Tier 4 regulations will directly impact any of our power systems. With respect to our diesel power systems, Perkins/Caterpillar is responsible for the testing and other manufacturing processes associated with obtaining emission certification for its diesel engines (as well as making sure that these engines remain compliant) which are incorporated into our power systems and, accordingly, is the holder of the applicable regulatory emission certification. As a result, Perkins/Caterpillar is ultimately responsible for modifications to its engines necessary to meet these, and any future, emissions regulations. In part due to the anticipated larger footprint of these modified diesel engines, we will need to make corresponding adjustments to our power systems into which they will be integrated, including through the selection and design of componentry to be incorporated into these power systems.
The EPA and CARB have similarly adopted regulations to reduce pollutant exhaust emissions for spark-ignited engines used in off-road equipment. Similar to standards which apply to diesel engines, these regulations serve to reduce exhaust emissions of hydrocarbon, oxides of nitrogen and carbon monoxide for engines of varying powers and industrial equipment applications. The EPA and CARB further enhanced existing emission regulations, including in 2007 and 2010, by amending existing emission standards and test procedures for large spark-ignited off-road engines, which are engines rated at 25 horsepower or greater, by further restricting exhaust emissions of hydrocarbon, oxides of nitrogen and carbon monoxide.
All of our emission-certified power systems meet existing exhaust emission standards of the EPA and CARB. Failure to comply with these standards could result in adverse effects on our future financial results.
The initial and on-going certification requirements vary by power system application. The process for certain of our exhaust emission certifications is described below.
Pursuant to the regulations of the EPA and CARB, we are presently required to obtain emission compliance certification from the EPA and CARB to sell our power systems generally throughout the United States and in California. The emission compliance and certification process begins with the planning and development of a base fuel and emission control system technology, which may be used as a platform that can be applied to the range of power systems requiring certification. The development of this platform generally begins approximately 18 months prior to the onset of the exhaust emission standard implementation date. A complete fuel and emission controls system platform is comprised of fuel handling, trimming and transport components, electronic engine controller, sensors and exhaust after-treatment technology. The process involves developing the system to meet the requirements of the environmental regulatory agencies, as well as industry expected quality standards and other commercial expectations, all at a cost that will allow us to sell our power system at a competitive market price.
21
Table of Contents
After the base technology has been developed, the next step in the certification process is long-term emission durability testing. This testing involves configuring an engine and testing it for the regulated emission useful life as established by the regulatory agencies. Currently, this useful life is 5,000 hours of use. The test is conducted by installing a power system on a dynamometer, a machine that measures power, and testing its exhaust emissions at zero hours (when an engine produces stabilized emissions at an undeteriorated emission level) and then every 500 hours over a regulatory specified test cycle for the complete useful life. The deterioration of emissions (in other words, the change in emissions from zero hour to the end of an engine’s useful life) is established by this test which takes approximately six to nine months to complete. Applicable regulations require a manufacturer of record to predict emission levels at the end of the engine’s useful life. Accordingly, we develop the base technology and system to ensure that the end of useful life requirements will be met, as the lead time between the issuance of the new regulations and the effective date does not allow for multiple testing due to a failure in the development process. Regulatory agencies require that tests be repeated in the event of a test failure. Accordingly, anticipated results are thoroughly modeled during the base technology and system development program.
After the base system technology has been developed and while the emission deterioration factor testing is in process, the development of the application technology commences. Application technology involves the development and sourcing of brackets, adapters, exhaust after-treatment packaging, wiring and other ancillary systems of the comprehensive power system based, in part, on specifications of our customers. During this work, we take efforts to strictly adhere to guidelines established during base fuel and emission control system development. Once this work is complete, a model from each certified category of power systems is calibrated and tested for zero hour exhaust emissions in order to submit for exhaust emission certificates from the regulatory agencies. The process involves the creation of designs, testing of prototype samples, release of final design, development of tooled components and ultimately the zero hour exhaust emission testing.
When the deterioration factor testing and zero hour testing are complete, the applications for emission certification are prepared, as applicable, for the respective power systems and filed with appropriate regulatory agencies. The application process differs between regulatory agencies. The required documentation must be meticulously completed and the filing requirements for each applicable power system must be fully satisfied for the application to be successfully accepted by the agencies; that process may take several weeks to complete. Once an application is filed, the regulatory agencies can take up to 90 days per power system to review and respond to the application, which often includes requests for additional information. Once an application is approved, an emission certificate is valid for 12 months (usually in conjunction with a calendar year). Each certification is renewed annually. Certified power systems cannot be sold without approved certificates from applicable regulatory agencies. Failure to perform and submit the required periodic compliance testing would result in the termination of the power system certification.
Once a power system is certified, regulatory agencies have ongoing compliance requirements, which include testing newly produced power systems on a regular quarterly schedule to ensure compliance with applicable regulations. In addition, there are field audit requirements, which require the removal of power systems from service at specified stages of their useful lives to perform confirmatory exhaust emissions testing.
Our Telematics Tool
We are also subject to various laws and regulations relating to our telematics tool and connected asset services. Among other things, wireless transceiver products are required to be certified by the Federal Communications Commission and comparable authorities in foreign countries where they are sold. We currently maintain applicable certifications from governmental agencies in each of the jurisdictions in which our telematics tool is required to be so certified.
Our Operations
Our operations are also subject to numerous federal, state and local laws relating to such matters as safe working conditions, manufacturing practices, environmental protection, fire hazard control and disposal of hazardous or potentially hazardous substances. We may be required to incur significant costs to comply with such laws and regulations in the future. Any failure to comply with these laws or regulations could have a material adverse effect upon our ability to do business.
22
Table of Contents
Employees
As of March 1, 2012, our workforce consisted of approximately 308 persons, including approximately 102 full-time and one part-time employee, as well as members of our production team whose services we obtain through an arrangement with a professional employer organization and other individuals whose services we obtain through a temporary employment agency. Of these persons, approximately 28 were in Product Development and Emissions Compliance, 18 were in Sales, 17 were in Customer Support Engineering, Quality and Service, 21 were in Executive Management and Finance, 35 were in Operations Management and approximately 189 were in Production. In addition, Product Development and Engineering supplements fluctuating demands for resources through external design and drafting outsourcing services located in India, and Asian sales and procurement activities are supported through an external dedicated outsourced service organization located in Asia.
None of the members of our workforce are represented by a union or covered by a collective bargaining agreement. We believe we have a good relationship with the members of our workforce.
Our business, financial condition and results of operations are subject to various risks, including those described below, which in turn may affect the value of our securities. In addition, other risks not presently known to us or that we currently believe to be immaterial may also adversely affect our business, financial condition and results of operations, perhaps materially. The risks discussed below also include forward-looking statements, and actual results and events may differ substantially from those discussed or highlighted in these forward-looking statements. Before making an investment decision with respect to any of our securities, you should carefully consider the following risks and uncertainties described below and elsewhere in this report. See also “Cautionary Note Regarding Forward-Looking Statements.”
Risks Related to our Business and our Industry
The market for alternative fuel spark-ignited power systems may not develop according to our expectations and, as a result, our business may not grow as planned and our business plan may be adversely affected.
Our future growth is dependent upon the market for efficient alternative fuel spark-ignited power systems (including natural gas and propane) expanding as a result of our customers and potential customers substituting alternative fuel power systems for diesel power systems. Part of our business plan is dependent on our market forecasts with respect to this expected substitution trend. However, there can be no assurance that we can accurately predict the potential impact of new diesel emission regulations, which we assume will help drive this trend by increasing the cost and product footprint of diesel power systems, nor can we assure that customers or potential customers would substitute natural gas and propane powered power systems for diesel power systems in response to these regulations. In addition, to the extent that diesel power system manufacturers develop the ability to design and produce emission-compliant diesel power systems that they can sell at a lower price and have smaller product footprints than we currently expect, diesel power systems will be more competitive with our alternative fuel power systems, and customers and potential customers may be less likely to substitute alternative fuel power systems for diesel power systems. Furthermore, even if alternative fuel power systems are substituted for diesel power systems, there can be no assurance that our power systems would capture any portion of this potential market size increase. If the industrial OEM market generally, or more specifically any of the industrial OEM categories which represent a significant portion of our business or in which we anticipate significant growth opportunities for our power systems, fails to develop or develops more slowly than we anticipate, the growth of our business and our business plan could be materially adversely affected.
Changes in environmental and regulatory policies could hurt the market for our products.
Our business is affected by government environmental policies, mandates and regulations around the world, most significantly with respect to emission standards in the United States. Examples of such regulations include those that (1) restrict the sale of power systems that do not meet emission standards, (2) impose penalties on sellers of non-compliant power systems, and (3) require the use of more expensive ultra-low sulfur diesel fuel. There can be no assurance that these policies, mandates and regulations will be continued or expanded as assumed in our growth strategy. Incumbent industry participants with a vested interest in gasoline and diesel, many of which have substantially greater resources than we do, may invest significant resources in an effort to influence environmental regulations in ways that delay or repeal requirements for more stringent carbon, particulate matter (a mixture of solid particles and liquid droplets found in the air that contain a variety of chemical components, such as dust, dirt, soot or smoke) and other emissions.
23
Table of Contents
We generally must obtain product certification from both the EPA and CARB to sell our products in the United States. We may attempt to expand sales of our power systems to industrial OEMs that sell their products in Europe, which also has stringent emissions requirements. Accordingly, future sales of our product will depend upon their being certified to meet the existing and future air quality and energy standards imposed by the relevant regulatory agencies. While we incur significant research and developments costs to ensure that our products comply with emission standards and meet certification requirements in the regions where our products are sold, we cannot assure you that our products will continue to meet these standards. The failure to comply with certification requirements would not only adversely affect future sales but could result in the recall of our products or civil or criminal penalties.
The adoption of new, more stringent and burdensome government emission regulations, whether at the foreign, federal, state, or local level, in markets in which we supply our power systems, may require modification of our emission certification and other manufacturing processes for our power systems. Thus, we might incur unanticipated expenses in meeting future compliance requirements, and may be required to increase our research and product development expenditures. Increases in such costs and expenses could necessitate increases in the prices we charge our OEM customers for our power systems, which could adversely affect demand for them.
We currently face, and will continue to face, significant competition, which could result in a decrease in our revenue.
The market for our products and related services is intensely competitive, subject to rapid change and sensitive to new product and service introductions and changes in technical requirements. New developments in power system technology may negatively affect the development or sale of some or all of our power systems or make our power systems uncompetitive or obsolete. Other companies, some of which have longer operating histories, greater name recognition and greater financial and marketing resources than us, are currently engaged in the development of products and technologies that are similar to, or may be competitive with, certain of our products and power system technologies. If the markets for our products (including particular industrial OEM market categories) grow as we anticipate, competition may intensify, as existing and new competitors identify opportunities in such markets.
We face competition from companies that employ current power system technologies, and may face competition in the future from additional companies as new power system technologies are adopted. Among our competitors are fuel system providers such as Westport Innovations, Inc., Fuel System Solutions and Woodward Governor, Inc., which supply engines and engine system components to the industrial OEM marketplace. Additionally, we may face competition from companies developing technologies such as cleaner diesel engines, bio-diesel, fuel cells, advanced batteries and hybrid battery/internal combustion power systems. We may not be able to incorporate such technologies into our product offerings, or may be required to devote substantial resources to doing so. The success of our business depends in large part on our ability to provide single assembly, integrated, comprehensive, technologically sophisticated power systems to our customers. The development or enhancement by our competitors of similar capabilities could adversely affect our business.
Our industrial OEM customers may not continue to outsource their power system needs.
The purchasers of our power systems are industrial OEMs that manufacture industrial equipment. As a result of the significant resources and expertise required to develop and manufacture emission-certified power systems, these customers have historically chosen to outsource production of power systems to us. Our business depends in significant part on our industrial OEMs continuing to outsource design and production of power systems, power system components and subsystems. However, there can be no assurance that our OEM customers will continue to outsource, or outsource as much of, their power system production in the future. Industrial OEMs that otherwise might use our power systems may instead seek to internalize the production of these power systems and related components. Increased levels of OEM vertical integration could result from a number of factors, such as shifts in our customers’ business strategies, acquisition by a customer of a power system manufacturer or the emergence of low-cost production opportunities in foreign countries.
We are dependent on certain products and industrial OEM market categories for a significant share of our revenues and profits.
During fiscal 2011, a significant portion of our revenues were derived from sales of our power systems to be incorporated into equipment used in the power generation and forklift market categories, and we anticipate that sales of power systems in these market categories will continue to represent a significant portion of our revenues for the foreseeable future. We further believe that our growth may depend in a significant part upon our ability to increase sales of our power systems in the oil and gas market category, as
24
Table of Contents
well as certain other industrial OEM categories. There can be no assurance that the oil and gas market category, or any other industrial market category into which we sell our power systems, will grow as quickly or as significantly as we expect (if at all), or that the current, or any future, demand for our power systems in any of these market categories will not decrease.
Failure to raise additional capital or to generate the significant capital necessary to continue our growth could reduce our ability to compete and could harm our business.
We may need to raise additional capital in the future, and we may not be able to obtain additional debt or equity financing on favorable terms, if at all. Our current credit facility contains covenants restricting our ability to enter into additional debt financing. See “Management’s Discussion and Analysis of Financial Condition and Results of Operations — Liquidity and capital resources — Credit agreement” for a description of our credit facility. If we raise additional equity financing, our stockholders may experience significant dilution of their ownership interests, and the per share value of our common stock could decline. Furthermore, if we engage in additional debt financing, the holders of debt would have priority over the holders of common stock, and we may be required to accept terms that restrict our ability to incur additional indebtedness, and take other actions that would otherwise be in the interests of our stockholders and force us to maintain specified liquidity or other ratios. If we need additional capital and cannot raise it on acceptable terms, we may not, among other things, be able to:
| • | continue to expand our research and product development operations and sale and marketing organization; |
| • | expand operations both organically and through acquisitions; or |
| • | respond to competitive pressures or unanticipated working capital requirements. |
We are dependent on relationships with our OEM customers.
Our power systems are integrated into our OEM customers’ equipment for subsequent sales and distribution to end-users of off-highway industrial equipment. One of our customers represented more than 10% of our sales in each of the last three fiscal years. We do not currently have formal, written agreements with this customer or some of our other largest customers. There can be no assurance that our current material customers, or industrial OEMs in general, will continue manufacturing equipment that uses our power systems or, if they do manufacture such equipment, that the end-users of our OEM customers will choose to purchase products into which our power systems are incorporated. Any integration, design, manufacturing or marketing problems encountered by our OEM customers could adversely affect the demand for our power systems and the ability of our OEM customers to timely pay us amounts due for our products and services. Any change in our relationships with any of our key OEM customers, whether as a result of economic or competitive pressures or otherwise, including any decision by our OEM customers to reduce their commitments to purchase our power systems in favor of competing products, could have a material adverse effect on our business and financial results.
In addition, we may be subject to disputes arising from agreements and other arrangements with our OEM customers. Disputes with our OEM customers could lead to termination of arrangements with our OEM customers and delays in collaborative development or commercialization of power systems that we design for, and supply to, these customers. Moreover, disagreements may arise with our OEM customers over rights to proprietary technology and other intellectual property incorporated in our power systems and our customers’ products into which our power systems are integrated. Significant disagreements with our OEM customers could result in costly and time-consuming litigation. Any such conflicts with our OEM customers could negatively impact our relationships, reduce the number of power systems which we supply, and negatively impact our ability to obtain future business, in each case with these and other OEM customers.
We are dependent on relationships with our material suppliers, and the partial or complete loss of one of these key suppliers, or the failure to find replacement suppliers or manufacturers in a timely manner, could adversely affect our business.
We have established relationships with third party engine suppliers and other suppliers from which we source our components for our power systems. We are substantially dependent on our three key engine suppliers, General Motors, Perkins/Caterpillar and Doosan. Sales of our power systems incorporating engines from General Motors, Perkins/Caterpillar and Doosan represented approximately 64%, 10% and 13% of our total sales for fiscal 2011, respectively, and represented approximately 58%, 16% and 14% of our total sales for fiscal 2010, respectively. If any of these three engine suppliers were to fail to provide engines in a timely manner
25
Table of Contents
or to supply engines that meet our quality, quantity or cost requirements, or were to discontinue manufacturing any engines we source from them or providing any such engines to us, and we were unable to obtain substitute sources in a timely manner or on terms acceptable to us, our ability to manufacture our products could be materially adversely affected. In addition, we currently source other important components used in our power systems, such as catalysts, engine controllers, fuel mixers, wiring harnesses, engine sensors and intake manifolds, from a limited number of suppliers. Much of the technology incorporated into these components that we source from a limited number of suppliers is technologically sophisticated, and we do not believe that our competitors have access to some of this sophisticated technology. Our business could be harmed by adverse changes in our relationships with our non-engine component suppliers, or if our competitors gain access to the technology. Further, if our suppliers are unable to provide components to us in a timely manner, or are unable to meet our quality, quantity or cost requirements, we may not in all cases be able to promptly obtain substitute sources. Any extended delay in receiving engines or other critical components could impair our ability to deliver products to our OEM customers.
We do not have formal, written agreements with many of our component suppliers. Most of our non-engine component supply agreements do not extend past the end of 2012, and we do not believe that any of our non-engine component supply agreements constitutes a material agreement of our company. In any event, a component supplier may fail to provide components on a timely basis, or fail to meet our specifications or other requirements for a component, regardless of whether we have a written contract with such supplier.
The quality and performance of our power systems are, in part, dependent on the quality of their component parts that we obtain from various suppliers, which makes us susceptible to performance issues that could materially and adversely affect our business, reputation and financial results.
Our power systems are sophisticated and complex, and the success of our power systems is dependent, in part, upon the quality and performance of key components, such as engines, fuel systems, generators, breakers, and complex electrical components and associated software. There can be no assurance that the power system parts and components will not have performance issues from time to time, and the warranties provided by our suppliers may not always cover the potential performance issues. We may face disputes with our suppliers with respect to those performance issues and their warranty obligations, and our customers could claim damages as a result of such performance issues.
We maintain a significant investment in inventory, and a decline in our customers’ purchases could lead to a decline in our sales and profitability.
We cannot always predict the timing, frequency or size of the future orders of our OEM customers. Our ability to accurately forecast our sales is further complicated by the continuing global economic uncertainty. We maintain significant inventories in an effort to ensure that our OEM customers have a reliable source of supply. If we fail to anticipate the changing needs of our customers and accurately forecast our customer demands, our customers may not continue to place orders with us, and we may accumulate significant inventories of products that we will be unable to sell or return to our suppliers. This may result in a significant decline in the value of our inventory and a decrease in our future gross profit.
Changes in our product mix could materially and adversely affect our business.
The margins on our revenues from some of our product and service offerings are higher than the margins on some of our other product and service offerings. In particular, the margins vary between sales of our power systems as compared to sales of our aftermarket parts and components. Our margins can also fluctuate based upon competition, alternative products and services, operating costs and contractual factors. In addition, we may not be able to accurately estimate the margins of some of our new and developing products and services due to our limited operating history with sales of these products. Our new products and services may have lower margins than our current products and services.
While margins differ across the range of our power systems, prices for our power systems generally vary based on the relative sizes in terms of horsepower of the power systems. For example, if a greater proportion of our revenues are generated from sales of our lower-power power systems, our total revenues and profits may be lower than what they would be if we sold a comparable number of larger power systems, even if margins on these smaller power systems are greater.
26
Table of Contents
We derive a substantial majority of our revenues attributed to our diesel power systems business from our relationships with Perkins and Caterpillar.
We derive a significant portion of our diesel power systems business from our distributor agreement with Perkins, our packaging and distribution agreements with Caterpillar engine dealers and our association with Caterpillar. Our business with Perkins and Caterpillar represented approximately 14% and 19% of our revenues in fiscal 2011 and 2010, respectively. Any material change in our relationships with Perkins and Caterpillar, including the termination of our distribution agreement with Perkins, could have a material adverse effect on our business and financial results.
Our financial position, results of operations and cash flows have been, and may in the future be, negatively impacted by challenging global economic conditions.
Challenging global economic conditions, which can have a particularly severe impact on industrial markets, have had, and may in the future have, a material adverse effect on our business. More specifically, such conditions resulted in significantly reduced demand in 2009 for our power systems and other products from our industrial OEM customers, as those customers faced sharp declines in market demand for their products into which our power systems are incorporated. Our net sales decreased 34% from 2008 to 2009, primarily due to lower power system shipment volumes and aftermarket parts sales resulting from this reduced demand. This sales decrease was reflected across our base of customers in all of the OEM categories in which our power systems are used. Difficult market conditions can also cause us to experience pricing pressure, negatively impacting our margins.
Future economic downturns may materially impact our OEM customers, as well as suppliers and other parties with which we do business. Economic conditions that adversely affect our customers may cause them to terminate existing supply agreements or to reduce the volume of power systems they purchase from us in the future. In the case of another economic downturn, we may have significant balances owing from customers that face liquidity issues. Failure to collect a significant portion of amounts due on those receivables could have a material adverse effect on our results of operations and financial condition. Similarly, with adverse market conditions, our key suppliers from which we source power system components may be unable to provide components to us. Furthermore, we may not be able to successfully anticipate, plan for and respond to changing economic conditions, and our business could be negatively affected.
In addition, financial troubles affecting the banking system and financial markets and the on-going concerns and threats to banks and other financial institutions have in the past resulted, and may in the future result, in a tightening in the credit markets, a low level of liquidity in many financial markets, and extreme volatility in fixed income, credit and equity markets. Furthermore, there could be a number of follow-on effects from the recent credit crisis and its lingering impact on the industrial OEM industry generally and on our business specifically. Our OEM customers may be unable to obtain credit to finance purchases of their inventory (thus reducing demand for our power systems), or to honor their obligations to us, or may become insolvent. In addition, our key suppliers may make changes in the credit terms they extend to us, such as shortening the required payment period for our amounts owing them or reducing the maximum amount of trade credit available to us, or may become insolvent.
Fuel price differentials are hard to predict and may have an adverse impact on the demand for our products in the future.
The prices of various fuel alternatives are subject to fluctuation, based upon many factors, including changes in resource bases, pipeline transportation capacity for natural gas, refining capacity for crude oil and government excise and fuel tax policies. The price differential among various fuel alternatives can impact OEMs and their decisions to buy power systems from us. For example, if fossil fuel prices increase significantly, OEMs may choose to seek power systems powered by electric motors instead of ones that use fossil fuels. Furthermore, if OEMs do decide to purchase power systems from us, relative fuel prices may affect which power systems they purchase from us. The margins on our sale of certain of our power systems are higher than the margins on other power systems that we sell to our OEM customers. See “Changes in our product mix could materially and adversely affect our business.”
Price increases in some of the key components in our power systems could materially and adversely affect our operating results and cash flows.
The prices of some of the key components of our power systems are subject to fluctuation due to market forces beyond our control, including changes in the costs of raw materials incorporated into these components. Such price increases occur from time to time due to spot shortages of commodities, increases in labor costs or longer-term shortages due to market forces. In particular, the prices of certain precious metals used in our emissions control systems fluctuate frequently and often significantly. Substantial increases in the prices of raw materials used in components which we source from our suppliers may result in increased prices charged by our suppliers. If we incur price increases from our suppliers for key components in our power systems, our production
27
Table of Contents
costs will increase. Given competitive market conditions, we may not be able to pass all or any of those cost increases on to our OEM customers in the form of higher sales prices. To the extent our competitors do not suffer comparable component cost increases, we may have even greater difficulty passing along price increases and our competitive position may be harmed. As a result, increases in costs of key components may adversely affect our margins and otherwise adversely affect our operating results and cash flows.
Many of our power systems involve long and variable design and sales cycles, which could have a negative impact on our results of operations for any given quarter or year.
The design and sales cycle for our customized power systems, from initial contact with our potential OEM customer to the commencement of shipments of our power systems, may be lengthy. Customers generally consider a wide range of issues before making a decision to purchase our power systems. Before an industrial OEM commits to purchase our power systems, they often require a significant technical review, assessment of competitive products and approval at a number of management levels within their organization. During the time our customers are evaluating our products, we may incur substantial sales and marketing, engineering and research and development expenses to customize our power systems to the customer’s needs. We may also expend significant management efforts, increase manufacturing capacity, order long-lead-time components or purchase significant amounts of power system components and other inventory prior to receiving an order. Even after this evaluation process, a potential customer may not purchase our products.
The product development time after an industrial OEM customer agrees to purchase our power systems can be considerable. Our process for establishing technical specifications and developing a customized, integrated power system requires use of significant engineering resources, including design, prototyping, modeling, testing and application engineering. The length of this cycle is influenced by many factors, including the difficulty of the technical specification, the novelty and complexity of the design and the customer’s procurement processes.
Our design, development and sales cycle may vary based on the specific power system and the industrial OEM market category in which our customer’s product will compete, and it is difficult to predict for any particular transaction. The length and variability of our sales cycle can make it difficult to predict whether particular sales commitments will be received in any given quarter. As a result, a significant period may elapse between our investment of time and resources in designing and developing a custom power system for an OEM customer and our revenue from sales of that power system.
The length of this process may increase the risk that an OEM customer will decide to cancel or change its plans related to its equipment into which our power system is integrated. Such a cancellation or change in plans by a customer could cause us to lose anticipated sales. In addition, our business, results of operations and financial condition could be materially adversely affected if a customer curtails, materially reduces or delays a significant order during our sales cycle, chooses not to release its equipment that contains our custom power system, or is not successful in the sale and marketing of its equipment that contains our custom power system.
The loss of one or more key members of our senior management, or our inability to attract and retain qualified personnel could harm our business.
Our success and future growth depends to a significant degree on the skills and continued services of our management team, in particular Gary Winemaster, our Chief Executive Officer and President. The loss of any of our key members of management could inhibit our growth prospects. We do not expect that the proceeds from any “key man” life insurance policies we maintain for certain members of management would adequately compensate us for the loss of any of these individuals. Our future success also depends in large part on our ability to attract, retain and motivate key management, engineering, manufacturing and operating personnel. As we develop additional capabilities, we may require more skilled personnel. Given the highly specialized nature of our power systems, these personnel must be highly skilled and have a sound understanding of our industry, business and our technology. The market for such personnel is highly competitive. As a result, we may not be able to continue to attract and retain the personnel needed to support our business.
Our existing debt or new debt that we incur could adversely affect our business and growth prospects.
Effective March 20, 2012, we renegotiated our credit facility with BMO Harris Bank N.A. (formerly Harris N.A.) to increase our borrowing capacity to $50.0 million from $35.0 million. At March 20, 2012, we had approximately $23.9 million in principal amount of outstanding debt under this credit line. Our indebtedness, the cash flow needed to satisfy our debt and the covenants contained in current and potential future credit agreements have important consequences, including:
| • | limiting funds otherwise available for financing our capital expenditures by requiring us to dedicate a portion of our cash flows from operations to the repayment of debt and the interest on this debt; |
28
Table of Contents
| • | limiting our ability to incur additional indebtedness; |
| • | limiting our ability to capitalize on significant business opportunities; |
| • | placing us at a competitive disadvantage to those of our competitors that are less indebted than we are; |
| • | making us more vulnerable to rising interest rates; and |
| • | making us more vulnerable in the event of a downturn in our business. |
More specifically, pursuant to our current loan and security agreement with our senior lender, we have agreed to certain financial covenants, including maintaining certain ratios between our adjusted EBITDA and our fixed charges. In addition, our current loan and security agreement places limitations on our ability to make capital expenditures and to make acquisitions of other companies. We were in compliance with the financial covenants under our credit facility as of December 31, 2011. Any failure by us to comply with the financial covenants set forth in our current loan and security agreement in the future, if not cured or waived, could result in our senior lender accelerating the maturity of our indebtedness or preventing us from accessing availability under our credit facility. If the maturity of our indebtedness is accelerated, we may not have sufficient cash resources to satisfy our debt obligations and we may not be able to continue our operations as planned.
Our quarterly operating results are subject to variability from quarter to quarter.
Our quarter-to-quarter and quarter-over-quarter operating results (including our sales, gross profit and net income) and cash flows have been, and in the future may be, impacted by a variety of internal and external events associated with our business operations, many of which are outside of our control. Examples of such events include (1) changes in regulatory emission requirements (which generally occur on January 1 of the year in which they become effective), (2) customer product phase-in/phase-out programs, (3) supplier product (i.e. a specific engine model) phase-in/phase-out programs, (4) changes in pricing by suppliers to us of engines, components and other parts (typically effective January 1 of any year), and (5) changes in our pricing to our customers (typically effective January 1 of any year), which may be related to changes in the pricing by suppliers to us.
In order to mitigate potential availability or pricing issues, customers may adjust their demand requirements from traditional patterns. We may also extend special programs to customers in advance of such events, and we are more likely to offer such programs in our fourth quarter of a year in anticipation of events expected to occur in the first quarter of the next year. The occurrence of any of the events discussed above may result in fluctuations in our operating results (including sales and profitability) and cash flows between and among reporting periods.
If we fail to adequately protect our intellectual property rights, we could lose important proprietary technology, which could materially and adversely affect our business.
We believe that the success of our business depends, in substantial part, upon our proprietary technology, information, processes and know-how. The unauthorized use of our intellectual property rights and proprietary technology by others could materially harm our business. We do not own any material patents and rely on a combination of trademark and trade secret laws, along with confidentiality agreements, contractual provisions and licensing arrangements, to establish and protect our intellectual property rights. Although certain of our employees have entered into confidentiality agreements with us to protect our proprietary technology and processes, not all of our employees have executed such agreements, nor can we ensure that employees who have executed such agreements will not violate them.
29
Table of Contents
Despite our efforts to protect our intellectual property rights, existing laws afford only limited protection, and our actions may be inadequate to protect our rights or to prevent others from claiming violations of their proprietary rights. Unauthorized third parties may attempt to copy, reverse engineer or otherwise obtain, use or exploit aspects of our products and services, develop similar technology independently, or otherwise obtain and use information that we regard as proprietary. We cannot assure you that our competitors will not independently develop technology similar or superior to our technology or design around our intellectual property.
In addition, the laws of some foreign countries may not protect our proprietary rights as fully or in the same manner as the laws of the United States. In particular, we sell our power systems to industrial OEM customers, and source certain components from suppliers, in China, where commercial laws are relatively underdeveloped compared to other geographic markets into which we sell our products. Protection of intellectual property is limited under Chinese law, and the sale of our products and the local sourcing of components may subject us to an increased risk of infringement or misappropriation of our intellectual property. As a result, we cannot be certain that we will be able to adequately protect our intellectual property rights in China.
We may need to resort to litigation to enforce our intellectual property rights to protect our trade secrets and to determine the validity and scope of other companies’ proprietary rights in the future. However, litigation could result in significant costs or in the diversion of financial resources and management’s attention. We cannot assure you that any such litigation will be successful or that we will prevail over counterclaims against us.
In addition, many of the components we source from our suppliers and which are incorporated into our power systems use proprietary intellectual property of our suppliers. We also license or rely upon certain intellectual property from third parties, including the “back office” software and functionality for our telematics tool, MasterTrak. For a description of MasterTrak, our telematics tool, see “Business — Our Products and Industry Categories — Connected Asset Services.” Any of these third parties from which we source our power system components, from which we license intellectual property or on whose intellectual property we rely, may also supply these components (or other components that incorporate the same intellectual property) or license or provide such intellectual property, as applicable, to others, including our competitors, or terminate our access to such intellectual property.
If we face claims of intellectual property infringement by third parties, we could encounter expensive litigation, be liable for significant damages or incur restrictions on our ability to sell our products and services.
We cannot be certain that our products, services and power system technologies, including any intellectual property licensed from third parties for use therein or incorporated into components that we source from our suppliers, do not, or in the future will not, infringe or otherwise violate the intellectual property rights of third parties. We are not aware of all of the proprietary technology incorporated into, or used in developing, the components that we source and integrate into our power systems, nor are we familiar with all of the technology included in, or used in developing, products that are competitive with these components. Furthermore, the design, prototyping, testing and engineering capabilities we use to manufacture our power systems are technologically sophisticated, and we consider the processes by which we develop our power systems to be confidential and proprietary trade secrets. To compete in the industrial OEM market, our competitors likely also use proprietary development processes to manufacture their products. Given that neither we nor our competitors make information regarding such manufacturing and development processes available to the public, we cannot know the extent to which there may be any commonality between our respective processes and cannot be certain that we are not infringing on any intellectual property rights of others. In addition, for the above reasons, we cannot assure you that third parties will not claim that we have infringed their intellectual property rights.
A third party alleged, and asserted those allegations in proceedings against us (which proceedings were subsequently settled), that certain technology related to our telematics tool, MasterTrak, infringed upon the intellectual property rights of that party. As such, we may in the future be subject to similar infringement claims that may result in litigation. Successful infringement claims against us could result in substantial monetary liability, require us to enter into royalty or licensing arrangements, or otherwise materially disrupt the conduct of our business. In addition, even if we prevail in the defense of any such claims, any such litigation could be time-consuming and expensive to defend or settle, and could result in the diversion of the time and attention of management and of operational resources, which could materially and adversely affect our business. Any potential intellectual property litigation also could force us to do one or more of the following:
30
Table of Contents
| • | stop selling and/or using the specific products and/or services incorporating the allegedly infringing technology and/or stop incorporating the allegedly infringing technology into such products and/or services; |
| • | obtain from the owner of the infringed intellectual property right a license to sell and/or use the relevant technology, which license may not be available on commercially reasonable terms, or at all; or |
| • | redesign the products and/or services that incorporate the allegedly infringing technology. |
We could suffer warranty claims.
Provisions we make for warranty accrual may not be sufficient, and we may recognize additional expenses as a result of warranty claims in excess of our current expectations. Such warranty claims may necessitate a redesign, re-specification, a change in manufacturing processes, and/or recall of our power systems, which could have an adverse impact on our finances and on existing or future sales of our power systems and other products. Even in the absence of any warranty claims, a product deficiency such as a manufacturing defect or a safety issue may necessitate a product recall, which could have an adverse impact on our finances and on existing or future sales.
We could become subject to product liability claims.
Our business exposes us to potential product liability claims that are inherent to natural gas, propane, gasoline and diesel, and products that use these fuels. Natural gas, propane and gasoline are flammable and are potentially dangerous products. Any accidents involving our power systems could materially impede widespread market acceptance and demand for our power systems. In addition, we may be subject to a claim by end-users of our OEM customers’ products or others alleging that they have suffered property damage, personal injury or death because our power systems or the products of our customers into which our power systems are integrated did not perform adequately. Such a claim could be made whether or not our power systems perform adequately under the circumstances. From time to time, we may be subject to product liability claims in the ordinary course of business, and we carry a limited amount of product liability insurance for this purpose. However, our current insurance policies may not provide sufficient or any coverage for such claims, and we cannot predict whether we will be able to maintain our insurance coverage on commercially acceptable terms.
Our telematics tool, MasterTrak, may not be successful.
Our telematics tool is unproven in the market and does not currently provide a material portion of our revenues. There can be no assurance that our telematics tool will gain widespread acceptance among customers or generate meaningful revenues or profits.
We are subject to various laws and regulations relating to our telematics tool. Among other things, wireless transceiver products are required to be certified by the Federal Communications Commission and comparable authorities in foreign countries where they are sold. If we fail to obtain product certifications for our telematics product, or otherwise fail to successfully comply with applicable regulations in this area, we may be required to make significant unanticipated expenditures to bring our telematics tool within compliance with such regulations, and future sales of our telematics tool may be adversely affected. Furthermore, through our telematics tool, we transmit and store information of customers, including equipment-specific information such as performance data. Equipment-specific information may also reveal customer-identifiable information. A growing body of laws designed to protect the privacy of personally-identifiable information, as well as to protect against its misuse, and the judicial interpretations of such laws, may adversely affect the growth of our telematics business. In particular, such laws could limit our ability to collect information related to users of our telematics tool, to store or process that information in what would otherwise be the most efficient manner, or to commercialize new telematics services based on emerging technologies. In addition, we could become subject to third party claims based upon allegations of loss or misuse of customer information.
See also “— If we face claims of intellectual property infringement by third parties, we could encounter expensive litigation, be liable for significant damages or incur restrictions on our ability to sell our products and services,” for a discussion of a third party intellectual property infringement claim with respect to technology related to our telematics tool, which matter has been settled.
We may have difficulty managing the consolidation of our facilities.
We have committed to consolidating existing operations in 2012 into newly leased facilities. We may not be able to manage the consolidation of existing facilities without significant disruption to our production of power systems. The consolidation of existing facilities may result in the temporary scaling back or shutdown of production
31
Table of Contents
lines during the relocation process. We may also damage or misplace inventory during the relocation which could delay production and/or result in the cancellation of customer orders if we cannot ship on time. It is also possible that products may be shipped without the proper pre-shipment inspection controls that exist in our current facilities, and/or without the appropriate shipping documents during the transition to the newly leased facilities.
The consolidation of operations could place a significant strain on our senior management team, support teams, manufacturing lines, information technology platforms and other resources. Furthermore, the costs associated with the conversion of the newly leased facilities and relocation of operations may result in substantial costs in excess of estimates and temporarily higher costs to produce power systems in excess of our traditional cost structure.
We may have difficulty managing the expansion of our operations.
Our current organization and our facilities currently in place may not be adequate to support our future growth. In order to effectively manage our operations and any significant growth, including any significant growth in the sales of, and services related to, our power systems, we may need to:
| • | scale our internal infrastructure, including establishing additional facilities, while continuing to provide technologically sophisticated power systems on a timely basis; |
| • | attract and retain sufficient numbers of talented personnel, including application engineers, customer support staff and production personnel; |
| • | continue to enhance our compliance and quality assurance systems; and |
| • | continue to improve our operational, financial and management controls and reporting systems and procedures. |
Rapid expansion of our operations could place a significant strain on our senior management team, support teams, manufacturing lines, information technology platforms and other resources. In addition, we may be required to place more reliance on our strategic partners and suppliers, some of whom may not be capable of meeting our production demands in terms of timing, quantity, quality or cost. Difficulties in effectively managing the budgeting, forecasting and other process control issues presented by any rapid expansion could harm our business, prospects, results of operations or financial condition.
New products may not achieve widespread adoption.
Our growth may depend on our ability to develop and/or acquire new products, and/or refine our existing products and power system technology, to complement and enhance the breadth of our power system offering with respect to engine class and the industrial OEM market categories into which we supply our products. We are currently in the process of developing new 2.0 liter and 2.4 liter engines and a range of hybrid power systems, and we offer connected asset services through our telematics tool, MasterTrak, to our OEM customers and other businesses to which we do not supply our power systems. We will generally seek to develop or acquire new products, or enhance our existing products and power system technology, if we believe they will provide significant additional revenues and favorable profit margins. However, we cannot know beforehand whether any new or enhanced products will successfully penetrate our target markets. There can be no assurance that newly developed or acquired products will perform as well as we expect, or that such products will gain widespread adoption among our customers.
Additionally, there are greater design and operational risks associated with new products. The inability of our suppliers to produce technologically sophisticated components for our new power systems, the discovery of any product or process defects or failures associated with production of any new products and any related product returns could each have a material adverse effect on our business, financial condition and results of operations. If new products for which we expend significant resources to develop or acquire are not successful, our business could be adversely affected.
32
Table of Contents
Our new 8.8 liter engine block is the first engine block manufactured in-house by our company, and may not be successful.
We are introducing a newly designed 8.8 liter, fuel flexible engine block that we have internally developed to replace an engine that we previously purchased from a third party engine supplier. This is our first engine produced in-house by our company. We may not be successful in the development of this unproven engine or in obtaining acceptance of this product in the marketplace, particularly given that it is the replacement for an engine block produced by a well-known and long-time engine manufacturer. Even if this product is accepted in the marketplace, we do not have sufficient history with this engine to assess whether it will succeed without significant performance issues.
The discovery of any significant problems with the engine could result in recall campaigns, increased warranty costs, potential product liability claims, reputational risk and brand risk. More specifically, sales of our own internally developed engine could lead to significantly higher warranty costs to service this engine if it does not perform to expectations, as we would be unable to rely on a warranty provided by a third-party engine manufacturer. Additionally, any performance issues with our internally developed engine could also result in increased product liability claims, and we would be unable to rely on any indemnification provided by a third-party engine manufacturer. Potential losses could also arise from other unforeseen issues associated with the internal production of our own base engine block. For additional detail regarding the risk of introducing a new product such as our 8.8 liter engine, see “— New products may not achieve widespread adoption.” For additional detail regarding the risk of warranty costs and product liability claims, see “— We could suffer warranty claims” and “— We could become subject to product liability claims.”
We may not succeed with the expansion of our product into the on-road market
Our current products have historically been sold and used in the off-road industrial markets. We have announced our intention to expand our product line to on-road markets into which we have not previously sold. The costs and regulations involved with certifying an engine for on-road applications may be more than expected, which could affect our ability to successfully expand our product line into these markets. Additionally, the stresses and demands on engines and power systems used for on-road applications could result in unexpected issues. Not only are we attempting to expand into markets into which we have not previously sold, we are attempting to do so using our newly designed and internally developed 8.8 liter engine. This unproven engine being developed for on-road applications (and other additional applications) may not gain acceptance as an alternative to proven engines already used in on-road applications, and our company may not generally gain acceptance as a supplier to on-road markets. For additional detail regarding the risks related to our newly developed 8.8 liter engine, see “— Our new 8.8 liter engine block is the first engine block manufactured in-house by our company, and may not be successful.”
Even if we are able to gain on-road certification and sell into these markets, we may expose ourselves to additional costs associated with on-road engine failures. These costs could be significant, not only if the vehicle into which the engine is installed becomes damaged, but because of the increased potential for injuries or fatalities that could arise from a malfunction or manufacturing defect in an engine used for on-road applications. Finally, we may face significantly increased competition in the on-road markets from competitors with longer operating histories, greater name recognition and greater financial and marketing resources than our current competitors in the off-road markets. For additional detail regarding the competition faced by our company, see “— We currently face, and will continue to face, significant competition, which could result in a decrease in our revenue.”
If we do not properly manage the sales of our products into foreign markets, our business could suffer.
A significant portion of our future revenues could be derived from sales outside of the United States, particularly in Asia. We have sales and distribution activities in Asia and Europe where we may lack sufficient expertise, knowledge of local customs or contacts. In Asia, we depend upon an independent sales and support organization to complement our OEM relationships and provide knowledge of local customs and requirements, while also providing immediate sales assistance and customer support. There can be no assurance that we will be able to maintain our current relationship with this independent sales and support organization, or that we will be able to develop effective, similar relationships in foreign markets into which we supply our products in the future.
Growing the market for our products in Asia and other markets outside of the United States may take longer and cost more to develop than we anticipate and is subject to inherent risks, including unexpected changes in government policies, trade barriers restricting our ability to sell our products in those countries, longer payment cycles, exposure to currency fluctuations, and foreign exchange controls that restrict or prohibit repatriation of funds. As a result, if we do not properly manage foreign sales, our business could suffer.
33
Table of Contents
In addition, our foreign sales are subject us to numerous stringent U.S. and foreign laws, including the Foreign Corrupt Practices Act, or FCPA, and comparable foreign laws and regulations which prohibit improper payments or offers of payments to foreign governments and their officials and political parties by U.S. and other business entities for the purpose of obtaining or retaining business. Safeguards that we may implement to discourage these practices could prove to be ineffective, and violations of the FCPA and other laws may result in severe criminal or civil sanctions, or other liabilities or proceedings against us, including class action lawsuits and enforcement actions from the SEC, Department of Justice and overseas regulators. Any of these factors, or any other international factors, could impair our ability to effectively sell our power systems, or other products or services that we may develop, outside of the U.S.
If our production facilities become inoperable, our business, including our ability to manufacture our power systems, will be harmed.
We operate our business, including all of our production and manufacturing processes, out of facilities that are all located in Wood Dale, Illinois. If damaged, our facilities, our manufacturing lines, the equipment we use to perform our emission certification and other tests and our other business process systems would be costly to replace and could require substantial time to repair or replace. We are particularly subject to this risk because of our current geographic concentration of our facilities. We have decided to consolidate into facilities that are all located in Wood Dale, Illinois, with an anticipated completion date during 2012. This consolidation further exacerbates this risk. Our facilities may be harmed or rendered inoperable by natural or man-made disasters, including earthquakes, wildfires, floods, acts of terrorism or other criminal activities, infectious disease outbreaks and power outages, which may render it difficult or impossible for us to efficiently operate our business for some period of time. In addition, such events may temporarily interrupt our ability to receive engines, fuel systems or other components for our power systems from our suppliers and to have access to our various production systems necessary to operate our business. Our insurance covering damage to our properties and the disruption of our business may not be sufficient to cover all of our potential losses and may not continue to be available to us on acceptable terms, or at all.
In the event our facilities are damaged or destroyed, we may need to find another facility into which we can move our operations. Finding a facility that meets the criteria necessary to operate our business would be time-consuming and costly and result in delays in our ability to provide our sophisticated power systems or to provide the same level of quality in our services as we currently provide.
We may be adversely impacted by work stoppages and other labor matters.
As of March 1, 2012, our workforce consisted of approximately 308 persons, including full-time and part-time employees, as well as members of our production team whose services we obtain through an arrangement with a professional employer organization. While none of the members of our workforce are currently represented by a union or covered by a collective bargaining agreement, there have been unsuccessful efforts to unionize our manufacturing employees in the past, and there can be no assurance that members of our workforce will not in the future join a union. If our employees organize and join a union in the future, there can be no assurance that future issues with our workforce will be resolved favorably or that we will not encounter future strikes, work stoppages or other types of conflicts with labor unions or our employees. Any of these consequences may have an adverse effect on us or may limit our flexibility in dealing with our workforce.
In addition, many of our suppliers have unionized work forces. Work stoppages or slow-downs experienced by our material suppliers could result in slow-downs or closures at the manufacturing facilities of our suppliers from where our power system components are sourced. If one or more of our key suppliers experience a material work stoppage, it could have a material adverse effect on our operations.
We could be adversely affected by risks associated with potential acquisitions.
From time to time, we may seek to expand our business through investments in, or acquisitions of, complementary businesses, technologies, services or products, subject to our business plans and management’s ability to identify, acquire and develop suitable investments or acquisition targets in both new and existing industrial OEM market categories and geographic markets. In certain circumstances, acceptable investments or acquisition targets might not be available. Acquisitions involve a number of risks, including: (1) difficulty in integrating the operations, technologies, products and personnel of an acquired business, including consolidating redundant facilities and infrastructure; (2) potential disruption of our ongoing business and the distraction of management from our day-to-day operations; (3) difficulty entering markets in which we have limited or no prior experience and in which competitors have a stronger market position; (4) difficulty maintaining the quality of services that such acquired companies have historically provided; (5) potential legal and financial responsibility for liabilities of acquired businesses; (6) overpayment for the acquired company or assets; (7) increased expenses associated with completing an acquisition and amortizing any acquired intangible assets; and (8) challenges in implementing
34
Table of Contents
uniform standards, controls, procedures and policies throughout an acquired business. In addition, under the terms of our credit facility, we may be restricted from engaging in certain acquisition transactions. See “— Management’s Discussion and Analysis of Financial Condition and Results of Operations — Liquidity and capital resources — Credit agreement” for a description of our credit facility.
If we were to pursue acquisition or investment opportunities, these potential risks could disrupt our ongoing business, result in the loss of key customers or personnel, increase expenses and otherwise have a material adverse effect on our business, results of operations and financial condition.
We could become liable for damages resulting from our manufacturing activities.
The nature of our manufacturing operations exposes us to potential claims and liability for environmental damage, personal injury, loss of life and damage to, or destruction of, property. Our manufacturing operations are subject to numerous laws and regulations that govern environmental protection and human health and safety. These laws and regulations have changed frequently in the past and it is reasonable to expect additional and more stringent changes in the future. Our manufacturing operations may not comply with future laws and regulations, and we may be required to make significant unanticipated capital and operating expenditures to bring our operations within compliance with such regulations. If we fail to comply with applicable environmental laws and regulations, manufacturing guidelines, and workplace safety requirements, governmental authorities may seek to impose fines and penalties on us or to revoke or deny the issuance or renewal of operating permits, and private parties may seek damages from us. Under such circumstances, we could be required to curtail or cease operations, conduct site remediation or other corrective action, or pay substantial damage claims for which we may not have sufficient or any insurance coverage for claims.
We may have unanticipated tax liabilities that could adversely impact our results of operations and financial condition.
We are subject to various types of taxes in the U.S., as well as foreign jurisdictions into which we supply our products. The determination of our provision for income taxes and other tax accruals involves various judgments, and therefore the ultimate tax determination is subject to uncertainty. In addition, changes in tax laws, regulations, or rules may adversely affect our future reported financial results, may impact the way in which we conduct our business, or may increase the risk of audit by the Internal Revenue Service or other tax authority. Although we are not subject to any audits currently, we may be in the future subject to an Internal Revenue Service audit or other audit by state, local and foreign tax authorities. The final determinations of any tax audits in the U.S. or abroad could be materially different from our historical income tax provisions and accruals. If any taxing authority disagrees with the positions taken by us on our tax returns, we could incur additional tax liabilities, including interest and penalties.
Variability in self-insurance liability estimates could significantly impact our results of operations.
We self-insure for employee health insurance coverage up to a predetermined level, beyond which we maintain stop-loss insurance from a third-party insurer. Our aggregate exposure varies from year to year based upon the number of participants in this health insurance plan. We estimate our self-insurance liabilities using an analysis provided by our claims administrator and our historical claims experience. Our accruals for insurance reserves reflect these estimates and other management judgments, which are subject to a high degree of variability. Any significant variation in these estimates and judgments could cause a material change to our reserves for self-insurance liabilities, as well as our earnings.
Risks Related to the Shell Company
We may have contingent liabilities related to Format, Inc.’s operations prior to the reverse recapitalization transaction of which we are not aware and for which we have not adequately provisioned.
Format, Inc. may be deemed to have been a shell company with nominal operations and assets prior to the reverse recapitalization transaction. Upon completion of the reverse recapitalization, we acquired all of the operations of The W Group and its subsidiaries. Immediately prior to the consummation of the reverse recapitalization, Format, Inc. was engaged, to a limited extent, in EDGARizing corporate documents for filing with the SEC, and providing limited commercial printing services. We cannot assure you that there are no material claims outstanding, or other circumstances of which we are not aware, that would give rise to a material liability relating to those prior operations, even though we do not record any provisions in our financial statements related to any such potential liability. If we are subject to past claims or material obligations relating to our operations prior to the consummation of the reverse recapitalization, such claims could materially adversely affect our business, financial condition and results of operations.
35
Table of Contents
Risks Related to the Reverse Recapitalization and the Ownership of our Common Stock
We incur significant costs and demands upon management and accounting and finance resources as a result of complying with the laws and regulations affecting public companies; any failure to establish and maintain adequate internal control over financial reporting or to recruit, train and retain necessary accounting and finance personnel could have an adverse effect on our ability to accurately and timely prepare our consolidated financial statements.
As a public operating company, we incur significant administrative, legal, accounting and other burdens and expenses beyond those of a private company, including those associated with corporate governance requirements and public company reporting obligations. In particular, we have needed to enhance and supplement our internal accounting resources with additional accounting and finance personnel with the requisite technical and public company experience and expertise, as well as refine our quarterly and annual financial statement closing process, to enable us to satisfy such reporting obligations.
Furthermore, by the end of 2012, we will be required to comply with Section 404 of the Sarbanes-Oxley Act of 2002. In order to satisfy the requirements of Section 404 of the Sarbanes-Oxley Act of 2002, we will be required to document and test our internal control procedures and prepare annual management assessments of the effectiveness of our internal control over financial reporting. These assessments will need to include disclosure of identified material weaknesses in our internal control over financial reporting. Testing and maintaining internal control over financial reporting will involve significant costs and could divert management’s attention from other matters that are important to our business. Additionally, we cannot provide any assurances that we will be successful in remediating any deficiencies that may be identified. If we are unable to remediate any such deficiencies or otherwise fail to establish and maintain adequate accounting systems and internal control over financial reporting, or we are unable to recruit, train and retain necessary accounting and finance personnel, we may not be able to accurately and timely prepare our consolidated financial statements and otherwise satisfy our public reporting obligations. Any inaccuracies in our financial statements or other public disclosures (in particular if resulting in the need to restate previously filed financial statements), or delays in our making required SEC filings, could have a material adverse effect on the confidence in our financial reporting, our credibility in the marketplace and the trading price of our common stock.
In addition, our management team has had to adapt to other requirements of being a public company. We need to devote significant resources to address these public company-associated requirements, including compliance programs and investor relations, as well as our financial reporting obligations. We incur substantial legal and financial compliance costs as a result of complying with these rules and regulations.
Concentration of ownership among our existing executive officers may prevent new investors from influencing significant corporate decisions.
As of March 20, 2012, Gary Winemaster, our Chairman of the Board, Chief Executive Officer and President, and Kenneth Winemaster, our Senior Vice President and Secretary, beneficially owned in the aggregate approximately 81.96% of our outstanding shares of common stock. On a fully-diluted basis, assuming the exercise of all outstanding warrants, such individuals beneficially owned 75.70% of our outstanding shares of common stock. As of March 20, 2012, Gary Winemaster alone beneficially owned approximately 50.15% of our outstanding shares of common stock. On a fully diluted basis, assuming the exercise of all outstanding warrants, Mr. Winemaster alone beneficially owned 46.31% of our outstanding shares of common stock.
As a result of Gary Winemaster’s and Kenneth Winemaster’s beneficial ownership of a significant majority of our outstanding shares of common stock, these stockholders can exercise control over matters requiring stockholder approval, including the election of directors, amendment of our articles of incorporation and approval of significant corporate transactions. This control could have the effect of delaying or preventing a change of control of our company or changes in management and will make the approval of certain transactions impossible without the support of these stockholders.
An active, liquid, public and orderly trading market for our common stock may not develop, and the price of our stock may be volatile and may decline in value.
There currently is not an active, liquid public trading market for our common stock. An active, liquid public trading market may not develop or, if developed, may not be sustained. For example, during the period from January
36
Table of Contents
1, 2012 through March 20, 2012, there have only been 16 days on which our common stock has been publicly traded, and the average trading volume on those 16 days was only 15,885 shares. With the exception of one trading day on which 227,390 shares were sold, the average trading volume for the remaining 15 days was only 1,785 shares. The lack of an active, liquid public trading market may impair your ability to sell your shares of common stock at the time you wish to sell them or at a price that you consider reasonable. The lack of an active, liquid public trading market for our common stock may also impair our ability to raise capital by selling shares of common stock and may impair our ability to acquire other companies or assets by using shares of our common stock as consideration. Furthermore, a significant spread currently exists between the bid and asked prices for our common stock on the OTC Bulletin Board and the OTC Markets — OTCQB Tier. For example, on March 20, 2012, the closing bid price for our common stock on the OTC Bulletin Board was $14.50 and the closing ask price for our common stock on the OTC Bulletin Board was 16.50.
To the extent there is trading in shares of our common stock, including the shares covered by this report, the trading price is likely to be highly volatile and could be subject to wide fluctuations in response to various factors, some of which are beyond our control. The stock market in general has experienced extreme price and volume fluctuations that have often been unrelated or disproportionate to the operating performance of companies with securities traded in those markets. Broad market and industry factors may seriously affect the market price of companies’ stock, including ours, regardless of actual operating performance. In addition, in the past, following periods of volatility in the overall market and the market price of a particular company’s securities, securities class action litigation has often been instituted against these companies. This litigation, if instituted against us, could result in substantial costs and a diversion of our management’s attention and resources.
Our common stock may not be eligible for listing on a national securities exchange.
Our common stock is not currently listed on any national securities exchange, and we do not currently meet the initial quantitative listing standards of any national securities exchange. We cannot assure you that we will be able to meet the initial listing standards of any national securities exchange, or, if we do meet such initial qualitative listing standards, that we will be able to maintain any such listing. Our common stock is currently quoted on the OTC Bulletin Board and the OTC Markets — OTCQB tier and, until our common stock is listed on a national securities exchange, we expect that it will continue to be eligible and quoted on the OTC Bulletin Board and the OTC Markets — OTCQB tier, on another over-the-counter quotation system, or in the “pink sheets.” In those venues, however, an investor may find it difficult to obtain accurate quotations as to the market value of our common stock. In addition, if we fail to meet the criteria set forth in SEC regulations, various requirements would be imposed by law on broker-dealers who sell our securities to persons other than established customers and accredited investors. Consequently, such regulations may deter broker-dealers from recommending or selling our common stock, which may further affect its liquidity. This would also make it more difficult for us to raise additional capital.
Additionally, in November of 2011, the SEC approved new rules for the New York Stock Exchange, NYSE AMEX and The NASDAQ Stock Market that heightened the listing requirements for companies that have become public by combining with a “shell” company through a reverse recapitalization transaction; we are subject to these heightened requirements. The new listing requirements prohibit a company that has become public through a reverse recapitalization transaction from applying for listing on each of these exchanges until (i) such company has traded in the United States over-the-counter market or another regulated exchange for one year following the reverse recapitalization and filed all required reports with the SEC, including at least one annual report containing audited financial statements for a full fiscal year following the reverse recapitalization transaction, and (ii) such company has maintained the requisite minimum shares price for the applicable exchange for a sustained period, and for at least 30 of the 60 trading days immediately prior to its listing application and the applicable exchange’s decision to list. In our case, this means that we will not be eligible for listing on such exchanges any earlier than the date we file our annual report for our fiscal year ending December 31, 2012.
Our common stock may be considered a “penny stock.”
The SEC has adopted regulations which generally define “penny stock” to be an equity security that has a market price of less than $5.00 per share, subject to specific exemptions. The market price of our common stock may be less than $5.00 per share and therefore our common stock may be a “penny stock.” Broker and dealers effecting transactions in “penny stock” must disclose certain information concerning the transaction, obtain a written agreement from the purchaser and determine that the purchaser is reasonably suitable to purchase the securities. These rules may restrict the ability of brokers or dealers to sell our common stock and may affect stockholders’ ability to sell shares of our common stock in the future.
37
Table of Contents
A significant number of shares of our common stock were registered for sale in 2011 and have become eligible for sale, which could depress the market price for our common stock. Future sales by us or our existing stockholders could similarly depress the market price of our common stock.
A significant number of shares of our common stock were registered for sale in 2011 and have become eligible for sale in the public market, which could cause the market price for our common stock to decline significantly. If we or our existing stockholders sell a large number of shares of our common stock, or if we sell additional securities that are convertible into common stock, in the future, the market price of our common stock similarly could decline. Further, even the perception in the public market that we or our existing stockholders might sell shares of common stock could depress the market price of our common stock.
Anti-takeover provisions contained in our certificate of incorporation and bylaws, as well as provisions of Delaware law, could impair a takeover attempt.
In addition to the concentration of ownership described under “Concentration of ownership among our existing executive officers and their affiliates may prevent new investors from influencing significant corporate decisions” above, which will prevent any attempt to acquire control of our company not supported by these significant stockholders, our certificate of incorporation, bylaws and Delaware law contain provisions which could have the effect of rendering more difficult, delaying or preventing an acquisition deemed undesirable by our board of directors. Our organizational documents include provisions:
| • | authorizing “blank check” preferred stock, which may be issued by our board of directors without stockholder approval and may contain voting, liquidation, dividend and other rights superior to our common stock; and |
| • | limiting the liability of, and providing indemnification to, our directors and officers. |
These provisions, alone or together, could delay or prevent hostile takeovers and changes in control or changes in our management. Provisions of Delaware law may also have anti-takeover effects. Any provision of our certificate of incorporation or bylaws or Delaware law that has the effect of delaying or deterring a change in control could limit the opportunity for our stockholders to receive a premium for their shares of our common stock, and could also affect the price that some investors are willing to pay for our common stock.
Our stockholders may experience significant dilution if future equity offerings are used to fund operations or acquire complementary businesses.
If we engage in capital raising activities in the future, including issuances of common stock, to fund the growth of our business, our stockholders could experience significant dilution. In addition, securities issued in connection with future financing activities or potential acquisitions may have rights and preferences senior to the rights and preferences of our common stock. In the future, we may adopt and establish an equity incentive plan pursuant to which equity awards may be granted to eligible employees (including our executive officers), directors and consultants, if our board of directors determines that it is in our best interest and the best interest of our stockholders to do so. The issuance of shares of our common stock upon the exercise of any such equity awards may result in dilution to our stockholders and adversely affect our earnings.
If securities or industry analysts do not publish, or cease publishing, research or reports about us, our business or our market, or if they change their recommendations regarding our stock adversely, our stock price and trading volume could decline.
The trading market for our common stock will be influenced by whether industry or securities analysts publish research and reports about us, our business, our market or our competitors and what they publish in those reports. We currently have only one analyst (who is associated with Roth Capital Partners, LLC, the placement agent for our private placement) covering our company. We may not continue to have such analyst coverage or obtain additional analyst coverage in the future. Any analysts that do cover us may make adverse recommendations regarding our stock, adversely change their recommendations from time to time, and/or provide more favorable relative recommendations about our competitors. If any analyst who covers us were to cease coverage of our company or fail to regularly publish reports on us, or if analysts fail to cover us or publish reports about us at all, we could lose, or never gain, visibility in the financial markets, which in turn could cause our stock price or trading volume to decline.
38
Table of Contents
We do not anticipate paying any dividends in the foreseeable future.
The payment of dividends is currently restricted by our credit agreement with BMO Harris Bank N.A. We intend to retain our future earnings to support operations and to finance expansion and, therefore, we do not anticipate paying any cash dividends to holders of our common stock in the foreseeable future.
Item 1B. Unresolved Staff Comments.
Not applicable.
We operate within approximately an aggregate of 365,000 square feet of space in five facilities located in the Chicago, Illinois area. The following table lists the location of each of our facilities material to our business (one of which we own, and the others of which are leased by us), that facility’s principal use, the approximate square footage of that facility, and the current lease expiration date (to the extent applicable):
| Location (1) |
Principal Use |
Square Footage | Lease Expiration | |||
| Wood Dale, Illinois |
Finance & Operations Offices; Product Assembly | 42,000 | Owned | |||
| Wood Dale, Illinois |
Sales, Engineering & Product Support Offices; Engineering Development and Product Assembly | 99,000 | April 30, 2012 | |||
| Wood Dale, Illinois |
Service Parts Sales; Warehousing & Distribution | 90,000 | July 31, 2013 | |||
| Elk Grove Village, Illinois |
Warehousing | 18,000 | April 30, 2012 | |||
| Wood Dale, Illinois (2) |
Product Assembly | 116,000 | July 31, 2013 |
| (1) | On February 28, 2012, we entered into a lease agreement for an additional building of 261,000 square feet to be used for production, warehousing and certain selling and administrative operations. The lease began in March 2012 and has a term which expires on July 31, 2018. We expect to consolidate certain operations from existing facilities into this building. |
| (2) | On March 13, 2012, we entered into an agreement to extend the lease of the existing facility which otherwise would have expired on July 31, 2013. Under the terms of this lease, the lease will now expire on July 31, 2018. |
The facilities collectively house our manufacturing operations. As noted above, we have expanded the square footage in which we operate and believe our newly expanded facilities are adequate to meet our current needs. We also believe additional facilities will be available for lease, if necessary, to meet any of our future needs.
From time to time, in the normal course of business, we are a party to various legal proceedings. We do not currently expect that any currently pending proceedings will have a material adverse effect on our business, results of operations or financial condition.
Item 5. Market for Registrant’s Common Equity, Related Stockholder Matters and Issuer Purchases of Equity Securities.
Our common stock is quoted on the OTC Bulletin Board and the OTC Markets — OTCQB tier under the symbol PSIX. The table below sets forth the high and low bid prices per share of our common stock as quoted on the OTC Markets — OTCQB tier for the periods indicated. Prior to April 29, 2011, the effective date of the reverse recapitalization, the common stock traded under the symbol FRMT. All over-the-counter market quotations for our common stock included below for periods prior to the effectiveness of the reverse split have been adjusted to give retroactive effect to the 1-for-32 reverse stock split of our common stock that was effected on August 26, 2011 pursuant to the migratory merger, and reflect inter-dealer prices, without retail mark-up, mark-down or commission and may not necessarily represent actual transactions.
39
Table of Contents
Prior to the reverse recapitalization, there was limited or no trading activity in Format’s common stock, and there has continued to be a lack of trading activity in our common stock following the reverse recapitalization. As of March 20, 2012, there were a limited number of market makers on the OTC Bulletin Board posting priced (and unpriced) quotations for our common stock (one of which was Roth Capital Partners, LLC, the placement agent for the private placement (which has posted quotations for our common stock on the OTC Bulletin Board since May 18, 2011)). Prior to the consummation of the reverse recapitalization transaction (and for a period thereafter) either only one market maker posted quotations for our common stock on the OTC Bulletin Board or, to the extent there were multiple market makers, those market makers were posting unpriced quotations. Accordingly, there is limited information available about the historical market price of our common stock on the OTC Bulletin Board.
Pursuant to the purchase agreement entered into with the investors in the private placement, we have agreed to use our reasonable best efforts to list our common stock for trading on a national securities exchange as soon as reasonably practicable after we meet the initial quantitative listing standards of any such exchange. However, our common stock is not currently listed on any national securities exchange, and we do not currently meet the initial quantitative listing standards of any national securities exchange. Accordingly, we cannot be certain when or whether we will meet such initial listing standards or receive approval to list our common stock on any national securities exchange.
| High | Low | |||||||
| Fiscal Year Ended December 31, 2010 |
||||||||
| First Quarter |
N/A | N/A | ||||||
| Second Quarter |
$ | 1.60 | $ | 1.60 | ||||
| Third Quarter |
$ | 64.00 | $ | 1.60 | ||||
| Fourth Quarter |
$ | 6.40 | $ | 6.40 | ||||
| Fiscal Year Ended December 31, 2011 |
||||||||
| First Quarter |
$ | 16.32 | $ | 6.40 | ||||
| Second Quarter |
$ | 16.32 | $ | 16.32 | ||||
| Third Quarter |
$ | 17.60 | $ | 6.40 | ||||
| Fourth Quarter |
$ | 13.50 | $ | 7.25 | ||||
As of March 20, 2012, the closing bid price for our common stock on the OTC Markets — OTCQB tier and the OTC Bulletin Board was $14.50 per share.
Holders
As of March 20, 2012, there were approximately 42 holders of record of our common stock.
Dividend Policy
We have not paid any cash dividends on our common stock to date. The payment of dividends is currently restricted by our Agreement with Harris N.A. We intend to retain our future earnings to support operations and to finance expansion. See “Management’s Discussion and Analysis of Financial Condition and Results of Operations — Liquidity and Capital Resources — Credit Agreement” below for a further discussion regarding restrictions on the payment of dividends under our new credit facility.
Securities Authorized for Issuance Under Compensation Plans
We currently do not have any compensation plans or individual compensation arrangements under which our equity securities are authorized for issuance.
40
Table of Contents
Issuer Purchases of Equity Securities
| Period |
Total Number of Shares (or Units) Purchased |
Average Price Paid Per Share (or Unit) |
Total Number of Shares (or Units) Purchased as Part of Publicly Announced Plans or Programs |
Maximum Number (or Approximate Dollar Value) of Shares (or Units) that May Yet Be Purchased Under the Plans or Programs |
||||||||||||
| October 1, 2011 — October 31, 2011 |
830,925 | (1) | $ | 5.11 | — | — | ||||||||||
| November 1, 2011 — November 30, 2011 |
— | n/a | n/a | n/a | ||||||||||||
| December 1, 2011 — December 31, 2011 |
— | n/a | n/a | n/a | ||||||||||||
| TOTAL |
830,925 | (1) | $ | 5.11 | — | — | ||||||||||
| (1) | These 830,925 shares were repurchased by our company from Gary S. Winemaster, our Chief Executive Officer and President, for a total of $4.25 million pursuant to a Stock Purchase Agreement between our Company and Mr. Winemaster dated October 31, 2011. |
Item 6. Selected Financial Data.
As a smaller reporting company, we are not required to provide the information described in this item.
Item 7. Management’s Discussion and Analysis of Financial Condition and Results of Operations.
Management’s Discussion and Analysis of
Financial Condition and Results of Operations
The following discussion includes forward-looking statements about our business, financial condition and results of operations, including discussions about management’s expectations for our business. These statements represent projections, beliefs and expectations based on current circumstances and conditions and in light of recent events and trends, and you should not construe these statements either as assurances of performance or as promises of a given course of action. Instead, various known and unknown factors are likely to cause our actual performance and management’s actions to vary, and the results of these variances may be both material and adverse. A description of material factors known to us that may cause our results to vary, or may cause management to deviate from its current plans and expectations, is set forth under “Risk Factors.” See “Cautionary Note Regarding Forward-Looking Statements.” The following discussion should also be read in conjunction with our financial statements and the related notes included in this report.
Overview
Organization
We design, manufacture, distribute and support power systems for industrial OEMs across a broad range of industries including stationary electricity power generation, oil and gas, material handling, aerial work platforms, industrial sweepers, arbor, welding, airport ground support, turf, agricultural, construction and irrigation. Our engineering personnel design and test power system solutions and components supporting those solutions. Our major engine suppliers include Perkins/Caterpillar, General Motors and Doosan, and we source components from a variety of domestic and global suppliers. We operate as one business and geographic segment. Accordingly, the following discussion is based upon this presentation.
Net sales
We generate revenues and cash primarily from the sale of off-highway industrial power systems and aftermarket parts to industrial OEMs. Our products are sold globally, and we are a sole source power system provider of our products for many of our customers. Net sales are derived from gross sales less sales returns and or sales discounts.
41
Table of Contents
Cost of sales
We manufacture all of our products at our facilities in Wood Dale, Illinois. The most significant component of our cost of sales is the engine cost. The remainder of our cost of sales primarily includes the cost of additional materials utilized in our finished goods, labor, freight, depreciation and other inventoriable costs such as allocated overhead.
Operating expenses
Operating expenses include research & development and engineering, selling and service and general and administrative expenses. Research & development and engineering expenses include both internal personnel costs and expenses associated with outsourced third party engineering relationships. Research & development and engineering activities are staff intensive; thus costs incurred primarily consist of wages and benefits for professional engineers and amounts paid to third parties under contractual engineering agreements. Research & development and engineering consists of a Product and Application Research and Development Engineering Group and a Customer Support Engineering Group. The primary focus of the Product and Application Research and Development Engineering Group is on current and future product design, prototyping, testing and application development activities. The Customer Support Engineering Group provides dedicated engineering and technical attention to customer production support, including a direct communication link with our internal operations.
Selling and service expenses represent the costs of our OEM sales team, an aftermarket sales group and a customer support group for field service and warranty support of our products. We utilize a direct sales and marketing approach to maintain maximum customer interface and service support. Wages and benefits, together with expenses associated with travel, account for the majority of the costs in this category.
General and administrative expenses principally represent costs of our corporate office and personnel that provide management, accounting, finance, human resources, information systems and related costs which support the organization. In addition to wages and benefits, costs include professional services, insurance, banking fees and other general facility and administrative support costs.
2011 Significant Developments
Reverse Recapitalization, Private Placement and Stock Repurchase
On April 29, 2011, Format, Inc. (n/k/a Power Solutions International, Inc.) completed a reverse recapitalization transaction, in which PSI Merger Sub, Inc., a Delaware corporation that was newly-created as a wholly-owned subsidiary of Format, merged with and into The W Group, Inc. and The W Group remained as the surviving corporation of the merger. In that transaction, The W Group became a wholly-owned subsidiary of Power Solutions International, Inc. The reverse recapitalization transaction was consummated under Delaware corporate law pursuant to an agreement and plan of merger, dated as of April 29, 2011. Pursuant to this merger agreement, all of the outstanding shares of common stock of The W Group held by the three stockholders of The W Group at the closing of the reverse recapitalization converted into shares of our common stock and shares of preferred stock. In connection with the reverse recapitalization and Gary Winemaster and Thomas Somodi entering into a purchase and sale agreement, (1) The W Group and Mr. Somodi entered into a termination agreement, pursuant to which each of Mr. Somodi’s employment agreement with The W Group (the term of which expired in April 2010) and the subscription agreement between The W Group and Mr. Somodi were terminated; and (2) Power Solutions International, Inc. entered into a new employment agreement with Mr. Somodi, which sets forth the terms of Mr. Somodi’s employment with us. See “Certain Relationships and Related Party Transactions — Purchase and Sale Transaction” below under Item 13 for a description of the purchase and sale agreement between Mr. Winemaster and Mr. Somodi, and see “Executive Compensation — Employment Agreements” below under Item 11 for a description of the new employment agreement with Mr. Somodi.
The transaction is accounted for as a reverse recapitalization because, among other reasons: (1) the management of The W Group immediately prior to the reverse recapitalization dominated the management of Power Solutions International, Inc immediately following the reverse recapitalization (i.e., the Chief Executive Officer, Chief Operating Officer and Chief Financial Officer and the Senior Vice President of Power Solutions International, Inc. are the same individuals who then held those titles with The W Group, Inc.) and (2) immediately prior to the consummation of the reverse recapitalization, Format, Inc. had nominal assets and operations.
Concurrently with the closing of the reverse recapitalization, on April 29, 2011, we completed a private placement of shares of our Series A Convertible Preferred Stock, together with warrants to purchase shares of our common stock, to 29 accredited investors, receiving total gross proceeds of $18,000,000. Each share of preferred stock was convertible into a number of shares of our common stock equal to $1,000 divided by the conversion price
42
Table of Contents
then in effect, subject to limitations on conversion set forth in the certificate of designation for the preferred stock. For every one share of our common stock issuable upon conversion of preferred stock purchased in the private placement, each investor in the private placement also received a warrant to purchase one-half of a share of our common stock, at an exercise price of $13.00 per share, as adjusted for the migratory merger and the reverse split, and subject to limitations on exercise and further adjustment as set forth in the warrants.
Concurrently with the closing of the reverse recapitalization, we issued to Roth Capital Partners, LLC, as compensation for its role as placement agent, a warrant. In accordance with its terms, on September 1, 2011, Roth Capital Partners “cashlessly” exercised in full this warrant. Prior to its exercise in full, this warrant represented the right to purchase an aggregate of 105,000 shares of our common stock, with an exercise price of $13.20 per share, as adjusted for the migratory merger and the reverse split and subject to further adjustment for non-cash dividends, distributions, stock splits or other reorganizations or reclassifications of our common stock. The warrant was not exercisable prior to the effectiveness of the reverse split, and was scheduled to expire on April 29, 2016.
In connection with the reverse recapitalization and the private placement, Format, Inc. entered into a stock repurchase and debt satisfaction agreement, dated as of April 29, 2011, with Ryan Neely, who was the sole director and executive officer of Format, Inc. immediately prior to the closing of the reverse recapitalization, and his wife, Michelle Neely. Pursuant to this agreement, at the time the reverse recapitalization was completed, (1) Format repurchased 93,750 shares (3,000,000 shares without giving effect to the reverse split) of Format common stock from Ryan and Michelle Neely, and (2) Ryan Neely and Michelle Neely terminated all of their interest in, and released Format from all obligations Format had with respect to, the loans made by Ryan Neely and Michelle Neely to Format, Inc. from time to time (which, as of the closing of the transactions contemplated by the stock repurchase and debt satisfaction agreement, were in an aggregate principal amount of $114,156), in exchange for aggregate consideration of $360,000. As part of the stock repurchase agreement, Ryan and Michelle Neely also released Format from any other obligations Format owed to them, which included the balance of accrued liabilities on Format’s balance sheet of approximately $50,000. The remaining liabilities of Format, which consisted of accounts payable, were settled in connection with but prior to, the consummation of the recapitalization with the available cash on Format’s balance sheet, and Format also transferred to Ryan Neely all of its rights and obligations under the real property lease relating to Format’s sole office space. In addition, assets, consisting of prepaid expenses, office equipment and furniture, with a net book value of approximately $5,000, were written off.
As a result of the reverse recapitalization transaction, Power Solutions International, Inc. succeeded to the business of The W Group.
Replacement of Prior Credit Agreement
On April 29, 2011, in connection with the closing of the reverse recapitalization, the repurchase of shares of our common stock from Ryan and Michelle Neely and the private placement, Power Solutions International, Inc. and The W Group entered into a loan and security agreement with Harris N.A., and such loan and security agreement replaced the then existing loan and security agreement that The W Group had with its senior lender prior to the closing of the reverse recapitalization. Pursuant to the loan and security agreement with Harris N.A., among other things, Power Solutions International, Inc. became a party to the loan and security agreement, the maximum loan amount under the senior credit facility was reduced from the maximum loan amount under The W Group’s prior credit facility to reflect The W Group’s repayment in full of its two previously outstanding term loans under the prior credit facility and the financial covenants under the prior credit facility were replaced with a new fixed charge coverage ratio. See “— Liquidity and Capital Resources — Credit Agreement” below for a discussion of our current credit facility and The W Group’s prior credit facility, which was replaced by the current credit facility in connection with the reverse recapitalization.
Reverse Split and Migratory Merger
In connection with, and prior to the consummation of, the reverse recapitalization, the board of directors of Format approved the reverse split and the migratory merger. On August 25, 2011, we held a special meeting of our stockholders at which our stockholders approved the reverse split, the migratory merger and related matters. On August 26, 2011, Power Solutions International, Inc., a Nevada corporation, merged with and into its wholly owned subsidiary, Power Solutions International, Inc., a Delaware corporation, pursuant to an agreement and plan of merger between Power Solutions International, Inc., a Delaware corporation, and Power Solutions International, Inc., a Nevada corporation. Power Solutions International, Inc., a Delaware corporation, continued as the surviving entity of the migratory merger. Pursuant to the migratory merger, we changed our state of incorporation from Nevada to Delaware and each 32 shares of our common stock converted into one share of common stock of the
43
Table of Contents
surviving entity in the migratory merger, thereby effecting a 1-for-32 reverse stock split of our common stock. Upon the consummation of the migratory merger (including the reverse split of our common stock effected thereby), the 113,960.90289 then-issued and outstanding shares of preferred stock automatically converted into an aggregate of 9,496,753 shares of our common stock. The consolidated financial statements included in this report have been restated to retroactively reflect the reverse split in accordance with SEC Staff Accounting Bulletin 4C Equity Accounts — Change in Capital Structure and ASC 260 Earnings Per Share (ASC 260). The conversion of shares of preferred stock to common stock has been presented prospectively in our financial statements, effective with the reporting periods as of, and for the three and nine months ended, September 30, 2011, in accordance with ASC 260. See Note 14 to the Consolidated Financial Statements, “Stockholders’ Equity”, for additional information regarding the financial statement impact of the reverse split and migratory merger.
Further, in connection with the private placement, each of our current stockholders who was a stockholder of The W Group and who received shares pursuant to the reverse recapitalization or received, as a gift, stock from the stockholders of The W Group, entered into a voting agreement, pursuant to which such person agreed to vote his shares of our common stock and preferred stock, as applicable, in favor of the reverse split and the migratory merger. The persons who entered into the voting agreements held, in the aggregate, a substantial majority of the voting securities of our company. Accordingly, approval of the reverse split and the migratory merger was probable. Pursuant to the terms of the voting agreements, at the special meeting of our stockholders held on August 25, 2011, each of the individuals subject to a voting agreement voted all of his shares of our common stock and preferred stock to approve the migratory merger and related matters.
Stock Purchase Agreement with Management Stockholder
The company and Gary S. Winemaster, the company’s Chief Executive Officer and President, and a member of the Board of Directors of the company, entered into a Stock Purchase Agreement, pursuant to which, on October 31, 2011, we purchased from Mr. Winemaster 830,925 shares of company common stock for $4.25 million, or $5.11 per share. These shares were returned to our treasury as authorized and issued, but not outstanding, shares of common stock of the company. For additional detail regarding the stock purchase agreement between Mr. Winemaster and the Company, see “Certain Relationships and Related Party Transactions – Purchase and Sale Transaction” under Item 13 below.
Factors affecting comparability
We have set forth below selected factors that we believe have had, or can be expected to have, a significant effect on the comparability of recent or future results of operations:
Public company expenses
As a result of the reverse recapitalization, we are now a public company. As a result, our general and administrative expenses have increased as we pay our employees, legal counsel and accountants to assist us in, among other things, establishing and maintaining a more comprehensive compliance and board governance function, establishing and maintaining internal control over financial reporting in accordance with Section 404 of the Sarbanes-Oxley Act, and preparing and distributing periodic public reports under the federal securities laws. In addition, as a public company the cost of director and officer liability insurance has increased. We have also incurred additional costs associated with compensation of non-employee directors.
Stock-based and other executive compensation
Prior to the reverse recapitalization and the private placement, we have not granted or issued any stock-based compensation. Accordingly, we have not recognized any stock-based compensation expense. We may consider adopting an equity compensation plan and making awards under such a plan to our directors, officers and other employees and possibly to consultants. As a result, to the extent relevant, we may incur non-cash, stock-based compensation expenses in future periods.
Events affecting sales and profitability comparisons
Our quarter-to-quarter and quarter-over-quarter operating results (including our sales, gross profit and net income) and cash flows can be impacted by a variety of internal and external events associated with our business operations. Examples of such events include (1) changes in regulatory emission requirements (which generally occur on January 1 of the year in which they become effective), (2) customer product phase-in/phase-out programs, (3) supplier product (e.g., a specific engine model) phase-in/phase-out programs, (4) changes in pricing by suppliers to us of engines, components and other parts (typically effective January 1 of any year), and (5) changes in our
44
Table of Contents
pricing to our customers (typically effective January 1 of any year), which may be related to changes in the pricing by suppliers to us. In order to mitigate potential availability or pricing issues, customers may adjust their demand requirements from traditional patterns. We may also extend special programs to customers in advance of such events, and we are more likely to offer such programs in our fourth quarter of a year in anticipation of events expected to occur in the first quarter of the next year. The occurrence of any of the events discussed above may result in fluctuations in our operating results (including sales and profitability) and cash flows between and among reporting periods.
Results of operations
Year ended December 31, 2011 compared with the year ended December 31, 2010
Net sales
Our net sales increased $54.4 million (54.2%) to $154.9 million for the year ended December 31, 2011, compared to $100.5 million for the year ended December 31, 2010, of which an increase in sales volume (as opposed to price increases) accounted for approximately $49.2 million of the year over year increase.
Our alternative fuel power systems sales increased $47.3 million, and parts sales accounted for the remaining $7.1 million increase. The sales increase was driven by (i) a full year of power system sales to Asia-based customers, which accounted for $14.6 million of the increase in sales; (ii) a $6.4 million increase in sales of our alternative fuel large power systems introduced in late 2009 and (iii) sales to new customers and general increase in demand from existing customers.
Cost of sales
Our cost of sales increased $44.6 million (53.2%) to $128.5 million for the year ended December 31, 2011, from $83.9 million in 2010. The increase in cost of sales was primarily due to the increase in our sales volume. As a percentage of net sales, cost of sales decreased to 82.9% for the year ended December 31, 2011, compared to 83.5% for the year ended December 31, 2010. Production costs were spread over higher volumes which favorably affected cost of sales. In addition, the increase in sales, noted in Net sales above, occurred across the majority of our customer base, broadening our product mix, which also favorably impacted our cost of sales.
Gross profit
Our gross profit increased $9.8 million (59.0%) to $26.4 million for the year ended December 31, 2011, from $16.6 million in the year ended December 31, 2010. Our gross profit increased primarily due to the previously discussed increase in sales volume. As a percentage of net sales, gross profit was 17.1% for the year ended December 31, 2011, compared to 16.5% in 2010. The higher gross profit during the year 2011 was principally attributable to the broadened product mix and higher sales volume relative to production costs as described in Cost of sales above.
Research & development and engineering
Research & development and engineering expense increased $0.9 million (22.5%) to $4.7 million for the year ended December 31, 2011, as compared to $3.8 million in 2010 due to an increase in customer product support activities associated with the increase in sales and product development. Research & development and engineering activities are staff intensive; thus, costs incurred primarily consist of salary and benefits for professional engineers and amounts paid to third parties for contract services associated with our research and development activities. Compensation and benefits increased $1.0 million as we increased headcount to support the research & development and engineering of new power systems including the design and development of an 8.8 liter engine to meet anticipated customer requirements. This increase was partially offset by a $0.2 million decrease in emission certification fee expense. The remaining increase of $0.1 million was attributable to other research & development and engineering expenses, none of which was individually significant. As a percentage of net sales, research & development and engineering expenses decreased to 3.0% for the year ended December 31, 2011, compared to 3.8% for 2010. The decrease in the research & development and engineering costs as a percentage of net sales was due to the leveraging of these costs against higher sales volumes.
Selling and service expense
Selling and service expenses increased $1.2 million (22.0%) to $6.7 million for the year ended December 31, 2011, from $5.5 million in 2010. Compensation, benefits and commissions costs increased $0.3 million and warranty costs increased $0.5 million, both as a result of our increased product sales for the year ended December
45
Table of Contents
31, 2011 as compared to 2010. The remaining increase was attributable to increases in other expense categories, none of which was individually significant. As a percentage of net sales, selling and service expenses decreased to 4.3% in 2011 compared to 5.4% in 2010 as we effectively increased sales with our existing sales infrastructure.
General and administrative expense
General and administrative expenses increased $1.9 million (61.3%) to $5.2 million for the year ended December 31, 2011, from $3.3 million in 2010. The increase was principally attributable to (i) a $0.9 million increase in professional, consulting, and bank fees incurred in connection with our year end audit, reverse recapitalization and the refinancing of our credit facility in April 2011, (ii) $0.6 million for the cost of additional staff positions to support both our higher sales volume and public company responsibilities, and (iii) $0.3 million of public company costs. As a percentage of net sales, general and administrative expenses increased to 3.4% in the twelve months ended December 31, 2011, from 3.2% for 2010.
Other (income) expense
Interest expense decreased $0.8 million (37.1%) to $1.3 million for the year ended December 31, 2011, as compared to $2.1 million for the year ended December 31, 2010. Our average outstanding bank borrowings were $6.8 million lower for the year ended December 31, 2011 compared to the year ended December 31, 2010. This decrease was attributable to the payoff of our bank term debt and a reduction in our outstanding revolving line of credit from the proceeds received in the private placement. In addition, the weighted average borrowing rate on our bank debt decreased from 5.82% during the year ended December 31, 2010 to 4.11% for the year ended December 31, 2011.
We recognized a loss on debt extinguishment of $0.5 million in the year ended December 31, 2011, due to the write off of unamortized loan fees associated with our prior credit facility. The remaining unamortized loan fees were required to be expensed when we refinanced our prior credit facility with a new lender and repaid the balances outstanding under our prior credit agreement. See “Liquidity and Capital Resources — Credit Agreement” below for a further discussion regarding the refinancing of our prior credit facility.
Also, other expense, net was $1.1 million for the year ended December 31, 2011 as compared to zero for the same period in 2010. This amount includes $0.8 million of non-capitalizable transaction costs incurred in connection with the issuance of warrants in the $18.0 million private placement. The expense also includes $0.3 million related to the increase in the liability of the estimated value of private placement warrants for the year ended December 31, 2011. See “Reverse Recapitalization, Private Placement and Stock Repurchase” for further discussion of these costs.
Income tax expense
Our income tax expense increased $2.4 million to $2.8 million, as compared to $0.4 million in 2010. Our effective tax rate for the year ended December 31, 2011 was 40.6% as compared with 18.9% for the prior year. Our income tax expense for the year ended December 31, 2011 reflects the impact of non-deductible expenses associated with certain transactions costs incurred in connection with the reverse recapitalization and private placement warrants. See “Reverse Recapitalization, Private Placement and Stock Repurchase” for further discussion of these transactions. The increase in our effective tax rate in 2011 as compared to 2010 was also impacted by the extent to which research tax credits offset our income tax provision. Our taxable income and corresponding provision for the year ended December 31, 2011 increased over 2010 by more than the increase in offsetting research tax credits, which resulted in an increase in our effective tax rate. Absent changes to existing legislation, we expect these research tax credits, to the extent generated but not used, will be available for our benefit in the future. In addition, the combined corporate state income and replacement tax for Illinois increased from 7.3% in 2010 to 9.5% in 2011, which also adversely impacted our effective tax rate.
Year ended December 31, 2010 compared with the year ended December 31, 2009
Net sales
Our net sales increased $17.6 million (21.2%) to $100.5 million for the year ended December 31, 2010 compared to $82.9 million for the year ended December 31, 2009. This increase was driven by an increase in sales volume of approximately $15.7 million, with the remaining $1.9 million increase covering increases in supplier component costs. Net sales volume increased $10.6 million in 2010 compared to 2009 due to increases in sales of our alternative fuel larger power systems, which we initially introduced in 2009. In addition, sales to new, Asia-based customers contributed $3.1 million to sales volume growth year-over-year. The remaining $2.0 million increase in volume related to our existing product base.
46
Table of Contents
Cost of sales
Our cost of sales increased 26% to $83.9 million for the year ended December 31, 2010 from $66.5 million in the comparable period of 2009. The increase in cost of sales was primarily due to the increase in our sales volume. As a percentage of net sales, cost of sales increased to 83% for the year ended December 31, 2010, compared to 80% for the year ended 2009. Cost of sales as a percentage of net sales was lower in 2009 primarily due to (i) lower costs associated with products sold in a special program, whereby we offered our customer base the opportunity to purchase certain products scheduled for a supplier phase out in 2010 in order to avoid potential availability issues and future published price increases on those products, and (ii) cost control initiatives begun in 2008 which continued in 2009.
Gross profit
Our gross profit increased 1.5% to $16.6 million for the year ended December 31, 2010 from $16.4 million in the comparable period of 2009. Our gross profit increased primarily due to the previously discussed increase in sales volumes. As a percentage of revenue, gross profit was 17% for the year ended December 31, 2010 compared to 20% in 2009. The higher gross profit in 2009 was principally attributable to the lower material costs associated with the products sold in a special program discussed above in cost of sales and the cost control initiatives previously identified.
Research & development and engineering
Research & development and engineering expenses increased 41% to $3.8 million in the year ended December 31, 2010 from $2.7 million in the comparable period of 2009. Research & development and engineering salaries and benefits increased $0.7 million in 2010 compared to 2009 in connection with new customer product launches and increased product development activities. In addition, costs associated with the required initial and periodic testing of engines for emission compliance increased $0.6 million in 2010 compared to 2009. Net other expenses decreased $0.2 million, none of which was individually significant.
Selling and services expense
Selling and service expenses increased 21% to $5.5 million for the year ended December 31, 2010 from $4.5 million in the comparable period of 2009, although this expense remained consistent as a percentage of net sales year over year. The increase in selling and services expense was primarily attributable to an increase in salaries and benefits of $0.8 million to support our increased sales for the year ended December 31, 2010 as compared to 2009.
General and administrative expenses
General and administrative expenses increased 7% to $3.3 million in the year ended December 31, 2010 from $3.1 million in the comparable period of 2009. The increase in general and administrative expenses was principally attributable to a $0.3 million increase in salaries and benefits in 2010 arising from a restoration of compensation that had previously been subject to adjustments implemented as part of our cost control initiatives associated with lower sales and the global economic slowdown in 2009. Net other expenses decreased $0.1 million, none of which was individually significant. The sales growth from 2009 to 2010 outpaced the increase in general and administrative expenses, as we were able to effectively leverage our general and administrative costs to support our increased sales volume. As a result, general and administrative expenses decreased to 3% of net sales in 2010 from 4% in 2009.
Interest expense
Interest expense decreased 8% to $2.1 million for the year ended December 31, 2010, as compared to $2.3 million for the year ended December 31, 2009. Our average outstanding bank borrowings were $1.8 million lower in 2010 compared to 2009. Our average effective interest rate on our bank borrowings was 5.8% in 2010 as compared to 5.0% in 2009. We benefitted from lower average outstanding debt and reduced amortization of deferred financing costs in 2010. The lower outstanding debt was primarily attributable to scheduled payments of term loans and capital lease obligations. In addition, we wrote off additional deferred financing costs in 2009 as a result of an amendment to our existing credit agreement which reduced our overall borrowing capacity. Offsetting these reductions in interest expense was a higher average interest rate in 2010.
47
Table of Contents
Income tax expense
Our income tax expense decreased $1.0 million to $0.4 million for the year ended December 31, 2010 compared to 2009, primarily as the result of our lower taxable income. Our effective tax rate was 19% on income before taxes of $1.9 million for the year ended December 31, 2010 compared to an effective tax rate of 37% on pre-tax income of $3.8 million for the comparable period of 2009. The lower effective income tax rate in 2010 was attributable to available federal and state tax research credits generated and used.
Liquidity and Capital Resources
Our cash requirements are dependent upon a variety of factors, foremost of which is the execution of our strategic plan. We expect to continue to devote substantial capital resources to running our business. Our primary sources of liquidity are cash flows from operations, principally collections of customer accounts receivable and borrowing capacity under our credit facility. Prior to the amendment of our credit facility with BMO Harris Bank N.A. (formerly Harris N.A.) on March 20, 2012, our existing and historical financing arrangements required that cash received by us be applied against our revolving line of credit. Accordingly, we typically did not maintain cash or cash equivalents on our consolidated balance sheet. As a result of the amendment to our credit facility with BMO Harris Bank N.A., the cash balances are no longer automatically swept by BMO Harris Bank N.A. and, as a result, from time to time, we may carry cash balances on our consolidated balance sheet.
Based on our current forecasts and assumptions, we believe that our sources of cash and cash equivalents, namely the sales of our power systems and aftermarket products and access to borrowings on our existing or future credit facilities will be sufficient to meet our anticipated cash needs for working capital and capital expenditures over at least the next twelve months.
As of December 31, 2011, we had working capital of $14.2 million compared to $6.3 million as of December 31, 2010. Our working capital increased $7.9 million, which was primarily attributable to an increase in accounts receivable and a decrease in the current portion of our long-term debt, as well as a reduction in borrowings under our revolving line of credit. Accounts receivable increased $13.2 million from December 31, 2010 to December 31, 2011 due principally to an increase in sales. Specifically, our sales in 2011 were $54.4 million higher as compared to December 31, 2010. Deferred income tax assets increased $1.1 million for book expenses not currently deductible for tax. In addition, our inventories increased $1.2 million to support the higher level of sales activity. The current portion of long-term debt and the revolving line of credit decreased, by $4.2 million in the aggregate, having been paid off and/or reduced primarily from the proceeds received in connection with the private placement discussed above under Reverse Recapitalization, Private Placement and Stock Repurchase. Offsetting these working capital increases was a $10.4 million increase in accounts payable from December 31, 2010 to December 31, 2011 primarily due to the timing of purchases from vendors and a $1.8 million increase in accrued expenses primarily representing incremental costs to support the higher level of sales activity in 2011. Net other components of working capital increased $0.4 million from 2010 to 2011, none of which was individually significant.
A limited number of our customers have payment terms which may extend up to 150 days. As of December 31, 2011, and December 31, 2010, our trade receivables included $3.0 million and $2.7 million, respectively, of trade receivables which represented aggregate customer account balances subject to these terms. Of these amounts, $0.7 million and $1.4 million at December 31, 2011 and December 31, 2010, respectively, represented the portion of the balance outstanding beyond our normal trade terms of 30-45 days. Under our revolving line of credit which funds our working capital as needed, these receivables represent eligible collateral on the same basis as our other trade receivables and remain eligible as collateral upon which we may borrow up to their extended due date of 150 days. When collected, the cash from these receivables, as with all cash collected, is applied against our revolving line of credit, a component of our working capital.
Cash flows for the year ended December 31, 2011
Operating activities
For the year ended December 31, 2011, we used $1.0 million to fund our operations. We generated cash flow from net income of $4.6 million including $0.5 million in non-cash adjustments, principally depreciation, loss on debt extinguishment and an increase in the liability associated with the valuation of private placement warrants.
We generated cash from a $7.4 million increase in accounts payable arising from the timing of purchases from vendors and a $1.6 million increase in accrued liabilities arising from incremental costs to support the higher level of sales activities. These increases in cash were offset by a $13.0 million increase in accounts receivable due to an increase in our sales volume for which we had not yet collected the cash and a $1.2 million increase in inventories purchased to support the sales activity. We also had other net cash uses of $0.4 million none of which was individually significant.
48
Table of Contents
Investing activities
Net cash used in investing activities of $1.6 million for the year ended December 31, 2011 related primarily to the acquisition of property, equipment and other assets.
Financing activities
We generated $2.5 million of cash from financing activities for the year ended December 31, 2011. In connection with the private placement for which we issued preferred stock and warrants to purchase our common stock, we generated gross proceeds of $18.0 million. In addition, we refinanced our revolving line of credit with a new bank, Harris, N.A. (now known as BMO Harris Bank N.A.) under which our initial proceeds from borrowings were $18.3 million. The terms of the revolving line of credit with BMO Harris Bank N.A. are discussed below under “Credit Agreement.” The proceeds from the private placement and revolving line of credit were used to pay off our existing term loans and our revolving line of credit with our prior lender, Fifth Third Bank. We used $21.6 million in cash to payoff of the prior revolving line of credit and $7.9 million in cash to pay off other scheduled debt payments. We used $4.7 million of cash to pay transaction and financing costs associated with the private placement and refinancing of our revolving line of credit.
We also had a $3.3 million increase in our cash overdraft balance as of December 31, 2011 over December 31, 2010, which offset the cash used. Prior to the amendment of our credit facility with BMO Harris Bank N.A. on March 20, 2012, our revolving line of credit required that our cash be applied against our revolving line of credit. As such, we did not maintain a cash balance, and we borrowed on the revolving line of credit to fund outstanding checks as they cleared our bank. Our cash overdrafts fluctuated based on the timing of checks issued which had not yet cleared our bank as of a given date. In addition, $1.3 million in cash was provided in net borrowings for the year ended December 31, 2011 under our current revolving line of credit offsetting these increases was $4.3 million used to repurchase shares of our common stock. No other financing activities were individually significant.
Cash Flows for the year ended December 31, 2010
Operating activities
For the year ended December 31, 2010, we generated cash flows from operations of $3.9 million, of which $2.6 million arose from net income and other non-cash items of depreciation and receivable allowances, as compared to $3.3 million in 2009.
We also realized a reduction in our working capital during the year, which contributed to the cash generated from operations, primarily arising from a $12.0 million reduction in accounts receivable that was partially offset by a $9.3 million reduction in accounts payable and a $1.0 million increase in our inventories. The decrease in accounts receivable and accounts payable primarily arose from a high level of sales activity occurring in the fourth quarter of 2009, which resulted in both an increase in receivables from those sales and related payables from the purchase of inventories to support those sales. We collected the receivables and paid the corresponding payables in the first quarter of 2010. The $12.0 million change in accounts receivable also includes an increase of $1.1 million due from customers with payment terms of up to 150 days to $2.7 million from $1.6 million as of December 31, 2009, due to an increase in shipments to these customers in 2010.
Investing activities
Net cash used in investing activities of $0.6 million in the year ended December 31, 2010, related primarily to the acquisition of fixed assets. Fixed asset expenditures principally arose from the purchase of tooling and transportation equipment.
Financing activities
During 2010, our financing activities included scheduled payments of $1.7 million of bank term debt and $0.5 million of capital lease obligations and other notes payable. Our overall revolving line of credit decreased $0.8 million principally arising from the cash flows generated from operations. We also used $0.3 million of cash during the year for the payment of financing fees in connection with the reverse recapitalization and private placement. We also had a $0.1 million decrease in cash overdrafts. At December 31, 2010, we were not in compliance with certain of our bank covenants, including our senior debt leverage and our fixed charge coverage ratios. On January 20, 2011, we obtained a waiver from our bank for these events of non-compliance. Subsequent to December 31, 2010, we completed a reverse recapitalization and private placement offering on April 29, 2011, which resulted in the repayment in full of our remaining term debt, and we also refinanced our existing revolving line of credit with another bank.
49
Table of Contents
Cash Flows for the year ended December 31, 2009
Operating activities
In the year ended December 31, 2009, we generated cash flows from operations of $3.4 million, which consisted primarily of net income of $3.3 million, including non-cash adjustments (primarily for depreciation) of $0.9 million.
With respect to our working capital, changes in accounts receivable and inventories, net of accounts payable and income taxes payable had a nominal net impact on cash flows from operations. Although our receivables and inventories increased by $9.6 million and $4.9 million year over year, these increases were offset by a $13.2 million and $1.2 increase in accounts payable and income taxes payable, respectively. The increase in receivables arose from sales activity occurring late in 2009. In spite of a general decrease in net sales in 2009, fourth quarter 2009 net sales were strong due to increased sales activity associated with customers purchasing product before our published January 1 price increases, product purchases by customers to cover transitional requirements associated with new mobile emission standards and a special program. See “Cost of Sales — Year ended December 31, 2010 compared with the year ended December 31, 2009” for further details of this program. Included in the $9.6 million increase in accounts receivable was an increase of $0.7 million due from customers with payment terms of up to 150 days to $1.6 million at December 31, 2009. In addition, our inventories increased from the purchase of components to support new programs arising in 2010, including sales of large alternative power systems. The inventories purchased to support the sales activity and the new programs for 2010, primarily accounted for the $13.2 million increase in accounts payable. In addition, cash flows of $1.2 million were generated from an increase in our income taxes payable. The increase in income taxes payable was attributable to the income generated late in 2009, with the resultant liability paid in 2010. Net other cash flows from operations were $0.2 million, none of which was individually significant.
Investing activities
Net cash used in investing activities related primarily to the acquisition of fixed assets of $0.4 million for the year ended December 31, 2009. Fixed asset expenditures principally arose from the purchase of custom tooling used in the production of components for power systems.
Financing activities
We used $3.0 million of cash for our financing activities in 2009, of which $1.6 million was used for the repayment of debt obligations. Specifically, we paid $1.2 million to our bank for scheduled term debt payments, and the remaining payments consisted of scheduled payments on capital lease obligations and other notes payable. We had a $0.6 million reduction in our revolving line of credit, which arose from a reduction in our working capital as we collected more cash from customer receivables during the period than what was required to pay trade payables and other obligations. We also had a $0.7 million decrease in cash overdrafts.
Credit Agreement
In connection with the consummation of the reverse recapitalization and the private placement, on April 29, 2011, we entered into a loan and security agreement with certain lenders and Harris N.A. (now known as BMO Harris Bank N.A.), as agent for the lenders. That credit agreement replaced the loan and security agreement with Fifth Third Bank, the terms of which are discussed below. Prior to the amendment of our credit facility with BMO Harris Bank N.A., as discussed below, our credit agreement provided for borrowings of up to $35.0 million under a revolving line of credit, which line of credit was scheduled to mature on April 29, 2014 and had a variable interest rate as described below. Borrowings under our credit agreement are collateralized by substantially all of our assets. Under our credit agreement, we were required to meet certain financial covenants, including a minimum monthly fixed charge coverage ratio of not less than 1.1 to 1.0 and a limitation on annual capital expenditures, the testing of which commenced on April 30, 2011. We were in compliance with the financial covenants under our current credit facility as of December 31, 2011. Our credit agreement also contains customary covenants and restrictions applicable to us, including agreements to provide financial information, comply with laws, pay taxes and maintain insurance, restrictions on the incurrence of certain indebtedness, guarantees and liens, restrictions on mergers, acquisitions and certain dispositions of assets, and restrictions on the payment of dividends and distributions. In addition, our credit agreement requires our cash accounts to be held with BMO Harris Bank N.A. Prior to the
50
Table of Contents
amendment of the credit facility, our cash deposits in the new line of credit account were swept by BMO Harris Bank N.A. daily and applied against the outstanding balance on our new line of credit. As a result, we maintained a zero cash balance in our bank deposit account, and we borrowed on the line of credit on a daily basis to fund our cash disbursements.
Except as modified and discussed under the amended credit agreement with BMO Harris Bank N.A. below, under our credit agreement (in contrast to the prior credit agreement discussed below): (a) Power Solutions International, Inc. is a party to the new credit agreement and pledged the equity interests of The W Group to BMO Harris Bank N.A.; (b) there are no term loans; (c) the new line of credit bears interest at BMO Harris Bank N.A.’s prime rate (3.25% at December 31, 2011) plus an applicable margin ranging from 0% to 0.50% or, at our option, a portion of the new line of credit can be designated to bear interest at LIBOR plus an applicable margin ranging from 2.00% to 2.50%; (d) there is a higher limit on annual capital expenditures; (e) there is no maximum quarterly senior debt leverage ratio; and (f) there is a fixed charge coverage ratio similar to the fixed charge coverage ratio in the prior credit agreement with Fifth Third Bank, except that the fixed charge coverage ratio under the new credit agreement excludes historical debt service on Term Loan A and Term Loan B (each as defined and discussed below) and certain other one-time expenses. As of December 31, 2011, $4.7 million of our outstanding borrowings under our revolving line of credit bears interest at the prime rate, which equates to 3.25% with the applicable margin included. The remaining outstanding balance as of December 31, 2011, of $15.0 million has been designated to bear interest at the LIBOR rate, plus an applicable margin which equates to 2.29%. The unused and available line of credit balance was $15.3 million at December 31, 2011.
On March 20, 2012, the current credit agreement with BMO Harris Bank N.A was amended to increase the total credit facility from $35.0 million to $50.0 million and is now scheduled to mature on March 20, 2017. Under the terms of the amended agreement (in contrast to the original BMO Harris Bank N.A. agreement): (a) the revolving line of credit bears interest at Harris’ prime rate plus an applicable margin ranging from 0% to 0.50%; or, at our option, all or a portion of the revolving line of credit can be designated to bear interest at LIBOR plus an applicable margin ranging from 1.75% to 2.25%; (b) the unused line fee has been reduced to 0.25%; and (c) we are only required to report our compliance with the fixed charge coverage ratio for any month when our excess availability, as defined in the amended agreement, is less than the liquidity threshold, as defined in the amended agreement and we must continue to report our compliance with the applicable bank covenants until we have exceeded the liquidity threshold for 60 consecutive days. In addition, our cash balances are no longer automatically swept by BMO Harris Bank N.A., and as a result, from time to time, we may carry cash balances on our consolidated balance sheet. The liquidity threshold is defined as the greater of (i) $7,500,000 or (ii) 12.5% of the total credit facility of $50.0 million as may be reduced from time to time pursuant to the terms of the amended agreement.
On April 29, 2011, upon consummation of the reverse recapitalization and the other transactions referred to above under “— Significant Developments,” we used net proceeds from the private placement and proceeds from a draw on the new line of credit to repay the prior loans (as discussed below) under the prior credit agreement with Fifth Third Bank in full. Upon consummation of the reverse recapitalization and immediately following the repayment of these prior loans on April 29, 2011, availability under the new line of credit was approximately $12.7 million.
The prior credit agreement was entered into in 2008 among Fifth Third Bank and The W Group and its subsidiaries. The initial proceeds from the prior credit agreement were used to retire the revolving line of credit and term loans with our predecessor bank. The prior credit agreement provided for a revolving line of credit of up to $37.5 million, a term loan of $8.7 million (“Term Loan A”) and a term loan of $2.4 million (“Term Loan B”), which prior loans collectively were scheduled to mature on July 15, 2013 and had variable interest rates. Under the terms of the prior credit agreement with Fifth Third Bank, we had the ability to elect whether outstanding amounts under the prior loans accrued interest based on the prime rate plus a margin or LIBOR plus a margin. Prior to being repaid in full, the loans under our prior credit agreement were collateralized by substantially all of our assets. Under the prior credit agreement, we were required to maintain our cash accounts with Fifth Third Bank. We had our cash deposits in our prior line of credit account swept by Fifth Third Bank daily and applied against the outstanding line of credit balance. As a result, we maintained a zero cash balance in our prior line of credit account, and we borrowed on our prior line of credit on a daily basis to fund our cash disbursements. Outstanding borrowings under our prior line of credit were $25.4 million and $21.6 million at April 29, 2011 (immediately prior to the repayment of the prior line of credit) and December 31, 2010, respectively. Prior to its repayment in full in connection with the closing of the reverse recapitalization, principal payments of Term Loan A were payable in quarterly installments ranging from $0.2 million to $0.6 million over the life of the loan. Term Loan A had an outstanding balance of $5.1 million and $5.6 million as of April 29, 2011 (immediately prior to the repayment of the loan balance) and December 31, 2010, respectively. Prior to its repayment in full in connection with the closing of the reverse
51
Table of Contents
recapitalization, principal payments of Term Loan B were payable in quarterly installments of less than $0.1 million over the life of the loan plus a balloon payment at maturity. Term Loan B had an outstanding balance of $2.1 million and $2.1 million as of April 29, 2011 (immediately prior to the repayment of the loan balance) and December 31, 2010, respectively. In addition to scheduled quarterly payments, prior to its replacement, the prior credit agreement required an annual repayment equal to 60% of excess cash flow.
Our prior line of credit was previously amended, in August 2009, to reduce the maximum borrowings from $37.5 million to $29.0 million, bearing interest at Fifth Third Bank’s prime rate (3.25% at December 31, 2009) plus an applicable margin ranging from 2.25% to 2.50%. Prior to the replacement of our prior credit agreement with Fifth Third Bank on April 29, 2011, at our option a portion of the prior line of credit could be designated to bear interest at LIBOR, subject to a 2.00% floor, plus an applicable margin ranging from 3.25% to 3.50%. At December 31, 2010, the entire outstanding balance of $21.6 million had been designated to bear interest at the LIBOR rate, plus margin. The interest rate on our prior line of credit was 5.50% at December 31, 2010.
Off-balance sheet arrangements
We do not have any material off-balance sheet arrangements.
Critical accounting policies and estimates
The discussion and analysis of our financial condition and results of operations are based on our consolidated financial statements, which have been prepared in accordance with accounting principles generally accepted in the United States (“GAAP”). The preparation of these financial statements in accordance with GAAP requires us to make estimates, assumptions and judgments that affect the reported amounts of assets, liabilities, revenues and expenses, and related disclosure of contingent assets and liabilities. On an on-going basis, we evaluate our estimates, assumptions and judgments, including those related to revenue recognition, bad debts, inventories, warranties, private placement warrants and income taxes. We base our estimates on historical experience and on various other assumptions that we believe to be reasonable under the circumstances, the results of which form the basis for making judgments about the carrying values of assets and liabilities and our revenue recognition. Actual results may differ from these estimates under different assumptions or conditions.
Revenue recognition
We recognize revenue at the time title and risk of loss of inventory passes to the customer, which is typically upon shipment of goods. From time to time, we recognize revenue upon billing for goods which are not immediately shipped at the request and for the convenience of our customer, otherwise known as a “bill and hold” arrangement. In these cases, revenue is recognized under the same terms and conditions as any other sale, except that the products are held by us until the customer initiates the shipment of the product from our warehouses. Transfer of the title and risk of loss pass to the customer, and there are no future performance obligations, at the time the bill and hold sale is recognized. Any product that has been sold under a bill and hold arrangement is segregated from our owned inventory. We did not enter into any bill and hold arrangements during 2011.
We classify shipping and handling charges billed to customers as revenue. Shipping and handling costs paid to others are classified as a component of cost of sales when incurred.
Allowance for doubtful accounts
The carrying amount of accounts receivable is reduced by a valuation allowance that reflects our management’s best estimate of the amounts that will not be collected. Management specifically reviews all past due accounts receivable balances and, based on historical experience and an assessment of current creditworthiness, estimates the portion, if any, of the balance that will not be collected.
Inventories
Our inventories consist primarily of engines and parts. Engines are valued at the lower of cost, as determined by specific serial number identification, or market value. Parts are valued at the lower of cost (first-in, first out) or market value.
We write down inventory for an estimated amount equal to the difference between the cost of the inventory and the estimated realizable value. Estimated realizable value for each item in inventory is based upon our estimation of future demand for the quantity of inventory on hand. In determining an estimate of future demand, multiple factors are taken into consideration including (i) customer purchase orders and customer forecasted demand; (ii) historical sales/usage for each inventory item; and (iii) utilization within a current or anticipated future
52
Table of Contents
power system. These factors are primarily based upon quantifiable information and therefore, we have not experienced significant differences in inventory valuation due to variances in our estimation of future demand. We estimate that, in 2011, a 10% variance in the estimated net realizable value of our inventory and its original cost would have had an approximately $61,000 effect on our cost of goods sold and the value of our inventory.
Warranty programs
We offer a standard limited warranty on the workmanship of our products that in most cases covers defects for a period of (i) one year from the date of shipment or (ii) six months from the date products are placed into service, whichever occurs first. Warranties for certified emission products are mandated by the EPA and/or the CARB and are longer than our standard warranty on certain emission related products. Our products also carry limited warranties from suppliers. Costs related to supplier warranty claims are borne by the supplier; our warranties apply only to the modifications we make to supplier base products. We estimate and record a liability, and related charge to income, for our warranty program at the time products are sold to customers. Our estimates are based on historical experience and reflect management’s best estimates of expected costs at the time products are sold. We make adjustments to our estimates in the period in which it is determined that actual costs may differ from our initial or previous estimates. In 2011, a 10% change in the amount of historical warranty expense would have increased our warranty liability and related costs by approximately $70,000.
Private Placement Warrants
For every share of our common stock issuable upon conversion of preferred stock purchased in the private placement, each investor in the private placement also received a warrant to purchase one-half of a share of our common stock, at an exercise price of $13.00 per share, as adjusted for the reverse split and subject to further adjustment for non-cash dividends, distributions, stock splits or other reorganizations or reclassifications of our common stock. These warrants represent the right to purchase a total of 750,002 shares of our common stock, but the private placement warrants were not exercisable prior to the reverse split. The private placement warrants are also subject to full ratchet anti-dilution protection, whereby, upon the issuance of shares of our common stock at a price below the then-current exercise price of the private placement warrants (or the issuance of securities convertible into or exercisable for shares of our common stock at a price below the then-current exercise price of the private placement warrants), subject to specified exceptions, the exercise price of the private placement warrants will be reduced to the effective price of our common stock so issued (or issuable upon conversion of issued securities). The private placement warrants will expire on April 29, 2016.
The private placement warrants issued with the 18,000 shares of our preferred stock had a fair value of $2,887,500 at the closing of the reverse recapitalization transaction and the private placement on April 29, 2011, determined based upon an agreed-upon exercise price of the private placement warrants; the agreed-upon purchase price for (value of) our preferred stock and private placement warrants, in the aggregate as agreed-upon with the investors in the private placement and an assessment of the exercise price, risk-free interest rate, estimated price volatility, term and dividend yield, all as inputs using the Black-Scholes option pricing model.
The fair value of the private placement warrants at December 31, 2011 was also estimated using the Black-Scholes option pricing model. However, due to the limited trading activity in our common stock in 2011, the fair value of our common stock as of December 31, 2011, was established through multiple valuation techniques, including (a) the income approach in the form of the discounted cash flow method, and (b) the market approach in the form of (i) the guideline public company method and (ii) the merger and acquisition method.
The liability for the private placement warrants is a fair value instrument as measured under ASC Topic 825, “Financial Instruments.” As such, the private placement warrants liability is valued based upon unobservable inputs and thus is considered a “Level 3” financial instrument, the measurement of which involves various assumptions, as described in Note 8 to the Consolidated Financial Statements, “Fair Value of Financial Instruments.” These assumptions include an assessment of the risk-free interest rate, an anticipated volatility factor, dividend yield and other assumptions. Since the date of issuance of the private placement warrants, the liability associated with these warrants has increased from $2.9 million at April 29, 2011 to $3.3 million at December 31, 2011. If all other assumptions are held constant, the recorded liability of the private placement warrants would increase or decrease by approximately $0.5 million due to a 10% change in the concluded enterprise value of our company adjusted for interest-bearing debt.
53
Table of Contents
Income taxes
Our income tax expense and deferred tax assets and liabilities reflect management’s best assessment of estimated future taxes to be paid. We are subject to income taxes in the United States. Significant judgments and estimates are required in determining the consolidated income tax expense.
Deferred income taxes arise from temporary differences between the tax and financial statement recognition of revenue and expense. These differences relate primarily to different depreciation methods for financial statement and income tax purposes, nondeductible allowances for accounts receivable and inventory, certain accrued expenses and research and development credit carryforwards. In evaluating our ability to recover our deferred tax assets within the jurisdiction from which they arise, we consider all available positive and negative evidence, including scheduled reversals of deferred tax liabilities, projected future taxable income, tax-planning strategies, and results of recent operations. In projecting future taxable income, we begin with historical results adjusted for changes in accounting policies and incorporate assumptions, including the amount of future state and federal pretax operating income, the reversal of temporary differences, and the implementation of feasible and prudent tax-planning strategies. These assumptions require significant judgment about the forecasts of future taxable income and are consistent with the plans and estimates we are using to manage the underlying businesses. In evaluating the objective evidence that historical results provide, we consider three years of cumulative operating income (loss). As of December 31, 2011, a valuation allowance was not required.
Changes in tax laws and rates could also affect recorded deferred tax assets and liabilities in the future. Management is not aware of any such changes that would have a material effect on the Company’s results of operations, cash flows, or financial position.
The calculation of our tax liabilities involves dealing with uncertainties in the application of complex tax laws and regulations in a multitude of jurisdictions across our operations.
ASC 740 provides that a tax benefit from an uncertain tax position may be recognized when it is more likely than not that the position will be sustained upon examination, including resolutions of any related appeals or litigation processes, on the basis of the technical merits. ASC 740 also provides guidance on measurement, derecognition, classification, interest and penalties, accounting in interim periods, disclosure, and transition. We recognize tax liabilities in accordance with ASC 740, and we adjust these liabilities when our judgment changes as a result of the evaluation of new information not previously available. Because of the complexity of some of these uncertainties, the ultimate resolution may result in a payment that is materially different from our current estimate of the tax liabilities. These differences will be reflected as increases or decreases to income tax expense in the period in which new information is available. As of December 31, 2011 and 2010, we have not recorded any tax benefit or tax liability for uncertain tax positions.
Impact of recently issued accounting standards
In May 2011, the FASB issued Accounting Standards Update (“ASU”) No. 2011-04, an update to Topic 820 — Fair Value Measurements and Disclosures of the Accounting Standards Codification. This update provides guidance on how fair value accounting should be applied where its use is already required or permitted by other standards and does not extend the use of fair value accounting. This ASU is effective for interim and annual periods beginning after December 15, 2011, and will be applied prospectively. Based upon the nature of its financial assets and liabilities, we do not expect the adoption to have a significant impact on its consolidated financial statements.
In June 2011, the FASB released ASU No. 2011-05, “Presentation of Comprehensive Income,” which eliminates the option to present the components of other comprehensive income in the statement of changes in stockholders’ equity. Instead, entities will have the option to present the components of net income, the components of other comprehensive income and total comprehensive income in a single continuous statement or in two separate but consecutive statements. In addition, this update requires entities to present the reclassification adjustments out of accumulated other comprehensive income by component in both the statement where net income is presented and the statement where other comprehensive income is presented. However, in December 2011, the FASB issued ASU No. 2011-12, “Deferral of the Effective Date for Amendments to the Presentation of Reclassifications of Items Out of Accumulated Other Comprehensive Income in Accounting Standards Update No. 2011-05,” which indefinitely deferred this provision of ASU 2011-05. The amendments do not change the items reported in other comprehensive income or when an item of other comprehensive income is reclassified to net income. This guidance is effective for fiscal years, and interim periods within those years, beginning after December 15, 2011, and will be applied retrospectively. As this guidance only revises the presentation of comprehensive income, the adoption of this guidance will not affect our financial position, results of operations or cash flows.
54
Table of Contents
Item 7A. Quantitative and Qualitative Disclosures About Market Risk.
As a smaller reporting company, we are not required to provide the information required by this item.
Item 8. Financial Statements and Supplementary Data.
See Index to Financial Statements and Financial Statement Schedule on page F-1.
Item 9. Changes in and Disagreements With Accountants on Accounting and Financial Disclosure.
None.
Item 9A. Controls and Procedures.
Disclosure Controls and Procedures
As a result of the reverse recapitalization, Power Solutions International, Inc. succeeded to the business of The W Group. Since the consummation of the reverse recapitalization, we have not been engaged in the business or operations conducted by Format prior to the reverse recapitalization. Accordingly, we do not in any way maintain the disclosure controls and procedures or the internal control over financial reporting of Format in effect prior to the reverse recapitalization, and such disclosure controls and procedures and internal control over financial reporting of Format are not relevant to us.
Prior to the consummation of the reverse recapitalization, The W Group was a private operating company and, as a result of the reverse recapitalization, we became a public company subject to public company reporting obligations. As a result, we have had to, and we currently continue to, enhance and supplement our internal accounting resources with additional accounting and finance personnel with the requisite technical and public company experience and expertise, and more generally strengthen our disclosure controls and procedures and our internal control over financial reporting to enable us to accurately and timely prepare our consolidated financial statements and otherwise satisfy these reporting obligations. In particular, in June 2011, we established a disclosure and compliance committee (the “Disclosure Committee”), consisting of senior members of our finance and accounting department and other members of senior management, and adopted disclosure and compliance committee guidelines. The purpose of the Disclosure Committee is to assist our Chief Executive Officer, our Chief Financial Officer and our board of directors in compliance with the rules and regulations of the Securities and Exchange Commission, with particular focus on our reporting and public disclosure requirements under the Exchange Act and the Sarbanes-Oxley Act of 2002, as well as assisting our Chief Executive Officer and our Chief Financial Officer in fulfilling their obligations pursuant to Sections 302, 404 and 906 of the Sarbanes-Oxley Act of 2002. During the fiscal year ended December 31, 2011, we also retained additional staff in our finance and accounting department, and on July 18, 2011 we hired an additional senior financial professional with prior public company experience, thereby further strengthening the overall capabilities of our finance and accounting department. In August 2011, we created an internal accounting department and hired an internal audit manager with prior experience implementing and evaluating our compliance with Sarbanes-Oxley Act of 2002.
Because The W Group was a private operating company prior to the reverse recapitalization and we do not in any way maintain the internal control over financial reporting of Format in effect prior to the reverse recapitalization, we have not yet (as we are not yet required to have) performed an annual assessment of the effectiveness of our internal control over financial reporting pursuant to Section 404 of the Sarbanes-Oxley Act of 2002. Furthermore, as a smaller reporting company, we are not subject to the requirement that we provide an attestation report of our auditors on our internal control over financial reporting, and we will not be subject to such requirement until we become either an accelerated filer or a large accelerated filer. We intend to perform an assessment of our internal control over financial reporting pursuant to Section 404 of the Sarbanes-Oxley Act of 2002 as of the end of our fiscal year ending December 31, 2012 and include the results in our annual report on Form 10-K for such fiscal year. Any such annual assessment could identify significant deficiencies or material weaknesses in our internal control over financial reporting, and we cannot provide any assurances that we will be successful in remediating any deficiencies or weaknesses that may be identified.
We carried out an evaluation, under the supervision and with the participation of our management, including our Chief Executive Officer and Chief Financial Officer, of the effectiveness of our disclosure controls and procedures (as such term is defined in Rules 13a-15(e) and 15d-15(e) under the Exchange Act) as of the end of the period covered by this annual report. Our disclosure controls and procedures are designed to provide reasonable assurance that information required to be disclosed by us in the reports that we file or submit under the Exchange Act is recorded, processed, summarized and reported accurately and within the time frames specified in the SEC’s rules and forms and that information required to be disclosed by us in the reports that we file or submit under the
55
Table of Contents
Exchange Act is accumulated and communicated to our management, including our Chief Executive Officer and Chief Financial Officer, as appropriate to allow timely decisions regarding required disclosure. Based on such evaluation, our Chief Executive Officer and our Chief Financial Officer have concluded that our disclosure controls and procedures were effective as of December 31, 2011 at the reasonable assurance level, even though, following the reverse recapitalization, we and our internal auditors have not yet consummated any annual assessment of our internal control over financial reporting procedures pursuant to Section 404 of the Sarbanes-Oxley Act of 2002. Our Chief Executive Officer and Chief Financial Officer reached this conclusion based in large part on their assessment of (1) the financial expertise of our Chief Financial Officer, and other members of our finance and accounting department and the members of the Disclosure Committee, (2) the regular communications among such persons, including the members of the Disclosure Committee, and between them and others within our relatively small organization, with respect to all material developments in our business, and (3) the overall process of preparation and review of our financial and other disclosures.
Changes In Internal Control Over Financial Reporting
The additions to our finance and accounting department following the consummation of the reverse recapitalization during the period covered by this annual report, as described above, could be deemed to constitute significant changes that have materially affected our internal control over financial reporting.
Inherent Limitations on the Effectiveness of Controls
Our management does not expect that our disclosure controls and procedures or our internal controls will prevent or detect all errors and all fraud. A control system, no matter how well conceived and operated, can provide only reasonable, not absolute, assurance that the objectives of the control system are met. Further, the design of a control system must reflect the fact that there are resource constraints, and the benefits of controls must be considered relative to their costs. Because of the inherent limitations in a cost-effective control system, no controls can provide absolute assurance that misstatements due to error or fraud will not occur, and no evaluation of any such controls can provide absolute assurance that control issues and instances of fraud, if any, within our company have been detected.
These inherent limitations include the realities that judgments in decision-making can be faulty and that breakdowns can occur because of simple error or mistake. Controls can also be circumvented by the individual acts of some persons, by collusion of two or more people, or by management override of the controls. The design of any system of controls is based in part on certain assumptions about the likelihood of future events, and there can be no assurance that any design will succeed in achieving its stated goals under all potential future conditions. Projections of any evaluation of controls effectiveness to future periods are subject to risks. Over time, controls may become inadequate because of changes in conditions or deterioration in the degree of compliance with policies and procedures.
Not applicable.
Item 10. Directors, Executive Officers and Corporate Governance.
Management
The following table sets forth information concerning our executive officers and directors, including their ages and their position(s) with us and, with respect to our directors, the expiration of their current terms. For purposes of the discussion below, unless the context otherwise requires, “we,” “our,” “us,” “our company” and similar expressions used in this section refer to The W Group prior to the closing of the reverse recapitalization on April 29, 2011, and Power Solutions International, Inc. (f/k/a Format, Inc.), as successor to the business of The W Group, following the closing of the reverse recapitalization. In other words, references below to service on our board of directors or as one of our executive officers prior to the reverse recapitalization means service on the board of directors, or as an executive officer, as applicable, of The W Group.
56
Table of Contents
| Name |
Position |
Age | Executive Officer Since (1) |
Director Since |
Term Expires |
|||||||||||||
| Gary Winemaster |
Chairman of the Board, Chief Executive Officer and President | 54 | 2001 | 2001 | (2) | 2012 | ||||||||||||
| Thomas Somodi |
Chief Operating Officer and Chief Financial Officer | 59 | 2005 | N/A | N/A | |||||||||||||
| Kenneth Winemaster |
Senior Vice President and Secretary | 48 | 2001 | N/A | N/A | |||||||||||||
| Kenneth Landini |
Director | 55 | N/A | 2001 | (2) | 2012 | ||||||||||||
| H. Samuel Greenawalt |
Director | 83 | N/A | 2001 | (2) | 2012 | ||||||||||||
| Jay J. Hansen |
Director | 48 | N/A | 2011 | 2012 | |||||||||||||
| Mary Vogt |
Director | 55 | N/A | 2011 | 2012 | |||||||||||||
| (1) | Includes service as an executive officer of The W Group, our wholly-owned subsidiary through which we now operate our business, through the consummation of the reverse recapitalization, and service as an executive officer of Power Solutions International, Inc., a Nevada corporation, through the consummation of the migratory merger. |
| (2) | Includes service as a member of the board of directors of The W Group through the consummation of the reverse recapitalization and service as a member of the board of directors of Power Solutions International, Inc., a Nevada corporation, through the consummation of the migratory merger. |
Executive Officers/Directors
The following information pertains to our executive officers who also serve as directors, their principal occupations and other public company directorships for at least the last five years and information regarding their specific experiences, qualifications, attributes and skills.
Gary Winemaster has served as our Chief Executive Officer and President and as a director since 2001, and served as the Chief Executive Officer and President of Power Great Lakes (which, prior to the incorporation of our company in 2001, was the parent operating company of our business, and is currently our wholly-owned subsidiary) from 1992 until our incorporation in 2001. In connection with the reverse recapitalization, Mr. Winemaster was also appointed as the Chairman of the Board. Mr. Winemaster is a co-founder of our company, and has played a significant role in developing and expanding our presence as a distributor of alternative fuel spark-ignited and diesel power systems. Prior to serving in his role as Chief Executive Officer and President of our company and of Power Great Lakes, Mr. Winemaster served as the Vice President of Sales for Power Great Lakes. Prior to founding our company, Mr. Winemaster worked in sales management for the European operations, with territory responsibility for the German, Scandinavian and Benelux markets, of Guardian Industries, a United States glass manufacturer. Mr. Winemaster holds a Bachelor of Science degree from the Wharton School at the University of Pennsylvania.
Non-Director Executive Officers
Thomas Somodi has served as our Chief Operating Officer and Chief Financial Officer since 2005, and served as a director from 2005 through October 26, 2011, and previously served as a consultant to us from 2002 to 2005. Mr. Somodi has over 30 years of experience in domestic and international corporate reorganizations, acquisitions, divestitures and greenfield expansions covering the U.S., the United Kingdom, South Africa, Canada, Mexico, Japan, the Caribbean, Germany and Australia. From 1980 to 1998, Mr. Somodi served as the Corporate Controller and, for a portion of such period, as VP of Finance of International Operations for Albert Trostel & Sons Company/Everet Smith Group, LTD, an international holding company with a significant presence in the leather tanning, precision molding, metal fabrication and foundry industries. Mr. Somodi served as an executive consultant for Crowe Chizek and Company LLC, a consulting and accounting practice company, from 1998 to 2000, and has personally owned and overseen eight independent companies covering pallet & crate manufacturing, packaging, lumber mill operations, furniture manufacturing, internet technology, media & advertising, access control/security and merchant processing services. Mr. Somodi holds a Masters of Science in management from the University of Wisconsin-Milwaukee, and a Bachelor of Business Administration in finance from the University of Wisconsin-Milwaukee. Mr. Somodi is also a certified public accountant in the state of Wisconsin.
Kenneth Winemaster has served as our Senior Vice President and Secretary since 2001, and served as a director from 2001 through November 21, 2011. Mr. Winemaster has primary responsibility for our relationships and operations with Caterpillar and Perkins. Mr. Winemaster has expertise in raw material procurement, assembly and shipping.
57
Table of Contents
Other Directors
The following information pertains to our non-employee directors, their principal occupations and other public company directorships for at least the last five years and information regarding their specific experiences, qualifications, attributes and skills.
H. Samuel Greenawalt has served as a director since 2001. Mr. Greenawalt has over 50 years of experience in the banking industry. Over the past 25 years, Mr. Greenawalt has served an instrumental advisory role in helping us achieve our growth initiatives and address our financial requirements. Since 2000, Mr. Greenawalt has served as a vice president of Sulfo Technologies, LLC, an automotive component service-provider, for which Mr. Greenawalt is also a partner and owner. From 1959 to 1995, Mr. Greenawalt served as executive vice president at Michigan National Bank, a mid-sized Midwestern bank. Mr. Greenawalt has served as a director of Williams Controls, Inc., a publicly held manufacturer of electronic throttle controls for commercial vehicles, since 1993 and currently serves as the chairman of the audit committee and as a member of the governance and nominating committee of the board of directors of Williams Controls. Mr. Greenawalt holds a Bachelor of Science degree from the Wharton School at the University of Pennsylvania, and is a graduate of the University of Wisconsin Banking School.
Kenneth Landini has served as a director since 2001 and assisted in the development and growth of the business of our company since 1985. Mr. Landini previously served as the Vice President of Finance for our subsidiary, Power Great Lakes, Inc., from December 1985 to March 1988, and assisted us in establishing distributor relationships and expanding the territories into which we provide our power systems. Mr. Landini is a partner and co-founder of Landini, Reed & Dawson, P.C., a certified public accounting and consulting firm in southeastern Michigan, which was established in 1988. Mr. Landini has served as a certified public accountant for Landini, Reed & Dawson, P.C. since its inception. Mr. Landini holds a Bachelor of Arts degree from Albion College and is a licensed certified public accountant in the state of Michigan.
Jay Hansen was elected to our board of directors in 2011. Mr. Hansen is the co-founder of O2 Investment Partners, LLC, a private equity investment group focusing on small and middle market manufacturing, niche distribution, select service and technology businesses, and has served as the President of O2 Investment Partners, LLC since 2010. Prior to forming O2 Investment Partners, LLC, Mr. Hansen provided consulting services in the financial and manufacturing industries. From May 2003 through February 2006, Mr. Hansen served as the Vice President and Chief Financial Officer, and in 2006 he served as the Chief Operating Officer, of Noble International, Ltd., a publicly traded supplier of automotive parts, component assemblies and value-added services to the automotive industry. Mr. Hansen holds a Bachelor of Science degree in Economics from the Wharton School at the University of Pennsylvania. Since 2005, Mr. Hansen has served as a member of the board of directors, and as the chairman of the audit committee thereof, of Flagstar Bancorp, a publicly held savings and loan holding company.
Mary Vogt was elected to our board of directors in 2011. Ms. Vogt has served as the President of Home Access Health Corporation, a medical device manufacturer and specialty laboratory serving the disease management, wellness, managed care and consumer markets with its suite of laboratory self-testing products, since 2008, and served as the Chief Financial Officer of Home Access from 2003 to 2008. From 1999 to 2003, Ms. Vogt served as an independent consultant assisting businesses in the manufacturing and e-commerce industries. Ms. Vogt also served, from 1995 to 1998, as the worldwide director of internal audit for the Leo Burnett Company, a full-service, multi-national advertising and marketing firm, and, from 1992 to 1995, as the Treasurer for Harley-Davidson Financial Services, a subsidiary of Harley-Davidson, Inc. and provider of wholesale and retail financing and insurance and insurance-related programs primarily to Harley-Davidson dealers and their retail customers. Ms. Vogt holds a degree in Economics and Management from Albion College.
Terms of Office
Our board of directors consists of five directors. Each director will continue to serve as a director until the next annual meeting of stockholders and until his or her successor is duly elected and qualified.
Family Relationships
Gary Winemaster, our Chairman of the Board, Chief Executive Officer and President, and Kenneth Winemaster, our Senior Vice President and Secretary, are brothers. There are no other family relationships among the members of our board of directors or our executive officers.
58
Table of Contents
Corporate Governance
In January of 2012, our board of directors adopted the following corporate governance documents:
| • | Corporate Governance Guidelines. Our Corporate Governance Guidelines address, among other things, our board’s composition, qualifications and responsibilities, independence of directors, stock ownership guidelines, director compensation and communications between stockholders and our directors. |
| • | Audit Committee Charter. The charter for our Audit Committee addresses, among other things, the purpose, organization and responsibilities of our Audit Committee. |
| • | Code of Ethics. Our Code of Ethics for Principal and Senior Financial Officers articulates standards of business and professional ethics applicable to our Chief Executive Officer, Chief Operating Officer, Chief Financial Officer, Senior Vice President of Finance, Vice President of Finance and all other senior financial officers of our company. This Code functions as our “code of ethics for senior financial officers” under Section 406 of the Sarbanes-Oxley Act of 2002 and our “code of ethics” within the meaning of Item 406 of Regulation S-K. |
The full text of the Corporate Governance Guidelines, Audit Committee Charter and our Code of Ethics are all available in full text on our website at www.powersint.com in the [“Corporate Governance”] section.” We will describe on our website any amendments to or waivers from provisions of our Code of Ethics.
Item 11. Executive Compensation.
Power Solutions International, Inc. (f/k/a Format, Inc.)
The table below summarizes the compensation earned for the fiscal year indicated for services rendered to our company, in all capacities, by (i) our Chairman of the Board, Chief Executive Officer and President, (ii) our two other executive officers as of the end of our last fiscal year, and (iii) the principal (and only) executive officer of Format, Inc. prior to the reverse recapitalization (collectively, the “named executive officers”).
Executive Compensation
| Name and Principal Position |
Year | Salary | Bonus | Stock Awards |
Options Awards |
Non Equity Incentive Plan Compensation |
Nonqualified Deferred Compensation Earnings |
All Other Compensation |
Total | |||||||||||||||||||||||||||
| Gary Winemaster Chairman of the Board, Chief Executive Officer and President |
2011 | $ | 500,000 | — | — | — | — | — | $ | 52,407 | $ | 552,407 | ||||||||||||||||||||||||
| 2010 | $ | 500,000 | — | — | — | — | — | $ | 37,655 | $ | 537,655 | |||||||||||||||||||||||||
| Thomas Somodi |
2011 | $ | 500,000 | — | — | — | — | — | $ | 29,319 | $ | 529,319 | ||||||||||||||||||||||||
| 2010 | $ | 500,000 | — | — | — | — | — | $ | 41,897 | $ | 541,897 | |||||||||||||||||||||||||
| Kenneth Winemaster Senior Vice President and Secretary |
2011 | $ | 250,000 | — | — | — | — | — | $ | 35,102 | $ | 285,102 | ||||||||||||||||||||||||
| 2010 | $ | 250,000 | — | — | — | — | — | $ | 40,250 | $ | 290,250 | |||||||||||||||||||||||||
| Ryan Neely (1) |
2011 | — | (2) | — | — | — | — | — | — | — | (2) | |||||||||||||||||||||||||
| 2010 | $ | 30,000 | (2) | — | — | — | — | — | — | $ | 30,000 | (2) | ||||||||||||||||||||||||
| (1) | Ryan Neely was the principal (and only) executive officer of Format, Inc. from which he position he resigned effective as of April 29, 2011, immediately following the closing of the reverse recapitalization and the private placement. |
| (2) | As of the closing of the reverse recapitalization, $45,000 of compensation for Ryan Neely was accrued on the books and records of Format, Inc. In connection with the consummation of the reverse recapitalization, Mr. Neely released Format from its obligation to pay Mr. Neely such $42,500 of accrued compensation pursuant to the terms of the stock repurchase and debt satisfaction agreement. |
59
Table of Contents
Employment Agreements
Other than the employment agreement entered into with Mr. Somodi at the closing of the reverse recapitalization described below, we do not have any employment agreements in effect with any of our current executive officers.
Mr. Somodi entered into an employment agreement with The W Group, dated as of April 16, 2005, which employment agreement was amended pursuant to the amendment to employment agreement, dated as of January 1, 2008. Mr. Somodi’s employment agreement, as amended, provided for a minimum annual base salary of $500,000, discretionary bonus payments by The W Group as deemed appropriate by The W Group and life insurance premiums. Pursuant to the amendment to the employment agreement, in The W Group’s fiscal year ended December 31, 2008, Mr. Somodi was awarded a cash bonus of $92,555, representing 25% of the prepaid interest savings resulting from the termination of The W Group’s credit facilities then in effect with Bank of America. The term of Mr. Somodi’s employment agreement commenced in April 2005 and expired in April 2010.
We entered into a new employment agreement with Mr. Somodi, dated April 29, 2011 and effective as of January 1, 2011. This employment agreement is scheduled to expire on December 31, 2012, and provides for an annual base salary of $500,000 in each of calendar years 2011 and 2012. Pursuant to the employment agreement, Mr. Somodi is further (1) eligible for a bonus for each of calendar years 2011 and 2012, as determined in the discretion of our board of directors, and (2) eligible for equity compensation under any equity plan established and maintained by us.
If Mr. Somodi’s employment is terminated, then under his employment agreement, Mr. Somodi will receive the compensation described below. If Mr. Somodi violates the employment agreement’s restrictions on competing with us or soliciting our employees, customers or suppliers, we will have the right to terminate payment or provision of the compensation described below and we will be entitled to reimbursement of any of these amounts that we have paid prior to such violation. If prior to the expiration of the term of the employment agreement we terminate Mr. Somodi without Cause (as defined in the employment agreement and described below) and Mr. Somodi executes a general release, then Mr. Somodi will be entitled to receive the remainder of his base salary he would have received if he had remained employed through and including December 31, 2012. If prior to the end of the term of the employment agreement, Mr. Somodi’s employment is terminated for Cause, Mr. Somodi will not be entitled to any compensation or other benefits, other than eligibility, to the extent permissible, for continued coverage under our health benefit plans. Upon the termination of Mr. Somodi’s employment with us, to the extent permissible, Mr. Somodi will be eligible for continued coverage under our health benefit plans, provided that Mr. Somodi reimburses us for the cost of any such continued coverage.
For purposes of Mr. Somodi’s employment agreement, “Cause” means a conviction by him of a felony, his gross negligence, willful misconduct or unlawful conduct which results in significant financial loss or liability to us, his disability, his liquidation or other transfer of an aggregate of more than 50% of any shares of our common stock Mr. Somodi has received from Gary Winemaster pursuant to the purchase and sale agreement entered into between Mr. Somodi and Mr. Winemaster, his breach of any of the provisions in the employment agreement regarding confidentiality and restrictions on competing with us or soliciting our employees, customers or suppliers, and other customary events specifically set forth in the employment agreement.
Potential Payments Upon Termination or Change-in-Control
Prior to the reverse recapitalization, The W Group paid premiums for life insurance policies on the lives of each of our current executive officers. However, no amounts are presented below for any of our executive officers other than Thomas Somodi, as Gary Winemaster and Kenneth Winemaster have historically funded premiums for such life insurance policies out of their respective base salaries. Further, pursuant to our employment agreement with Mr. Somodi entered into in connection with the closing of the reverse recapitalization, Mr. Somodi is entitled to certain payments upon termination of his employment. See “— Employment Agreements” above for a description of payments to which Mr. Somodi is entitled pursuant to his employment agreement. Other than these arrangements, we currently do not have any compensatory plans or arrangements that provide for any payments or benefits upon the resignation, retirement or any other termination of any of our current executive officers, as the result of a change in control, or from a change in any executive officer’s responsibilities following a change in control.
60
Table of Contents
The table below provides a quantitative analysis of the amount of compensation payable to Thomas Somodi in each situation involving a termination of employment, assuming that each had occurred as of December 31, 2011.
Fiscal 2011 Payments Upon Termination or Change in Control
| Name and Benefit |
Termination w/o Cause (1) | Termination with Cause (2) | ||||||
| Thomas Somodi |
||||||||
| Base Salary |
$ | 500,000 | $ | — | ||||
|
|
|
|
|
|||||
| Total |
$ | 500,000 | $ | — | ||||
|
|
|
|
|
|||||
| (1) | All amounts presented were determined in accordance with Mr. Somodi’s new employment agreement and assume that Mr. Somodi executes and delivers a general release in favor of us. |
| (2) | In the event Mr. Somodi’s employment is terminated for “Cause,” we will not have any further obligations with respect to Mr. Somodi’s employment (except for the payment of any base salary accrued through the date on which Mr. Somodi’s employment terminates). |
Director Compensation
During fiscal 2011, no directors who were employees of our company were entitled to receive any compensation for serving as members of our board of directors. During fiscal 2011, we did not have a standard compensation arrangement for the non-employee members of our board of directors . The table below summarizes the compensation earned by each non-employee director for service on our board of directors for the last fiscal year.
| Name |
Fees Earned or Paid in Cash |
Stock Awards |
Options Awards |
Non-Equity Incentive Plan compensation |
Change in Pension
Value and Nonqualified Deferred Compensation Earnings |
All Other Compensation |
Total | |||||||||||||||||||||
| H. Samuel Greenawalt (1) |
— | — | — | — | — | $ | 12,508 | (2) | $ | 12,508 | ||||||||||||||||||
| Kenneth Landini (1) |
$ | 30,000 | — | — | — | — | — | $ | 30,000 | |||||||||||||||||||
| Jay Hansen |
— | — | — | — | — | — | — | |||||||||||||||||||||
| Mary Vogt |
— | — | — | — | — | — | — | |||||||||||||||||||||
| (1) | Includes compensation received in connection with his service on the board of directors of The W Group. |
| (2) | This amount consists of expenses related to use of an automobile for H. Samuel Greenawalt, including car payments and insurance premiums. |
We have adopted a new program for director compensation which entitles each non-employee director to receive an annual retainer of $30,000 for their service on the board. In addition, if we adopt an equity compensation plan, equity awards will likely be granted to our non-employee directors under such plan. Pursuant to these new compensation policies, we will not pay additional compensation to our executive officers for their services as directors.
Item 12. Security Ownership of Certain Beneficial Owners and Management and Related Stockholder Matters.
Security Ownership of Certain Beneficial Owners and Management
The following table sets forth information regarding the beneficial ownership of our common stock as of March 20, 2012, by the following individuals or groups: (1) each person known by us to own beneficially more than 5% of the outstanding shares of our common stock, (2) each of our directors, (3) each of the named officers, and (4) all of our directors and executive officers as a group.
Unless otherwise indicated, to our knowledge, each person listed below has sole dispositive and voting power with respect to the shares of our common stock shown below as beneficially owned by such person, except to the extent authority is shared by spouses under applicable law and except for the shares of our common stock set forth next to our directors and executive officers listed as a group. Beneficial ownership and percentage have been determined in accordance with Rule 13d-3 under the Exchange Act and generally includes voting or investment power with respect to the securities. The information is not necessarily indicative of beneficial ownership for any other purpose.
61
Table of Contents
As of March 20, 2012, 9,064,537 shares of our common stock were issued and outstanding.
| Name and Address of Beneficial Owner (1) |
Amount and Nature of Beneficial Ownership of Common Stock |
Percent of Class | ||
| Gary Winemaster |
4,545,500 | 50.15% | ||
| Thomas Somodi |
— (2) | — (2) | ||
| Kenneth Winemaster |
2,883,651 | 31.8% | ||
| Kenneth Landini |
49,168 | * | ||
| Ryan Neely |
7,122 | * | ||
| H. Samuel Greenawalt |
— | — | ||
| Jay Hansen |
— | — | ||
| Mary Vogt |
— | — | ||
| Austin W. Marxe and David M. Greenhouse (3) |
875,362 (4) | 9.36% (4) | ||
| All directors and executive officers as a group (7 persons) |
7,478,319 | 82.50% |
| * | Denotes beneficial ownership of less than one percent |
| (1) | Unless otherwise indicated, the address of each person or entity is c/o Power Solutions International, Inc., 655 Wheat Lane, Wood Dale, IL 60191. |
| (2) | Does not include the aggregate of up to 337,590 shares of our common stock which Gary Winemaster may be required to transfer from shares he owns to Mr. Somodi upon our achievement of certain value per share of our common stock milestones set forth in the purchase and sale agreement between Mr. Somodi and Mr. Winemaster. For additional detail regarding the purchase and sale agreement between Mr. Somodi and Mr. Winemaster, please see “Certain Relationships and Related Party Transactions — Purchase and Sale Transaction” below under Item 13. |
| (3) | MGP Advisers Limited Partnership (“MGP”) is the general partner of the Special Situations Fund III QP, L.P. (“SSF III”). AWM Investment Company, Inc. (“AWM”) is the general partner of MGP, the general partner of and investment adviser to the Special Situations Cayman Fund, L.P. (“SSF Cayman”) and the investment adviser to SSF III and the Special Situations Private Equity Fund, L.P. (“SSF PE”). Austin W. Marxe and David M. Greenhouse are the principal owners of MGP and AWM. Through their control of MGP and AWM, Messrs. Marxe and Greenhouse share voting and investment control over the portfolio securities of each of the funds listed above. The address for Messrs. Marxe and Greenhouse is 527 Madison Avenue, Suite 2600, New York, NY 10022. |
| (4) | Includes (i) 204,167 shares of our common stock issuable upon exercise of warrants held by SSF III, (ii) 58,333 shares of our common stock issuable upon exercise of warrants held by SSF Cayman and (iii) 29,167 shares of our common stock issuable upon exercise of warrants held by SSF PE. |
Section 16(a) Beneficial Ownership Reporting Compliance
Section 16 of the Securities Exchange Act of 1934 requires our officers and directors and persons who own greater than 10% our common stock to file reports of ownership and changes in ownership with the SEC. Based solely on a review of the forms we have received and on written representations from certain reporting persons that no such forms were required for them, we believe that all Section 16 filing requirements applicable to our officers, directors and 10% beneficial owners were complied with on a timely basis during our fiscal year ended December 31, 2011.
Item 13. Certain Relationships and Related Transactions, and Director Independence.
Certain Relationships and Related Party Transactions
Transactions discussed in this section may relate to The W Group and its consolidated subsidiaries, collectively, prior to the closing of the reverse recapitalization transaction on April 29, 2011, Power Solutions International, Inc. (f/k/a Format, Inc.), a Nevada corporation, as successor to the business of The W Group, and its consolidated subsidiaries, collectively, following the closing of the reverse recapitalization transaction, and Power Solutions International, Inc., a Delaware corporation, as the surviving corporation of the migratory merger, following the consummation of the migratory merger on August 26, 2011.
Reverse Recapitalization Transaction
On April 29, 2011, The W Group completed the reverse recapitalization transaction with Format (which was renamed Power Solutions International, Inc.), in which PSI Merger Sub, Inc., newly-created as a wholly-owned subsidiary of Format, merged with and into The W Group, and The W Group remained as the surviving corporation of the merger. As a result, The W Group became a wholly-owned subsidiary of Power Solutions International, Inc. The reverse recapitalization transaction was consummated under
62
Table of Contents
Delaware corporate law pursuant to an agreement and plan of merger, dated as of April 29, 2011. All of the outstanding shares of common stock of The W Group held by the three stockholders of The W Group (Gary Winemaster, Kenneth Winemaster and Thomas Somodi, our Chief Executive Officer, President and Chairman of the Board, our Senior Vice President and Secretary and our Chief Operating Officer and Chief Financial Officer, respectively) at the closing of the reverse recapitalization transaction converted into, and Power Solutions International, Inc. issued to the three stockholders of The W Group, an aggregate of 10,000,000 shares of our common stock and 95,960.90289 shares of preferred stock (5,500,000 shares of common stock and 52,778.49712 shares of preferred stock for Gary Winemaster, 3,500,000 shares of common stock and 33,586.31575 shares of preferred stock for Kenneth Winemaster and 1,000,000 shares of common stock and 9,596.09002 shares of preferred stock for Thomas Somodi). These shares collectively represented a substantial majority of the shares of common stock and shares of preferred stock outstanding immediately following the consummation of the reverse recapitalization transaction.
Additionally, following the closing of the reverse recapitalization, on May 2, 2011, each of Gary Winemaster and Kenneth Winemaster transferred 295.008 shares of preferred stock (representing an aggregate of 590.016 shares of preferred stock) as a gift to Kenneth Landini, a member of our board of directors. These 590.016 shares of preferred stock converted into an aggregate of 49,168 shares of our common stock upon the consummation of the reverse split. As of March 20, 2012, such shares represent approximately 0.5% of the outstanding shares of our common stock.
The terms of the reverse recapitalization transaction (including the number of shares of common stock and preferred stock to be issued to the former stockholders of The W Group), the repurchase of common stock from Ryan and Michelle Neely and related transactions, were determined through arms-length negotiations among the applicable parties. The W Group did not conduct a valuation of Format or its equity, nor did Format conduct a valuation of The W Group and its subsidiaries or their business.
The board of directors of Format (consisting solely of Ryan Neely) evaluated the terms of the reverse recapitalization transaction, the stock repurchase transaction, the private placement, the reverse split, the migratory merger and the other transactions entered into in connection with the reverse recapitalization transaction, including the transaction agreements contemplated to be entered into to effectuate these transactions, as well as the other documents and other instruments contemplated by those agreements. After considering a number of factors, including (1) historical information and projections concerning Format’s business, financial performance and condition, operations, management and competitive position; and (2) its belief that the terms of the merger agreement and the other transaction documents, including the parties representations, warranties and covenants, and the conditions to their respective obligations, were reasonable, the board of directors of Format determined that the reverse recapitalization, the stock repurchase transaction, the private placement, the reverse split, the migratory merger and other related transactions and the terms thereof were advisable and in the best interests of Format’s stockholders (including the stockholders of Format whose shares of common stock were not subject to repurchase in the stock repurchase transaction).
Purchase and Sale Transaction
The W Group and Thomas Somodi, its Chief Operating Officer and Chief Financial Officer, previously entered into (1) a subscription agreement, dated as of April 16, 2005, as amended by the amendment to subscription agreement, effective as of January 1, 2008, and (2) an employment agreement, dated as of April 16, 2005, as amended by the amendment to employment agreement, effective as of January 1, 2008. See “Executive Compensation — Employment Agreements” for a description of this employment agreement between Mr. Somodi and The W Group. Pursuant to the subscription agreement entered into with Mr. Somodi, Mr. Somodi acquired shares of common stock of The W Group, which represented 10% of the issued and outstanding shares of common stock of The W Group as of the date of such agreement and immediately prior to the closing of the reverse recapitalization, and the subscription agreement provided that, upon any issuance or change in the structure of capital stock, The W Group would make an equitable adjustment to the shares held by Mr. Somodi so that Mr. Somodi would maintain an interest equal to 10% of the fully-diluted capital stock of The W Group. The subscription agreement further provided (1) Mr. Somodi with the right to require The W Group to purchase his shares, and (2) The W Group with the right to require Mr. Somodi to sell his shares to The W Group, upon The W Group’s achievement of certain thresholds relating to the valuation of The W Group. Also, pursuant to the subscription agreement, Mr. Somodi agreed to sell his shares, if requested by The W Group, to a third party in connection with a sale of The W Group.
Pursuant to the purchase and sale agreement between Gary Winemaster and Thomas Somodi, entered into on April 28, 2011 and effective on the closing of the reverse recapitalization, Gary Winemaster agreed to purchase from Mr. Somodi, and Mr. Somodi agreed to sell to Mr. Winemaster, 1,000,000 shares of our common stock and 9,596.09002 shares of preferred stock (which converted into an aggregate of 830,925 shares of our common stock upon the consummation of the reverse split), representing all of the shares of our common stock and the preferred
63
Table of Contents
stock acquired by Mr. Somodi in the reverse recapitalization, at an initial closing to occur within 150 days (changed from 90 days and subsequently from 120 days pursuant to letters exchanged between Messrs. Winemaster and Somodi) following the closing of the reverse recapitalization, in exchange for (1) a cash payment equal to $2,500,000, payable at such initial closing, (2) an additional cash payment equal to $1,750,000, payable after the earlier of the hiring by us of a new Chief Financial Officer (which we have agreed to endeavor to do as soon as reasonably possible) and April 29, 2013, two years after the closing of the reverse recapitalization (provided that Mr. Winemaster agreed to make such payment in no event later than the later of 60 days after such earlier date and eight months following the closing of the reverse recapitalization), and (3) Mr. Winemaster’s agreement to transfer to Mr. Somodi shares of our common stock, or cash payment in lieu thereof, upon our achievement of certain market value per share of common stock milestones.
Prior to the closing of the reverse recapitalization, and in connection with Mr. Winemaster and Mr. Somodi entering into the purchase and sale agreement, (i) on April 28, 2011, The W Group and Mr. Somodi entered into a termination agreement, pursuant to which each of Mr. Somodi’s employment agreement with The W Group (the term of which expired in April 2010) and the subscription agreement between the W Group and Mr. Somodi, were terminated effective upon the closing of the reverse recapitalization; and (ii) on April 29, 2011, we entered into a new employment agreement with Mr. Somodi, which sets forth the terms of Mr. Somodi’s employment with us. See “Executive Compensation — Employment Agreements” for a description of our new employment agreement with Mr. Somodi.
On October 31, 2011, Messrs. Winemaster and Somodi entered into an amendment to the purchase and sale agreement to amend the terms of the purchase and sale agreement to provide that Mr. Winemaster would purchase the 830,925 shares of our common stock then held by Mr. Somodi at an initial closing upon delivery by Mr. Winemaster of $4.25 million, by delivery of a full-recourse promissory note therefor, and modify the terms upon which Mr. Winemaster is required to transfer shares of our common stock to Mr. Somodi upon our achievement of certain value per share of our common stock milestones set forth in the purchase and sale agreement as follows: (A) an aggregate of 112,530 shares of our common stock within 90 days of such time as the value per share of our common stock (determined as provided in the purchase and sale agreement, as amended) is at least $22.2162; (B) an additional aggregate of 135,036 shares of our common stock within 90 days of such time as the value per share of our common stock (determined as provided in the purchase and sale agreement, as amended) is at least $27.7717; and (C) an additional aggregate of 90,024 shares of our common stock within 90 days of such time as the value per share of our common stock (determined as provided in the purchase and sale agreement, as amended) is at least $33.3244. Pursuant to the terms of the purchase and sale agreement, as amended, Mr. Winemaster continues to have the right to elect to make a payment to Mr. Somodi equal to the then-value of the shares Mr. Winemaster would otherwise be required to deliver pursuant to the foregoing provisions, and Mr. Winemaster’s obligations will still expire if we have not achieved the applicable value per share of our common stock milestones by April 29, 2016. All share and per share numbers in the foregoing provisions are subject to adjustment for stock splits, stock dividends, stock combinations and similar events.
Messrs. Winemaster and Somodi consummated the sale of the 830,925 shares of our common stock from Mr. Somodi to Mr. Winemaster pursuant to the terms of the purchase and sale agreement, as amended, on October 31, 2011, and, thereafter on October 31, 2011, pursuant to the terms of a purchase agreement between us and Mr. Winemaster, we purchased the 830,925 shares of our common stock from Mr. Winemaster in exchange for delivery by us to Mr. Winemaster of $4.25 million by wire of immediately available funds, representing a price per share of $5.11. The promissory note delivered by Mr. Winemaster to Mr. Somodi in exchange for the shares at the closing of the transactions contemplated by the purchase and sale agreement, as amended, was paid in full by Mr. Winemaster on October 31, 2011. Promptly following the purchase of the shares by us from Mr. Winemaster pursuant to the terms of the purchase agreement, the shares were returned to our treasury as authorized and issued, but not outstanding, shares of common stock of the company.
On October 31, 2011, we borrowed an aggregate of $4.25 million through a draw on our $35.0 million revolving line of credit (the maximum amount of which was increased to $50.0 million through an amendment of the loan and security agreement on March 20, 2012), pursuant to our loan and security agreement with certain lenders and BMO Harris Bank N.A. (formerly Harris N.A), to facilitate our purchase of the 830,925 shares of our common stock from Mr. Winemaster pursuant to the terms of the purchase agreement. In connection therewith, concurrently with our entry into, and consummation of the transactions contemplated by, the purchase agreement, BMO Harris Bank N.A. consented to our purchase of, and the use by us of the proceeds from our $4.25 million draw on the revolving line of credit to purchase, the shares from Mr. Winemaster pursuant to the terms of the purchase agreement. At the date of the transaction and prior to the amendment of our loan and security agreement with BMO
64
Table of Contents
Harris Bank N.A., borrowings under our revolving line of credit bore interest at BMO Harris Bank N.A.’s prime rate (3.25% at December 31, 2011) plus an applicable margin ranging from 0% to 0.50% or, at our option, a portion of the line of credit could have been designated to bear interest at LIBOR plus an applicable margin ranging from 2.00% to 2.50%. The amended loan and security agreement and other of its terms are described in greater detail under “Management’s Discussion and Analysis of Financial Condition and Results of Operations — Liquidity and capital resources — Credit agreement.” Upon consummation of the transactions contemplated by the purchase agreement on October 31, 2011, our outstanding balance and remaining availability on our revolving line of credit were $23.5 million and $11.5 million, respectively.
In connection with our private placement consummated on April 29, 2011, each of Messrs. Winemaster and Somodi executed a lock-up agreement which restricts, for a specified period, Messrs. Winemaster and Somodi from undertaking certain transactions, including the offer, sale or other transfer of shares of our common stock. The lock-up agreements may have been deemed to prohibit (1) Messrs. Winemaster and Somodi from consummating the transactions contemplated by the purchase and sale agreement, as amended, and (2) Mr. Winemaster from consummating the transactions contemplated by the purchase agreement. However, investors in the private placement holding over 85% of the aggregate shares of our common stock issued upon the automatic conversion of our Series A Preferred Stock and issuable upon exercise of the warrants issued in the private placement (in excess of the 66 2/3% of such shares necessary to waive the terms of the lock-up agreements pursuant to the terms thereof) waived the provisions of the lock-up agreements to the extent necessary to allow the consummation of the transactions contemplated by the purchase and sale agreement, as amended, and the purchase agreement.
Other Transactions with Our Company and/or The W Group
The W Group has engaged (and we continue to engage) Landini, Reed & Dawson, a certified public accounting and consulting firm, to prepare tax returns and to provide other tax advice and consultation services, including in respect of the reverse recapitalization, the private placement and related transactions. Kenneth Landini, who was a director of The W Group prior to the consummation of the reverse recapitalization and is a member of our board of directors, is a partner and co-founder of Landini, Reed & Dawson, P.C. During The W Group’s fiscal year ended December 31, 2010 (“fiscal 2010”) and our fiscal year ended December 31, 2011 (“fiscal 2011”), Landini, Reed & Dawson, P.C. charged $123,223 and $156,481, respectively, for its services provided to our company and The W Group during such periods. It is expected that Landini, Reed & Dawson, P.C. will continue to provide such services going forward, and that the amounts paid in our fiscal year ending December 31, 2012 (“fiscal 2012”) will be consistent with the amounts paid in fiscal 2011.
For each of fiscal 2011 and fiscal 2010, William Winemaster (the father of Gary Winemaster and Kenneth Winemaster, our Chairman of the Board, Chief Executive Officer and President and our Senior Vice President and Secretary, respectively), serving as an employee performing consulting and advisory type services for The W Group and its subsidiaries, received (1) annual salaries of $148,084 and $138,158, respectively, (2) payments for automobiles and related auto insurance premiums equal to $7,876 and $9,927, respectively, and (3) payments related to mobile telephone service equal to $1,616 and $1,295, respectively. It is anticipated that William Winemaster will continue to serve as an employee of The W Group performing consulting and advisory type services going forward, and that Mr. Winemaster’s compensation for fiscal 2012 will be consistent with his compensation for such services in fiscal 2011.
In fiscal 2010, The W Group had outstanding loans to each of Gary Winemaster and Kenneth Winemaster in the aggregate principal amount of $156,024 and $67,969, respectively. These loan amounts did not bear interest and were payable on demand by The W Group. At December 31, 2010, the amounts outstanding on such notes were $156,024 and $67,969, respectively, which such amounts represent the largest principal amounts outstanding under these loans at any time during fiscal 2010. Effective March 30, 2011 (prior to the consummation of the reverse recapitalization), the board of directors of The W Group declared a non-cash offset dividend to each of Gary Winemaster and Kenneth Winemaster in amounts necessary to cancel the loans. Thomas J. Somodi, as a stockholder of The W Group, waived any right to receive any dividend payments as a result of the offset dividend received by Gary Winemaster. Kenneth Winemaster waived any right to receive any dividend in excess of the $67,969 offset dividend he received as a result of the offset dividend received by Gary Winemaster.
Format, Inc. Transactions
From time to time prior to the consummation of the reverse recapitalization, Ryan Neely, Format’s sole director and executive officer immediately prior to the closing of the reverse recapitalization, loaned amounts to Format for working capital purposes, which loans did not bear interest and were due on demand. As of
65
Table of Contents
December 31, 2010 and immediately prior to April 29, 2011, the closing date of the reverse recapitalization, the outstanding principal amount on such loans was $114,156. The largest principal amount outstanding under these loans at any time during fiscal 2010, fiscal 2009 or fiscal 2008, or during the period commencing January 1, 2011 and ending April 29, 2011, was $168,177. During the period commencing January 1, 2008 through April 29, 2011 (but before closing the repurchase of shares of our common stock from Ryan Neely and Michelle Neely, described below), Format repaid $62,041 in principal amount in respect of these loans to Mr. Neely. In connection with the reverse recapitalization and the private placement, Format entered into a stock repurchase and debt satisfaction agreement, pursuant to which Format repurchased and cancelled 3,000,000 shares of our common stock beneficially owned by Mr. Neely and his spouse, Michelle Neely, and Ryan and Michelle Neely released Format from any obligations Format had to them in respect of these loans (which, as of April 29, 2011, was $114,156 in principal amount), for aggregate consideration of $360,000. In addition, Ryan and Michelle Neely released Format from any obligations Format had to them in respect of any other amounts (including any accrued compensation) that may have at any time been owing from Format prior to the closing of the reverse recapitalization. In connection with, but prior to, the closing of the reverse recapitalization, Format used all of its available cash to settle remaining liabilities that Format had prior to the consummation of the reverse recapitalization, which included amounts owed to Format’s accountants, independent auditors and legal counsel; provided that Format’s legal counsel agreed to release Format from its obligation to pay a portion of legal fees incurred by Format in connection with the reverse recapitalization and related transactions. Further, in connection with, but prior to, the closing of the reverse recapitalization, Format entered into a termination agreement, pursuant to which Format terminated its services agreement with its sole customer, and Format transferred to Ryan Neely all of its rights, including Format’s rights to any security deposit thereunder, and obligations, and Ryan Neely assumed Format’s obligations, under the real property lease pursuant to which Format leased its sole office space.
Private Placement
On April 29, 2011, we entered into a purchase agreement with 29 accredited investors to consummate the private placement. In the private placement, Special Situations Fund III QP, L.P., Special Situations Cayman Fund, L.P. and Special Situations Private Equity Fund, L.P. (collectively, the “SSF Funds”) purchased a total of 7,000 shares of our preferred stock and related warrants, which represented beneficial ownership of approximately 6.14% of our preferred stock and 17.87% of our common stock (and approximately 39% of the preferred stock issued in the private placement) prior to the consummation of the migratory merger (including the reverse split of our common stock effected thereby), giving effect to the limitations on conversion of our preferred stock. As of March 20, 2012, the SSF Funds held 583,695 shares of our common stock and warrants to purchase 291,667 shares of our common stock, representing beneficial ownership of approximately 9.36% of our common stock. MGP Advisers Limited Partnership (“MGP”) is the general partner of the Special Situations Fund III QP, L.P. AWM Investment Company, Inc. (“AWM”) is the general partner of MGP, the general partner of and investment adviser to the Special Situations Cayman Fund, L.P. and the investment adviser to Special Situations Fund III QP, L.P. and the Special Situations Private Equity Fund, L.P. Austin W. Marxe and David M. Greenhouse are the principal owners of MGP and AWM. Through their control of MGP and AWM, Messrs. Marxe and Greenhouse share voting and investment control over the portfolio securities of each of the SSF Funds.
In the private placement, Park West Investors Master Fund, Limited and Park West Partners International, Limited (collectively, the “Park West Funds”) purchased a total of 3,000 shares of our preferred stock and related warrants, which represented beneficial ownership of approximately 2.63% of our preferred stock and 8.53% of our common stock (and approximately 17% of the preferred stock issued in the private placement) prior to the consummation of the migratory merger (including the reverse split of our common stock effected thereby). As of March 20, 2012, the Park West Funds held 100,001 shares of our common stock and warrants to purchase 125,000 shares of our common stock, representing beneficial ownership of approximately 2.45% of our common stock. Peter S. Park is the sole member and manager of Park West Asset Management LLC, the investment manager of Park West Investors Master Fund, Limited and Park West Partners International, Limited, and Mr. Park and Park West Asset Management LLC have voting and dispositive control over the securities held by the Park West Funds.
Pursuant to the purchase agreement for the private placement, and as a condition to the investors’ investment in the private placement, we agreed to comply with various covenants. In particular, pursuant to the purchase agreement, we agreed that until the earlier of (1) April 29, 2016 and (2) the date upon which the SSF Funds beneficially own, in the aggregate, less than 25% of the aggregate shares of our common stock to which the SSF Funds are entitled upon conversion or exercise of the securities held by the SSF Funds as of the closing of the private placement, we may not adopt or maintain any stockholder rights plan or other “poison pill” arrangement without the consent of either the entity that is the general partner and investment advisor to the SSF Funds or a
66
Table of Contents
majority of the independent members of our board of directors. Further, we agreed with the investors that the agreement may not be amended, and no provision may be waived, without our written consent and (1) prior to the consummation of the reverse split, the consent of the holders of at least 66 2/3% of the shares of preferred stock purchased in the private placement, and (2) following the consummation of the reverse split, the consent of the holders of at least 66 2/3% of the shares of our common stock issued to the investors in the private placement upon automatic conversion of our preferred stock or upon exercise of the warrants, to the extent any warrants have been exercised. Accordingly, given the number of shares of preferred stock and related warrants purchased in the private placement by the SSF Funds, relative to the total amount purchased by all of the investors, no provision of the purchase agreement may be waived without the consent of the SSF Funds. The purchase agreement prohibits our payment to any one entity (other than our company) any consideration to amend or consent to a waiver or modification of any provision of the documents entered into in connection with the private placement unless the same consideration is also offered to each of the investors.
In connection with the reverse recapitalization and the private placement, each of our stockholders that is also one of our executive officers and/or directors entered into a voting agreement with us pursuant to which such person agreed to vote his shares of our common stock and preferred stock, as applicable, in favor of the migratory merger (including the reverse split) and any other matters as may be necessary or advisable to consummate the migratory merger and the reverse split. The voting agreements, similar to the purchase agreement, could not be amended or terminated without our consent and without the consent of each of the individual parties thereto and the holders of at least 66 2/3% of our outstanding preferred stock. A proxy was granted to Messrs. David M. Greenhouse and Austin W. Marxe pursuant to each of the voting agreements; however, the voting power granted by each proxy was limited to votes involving the migratory merger, the reverse split and any other matters as may have been necessary or advisable to consummate the migratory merger and the reverse split. Further, Messrs. Greenhouse and Marxe were only permitted to exercise their rights under such proxies if an individual subject to a voting agreement failed to honor the terms of the voting agreement. The securities held by the persons who entered into the voting agreements represented, as of August 25, 2011, the date of the special meeting at which our stockholders approved the migratory merger and the reverse split, approximately 86.11% of the total voting power of the outstanding capital stock of our company. Pursuant to the terms of the voting agreements, at the special meeting of our stockholders held on August 25, 2011, each of the individuals subject to a voting agreement voted all of his shares of our common stock and preferred stock to approve the migratory merger, the reverse split and related matters.
Composition of the Board of Directors and Director Independence
We are not subject to listing requirements of any national securities exchange and, as a result, our board of directors is not currently required to be composed of a specified number of “independent directors.” Pursuant to the purchase agreement for the private placement, we agreed to take action such that, no later than 180 days following the closing of the private placement, our board of directors would consist of five or greater directors, a majority of whom will constitute “independent directors” as defined by the marketplace rules of The NASDAQ Stock Market. Accordingly, and because we are not a listed issuer, we have chosen to use the applicable independence requirements of The NASDAQ Stock Market to determine whether or not our directors and committee members are independent. Our board of directors has determined that Mr. H. Samuel Greenawalt, Mr. Jay Hansen and Ms. Mary Vogt are each a non-employee director who meets the applicable independence requirements for directors of The NASDAQ Stock Market.
The current members of our Audit Committee are Kenneth Landini, Jay Hansen and Mary Vogt. Mr. Landini is the Chairman of our Audit Committee and qualifies as an “audit committee financial expert” as defined in SEC rules under the Sarbanes Oxley Act of 2002. Mr. Hansen and Ms. Vogt also each qualify as an “audit committee financial expert” as defined in SEC rules under the Sarbanes Oxley Act of 2002. Our board of directors has determined that each of Mr. Hansen and Ms. Vogt meet the independence requirements for audit committee members of The NASDAQ Stock Market, and has determined that Mr. Landini does not meet such requirements. We do not currently have a separately designated nominating or compensation committees. Our board has determined that each of H. Samuel Greenawalt, Jay Hansen and Mary Vogt meet the applicable independence requirements of The NASDAQ Stock Market for nominating committee members and compensation committee members, and has determined that Gary Winemaster and Kenneth Landini do not meet such standards.
In addition to the NASDAQ independence requirements, we also apply the independence guidelines set forth in our Corporate Governance Guidelines, which are available on our website at www.powersint.com in the “Corporate Governance” Section and are substantially similar to the NASDAQ director independence requirements. Additionally, in the event our common stock becomes listed on a national securities exchange, the composition of
67
Table of Contents
our board of directors and our audit committee, and any future compensation committee, nominating and corporate governance committee and any other committee of our board of directors, will be subject to the corporate governance provisions of such exchange, including rules relating to the independence of directors. Pursuant to the purchase agreement for the private placement, we have agreed to use our reasonable best efforts to list our common stock for trading on a national securities exchange as soon as reasonably practicable after we meet the initial quantitative listing standards of any such exchange. However, we cannot be certain that we will meet such initial listing standards or receive approval to list our common stock on any national securities exchange.
Item 14. Principal Accounting Fees and Services.
INDEPENDENT AUDITOR FEES
The following table sets forth the aggregate fees billed for professional services rendered by our independent auditors, Deloitte & Touche LLP, the member firms of Deloitte Touche Tohmatsu and their respective affiliates (collectively “Deloitte”) for the fiscal years ended December 31, 2011 (“fiscal 2011”) and December 31, 2010 (“fiscal 2010”), respectively:
| Description of Fees |
December 31, 2011 | December 31, 2010 | ||||||
| Audit Fees |
$ | 244,247 | $ | 158,500 | ||||
| Audit-Related Fees |
299,731 | — | ||||||
| Tax Fees |
— | 3,333 | ||||||
| All Other Fees |
— | — | ||||||
|
|
|
|
|
|||||
| Total |
$ | 543,978 | $ | 161,833 | ||||
|
|
|
|
|
|||||
Audit Fees. Consists of fees incurred for professional services rendered for the audit of our annual consolidated financial statements and review of the interim consolidated financial statements included in our quarterly reports.
Audit-Related Fees. Consists of fees incurred for assurance and related services that are reasonably related to the performance of the audit or review of our consolidated financial statements that are not reported under “Audit Fees.” These fees for fiscal 2011 were incurred for professional services rendered in conjunction with the issuance of a consent for a registration statement we filed on Form S-1 and assistance in responding to Securities and Exchange Commission comment letters regarding our registration statement. We did not incur any such fees for fiscal 2010.
Tax Fees. Consists of fees incurred for professional services for tax compliance, tax advice and tax planning. These services include tax planning, assistance with the preparation of various U.S. federal and state tax returns, and advice on other tax-related matters.
All Other Fees. Represents fees incurred for services provided to us other than those included in the categories above, which could include, but are not limited to, non-audit related fees. We did not incur any such fees for fiscal 2011 or fiscal 2010.
In each of fiscal 2011 and fiscal 2010, Deloitte did not provide, or bill us for, any services other than those described above.
In accordance with its charter, the Audit Committee will approve in advance all audit and non-audit services to be provided by our independent auditors. In certain cases, the Chairman of the Audit Committee may be delegated the authority by the Audit Committee to pre-approve certain additional services, and such pre-approvals will be communicated to the full Audit Committee at its next meeting. Because the Audit Committee was not formed until January of 2012, it has only approved audit services for fiscal 2011. Audit services for fiscal 2010 were approved by our full board of directors.
Item 15. Exhibits, Financial Statement Schedules.
15(a) Consolidated Financial Statements and Schedules
The following financial statements are filed as a part of this report.
68
Table of Contents
Index to Financial Statements
| Financial Statements of Power Solutions International, Inc. | ||||
| Report of Independent Registered Public Accounting Firm | F-2 | |||
| Consolidated Balance Sheets of Power Solutions International, Inc. as of December 31, 2011 and 2010 | F-3 | |||
| F-4 | ||||
| Consolidated Statements of Stockholders’ Equity of Power Solutions for the years ended December 31, 2011, 2010 and 2009 | F-5 | |||
| F-6 | ||||
| Power Solutions International, Inc. Notes to Consolidated Statements | F-7 | |||
F-1
Table of Contents
REPORT OF INDEPENDENT REGISTERED PUBLIC ACCOUNTING FIRM
To the Board of Directors and Stockholders of
Power Solutions International, Inc.
Wood Dale, IL
We have audited the accompanying consolidated balance sheets of Power Solutions International, Inc. and subsidiaries (the “Company”) as of December 31, 2011 and 2010, and the related consolidated statements of operations, changes in stockholders’ equity, and cash flows for each of the three years in the period ended December 31, 2011. These consolidated financial statements are the responsibility of the Company’s management. Our responsibility is to express an opinion on the consolidated financial statements based on our audits.
We conducted our audits in accordance with the standards of the Public Company Accounting Oversight Board (United States). Those standards require that we plan and perform the audit to obtain reasonable assurance about whether the financial statements are free of material misstatement. The Company is not required to have, nor were we engaged to perform, an audit of its internal control over financial reporting. Our audits included consideration of internal control over financial reporting as a basis for designing audit procedures that are appropriate in the circumstances, but not for the purpose of expressing an opinion on the effectiveness of the Company’s internal control over financial reporting. Accordingly, we express no such opinion. An audit also includes examining, on a test basis, evidence supporting the amounts and disclosures in the consolidated financial statements, assessing the accounting principles used and significant estimates made by management, as well as evaluating the overall financial statement presentation. We believe that our audits provide a reasonable basis for our opinion.
In our opinion, such consolidated financial statements present fairly, in all material respects, the financial position of Power Solutions International, Inc. and subsidiaries as of December 31, 2011 and 2010, and the results of their operations and their cash flows for each of the three years in the period ended December 31, 2011, in conformity with accounting principles generally accepted in the United States of America.
/s/ Deloitte & Touche LLP
Chicago, Illinois
March 30, 2012
F-2
Table of Contents
POWER SOLUTIONS INTERNATIONAL, INC.
CONSOLIDATED BALANCE SHEETS AS OF DECEMBER 31,
| (Dollar amounts in thousands, except per share amounts) | 2011 | 2010 | ||||||
| ASSETS |
||||||||
| Current assets |
||||||||
| Cash |
$ | — | $ | — | ||||
| Accounts receivable, net |
29,523 | 16,282 | ||||||
| Inventories, net |
33,393 | 32,168 | ||||||
| Prepaid expenses and other current assets |
1,291 | 1,028 | ||||||
| Deferred income taxes |
1,814 | 687 | ||||||
|
|
|
|
|
|||||
| Total current assets |
66,021 | 50,165 | ||||||
|
|
|
|
|
|||||
| Property, plant & equipment, net |
3,611 | 2,883 | ||||||
| Other noncurrent assets |
1,451 | 2,305 | ||||||
|
|
|
|
|
|||||
| TOTAL ASSETS |
$ | 71,083 | $ | 55,353 | ||||
|
|
|
|
|
|||||
| LIABILITIES AND STOCKHOLDERS’ EQUITY |
||||||||
| Current liabilities |
||||||||
| Income taxes payable |
564 | 619 | ||||||
| Current maturities of long-term debt and capital lease obligations |
23 | 2,226 | ||||||
| Line of credit |
19,666 | 21,633 | ||||||
| Accounts payable |
27,574 | 17,210 | ||||||
| Accrued liabilities |
4,015 | 2,211 | ||||||
|
|
|
|
|
|||||
| Total current liabilities |
51,842 | 43,899 | ||||||
|
|
|
|
|
|||||
| LONG-TERM OBLIGATIONS |
||||||||
| Other noncurrent liabilities |
116 | 189 | ||||||
| Deferred income taxes |
490 | 233 | ||||||
| Private placement warrants |
3,270 | — | ||||||
| Long-term debt and capital lease obligations, net of current maturities |
41 | 5,676 | ||||||
|
|
|
|
|
|||||
| TOTAL LIABILITIES |
55,759 | 49,997 | ||||||
|
|
|
|
|
|||||
| COMMITMENTS AND CONTINGENCIES |
— | — | ||||||
| STOCKHOLDERS’ EQUITY |
||||||||
| Series A convertible preferred stock — $0.001 par value. Authorized 114,000 shares. Issued and outstanding: -0- and 95,961 shares at December 31, 2011 and 2010, respectively. |
— | — | ||||||
| Common stock — $0.001 par value. Authorized 50,000,000 shares. |
||||||||
| Issued and outstanding 9,064,537 and 312,500 shares at December 31, 2011 and 2010, respectively. |
10 | — | ||||||
| Additional paid-in-capital |
10,154 | 7 | ||||||
| Retained earnings |
9,410 | 5,349 | ||||||
| Treasury stock, at cost, 830,925 shares and -0- at December 31, 2011 and 2010, respectively. |
(4,250 | ) | — | |||||
|
|
|
|
|
|||||
| TOTAL STOCKHOLDERS’ EQUITY |
15,324 | 5,356 | ||||||
|
|
|
|
|
|||||
| TOTAL LIABILITIES AND STOCKHOLDERS’ EQUITY |
$ | 71,083 | $ | 55,353 | ||||
|
|
|
|
|
|||||
The accompanying notes are an integral part of these consolidated financial statements.
F-3
Table of Contents
POWER SOLUTIONS INTERNATIONAL, INC.
CONSOLIDATED STATEMENTS OF OPERATIONS
FOR THE YEARS ENDED DECEMBER 31,
| (Dollar amounts in thousands, except per share amounts) | 2011 | 2010 | 2009 | |||||||||
| Net sales |
$ | 154,969 | $ | 100,521 | $ | 82,902 | ||||||
| Cost of sales |
128,541 | 83,894 | 66,520 | |||||||||
|
|
|
|
|
|
|
|||||||
| Gross profit |
26,428 | 16,627 | 16,382 | |||||||||
|
|
|
|
|
|
|
|||||||
| Operating expenses |
||||||||||||
| Research & development and engineering |
4,713 | 3,846 | 2,721 | |||||||||
| Selling and service |
6,666 | 5,465 | 4,519 | |||||||||
| General and administrative |
5,244 | 3,250 | 3,065 | |||||||||
|
|
|
|
|
|
|
|||||||
| 16,623 | 12,561 | 10,305 | ||||||||||
|
|
|
|
|
|
|
|||||||
| Operating income |
9,805 | 4,066 | 6,077 | |||||||||
|
|
|
|
|
|
|
|||||||
| Other (income) expense |
||||||||||||
| Interest expense |
1,340 | 2,131 | 2,303 | |||||||||
| Loss on debt extinguishment |
485 | — | — | |||||||||
| Other (income) expense, net |
1,146 | — | — | |||||||||
|
|
|
|
|
|
|
|||||||
| 2,971 | 2,131 | 2,303 | ||||||||||
|
|
|
|
|
|
|
|||||||
| Income before income taxes |
6,834 | 1,935 | 3,774 | |||||||||
| Income tax provision |
2,773 | 366 | 1,387 | |||||||||
|
|
|
|
|
|
|
|||||||
| Net income |
$ | 4,061 | $ | 1,569 | $ | 2,387 | ||||||
|
|
|
|
|
|
|
|||||||
| Undistributed earnings |
$ | 4,061 | $ | 1,569 | $ | 2,387 | ||||||
|
|
|
|
|
|
|
|||||||
| Undistributed earnings allocable to Series A convertible preferred shares |
$ | 2,513 | $ | 1,510 | $ | 2,297 | ||||||
|
|
|
|
|
|
|
|||||||
| Undistributed earnings allocable to common shares |
$ | 1,548 | $ | 59 | $ | 90 | ||||||
|
|
|
|
|
|
|
|||||||
| Weighted-average preferred shares outstanding |
||||||||||||
| Basic |
— | 95,961 | 95,961 | |||||||||
| Diluted |
— | 95,961 | 95,961 | |||||||||
| Weighted-average common shares outstanding |
||||||||||||
| Basic |
3,512,534 | 312,500 | 312,500 | |||||||||
| Diluted |
3,512,534 | 312,500 | 312,500 | |||||||||
| Undistributed earnings per share — basic |
||||||||||||
| Series A convertible preferred shares |
$ | — | $ | 15.74 | $ | 23.94 | ||||||
| Common shares |
$ | 0.44 | $ | 0.19 | $ | 0.29 | ||||||
| Undistributed earnings per share — diluted |
||||||||||||
| Series A convertible preferred shares |
$ | — | $ | 15.74 | $ | 23.94 | ||||||
| Common shares |
$ | 0.44 | $ | 0.19 | $ | 0.29 | ||||||
The accompanying notes are an integral part of these consolidated financial statements.
F-4
Table of Contents
POWER SOLUTIONS INTERNATIONAL, INC.
CONSOLIDATED STATEMENTS OF CHANGES IN STOCKHOLDERS’ EQUITY
| Preferred stock |
Common stock |
Common stock warrant |
Additional paid-in capital |
Treasury stock |
Retained earnings |
Total stockholders’ equity |
||||||||||||||||||||||
| Balance at December 31, 2008 |
$ | — | $ | — | $ | — | $ | 7 | $ | — | $ | 1,393 | $ | 1,400 | ||||||||||||||
| Net income |
— | — | — | — | — | 2,387 | 2,387 | |||||||||||||||||||||
|
|
|
|
|
|
|
|
|
|
|
|
|
|
|
|||||||||||||||
| Balance at December 31, 2009 |
— | — | 7 | — | 3,780 | 3,787 | ||||||||||||||||||||||
| Net income |
— | — | — | — | — | 1,569 | 1,569 | |||||||||||||||||||||
|
|
|
|
|
|
|
|
|
|
|
|
|
|
|
|||||||||||||||
| Balance at December 31, 2010, as originally stated |
— | 10 | — | (3 | ) | — | 5,349 | 5,356 | ||||||||||||||||||||
| 1 for 32 reverse split |
— | (10 | ) | — | 10 | — | — | — | ||||||||||||||||||||
|
|
|
|
|
|
|
|
|
|
|
|
|
|
|
|||||||||||||||
| Balance at December 31, 2010, restated for the reverse split |
— | — | — | 7 | — | 5,349 | 5,356 | |||||||||||||||||||||
| Net income |
— | — | — | — | — | 4,061 | 4,061 | |||||||||||||||||||||
| Reverse recapitalization |
(389 | ) | — | — | 9 | — | — | (380 | ) | |||||||||||||||||||
| Net proceeds from private placement |
10,138 | — | 399 | — | — | — | 10,537 | |||||||||||||||||||||
| Conversion of preferred stock |
(9,749 | ) | 10 | — | 9,739 | — | — | — | ||||||||||||||||||||
| Exercise of common stock warrant |
— | — | (399 | ) | 399 | — | — | — | ||||||||||||||||||||
| Repurchase of common stock |
— | — | — | — | (4,250 | ) | — | (4,250 | ) | |||||||||||||||||||
|
|
|
|
|
|
|
|
|
|
|
|
|
|
|
|||||||||||||||
| Balance at December 31, 2011 |
$ | — | $ | 10 | $ | — | $ | 10,154 | $ | (4,250 | ) | $ | 9,410 | $ | 15,324 | |||||||||||||
|
|
|
|
|
|
|
|
|
|
|
|
|
|
|
|||||||||||||||
The accompanying notes are an integral part of these consolidated financial statements.
F-5
Table of Contents
POWER SOLUTIONS INTERNATIONAL, INC.
CONSOLIDATED STATEMENTS OF CASH FLOWS
FOR THE YEARS ENDED DECEMBER 31
| (Dollar amounts in thousands, except per share amounts) | 2011 | 2010 | 2009 | |||||||||
| Cash flows from operating activities |
||||||||||||
| Net income |
$ | 4,061 | $ | 1,569 | $ | 2,387 | ||||||
| Adjustments to reconcile net income to net cash provided by operating activities |
||||||||||||
| Depreciation and amortization |
820 | 988 | 984 | |||||||||
| Deferred income taxes |
(870 | ) | (159 | ) | 38 | |||||||
| Increase (decrease) in accounts receivable allowances |
(249 | ) | 246 | (120 | ) | |||||||
| Change in valuation of private placement warrants |
382 | — | — | |||||||||
| Loss on debt extinguishment |
485 | — | — | |||||||||
| Loss on disposal of assets |
6 | — | — | |||||||||
| (Increase) decrease in operating assets |
||||||||||||
| Accounts receivable |
(12,992 | ) | 12,012 | (9,572 | ) | |||||||
| Inventories |
(1,225 | ) | (1,001 | ) | (4,861 | ) | ||||||
| Prepaid and other current assets |
(410 | ) | (533 | ) | (72 | ) | ||||||
| Other noncurrent assets |
173 | 76 | 360 | |||||||||
| Increase (decrease) in operating liabilities |
||||||||||||
| Accounts payable |
7,365 | (9,255 | ) | 13,218 | ||||||||
| Accrued liabilities |
1,609 | 463 | (208 | ) | ||||||||
| Deferred revenue |
(73 | ) | 189 | — | ||||||||
| Income taxes payable |
(55 | ) | (671 | ) | 1,234 | |||||||
|
|
|
|
|
|
|
|||||||
| Net cash (used in) provided by operating activities |
(973 | ) | 3,924 | 3,388 | ||||||||
|
|
|
|
|
|
|
|||||||
| Cash flows from investing activities |
||||||||||||
| Purchases of property, plant, equipment and other assets |
(1,557 | ) | (541 | ) | (363 | ) | ||||||
| Increase in cash surrender value of life insurance |
(13 | ) | (42 | ) | — | |||||||
|
|
|
|
|
|
|
|||||||
| Net cash used in investing activities |
(1,570 | ) | (583 | ) | (363 | ) | ||||||
|
|
|
|
|
|
|
|||||||
| Cash flows from financing activities |
||||||||||||
| Increase (decrease) in cash overdraft |
3,251 | (120 | ) | (718 | ) | |||||||
| Net change in current line of credit |
1,328 | (776 | ) | (592 | ) | |||||||
| Initial proceeds from borrowings under current line of credit |
18,338 | — | — | |||||||||
| Repayment of prior line of credit |
(21,633 | ) | — | — | ||||||||
| Proceeds from long-term debt |
43 | 95 | — | |||||||||
| Proceeds from issuance of preferred stock with warrants |
18,000 | — | — | |||||||||
| Payments on long-term debt and capital lease obligations |
(7,880 | ) | (2,226 | ) | (1,645 | ) | ||||||
| Repurchase of common stock |
(4,250 | ) | — | — | ||||||||
| Cash paid for transaction and financing fees |
(4,654 | ) | (314 | ) | (70 | ) | ||||||
|
|
|
|
|
|
|
|||||||
| Net cash provided by (used in) in financing activities |
2,543 | (3,341 | ) | (3,025 | ) | |||||||
|
|
|
|
|
|
|
|||||||
| Change in cash |
— | — | — | |||||||||
| Cash at beginning of the year |
— | — | — | |||||||||
|
|
|
|
|
|
|
|||||||
| Cash at end of the year |
$ | — | $ | — | $ | — | ||||||
|
|
|
|
|
|
|
|||||||
| Supplemental disclosures of cash flow information |
||||||||||||
| Cash paid for interest |
$ | 1,163 | $ | 1,899 | $ | 1,772 | ||||||
|
|
|
|
|
|
|
|||||||
| Cash paid for income taxes |
$ | 3,695 | $ | 1,196 | $ | 234 | ||||||
|
|
|
|
|
|
|
|||||||
The accompanying notes are an integral part of these consolidated financial statements.
F-6
Table of Contents
POWER SOLUTIONS INTERNATIONAL, INC.
NOTES TO CONSOLIDATED FINANCIAL STATEMENTS
(Tabular dollar amounts in thousands, except per share amounts)
1. Description of the company and summary of significant accounting policies
Description of the company
Power Solutions International, Inc., a Delaware corporation, is the successor in the Migratory Merger (as defined below) to Power Solutions International, Inc., a Nevada corporation (“Power Solutions International” and “PSI” refer to Power Solutions International, Inc., a Nevada corporation, prior to the consummation of the Migratory Merger, and Power Solutions International, Inc., a Delaware corporation, following the consummation of the Migratory Merger). Power Solutions International, Inc., a Nevada corporation, was formerly known as Format, Inc. (“Format”), and prior to the consummation of the Reverse Recapitalization (as defined below), was engaged, to a limited extent, in EDGARizing corporate documents for filing with the Securities and Exchange Commission (“SEC”) and in providing limited commercial printing services. On April 29, 2011, Format consummated a reverse acquisition transaction with The W Group, Inc. and its subsidiaries (“The W Group”), and The W Group remained as the surviving corporation of the reverse acquisition, becoming a wholly-owned subsidiary of Power Solutions International. Based upon the nominal operations and assets of Format immediately prior to the consummation of the reverse acquisition and the other transactions described in Note 3, “Reverse recapitalization of The W Group, private placement, reverse split and migratory merger,” Format may be deemed to have been a “shell company” (as that term is defined in Rule 12b-2 of the Securities Exchange Act of 1934, as amended). Therefore, the reverse acquisition transaction has been accounted for as a reverse recapitalization and no goodwill or intangible assets have been recorded (“Reverse Recapitalization”). The W Group is the accounting acquiror in the Reverse Recapitalization because The W Group’s former stockholders received the greater portion of the voting rights in the combined entity, and The W Group’s senior management represents all of the senior management of PSI. Therefore, it is The W Group’s historical financial position and results of operations that are presented in the consolidated financial statements, with The W Group’s historical equity restated to reflect the originally issued and outstanding equity of Format, plus the equity issued by Power Solutions International, pursuant to the Reverse Recapitalization.
Upon the closing of the Reverse Recapitalization of The W Group, the Company succeeded to the business of The W Group, which is described below. In connection with the Reverse Recapitalization, effective April 29, 2011, Format changed its corporate name to Power Solutions International, Inc. Unless the context otherwise requires, the “Company” refers to The W Group prior to the closing of the Reverse Recapitalization on April 29, 2011, and Power Solutions International, as successor to the business of The W Group, following the closing of the Reverse Recapitalization.
On August 26, 2011, pursuant to the Migratory Merger, Power Solutions International, Inc., a Nevada corporation, merged into its newly-created, wholly-owned subsidiary Power Solutions International, Inc., a Delaware corporation, which effected its reincorporation into the State of Delaware from the State of Nevada and effected a reverse stock split of its common stock by converting each 32 shares of common stock of Power Solutions International, Inc., a Nevada corporation, into one share of common stock of Power Solutions International, Inc., a Delaware corporation, as the surviving entity in the Migratory Merger. See Note 3, “Reverse recapitalization of The W Group, private placement, reverse split and migratory merger,” for a further description of the Migratory Merger and Reverse Split.
Nature of business operations
The Company is a global producer and distributor of a broad range of high performance, certified low emission, power systems for original equipment manufacturers of off-highway industrial equipment (“industrial OEMs”). The Company’s customers include companies that are large, industry-leading and/or multinational organizations, and the Company is a sole source power system provider for most of its customers. The Company’s products and services are sold predominantly to customers throughout North America, as well as to customers located throughout Asia and Europe.
The Company’s power systems are highly engineered, comprehensive systems which, through its technologically sophisticated development and manufacturing processes, including its in-house design, prototyping, testing and engineering capabilities and its analysis and determination of the specific components to be integrated into a given power system (driven in large part by emission standards and cost restrictions required, or desired, to be
F-7
Table of Contents
met), allow the Company to provide to its customers power systems customized to meet specific industrial OEM application requirements, other technical specifications of customers and requirements imposed by environmental regulatory bodies. The Company’s power system configurations range from a basic engine block integrated with appropriate fuel system components to completely packaged power systems that include any combination of cooling systems, electronic systems, air intake systems, fuel systems, housings, power takeoff systems, exhaust systems, hydraulic systems, enclosures, brackets, hoses, tubes and other assembled componentry. The Company currently obtains the engines which are integrated into its power systems from third party suppliers. The Company is currently conducting research and development for the purpose of designing and developing one of its engines in-house. Of the other components that the Company integrates into its power systems, a substantial portion consist of internally designed components and components for which the Company coordinates significant design efforts with third party suppliers, with the remainder consisting largely of parts that are sourced off-the-shelf from third party suppliers. Some of the key components (including all of the engines) embody proprietary intellectual property of the Company’s suppliers. As a result of its design and manufacturing capabilities, the Company is able to provide to its customers a comprehensive power system which can be incorporated, using a single part number, directly into a customer’s specified application. Capitalizing on its expertise in developing and manufacturing emission-certified power systems and through its access to the latest power system technologies, the Company believes that it is able to provide complete “green” power systems to industrial OEMs at a low cost and with fast design turnaround. In addition to the certified products described above, the Company sells diesel and non-certified power systems and aftermarket components.
Basis of presentation
The consolidated financial statements of Power Solutions International, Inc. present information in accordance with generally accepted accounting principles in the U.S. (“GAAP”) and have been prepared pursuant to the rules and regulations of the Securities and Exchange Commission (SEC) and reflect all adjustments necessary to present fairly the consolidated financial position, results of operations and cash flows of the Company, The W Group and its wholly-owned subsidiaries for the periods presented, including retroactive restatement to reflect the 1-for-32 Reverse Split approved by the stockholders in their vote on the Migratory Merger and Reverse Split which were effective August 26, 2011 (and described below in Note 3, “Reverse recapitalization of The W Group, private placement, reverse split and migratory merger”), as required in accordance with SEC Staff Accounting Bulletin (SAB) Topic 4C Equity Accounts — Change in Capital Structure, and Financial Accounting Standards Board (“FASB”) Accounting Standards Codification (“ASC”) 260, Earnings Per Share. Accordingly, the consolidated balance sheets presented herein reflect a reduction in the aggregate dollar value of common shares issued and outstanding, with a corresponding increase reflected in additional paid-in capital of approximately $0.01 million, as detailed in Note 14, “Stockholders’ equity.” Total authorized shares were unchanged by the Reverse Split. The consummation of the Migratory Merger and Reverse Split, effective on August 26, 2011, also triggered the automatic conversion of the shares of the Company’s preferred stock to Company common stock. In accordance with ASC 260, the conversion of the Company’s preferred stock is presented prospectively from August 26, 2011, in the Company’s results as of and for the year ended December 31, 2011, resulting in a $9.7 million increase in additional paid in capital and elimination of the Series A Convertible Preferred Stock in the Company’s consolidated balance sheet as of December 31, 2011, also detailed in Note 14, “Stockholders’ equity.” Earnings per share is calculated based upon the weighted average shares which reflect the conversion of the preferred shares to shares of the Company’s common stock effective August 26, 2011, as restated for the Reverse Split.
Principles of consolidation
The consolidated financial statements include the accounts of The W Group, Inc., a wholly-owned subsidiary of Power Solutions International, Inc., and its wholly-owned subsidiaries, Power Production, Inc., Power Great Lakes, Inc., Power Solutions, Inc., Power Global Solutions, Inc., Auto Manufacturing, Inc., Torque Power Source Parts, Inc., XISync, LLC, PSI International, LLC, and Power Properties, L.L.C. Collectively, these entities produce and distribute off-highway industrial engines and provide aftermarket support for the industrial engine market. All intercompany balances and transactions have been eliminated in the consolidation.
Use of estimates
The preparation of consolidated financial statements in conformity with GAAP requires that management make estimates and assumptions that affect the reported amounts of assets and liabilities and disclosure of contingent assets and liabilities as of the date of the consolidated financial statements and the reported amounts of revenue and expenses during the reporting period. Actual results could materially differ from those estimates.
F-8
Table of Contents
Revenue recognition
The Company recognizes revenue at the time title and risk of loss of inventory passes to the customer, which is typically upon shipment of goods. In certain cases, revenue is recognized upon billing for goods which are not immediately shipped at the request and for the convenience of the customer, otherwise known as a “bill and hold” arrangement. In these cases, revenue is recognized under the same terms and conditions as any other sale except that the products are held by the Company until the customer initiates the shipment of the product from the Company’s warehouses. Transfer of the title and risk of loss pass to the customer, and there are no future performance obligations, at the time the bill and hold sale is recognized. Any product that has been sold under a bill and hold arrangement is segregated from the Company’s owned inventory. As of December 31, 2010, the Company had $1,742,000 of undelivered product of which $391,000 was unpaid, and such product was shipped and the unpaid balance collected during 2011. The Company did not enter into any bill and hold arrangements during 2011.
The Company classifies shipping and handling charges billed to customers as revenue. Shipping and handling costs paid to others are classified as a component of cost of sales when incurred.
Inventories
Inventories consist primarily of engines and parts. Engines are valued at the lower of cost, as determined by specific serial number identification, or market value. Parts are valued at the lower of cost (first-in, first out) or market value. The Company writes down inventory for an estimated amount equal to the difference between the cost of the inventory and the estimated realizable value. Estimated realizable value for each item in inventory is based upon the Company’s estimation of future demand for the quantity of inventory on hand. In determining an estimate of future demand, multiple factors are taken into consideration including (i) customer purchase orders and customer forecasted demand; (ii) historical sales/usage for each inventory item; and (iii) utilization within a current or anticipated future power system.
The components of inventory were as follows as of December 31:
| 2011 | 2010 | |||||||
| Raw material |
$ | 29,128 | $ | 26,156 | ||||
| Finished goods |
4,265 | 6,012 | ||||||
|
|
|
|
|
|||||
| Total |
$ | 33,393 | $ | 32,168 | ||||
|
|
|
|
|
|||||
Accounts receivable and allowance for doubtful accounts
Accounts receivable are due under normal trade terms generally requiring payment within 30 to 45 days from the invoice date. A limited number of customers have terms which may extend up to 150 days from the invoice date. The carrying amount of accounts receivable is reduced by a valuation allowance that reflects management’s best estimate of the amounts that will not be collected. Management specifically reviews all past due accounts receivable balances and, based on historical experience and an assessment of current creditworthiness, estimates the portion, if any, of the balance that will not be collected.
The activity in the Company’s allowance for doubtful accounts as of December 31, was as follows:
| 2011 | 2010 | |||||||
| Balance at beginning of year |
$ | 340 | $ | 411 | ||||
| Charged to expense |
69 | 4 | ||||||
| Write-offs, net of recoveries |
(269 | ) | (75 | ) | ||||
|
|
|
|
|
|||||
| Balance at end of year |
$ | 140 | $ | 340 | ||||
|
|
|
|
|
|||||
Cash overdrafts
Under the Company’s cash management system, cash overdraft balances exist for the Company’s primary disbursement accounts and such cash overdraft balances are classified within accounts payable on the Company’s consolidated balance sheet. These overdrafts represent uncleared checks in excess of cash balances in the related bank accounts. Funds are transferred, from borrowings on the Company’s line of credit, to cover cash overdrafts on an as-needed basis to pay for clearing checks.
F-9
Table of Contents
Warranty costs
The Company offers a standard limited warranty on the workmanship of its products that in most cases covers defects for a period of (i) one year from the date of shipment or (ii) six months from the date products are placed into service, whichever occurs first. Warranties for certified emission products are mandated by the Environmental Protection Agency (“EPA”) and/or the California Air Resources Board (“CARB”) and are longer than the Company’s standard warranty on certain emission related products. The Company’s products also carry limited warranties from suppliers. Costs related to supplier warranty claims are borne by the supplier; the Company’s warranties apply only to the modifications made to supplier base products. The Company’s management estimates and records a liability, and related charge to income, for the warranty program at the time products are sold to customers. Estimates are based on historical experience and reflect management’s best estimates of expected costs at the time products are sold. The Company makes adjustments to estimates in the period in which it is determined that actual costs may differ from initial or previous estimates.
The activity in the Company’s warranty accrual as of December 31, was as follows:
| 2011 | 2010 | |||||||
| Balance at beginning of year |
$ | 277 | $ | 200 | ||||
| Charged to expense |
697 | 492 | ||||||
| Payments |
(171 | ) | (415 | ) | ||||
|
|
|
|
|
|||||
| Balance at end of year |
$ | 803 | $ | 277 | ||||
|
|
|
|
|
|||||
Private placement warrants
For every share of the Company’s common stock issuable upon conversion of preferred stock purchased in the private placement, each investor in the private placement also received a warrant to purchase one-half of a share of the Company’s common stock, at an exercise price of $13.00 per share, as adjusted for the reverse split and subject to further adjustment for non-cash dividends, distributions, stock splits or other reorganizations or reclassifications of the Company’s common stock. These warrants represent the right to purchase a total of 750,002 shares of the Company’s common stock, but the private placement warrants were not exercisable prior to the reverse split. The private placement warrants are also subject to full ratchet anti-dilution protection, whereby, upon the issuance of shares of the Company’s common stock at a price below the then-current exercise price of the private placement warrants (or the issuance of securities convertible into or exercisable for shares of the Company’s common stock at a price below the then-current exercise price of the private placement warrants), subject to specified exceptions, the exercise price of the private placement warrants will be reduced to the effective price of the Company’s common stock so issued (or issuable upon conversion of issued securities). The private placement warrants will expire on April 29, 2016.
The private placement warrants issued with the 18,000 shares of the Company’s preferred stock had a fair value of $2,887,500 at the closing of the reverse recapitalization transaction and the private placement on April 29, 2011, determined based upon the agreed-upon exercise price of the private placement warrants; the purchase price for (value of) the Company’s preferred stock and private placement warrants, in the aggregate as agreed upon with the investors in the private placement; and assessment of an appropriate risk-free interest rate of 2.1%, an anticipated volatility factor of 50.0%, and a zero percent dividend yield, all incorporated into the valuation using the Black-Scholes option pricing model. The Company determined that the five-year Treasury Bond yield was a reasonable assumption for a risk-free rate, and that an appropriate volatility rate would represent the upper end of the range of implied volatility of publicly traded call options of benchmark companies, which reflects the mid-range of their historical volatility. The Company’s past history of not paying dividends and management’s intentions to continue such a dividend policy resulted in a zero dividend yield assumption. The five-year term of the private placement warrants, the stated warrant exercise price of $13.00 per share, as adjusted for the reverse split, when the private placement warrants became exercisable, and the Company’s common stock valuation of $10.08 per share (post-reverse split basis, when the private placement warrants became exercisable) comprise the balance of the inputs into the Company’s Black-Scholes pricing model for the warrant valuation.
The liability for the private placement warrant is a fair value instrument as measured under ASC Topic 825, “Financial Instruments.” As such, the private placement warrants liability is valued based upon unobservable inputs and thus is considered a “Level 3” financial instrument, the measurement of which involves various assumptions, as described in Note 8, “Fair Value of Financial Instruments”. These assumptions include an assessment of the risk-
F-10
Table of Contents
free interest rate, an anticipated volatility factor, dividend yield and other assumptions. Since the date of issuance of the private placement warrants, the liability associated with these warrants has increased from $2.9 million at April 29, 2011 to $3.3 million at December 31, 2011.
Research & development and engineering costs
The Company expenses research & development and engineering costs when incurred except for initial emission certification costs which are capitalized and amortized over the estimated life of the certification. Research & development costs classified within research & development and engineering expenses in the consolidated statements of operations, consist primarily of wages related to engineering work and approximated $4.0 million, $3.0 million and $2.4 million for the years ended December 31, 2011, 2010, and 2009, respectively.
Concentrations
The Company maintains cash balances in various accounts at one financial institution in the Midwest. Interest-bearing accounts are insured by the Federal Deposit Insurance Corporation (FDIC) up to $250 thousand per institution and per depositor. In addition, FDIC insurance on noninterest-bearing accounts is unlimited through December 31, 2012. At December 31, 2011, the Company had no uninsured cash balances.
The Company is exposed to potential credit risks associated with its accounts receivable. The Company performs ongoing credit evaluations of its customers and generally does not require collateral on its accounts receivable. For certain non-U.S. trade receivables, the Company obtains trade credit insurance or requires letters of credit for those non-U.S. accounts for which trade credit insurance is not available or is insufficient. The Company has not experienced significant credit-related losses to date.
One customer (“Customer A”) individually accounted for more than 10% of the Company’s sales during one or more years from 2009 through 2011 and represented 15%, 19% and 25% of consolidated net sales in 2011, 2010, and 2009, respectively.
Two customers (“Customer A” referred to above, and “Customer E”) individually accounted for more than 10% of consolidated accounts receivable at December 31, 2011. At December 31, 2010, three customers (“Customer A” referred to above, “Customer D” and “Customer C”) individually accounted for more than 10% of consolidated accounts receivable. At December 31, 2011 and 2010, Customer A represented 12% and 12% of consolidated accounts receivable, respectively. Customer D represented 10% and 12% of consolidated accounts receivable at December 31, 2011 and 2010, respectively. Customer E represented 13% and 1% of consolidated accounts receivable at December 31, 2011 and 2010, respectively. Customer C represented 9% and 14% of consolidated accounts receivable at December 31, 2011 and 2010, respectively.
Two vendors (“Vendor A” and “Vendor B”) individually accounted for more than 10% of the Company’s purchases during one or more years from 2009 through 2011. Vendor A accounted for 37%, 31% and 39% of the Company’s purchases in 2011, 2010, and 2009, respectively. Vendor B accounted for 16% of the Company’s purchases in 2010 and less than 10% of the Company’s purchases in 2011 and 2009, respectively.
Fair value of financial instruments
The Company’s financial instruments include accounts receivable, accounts payable, line of credit, notes payable, capital lease obligations and private placement warrants. The carrying amounts of accounts receivable and accounts payable approximate fair value because of their short-term nature. The carrying value of the line of credit, notes payable and capital lease obligations approximate fair value because the interest rates fluctuate with market interest rates or the fixed rates are based on current rates offered to the Company for debt with similar terms and maturities. Based upon the Company’s current credit agreement with BMO Harris Bank N.A. (formerly known as Harris N.A.), (“Harris”) using the Company’s balances and interest rates as of December 31, 2011, and holding other variables constant, a 10% increase in the interest rates for the next 12 month period charged by Harris to the Company would have decreased the Company’s pre-tax earnings and cash flow by less than $0.1 million.
The fair value of the private placement warrants is described above under private placement warrants.
Self-funded insurance
The Company is self-insured for certain costs of its employee health insurance plan, although the Company obtains third-party insurance coverage to limit its exposure. The Company maintains a stop-loss insurance policy with individual and aggregate stop-loss coverage.
F-11
Table of Contents
Income taxes
The Company accounts for income taxes under the asset and liability method, which requires the recognition of deferred tax assets and liabilities for the expected future tax consequences of events that have been included in the financial statements. Under this method, deferred tax assets and liabilities are determined based on the differences between the financial statements and tax basis of assets and liabilities using enacted tax rates in effect for the year in which the differences are expected to reverse. The effect of a change in tax rates on deferred tax assets and liabilities is recognized in income in the period that includes the enactment date.
The Company records net deferred tax assets to the extent it believes these assets will more likely than not be realized. In making such a determination, the Company considers all available positive and negative evidence, including future reversals of existing taxable temporary differences, projected future taxable income, tax-planning strategies, and results of recent operations. As of December 31, 2011 and 2010, the Company had not recorded a tax asset valuation allowance.
The Company records uncertain tax positions in accordance with ASC 740, Income Taxes, on the basis of a two-step process whereby (1) it determines whether it is more likely than not that the tax positions will be sustained based on the technical merits of the position and (2) for those tax positions that meet the more-likely-than-not recognition threshold, the Company recognizes the largest amount of tax benefit that is greater than 50 percent likely to be realized upon ultimate settlement with the related tax authority. As of December 31, 2011 and 2010, the Company has not recorded any tax benefit or tax liability for uncertain tax positions.
2. Recently issued accounting pronouncements
In May 2011, the FASB issued Accounting Standards Update (“ASU”) No. 2011-04, an update to Topic 820 — Fair Value Measurements and Disclosures of the Accounting Standards Codification. This update provides guidance on how fair value accounting should be applied where its use is already required or permitted by other standards and does not extend the use of fair value accounting. This ASU is effective for interim and annual periods beginning after December 15, 2011, and will be applied prospectively. Based upon the nature of its financial assets and liabilities, the Company does not expect the adoption to have a significant impact on its consolidated financial statements.
In June 2011, the FASB released ASU No. 2011-05, “Presentation of Comprehensive Income,” which eliminates the option to present the components of other comprehensive income in the statement of changes in stockholders’ equity. Instead, entities will have the option to present the components of net income, the components of other comprehensive income and total comprehensive income in a single continuous statement or in two separate but consecutive statements. In addition, this update requires entities to present the reclassification adjustments out of accumulated other comprehensive income by component in both the statement where net income is presented and the statement where other comprehensive income is presented. However, in December 2011, the FASB issued ASU No. 2011-12, “Deferral of the Effective Date for Amendments to the Presentation of Reclassifications of Items Out of Accumulated Other Comprehensive Income in Accounting Standards Update No. 2011-05,” which indefinitely deferred this provision of ASU 2011-05. The amendments do not change the items reported in other comprehensive income or when an item of other comprehensive income is reclassified to net income. This guidance is effective for fiscal years, and interim periods within those years, beginning after December 15, 2011, and will be applied retrospectively. As this guidance only revises the presentation of comprehensive income, the adoption of this guidance will not affect our financial position, results of operations or cash flows.
3. Reverse recapitalization of The W Group, private placement, reverse split and migratory merger
On April 29, 2011, Power Solutions International, Inc. (formerly known as Format, Inc.) completed a reverse acquisition transaction in which PSI Merger Sub, Inc., a Delaware corporation that was newly-created as a wholly-owned subsidiary of Power Solutions International, Inc., merged with and into The W Group, Inc. The W Group remained as the surviving corporation of the reverse acquisition transaction and became a wholly-owned subsidiary of Power Solutions International, Inc. Pursuant to an agreement and plan of merger, all of the outstanding shares of common stock of The W Group held by the three stockholders of The W Group at the closing of the reverse acquisition transaction converted into, and Power Solutions International, Inc. issued to the three stockholders of The W Group, an aggregate 10,000,000 shares of common stock (share amount prior to the Reverse Split defined below) and 95,960.90289 shares of Series A Convertible Preferred Stock (share amount prior to the Reverse Split defined below). In accordance with ASC 805, Business Combinations, The W Group was considered the accounting acquiror in the reverse acquisition.
F-12
Table of Contents
The W Group was considered the acquiror for accounting purposes, and has accounted for the transaction as a reverse recapitalization because (1) The W Group’s former stockholders received the greater portion of the voting rights in the combined entity, (2) The W Group’s senior management represented all of the senior management of the combined entity and (3) immediately prior to the transaction, Format, Inc., was a company with nominal operations and assets. Consequently, the assets and liabilities and the historical operations that are reflected in Power Solutions International, Inc.’s consolidated financial statements are those of The W Group and have been recorded at the historical cost basis of The W Group, with a recapitalization adjustment to report the issued equity of PSI. However, PSI has accounted for the reverse acquisition as a reverse recapitalization of The W Group, and no goodwill or other intangible assets have been recorded because immediately prior to, and at the time of the reverse acquisition, Format Inc., the accounting acquiree, was a company with nominal assets and nominal operations, engaged to a limited extent in EDGARizing corporate documents for filing with the SEC and limited commercial printing services.
The results of operations of Format, Inc. have not been included in the consolidated statement of operations from the date of the Reverse Recapitalization, April 29, 2011, because Format had nominal operations and assets, which consisted mostly of cash immediately prior to consummation of the Reverse Recapitalization transaction. In accordance with the accounting for an entity with nominal operations and assets under a reverse recapitalization transaction, the net income and equity of Format immediately prior to the Reverse Recapitalization have been reclassified to preferred equity. The related party obligations owed by Format immediately prior to the Reverse Recapitalization were settled through the terms of a repurchase agreement while the remaining obligations were settled with the available cash on Format Inc.’s balance sheet. Immediately prior to the reverse acquisition transaction, Format had assets with a net book value of $5,000 which were written off in connection with the transaction.
Concurrent with the closing of the Reverse Recapitalization, Power Solutions International, Inc. and The W Group entered into a purchase agreement (“Private Placement”) whereby Power Solutions International, Inc. completed the sale of an aggregate of 18,000 shares of PSI preferred stock together with warrants (“Private Placement Warrants”) representing the right to purchase an aggregate of 24,000,007 shares of PSI common stock (share amount prior to the Reverse Split defined below), subject to certain limitations on exercise. The shares of PSI preferred stock issued in the Private Placement were initially convertible into an aggregate of 48,000,007 shares of PSI common stock (share amount prior to the Reverse Split defined below), subject to certain limitations. In consideration, Power Solutions International, Inc. and The W Group received proceeds of $18.0 million before transaction fees, costs and expenses of approximately $5.1 million in connection with the Reverse Recapitalization and Private Placement.
In connection with the Private Placement, the Company also issued to Roth Capital Partners, LLC (“Roth”) a warrant (“Roth Warrant”) to purchase initially 3,360,000 shares of PSI common stock (share amount prior to the Reverse Split defined below), subject to certain limitations on exercise set forth in the Roth Warrant.
In connection with, and prior to the consummation of, the Reverse Recapitalization, the board of directors of Format approved a 1-for-32 reverse stock split of issued and outstanding shares of the Company’s common stock (“Reverse Split”), immediately following the effectiveness of which each 32 issued and outstanding shares of the Company’s common stock would automatically convert into one share of Company common stock. Any stockholder of the Company that would otherwise be entitled to a fraction of a share of the Company’s common stock (after aggregating all fractional shares of the Company’s common stock to be received by such holder) as a result of the Reverse Split, would receive an additional share of the Company’s common stock (i.e., the aggregate number of shares of the Company’s common stock of a stockholder resulting from the Reverse Split would be rounded up to the nearest whole number).
Further, in connection with the Reverse Recapitalization and the Private Placement, the board of directors of Format approved the migratory merger (“Migratory Merger”) of the Company with and into a Delaware corporation that was newly-created as a wholly-owned subsidiary of the Company, which Migratory Merger would be effected for the purpose of changing the Company’s jurisdiction of incorporation from Nevada to Delaware. The parties agreed that the Reverse Split would be effected through the consummation of the Migratory Merger, whereby each 32 shares of the Company’s common stock would be converted into one share of common stock of the surviving entity in the Migratory Merger. The consummation of the Migratory Merger would constitute the Reverse Split for all purposes, as contemplated by the transaction documents entered into in connection with the consummation of the Reverse Recapitalization and the Private Placement. The consummation by the Company of the Migratory Merger, including the Reverse Split to be effected thereby, was subject to the approval of the Company’s stockholders.
F-13
Table of Contents
The Migratory Merger and Reverse Split were approved by the stockholders at a special meeting of the Company’s stockholders held on August 25, 2011, and the Migratory Merger and the Reverse Split were effective on August 26, 2011. The Reverse Split did not affect the number of authorized shares of common stock of the Company or the par value per share of the Company’s common stock. Immediately following the effectiveness of the Reverse Split, each issued and outstanding share of Company preferred stock automatically converted into a number of shares of Company common stock equal to $1,000 divided by the conversion price then in effect.
The impact of the above transactions and subsequent exercise on September 1, 2011 of the Roth Warrant on the Company’s issued capital is further described in Note 14, “Stockholders’ equity.”
4. Earnings per share
The Company computes earnings per share by applying the guidance stated in ASC 260, Earnings per Share, to determine the net income (loss) available per share of its common stock. Earnings per share (“EPS”) was calculated using the two-class method until the conversion of the shares of the Company’s preferred stock to Company common stock (as described above under Note 3, “Reverse recapitalization of The W Group, private placement, reverse split and migratory merger” ), because the convertible preferred shares participated in any undistributed earnings with the common stockholders, specifically, on a one-to-one, as-if converted basis (without giving effect to the limitations on conversion of the preferred stock). Thus, under the two-class method, earnings allocated to preferred shares were based upon the proportion of the “as-if converted” preferred shares to the combined total of common shares, plus the “as-if converted” shares. Basic and diluted EPS under the two-class method was then calculated by dividing these earnings allocated to common shares by the weighted average of the actual common shares outstanding during the reporting period after giving effect to the adjustment for the Reverse Split.
Though the Company did not pay dividends prior to the Reverse Split, because the preferred stock granted the right to participate in undistributed earnings with Company common stock, it was considered a participating security, and the Company applied the two-class method to calculate per share amounts for distributed and undistributed earnings required under ASC 260-10-45, until all of the shares of preferred stock were converted into shares of Company common stock. Upon the effectiveness of the Reverse Split on August 26, 2011, all shares of the Company’s preferred stock automatically converted into shares of the Company’s common stock. Effective upon the conversion of the Company preferred stock to Company common stock, the treasury stock method is used to compute earnings per share.
Diluted earnings per share, under both the two-class method and the treasury stock method, is calculated by evaluating the dilutive effect of potential shares of the Company’s common stock issuable through the exercise of the Private Placement Warrants and the Roth Warrant. The PSI preferred stock was subject to full-ratchet anti-dilution whereby, upon the issuance (or deemed issuance) of shares of PSI common stock at a price below the then-current conversion price of the PSI preferred stock, subject to specified exceptions, the conversion price of the PSI preferred stock would have been reduced to the effective price of PSI common stock so issued (or deemed to be issued). Contingently issuable shares per terms of the full ratchet anti-dilution protection granted to the Company’s preferred shares, were not evaluated for their dilutive effect, as the conditions for their issuance were not met as of December 31, 2011 and, thus, were not included in diluted earnings per share.
The purchase agreement for the Private Placement contains the following provision, which may be deemed to be a form of anti-dilution protection: if prior to the earlier of (a) the second anniversary of the date on which the registration statement for the shares of Company common stock underlying the preferred stock and the Private Placement Warrants become effective and (b) 180 days after the closing of a firm commitment public underwritten offering of equity securities resulting in gross proceeds of not less than $15.0 million, the Company issues equity securities in a public or private offering (or series of related offerings) resulting in gross proceeds to the Company of at least $5.0 million at or below an effective price per share of $12.00 as adjusted for the Reverse Split (“Reset Price”), subject to further adjustment, the Company will have to issue to each investor in the Private Placement (1) additional shares of Company common stock so that after giving effect to such issuance, the effective price per share of its common stock acquired by such investors in the Private Placement will be equal to the Reset Price and (2) additional Private Placement warrants covering a number of shares of Company common stock equal to 50% of the shares of its common stock issued pursuant to clause (1) above. These provisions are not triggered based on the market price of Company common stock, but rather on the issuance by the Company of additional equity securities below an effective price per share of $12.00 as adjusted for the Reverse Split. The contingent issuance of additional common shares as a result of the anti-dilution provisions discussed above represents a market-based contingency that does not become a reality until the Company issues securities in the manner described above.
F-14
Table of Contents
The Company utilizes the treasury stock method described in ASC 260-10-55 to determine the number of treasury shares assumed to be purchased from the proceeds of warrant exercises, with any residual shares representing the incremental common shares to be issued and included in diluted EPS. The Private Placement Warrants and the Roth Warrant (until exercised) have been evaluated for their potentially dilutive effect using the treasury stock method. The number of treasury shares that could be purchased with the proceeds from exercise of these warrants is excluded from diluted EPS.
Computation of undistributed earnings and allocation of undistributed earnings to participating securities
The undistributed earnings were allocable to the participating securities (i.e., common shares and the convertible preferred shares) on a pro rata basis under the two-class method until August 26, 2011, the effective date of the Migratory Merger, through which the Reverse Split was consummated (including the automatic conversion of preferred stock effected thereby). Through August 26, 2011, the allocation of undistributed earnings to each class of participating stock was based upon the proportionate ratio of average outstanding shares in each class of stock to the total average shares outstanding as adjusted for the Reverse Split, on an as-if converted basis. Upon the effectiveness of the Migratory Merger, each of the preferred shares was automatically converted into a number of shares of common stock of the surviving entity in the Migratory Merger, equal to one-thousand dollars divided by $12.00 per share, the conversion price for the preferred stock, as adjusted for the Reverse Split, and thereafter, no PSI preferred shares existed. Accordingly, all undistributed earnings were allocated to shares of common stock after conversion of the shares of preferred stock into shares of common stock on August 26, 2011.
Anti-dilutive potential common shares excluded from the diluted earnings per share computation
The Company’s anti-dilutive potential common shares include 750,002 shares of common stock issuable upon exercise of the Private Placement Warrants, with an exercise price of $13.00 per share adjusted for the Reverse Split, and included 105,000 shares of common stock issuable upon exercise of the Roth Warrant, with an exercise price of $13.20 per share. The Roth Warrant was cashlessly exercised in full on September 1, 2011, for an aggregate of 62,116 shares of common stock based upon the value of the Company’s common stock as determined in the common stock warrant agreement. Based upon an average estimated fair value of $9.55 per share of the Company’s common stock for the year ended December 31, 2011, respectively, all of the potentially issuable shares of common stock were excluded from the diluted EPS calculation.
Because there was not an active market for the Company’s common stock during the year ended December 31, 2011, the Company estimated the average fair value of its common share using the same estimated fair value of its common stock as the Company used to the allocate the gross proceeds received from the private placement of its Series A Convertible Preferred Stock and its Private Placement Warrants on April 29, 2011, and to subsequently estimate the fair value of its common stock as of June 30, 2011, September 30, 2011 and December 31, 2011 in order to re-value its Private Placement Warrants liability, as described in Note 14, “Stockholders’ equity”, and Note 8, “Fair value of financial instruments,” respectively.
5. Inventories
Inventory consists primarily of engines and parts. Engines are valued at the lower of cost plus estimated freight-in, as determined by specific serial number identification or market value. Parts are valued at the lower of cost (first-in, first-out) plus freight-in, or market value. When necessary, the Company writes down the valuation of its inventory in an amount equal to the difference between the cost of inventory and the estimated realizable value based upon assumptions about future demand and market conditions.
6. Property, plant and equipment, net
The components of property, plant and equipment were as follows as of December 31:
| 2011 | 2010 | |||||||
| Land |
$ | 260 | $ | 260 | ||||
| Building and improvements |
1,975 | 1,899 | ||||||
| Office furniture and equipment |
2,899 | 2,633 | ||||||
| Tooling and equipment |
3,775 | 3,314 | ||||||
| Transportation equipment |
223 | 431 | ||||||
| Construction in progress |
607 | 160 | ||||||
|
|
|
|
|
|||||
| Property, plant and equipment, at cost |
9,739 | 8,697 | ||||||
| Accumulated depreciation |
(6,128 | ) | (5,814 | ) | ||||
|
|
|
|
|
|||||
| Property, plant and equipment, net |
$ | 3,611 | $ | 2,883 | ||||
|
|
|
|
|
|||||
F-15
Table of Contents
Property, plant and equipment are recorded at cost. The Company computes depreciation using the straight-line method over the estimated useful lives of the assets. Leasehold improvements are depreciated over the shorter of their estimated useful lives or the period from the date the assets are placed in service to the end of the initial lease term. Depreciation expense totaled $785,000, $988,000, and $984,000 for the years ended December 31, 2011, 2010, and 2009, respectively.
Depreciation of equipment acquired under a capital lease is provided using the straight line method over the shorter of the useful life of the equipment or the duration of the lease. The related depreciation for capital lease assets is included in depreciation expense. The Company did not have equipment under capital lease at December 31, 2011. The carrying value of property under capital lease was $456,000 at December 31, 2010, net of accumulated depreciation of $1.1 million.
Repairs and maintenance costs are charged directly to expense as incurred. Major renewals or replacements that substantially extend the useful life of an asset are capitalized and depreciated.
Estimated useful lives by major asset category are as follows:
| Life (in years) | ||
| Buildings |
39 | |
| Leasehold improvements |
8 – 10 | |
| Office furniture and equipment |
8 | |
| Tooling and equipment |
3 – 8 | |
| Transportation equipment |
5 | |
| Property under capital lease |
3 – 8 |
Long-lived assets
Long-lived assets, such as property, plant and equipment and land, are evaluated for impairment whenever, events or changes in circumstances indicate the carrying value of an asset may not be recoverable. If such review indicates that the carrying amount of long-lived assets is not recoverable, the carrying amount of such assets is reduced to fair value. There were no adjustments to the carrying value of long-lived assets during the years ended December 31, 2011 and 2010.
7. Other noncurrent assets
Other noncurrent assets which are amortized over the periods for which benefits are expected to be realized include the following as of December 31:
| 2011 | 2010 | |||||||
| Deferred transaction expenses |
$ | — | $ | 870 | ||||
| Loan origination fees, net |
160 | 338 | ||||||
| Deposits |
613 | 412 | ||||||
| Deferred emissions certifications, net |
329 | 523 | ||||||
| Other |
349 | 162 | ||||||
|
|
|
|
|
|||||
| $ | 1,451 | $ | 2,305 | |||||
|
|
|
|
|
|||||
Deferred transaction expenses at December 31, 2010 primarily consisted of professional and consulting fees incurred in connection with the Reverse Recapitalization and the Private Placement completed on April 29, 2011, as described in Note 3, “Reverse recapitalization of The W Group, private placement, reverse split and migratory merger.”
Loan origination fees included in other noncurrent assets as of December 31, 2011 and 2010, represent the noncurrent portion of unamortized loan fees associated with the Harris Agreement and the Prior Credit Agreement (each as defined and described under Note 9, “Line of credit”), respectively. The total unamortized loan origination
F-16
Table of Contents
fees were $279,000 and $558,000 as of December 31, 2011 and 2010, respectively, the current portion of which is classified in “Prepaid and other” on the balance sheet. As described in Note 9, “Line of credit”, and Note 10, “Long-term debt”, the Company repaid its debt obligations under the Prior Credit Agreement effective April 29, 2011. Accordingly, the Company recognized a loss on debt extinguishment of $485,000 during the quarter ended June 30, 2011, related to the remaining unamortized loan fees associated with the Prior Credit Agreement. Amortization expense related to loan origination fees and classified as interest expense was $153,000, $230,000 and $502,000 for the years ended December 31, 2011, 2010 and 2009, respectively.
Deposits at December 31, 2011, and 2010, primarily consisted of security deposits related to operating leases. Deposits are classified as other noncurrent assets on the balance sheet.
The non-current portion of deferred emissions certifications as of December 31, 2011 and 2010 was $329,000 and 523,000, respectively. The Company is required to certify that certain engines sold comply with various emissions laws in accordance with regulations issued by the EPA and the CARB. Once issued, the emissions certifications for these engines are typically valid for periods of three to five years. The non-current portion of the costs of obtaining the emissions certificates are classified as other noncurrent assets with the amount expected to be amortized in the next year classified as a prepaid expense. Emissions certification costs are recognized as an operating expense over the estimated certification period of the respective emission certification.
8. Fair value of financial instruments
As of December 31, 2011, the Company measured its financial instrument under ASC Topic 825, Financial Instruments, which defines fair value as the price that would be received to sell an asset or paid to transfer a liability (i.e., exit price) in an orderly transaction between market participants at the measurement date. It also establishes a three-level valuation hierarchy for disclosures of fair value measurement as follows:
Level 1 — quoted prices in active markets for identical assets or liabilities,
Level 2 — other significant observable inputs for the assets or liabilities through corroborations with market data at the measurement date, and
Level 3 — significant unobservable inputs that reflect management’s best estimate of what market participants would use to price the assets or liabilities at the measurement date.
Private placement warrants liability
As of December 31, 2011, the Company’s sole financial instrument measured at fair value under ASC Topic 825, Financial Instruments, were the Company’s warrants issued in the Private Placement, discussed previously in Note 3, “Reverse recapitalization of The W Group, private placement, reverse split and migratory merger.”
The Company’s liability for the warrants issued in the Private Placement is measured at fair value based on unobservable inputs, and thus is considered a Level 3 financial instrument. The Company analyzes all financial instruments with features of both liabilities and equity under ASC 480, Distinguishing Liabilities from Equity, and ASC 815, Derivatives and Hedging.
To estimate the Fair Value the Private Placement warrants as of December 31, 2011, the Company used the Black-Scholes option pricing model. The inputs of the Black-Scholes option pricing model include the fair value of the Company’s common stock, exercise price, risk-free interest rate, estimated price volatility, term, and dividend yield.
Due to the limited trading activity in the Company’s common stock, the fair value of our common stock was established through multiple valuation techniques, including (a) the income approach in the form of the discounted cash flow (“DCF”) method and (b) the market approach in the form of (i) the guideline public company method and (ii) the merger and acquisition method.
For the guideline public company method, the Company selected a group of publicly-traded companies that are similar in size, industry, growth stage, or business model. The valuation multiples considered for providing indicated values was the ratio of enterprise value to the last twelve months and estimated future earnings before interest, income taxes, depreciation and amortization (“EBITDA”) and the ratio of the market value of equity (“MVE”) to the last twelve months and estimated future net income. Both enterprise value and MVE of each guideline public company were calculated based on closing stock prices as of the respective valuation date.
F-17
Table of Contents
For the merger and acquisition method, the Company considered information available on three recent transactions involving acquisitions of companies that are similar in size, industry, or business model. The valuation multiple considered for providing indicated values was the ratio of enterprise value to the last twelve months EBITDA. The enterprise values of the acquired companies were calculated by adding the equity purchase price to the debt in place of each company’s balance sheet (net of cash acquired).
After establishing the enterprise value, the Company’s net outstanding debt was deducted to determine the Company’s total equity value. Total equity value was then allocated among the securities that comprise the Company’s capital structure using the Black-Scholes method, as described in the American Institute of Certified Public Accountants Practice Aid, “Valuation of Privately-Held Company Equity Securities Issued as Compensation” (AICPA Practice Aid). In addition to the total equity value, the Black-Scholes method utilized the following assumptions: an exercise price of $127.6 million (which reflects the public equivalent value of equity necessary for the private placement warrants to accrue value, which is calculated based on the number of the Company’s common shares issued and outstanding plus the number of Private Placement Warrants, multiplied by the $13.00 per share strike price for the private placement warrants), a remaining contractual term of 4.33 years, an assessment of the risk-free interest rate of 0.6%, an anticipated volatility factor of 60.0% (representing the upper end of the range of implied volatility of publicly traded call options of benchmark companies), and a zero dividend yield.
The suggested value from the Black-Scholes method reflects a fully marketable security that is not burdened by limited marketability; however, the Company’s common stock (and by extension the Private Placement warrants) does not currently have regular trading activity. Therefore, the Company considered it necessary to incorporate a discount for lack of marketability to reflect the limited liquidity associated with the Private Placement warrants.
The following table summarizes fair value measurements by level as of December 31, 2011, for the Company’s financial instrument measured at fair value on a recurring basis:
| Level 1 | Level 2 | Level 3 | ||||||
| Private placement warrants liability |
$ | 3,270 | ||||||
|
|
|
|||||||
The following table summarizes the change in the estimated fair value of the Company’s Level 3 financial instrument for the year ended December 31, 2011:
| Balance at December 31, 2010 |
$ | — | ||
| Private placement warrants issued |
2,888 | |||
| Change in the value of private placement warrants liability |
382 | |||
|
|
|
|||
| Balance at December 31, 2011 |
$ | 3,270 | ||
|
|
|
As of December 31, 2010, the Company did not have any assets or liabilities required to be presented on the balance sheet at fair value in accordance with ASC 825.
9. Line of credit
The Company has a revolving credit facility with BMO Harris, N.A. (formerly Harris N.A.). Prior to the amendment of the loan and security agreement with BMO Harris Bank N.A. on March 20, 2012, the existing and historical financing arrangements required that cash received be applied against the Company’s revolving line of credit. Accordingly, the Company did not maintain cash or cash equivalents on its balance sheet, but instead funded its operations through borrowings under its revolving line of credit.
On April 29, 2011, in connection with the closing of the Reverse Recapitalization, The W Group and Power Solutions International, Inc. entered into a loan and security agreement with BMO Harris, N.A. (“Harris Agreement”), which replaced the existing loan and security agreement that The W Group had with its senior lender (“Prior Credit Agreement”) prior to the closing of the Reverse Recapitalization. Pursuant to the Harris Agreement, among other things, the maximum loan amount was reduced from the maximum loan amount under The W Group’s Prior Credit Agreement to reflect The W Group’s repayment in full of its two previously outstanding term loans under the Prior Credit Agreement, and the financial covenants under the Prior Credit Agreement were replaced with a new fixed charge coverage ratio covenant. Prior to the amendment of the loan and security agreement on March 20, 2012, the Harris Agreement provided for borrowings up to $35.0 million under a Revolving Line of Credit (“Line of Credit”) which was scheduled to mature on April 29, 2014. The Harris Agreement is collateralized by substantially all of the Company’s assets. The Company was also required to meet certain financial covenants, including a minimum monthly fixed charge coverage ratio and a limitation on annual capital expenditures. The
F-18
Table of Contents
Harris Agreement contains customary covenants and restrictions, including agreements to provide financial information, comply with laws, pay taxes and maintain insurance, restrictions on the incurrence of certain indebtedness, guarantees and liens, restrictions on mergers, acquisitions and certain dispositions of assets, and restrictions on the payment of dividends and distributions. In addition, the Harris Agreement required cash accounts to be held with BMO Harris Bank N.A. Prior to the amendment of the Harris Agreement, the cash deposits were swept daily by BMO Harris Bank N.A. daily and applied against the outstanding Line of Credit.
Under the Harris Agreement and prior to the amendment of the loan and security agreement on March 20, 2012 (in contrast to the Prior Credit Agreement): (a) the Company is a party to the Harris Agreement and pledged all of its shares of The W Group to BMO Harris Bank N.A. as collateral for the Line of Credit; (b) there are no term loans; (c) the Line of Credit bore interest at Harris’ prime rate (3.25% at December 31, 2011) plus an applicable margin ranging from 0% to 0.50%; or, at the Company’s option, all or a portion of the Line of Credit could have been designated to bear interest at LIBOR plus an applicable margin ranging from 2.00% to 2.50%; (d) the limitation on annual capital expenditures was increased from the limitation under The W Group’s Prior Credit Agreement; (e) a maximum quarterly senior debt leverage ratio, which was included in the Prior Credit Agreement, was eliminated; and (f) a fixed charge coverage ratio similar to the fixed charge coverage ratio in the Prior Credit Agreement was included, except that this fixed charge coverage ratio under the Harris Agreement excluded historical debt service on the Term Loans (as discussed below in Note 10, “Long-term debt”) and certain other one-time expenses. As of December 31, 2011, $4.7 million of the Company’s outstanding borrowings under its revolving line of credit bore interest at the prime rate, which equated to 3.25% with the applicable margin included. The remaining outstanding balance as of December 31, 2011, of $15.0 million had been designated to bear interest at the LIBOR rate, plus an applicable margin which equated to 2.29%. The unused and available line of credit balance was $15.3 million at December 31, 2011. The Company was in compliance with the financial covenants under its current credit facility as of December 31, 2011.
On March 20, 2012, the Harris Agreement was amended (“Amended Agreement”) to increase the total credit facility from $35.0 million to $50.0 million and is now scheduled to mature on March 20, 2017. Under the terms of the Amended Agreement (in contrast to the Harris Agreement): (a) the revolving line of credit bears interest at BMO Harris Bank N.A.’s prime rate plus an applicable margin ranging from 0% to 0.50%; or, at the Company’s option, all or a portion of the revolving line of credit can be designated to bear interest at LIBOR plus an applicable margin ranging from 1.75% to 2.25%; (b) the unused line fee has been reduced to 0.25%; and (c) the Company is only required to report its compliance with the fixed charge coverage ratio for any month when the Company’s Excess Availability, as defined in the Amended Agreement, is less than the Liquidity Threshold, as defined in the Amended Agreement, for 60 consecutive days. The Liquidity Threshold is defined as the greater of (i) $7,500,000 or (ii) 12.5% of the total credit facility of $50.0 million as may be reduced from time to time pursuant to the terms of the Amended Agreement. Under the Amended Agreement, cash balances are no longer automatically swept by BMO Harris Bank N.A., and, as a result, from time to time, the Company may carry cash balances on its consolidated balance sheet.
The Prior Credit Agreement provided borrowings up to $29.0 million, bearing interest at the bank’s prime rate (3.25% at December 31, 2010), plus an applicable margin ranging from 2.25% to 2.50%. At December 31, 2010, the Company had designated the entire outstanding balance of $21.6 million to bear interest at LIBOR as allowed under the Prior Credit Agreement. The unused line balance was $7.4 million at December 31, 2010, and the interest rate on the line of credit was 5.50%. As of December 31, 2010, the Company determined that they were not in compliance with the quarterly fixed charge coverage ratio and the quarterly senior debt leverage ratio covenants of the Prior Credit Agreement with Fifth Third Bank. The event of non-compliance at December 31, 2010 arose principally due to the timing of the payment of certain fixed charges such as tax payments during the period and because the Company’s actual EBITDA was less than the minimum required to be in compliance with the fixed charge coverage ratio and the senior debt leverage ratio. On January 20, 2011, the Company received from Fifth Third Bank a waiver of the Company’s noncompliance with these financial covenants as of December 31, 2010.
The line of credit under the Prior Credit Agreement was scheduled to mature on July 15, 2013, and was cross-defaulted with the Term Loans discussed and defined below under Note 10, “Long-term debt”, and collateralized by substantially all business assets. As discussed above, the revolving line of credit under the Prior Credit Agreement was repaid in full on April 29, 2011 and replaced with the Line of Credit under the Harris Agreement.
F-19
Table of Contents
10. Long-term debt
Long-term debt consists of the following as of December 31, 2011 and 2010, respectively. The December 31, 2010 balances are prior to the full repayment of Term Loan A and Term Loan B (each as defined below) on April 29, 2011, using a portion of the proceeds from the Private Placement of preferred stock and warrants:
| 2011 | 2010 | |||||||
| Term Loan A |
$ | — | $ | 5,638 | ||||
| Term Loan B |
— | 2,100 | ||||||
| Notes payable |
64 | 86 | ||||||
| Capital lease obligations |
— | 78 | ||||||
|
|
|
|
|
|||||
| 64 | 7,902 | |||||||
| Less current maturities |
23 | 2,226 | ||||||
|
|
|
|
|
|||||
| Total |
$ | 41 | $ | 5,676 | ||||
|
|
|
|
|
|||||
Prior to their repayment on April 29, 2011, as discussed in Note 9, “Line of credit”, the Prior Credit Agreement provided for two term loans of $8.7 million (“Term Loan A”) and $2.4 million (“Term Loan B” and together with Term Loan A, the “Term Loans”), which Term Loans were scheduled to mature on July 15, 2013 and had variable interest rates. Under the terms of the Prior Credit Agreement, the Company had the ability to elect whether outstanding amounts under the Term Loans accrued interest based on the prime rate plus a margin or LIBOR plus a margin. Prior to its repayment in full in connection with the closing of the Reverse Recapitalization, principal payments of Term Loan A were payable in quarterly installments ranging from $0.2 million to $0.6 million over the life of the loan. Term Loan A had an outstanding balance of $5.6 million as of December 31, 2010, with an effective interest rate of 7.5% as of December 31, 2010 and at the time it was repaid. The Company recognized a loss on debt extinguishment of $0.5 million in the year ended December 31, 2011, due to the write off of the unamortized loan fees associated with the Company’s prior credit facility. Prior to its repayment in full in connection with the closing of the Reverse Recapitalization, principal payments of Term Loan B were payable in quarterly installments of less than $0.1 million over the life of the loan plus a balloon payment at maturity. Term Loan B had an outstanding balance of $2.1 million with an effective interest rate of 5.5% as of December 31, 2010, and at the time it was repaid. In addition to scheduled quarterly payments, the Prior Credit Agreement required an annual repayment equal to 60% of excess cash flow as defined under the Prior Credit Agreement.
11. Leases
The Company leases certain buildings and transportation equipment under various noncancelable operating lease agreements that contain renewal provisions. Rent expense under these leases approximated $1.7 million, $1.4 million, and $1.4 million for the years ended December 31, 2011, 2010, and 2009, respectively.
The future minimum lease payments due under operating leases by fiscal year at December 31, 2011, were as follows:
| 2012 |
$ | 1,549 | ||
| 2013 |
804 | |||
| 2014 |
51 | |||
| 2015 |
12 | |||
| 2016 |
7 | |||
|
|
|
|||
| $ | 2,423 | |||
|
|
|
On February 15, 2012, in connection with the purchase of a carousel system used in the warehousing of inventory, the Company completed the purchase of an existing carousel system that it was previously renting under an operating lease as of December 31, 2011. The combined purchase price of these two carousel systems totaled $1.1 million, of which $0.1 million was paid as a deposit in 2011 and the remaining $1.0 million is to be paid in 2012. All remaining unpaid operating lease obligations in connection with the existing carousel were eliminated as a result of the purchase. Accordingly, the future operating lease commitments reported as of December 31, 2011 and presented below have been adjusted to exclude the future minimum lease payments related to the carousel of $186,000 in 2012 and $108,000 in 2013 that would have otherwise been incurred in connection with this operating lease.
On February 28, 2012, the Company entered into a lease agreement for an additional building to be used for production, warehousing and certain selling and administrative operations. The lease began in March 2012 and has a term which expires on July 31, 2018. The lease is accounted for as an operating lease. Future minimum lease payments associated with this operating lease is as follows: $517,000 in 2012; $1,160,000 in 2013; $1,059,000 in 2014; $1,091,000 in 2015; $1,123,000 in 2016 and $1,843,000 thereafter.
F-20
Table of Contents
On March 13, 2012, the Company entered into a lease agreement to extend the lease of an existing facility which otherwise expires on July 31, 2013. Under the terms of this lease, the lease will now expire on July 31, 2018. The lease is accounted for as an operating lease. Future minimum lease payments associated with this operating lease is as follows: $549,000 in 2012; $513,000 in 2013; $468,000 in 2014; $482,000 in 2015, $497,000 in 2016 and $815,000 thereafter.
The Company’s future minimum lease payments revised to reflect the purchase of the carousel and the leases described above would be as follows:
| 2012 |
$ | 1,896 | ||
| 2013 |
2,048 | |||
| 2014 |
1,578 | |||
| 2015 |
1,585 | |||
| 2016 |
1,626 | |||
| Thereafter |
2,658 | |||
|
|
|
|||
| $ | 11,391 | |||
|
|
|
12. Defined contribution plan
The Company sponsors a retirement savings plan for employees meeting certain eligibility requirements. Participants may choose from various investment options and can contribute an amount of their eligible compensation annually as defined by the plan document, subject to Internal Revenue Code limitations. The plan is funded by participant contributions and discretionary Company contributions. The Company made no discretionary contributions during 2011, 2010 or 2009.
F-21
Table of Contents
13. Income taxes
The expense (benefit) for income taxes was as follows for the years ended December 31:
| 2011 | 2010 | 2009 | ||||||||||
| Current tax expense |
||||||||||||
| Federal |
$ | 2,816 | $ | 418 | $ | 1,152 | ||||||
| State |
827 | 107 | 197 | |||||||||
|
|
|
|
|
|
|
|||||||
| 3,643 | 525 | 1,349 | ||||||||||
|
|
|
|
|
|
|
|||||||
| Deferred tax expense (benefit) |
||||||||||||
| Federal |
(809 | ) | (112 | ) | 33 | |||||||
| State |
(61 | ) | (47 | ) | 5 | |||||||
|
|
|
|
|
|
|
|||||||
| (870 | ) | (159 | ) | 38 | ||||||||
|
|
|
|
|
|
|
|||||||
| Total tax expense |
$ | 2,773 | $ | 366 | $ | 1,387 | ||||||
|
|
|
|
|
|
|
|||||||
The reconciliation between the Company’s effective tax rate on income from continuing operations and the statutory tax rate was as follows for the years ended December 31:
| 2011 | 2010 | 2009 | ||||||||||||||||||||||
| Amount | Percent | Amount | Percent | Amount | Percent | |||||||||||||||||||
|
|
|
|
|
|
|
|
|
|
|
|
|
|||||||||||||
| Income tax expense at federal statutory rate |
$ | 2,324 | 34.0 | % | $ | 658 | 34.0 | % | $ | 1,283 | 34.0 | % | ||||||||||||
| State income tax, net of federal benefit |
506 | 7.4 | 76 | 3.9 | 133 | 3.5 | ||||||||||||||||||
| Non-deductible transaction expenses |
259 | 3.8 | — | — | — | — | ||||||||||||||||||
| Non-deductible private placement warranty expense |
130 | 1.9 | — | — | — | — | ||||||||||||||||||
| Domestic production activity |
(216 | ) | (3.1 | ) | 51 | 2.6 | — | — | ||||||||||||||||
| Research tax credits |
(240 | ) | (3.5 | ) | (260 | ) | (13.4 | ) | (180 | ) | (4.8 | ) | ||||||||||||
| Other, net |
10 | 0.1 | (159 | ) | (8.2 | ) | 151 | 4.0 | ||||||||||||||||
|
|
|
|
|
|
|
|
|
|
|
|
|
|||||||||||||
| Income tax expense |
$ | 2,773 | 40.6 | % | $ | 366 | 18.9 | % | $ | 1,387 | 36.7 | % | ||||||||||||
|
|
|
|
|
|
|
|
|
|
|
|
|
|||||||||||||
Components of the net deferred tax asset or liability consisted of the following as of December 31:
| 2011 | 2010 | |||||||
| Allowances and bad debts |
$ | 188 | $ | 295 | ||||
| Accrued warranty |
329 | 114 | ||||||
| Accrued legal fees |
124 | 13 | ||||||
| Accrued wages and benefits |
570 | 175 | ||||||
| Inventory |
484 | — | ||||||
| Deferred revenue |
81 | 49 | ||||||
| Other |
38 | 41 | ||||||
|
|
|
|
|
|||||
| Total current deferred tax assets |
1,814 | 687 | ||||||
|
|
|
|
|
|||||
| Tax depreciation in excess of book |
(490 | ) | (233 | ) | ||||
|
|
|
|
|
|||||
| Total deferred tax liabilities |
(490 | ) | (233 | ) | ||||
|
|
|
|
|
|||||
| Net deferred tax assets |
$ | 1,324 | $ | 454 | ||||
|
|
|
|
|
|||||
At December 31, 2011 and 2010, the Company did not record a deferred tax valuation allowance, as the Company believed it was more likely than not that earnings would be sufficient to realize the deferred tax assets. The Company has recorded no liability for uncertain tax positions. The Company recognizes interest and penalties related to unrecognized tax benefits in income tax expense. As of December 31, 2011, 2010 and 2009, the Company had no amounts accrued for interest or penalties.
The Company files a consolidated income tax return in the U.S. federal jurisdiction and in various states. In the normal course of business, the Company is subject to examination by taxing authorities. Because of closure of an Internal Revenue Service examination, the Company is no longer subject to U.S. federal income tax examinations for years prior to 2008. The Company believes that it is no longer subject to state income tax examinations for years prior to 2007.
F-22
Table of Contents
The Company’s effective tax rate for the year ended December 31, 2011 was 40.6% compared with 18.9% for the prior year. The Company’s effective tax rate in 2011 was higher primarily due to the non-deductibility of certain transaction costs incurred in connection with the Reverse Recapitalization and Private Placement and non-deductible expenses associated with the change in the valuation of private placement warrants. In addition, the combined corporate state income and replacement tax rate for Illinois increased from 7.3% to 9.5% which adversely impacted the Company’s effective tax rate. The Company also generates research tax credits as a result of its research & development activities which reduce the Company’s effective tax rate. In 2011, these research tax credits had less of an impact on the Company’s effective tax rate as compared to 2010 due to the increase in taxable income in 2011. In general, these credits are general business credits and may be carried forward up to 20 years to be offset against future taxable income. The Company’s effective tax rate is also favorably impacted by the domestic production activities deduction, which is a permanent deduction in the computation of taxable income.
14. Stockholders’ equity
The statement of changes in the Company’s stockholders’ equity in the year ended December 31, 2011, gives effect to the Reverse Recapitalization and related transactions, including the Reverse Split of the Company’s common stock, which is presented retroactively, and the conversion of the Company’s preferred stock to Company common stock, presented prospectively from the date of conversion, on the consolidated balance sheet and statements of operations.
The aggregate value of the shares of common stock issued and outstanding were reduced by $0.01 million, with a corresponding increase to additional paid-in capital as of December 31, 2010 associated with the retroactive adjustment for the Reverse Split. The shares of Company common stock prior to the Reverse Split were 10,000,000 shares of common stock as of December 31, 2010, and upon the Reverse Split, such shares of Company common stock automatically converted into 312,500 shares of common stock. Shares held by the former stockholders of Format, Inc., the legal acquiror in the April 29, 2011, Reverse Recapitalization, were also retroactively adjusted from 770,083 common shares (without giving effect to the Reverse Split) to 24,093 common shares (giving effect to the Reverse Split). The shares issuable upon exercise by Roth of the Roth Warrant, were 3,360,000 prior to the Reverse Split and were adjusted to 105,000 shares of common stock (giving effect to the Reverse Split). The Roth Warrant was cashlessly exercised on September 1, 2011, for, and the Company issued to Roth, 62,116 shares of common stock on a net basis. On August 26, 2011, the effective date of the Migratory Merger and Reverse Split, 113,961 shares of the Company preferred stock, representing all then-issued and outstanding shares of preferred stock, were automatically converted into 9,496,753 shares of Company common stock. Upon the consummation of the Migratory Merger and Reverse Split, each share of the Company’s preferred stock automatically converted into a number of shares of common stock equal to one-thousand dollars divided by $12.00 per share, the conversion price for the preferred stock giving effect to the adjustment resulting from the Reverse Split. Accordingly, preferred equity was eliminated and additional paid-in capital was increased by $9.7 million, while the aggregate value of the shares of common stock issued and outstanding was increased by $0.01 million.
Common stock
The Company has authorized 50,000,000 shares of common stock with a par value of $0.001 per share. At December 31, 2011, 9,064,537 shares of common stock were issued and outstanding. Each holder of a share of common stock is entitled to one vote per share held on each matter to be considered by holders of the common stock. Holders of the Company’s common stock are entitled to receive ratably, such dividends, if any, as may be declared by the Company’s board of directors. The Company’s current policy is to retain earnings for operations and growth. Upon any liquidation, dissolution or winding-up of the Company, the holders of the Company’s common stock are entitled to share ratably in all assets available for distribution, after payment of, or provision for, all liabilities and the preferences of any then outstanding shares of preferred stock. The holders of the Company’s common stock have no preemptive, subscription, redemption or conversion rights. See Series A Convertible preferred stock below for a discussion of the automatic conversion of the Company’s shares of preferred stock into shares of common stock upon consummation of the Migratory Merger and Reverse Split.
Series A Convertible preferred stock
Series A Convertible preferred stock was convertible into shares of the Company’s common stock at any time at the election of its holder subject to limitations on conversion set forth in the certificate of designation and automatically converted into shares of the Company’s common stock on August 26, 2011, the effective date of the Migratory Merger and Reverse Split. The preferred stock conversion price was $12.00 per share giving effect to the Reverse Split and was subject to adjustment for non-cash dividends, distributions, stock splits or other subdivisions
F-23
Table of Contents
or reclassifications of Company common stock. Series A Convertible preferred stock was also subject to full-ratchet anti-dilution whereby, upon the issuance (or deemed issuance) of shares of the Company’s common stock, subject to specified exceptions, the conversion price of the Company’s preferred stock would have been reduced to the effective price of its common stock so issued (or deemed to be issued). The Company preferred stock did not have a stated maturity date and upon the occurrence of liquidation, dissolution or winding up of the Company each holder of preferred stock would have been entitled to be paid before any distribution or payment was made upon the Company’s common stock. The Company preferred stock could only have been converted to shares of its common stock and was not redeemable for cash upon the occurrence of any other events. The Company preferred stock was not within the scope of ASC 480, Distinguishing Liabilities from Equity, as the preferred stock was not a mandatorily redeemable financial instrument; it did not embody an obligation to repurchase the Company’s equity shares by transferring assets; and it did not embody an unconditional obligation to issue a variable number of the Company’s equity shares. Accordingly, the Company’s preferred stock did not meet the conditions in paragraph 2 of ASC 480-10-S99-3A (as interpreted in paragraph 3f) that would require temporary equity classification. Therefore, the preferred stock was classified as permanent equity on the Company’s balance sheet.
The allocation of the $18.0 million Private Placement proceeds to Company preferred stock and Private Placement Warrants is described below. The respective values of the preferred stock and warrants issued in the Private Placement were separately estimated and applied to these respective securities for purposes of applying the appropriate accounting guidance to each security. The value assigned to the shares of preferred stock was computed on an “as-if” converted basis and derived through an estimation of the fair value of the Company’s common stock as of April 29, 2011, the date upon which the Reverse Recapitalization and Private Placement occurred and represented the residual amount of the $18.0 million Private Placement proceeds after determining the value of the Private Placement Warrants as discussed further under Private placement warrants. The Company estimated the fair value of its common stock using the “Backsolve Method,” as described in the current working draft of the American Institute of Certified Public Accountants practice aid Valuation of Privately Held Company Equity Securities Issued as Compensation. The Backsolve Method, a form of the market approach to valuation, derives the implied equity value for one type of equity security (e.g. common equity) from a contemporaneous transaction involving another type of equity security (e.g., preferred stock). In this case, the Company solved for the common equity value ($10.08 per share as adjusted for the Reverse Split) in an option pricing model such that the aggregate value of the securities issued in the Private Placement, considering both the Company’s preferred stock component and Private Placement Warrants component, equaled $18.0 million. That is, $10.08 per common share multiplied by 1,500,009 shares of the Company’s common stock issuable upon conversion of the shares of the Company’s preferred stock issued in the Private Placement (as adjusted for the Reverse Split, as-if converted basis) plus $3.85 per warrant multiplied by 750,002 shares of the Company’s common stock issuable upon exercise of the Private Placement Warrants (as adjusted for the Reverse Split) equals $18.0 million. Accordingly, the value assigned to the Company preferred stock was $15.1 million of the $18.0 million gross proceeds received in the Private Placement. After reflecting the costs associated with the Reverse Recapitalization and allocation of the transaction costs associated with the Private Placement, as described below under Transaction costs, the value of the Company’s preferred equity was $9.7 million immediately prior to its elimination upon the automatic conversion of the shares of preferred stock to shares of common stock on August 26, 2011, the effective date of the Migratory Merger and Reverse Split.
Immediately following the effectiveness of the Reverse Split, each issued and outstanding share of the Company’s preferred stock automatically converted into a number of shares of the Company’s common stock equal to $1,000 divided by $12.00 per share, the conversion price for the preferred stock giving effect to the adjustment resulting from the Reverse Split. At issuance, no portion of the proceeds of the Company preferred stock was assigned to the conversion feature as a separate derivative instrument under ASC 815-15-25-1 because the economic characteristics and risks of the conversion option were clearly and closely related to those characteristics of the Company’s preferred stock as further discussed below.
The accounting for the embedded conversion option of the Company’s preferred stock was determined by ASC 815-15-25-1, which required that an embedded derivative be separated from the host contract (i.e., the Company’s preferred stock in this case) and accounted for as a derivative instrument if all of the following criteria were met: (a) the economic characteristics and risks of the embedded derivative were not clearly and closely related to the economic characteristics and risks of the host contract; (b) the hybrid instrument (i.e., the Company preferred stock and its embedded conversion option) was not remeasured at fair value under otherwise applicable generally accepted accounting principles with changes in fair value reported in earnings as they occur; and (c) a separate instrument with the same terms as the embedded derivative would, pursuant to ASC 815-10-15, be a derivative instrument subject to the requirements of ASC 815-15-25-1.
F-24
Table of Contents
The host contract (i.e. the Company preferred stock), absent the conversion option, did not provide the holders with principal protection, and it encompassed a residual interest in the Company. Therefore, the host contract was more analogous to equity. The conversion option enabled the holders to convert the preferred stock into shares of Company common stock, subject to certain adjustments and limitations on conversion. Since the host contract was an equity host and the conversion option was to convert the preferred stock into Company common stock and both possessed principally equity characteristics related to the same entity, the economic characteristics and risks of the conversion option were clearly and closely related to those of the Company preferred stock host contract. Therefore, the requirements in paragraph ASC 815-15-25-1(a) were not met. Accordingly, the embedded conversion option was not required to be separately classified and accounted for apart from the Company preferred stock.
Private placement warrants
For every share of Company common stock issuable upon conversion of preferred stock purchased in the Private Placement, each investor in the Private Placement also received a Private Placement Warrant to purchase one-half of a share of the Company’s common stock, at an exercise price of $13.00 per share as adjusted for the Reverse Split, subject to further adjustment for non-cash dividends, distributions, stock splits or other reorganizations or reclassifications of the Company’s common stock. These warrants represent the right to purchase a total of 750,002 shares of the Company’s common stock. The Private Placement Warrants are also subject to full ratchet anti-dilution whereby, upon the issuance (or deemed issuance) of shares of the Company’s common stock at a price below the then-current exercise price of the Private Placement Warrants, subject to specified exceptions, the exercise price of the Private Placement Warrants shall be reduced to the effective price of the Company’s common stock so issued (or deemed to be issued). The Private Placement Warrants will expire on April 29, 2016.
At any time beginning six months after the closing of the Private Placement at which the Company is required to register the shares issuable upon exercise of the Private Placement Warrants pursuant to the registration rights agreement entered into in connection with the Private Placement, but such shares may not be freely sold to the public, the Private Placement Warrants may be “cashlessly” exercised by their holders. In such circumstances, the warrant holders may “cashlessly” exercise the Private Placement Warrants by causing the Company to withhold a number of shares of its common stock otherwise issuable upon such exercise having a value, based upon the market price of the Company’s common stock (such market price as defined in the purchase agreement for the Private Placement), equal to the aggregate exercise price associated with such exercise. In other words, in such circumstances, the exercise of the Private Placement Warrants will occur without any cash being paid by the holders of the Private Placement Warrants. Because the shares issuable upon exercise of the Private Placement Warrants are currently available for resale pursuant to effective registration statements filed by the Company with the SEC, the Private Placement Warrants may not be “cashlessly” exercised at this time. The Private Placement Warrants further include a requirement that, from and after the effective date of the Reverse Split, the Company will keep reserved out of the authorized and unissued shares of its common stock sufficient shares to provide for the exercise of the Private Placement Warrants.
Also, pursuant to the purchase agreement for the Private Placement, additional shares of the Company’s common stock and additional warrants may be issued to the investors in the Private Placement in the event that the Company issues securities in one or a series of related offerings at an effective price per share of its common stock at or below an effective price per share of $12.00 as adjusted for the Reverse Split, subject to further adjustment for stock splits, stock dividends or other reclassifications or combinations of the Company’s common stock. See Series A Convertible preferred stock above for a detailed description of this provision.
The Company’s Private Placement Warrants are accounted for as a liability, in accordance with ASC 480-10-25-14, Distinguishing Liabilities from Equity. ASC 480-10-25-14 states that an entity which must or could settle an instrument by issuing a variable number of its own shares, and, as in this case, if the obligation’s monetary value is based solely or predominantly on variations in the fair value of the company’s equity shares, but moves in the opposite direction, then the obligation to issue shares is to be recorded as a liability at inception of the arrangement, and is adjusted with subsequent changes in the fair value of the underlying stock. The effect of the change in value of the obligation is reflected as “Other (income) expense” in the Company’s consolidated statement of operations.
The Private Placement Warrants issued with the 18,000 shares of the Company’s preferred stock had an estimated fair value of $2,887,000 at the closing of the Reverse Recapitalization transaction and the Private Placement on April 29, 2011, determined based upon an agreed-upon exercise price of the Private Placement Warrants; the purchase price for (value of) the Company’s preferred stock and Private Placement Warrants, in the aggregate as agreed upon with the investors in the Private Placement; and assessment of an appropriate risk-free interest rate of 2.1%, an anticipated volatility factor of 50.0%, and a zero percent dividend yield, all incorporated
F-25
Table of Contents
into a valuation using the Black-Scholes option pricing model. The Company determined that the five-year Treasury Bond yield was a reasonable assumption for a risk-free rate, and that an appropriate volatility rate would represent the upper end of the range of implied volatility of publicly traded call options of benchmark companies, which reflects the mid-range of their historical volatility. The Company’s past history of not paying dividends and management’s intentions to continue such a dividend policy resulted in a zero dividend yield assumption. The five-year term of the Private Placement Warrants, the stated warrant exercise price of $13.00 per share as adjusted for the Reverse Split, when the Private Placement Warrants became exercisable, and the Company’s common stock valuation of $10.08 per share as adjusted for the Reverse Split, when the Private Placement Warrants became exercisable, comprise the balance of the inputs into the Black-Scholes pricing model for the warrant valuation. See Note 8, “Fair value of financial instruments”, for further detail describing the valuation approach for the Private Placement Warrants as of December 31, 2011.
Roth Warrant
The Company issued to Roth, the Roth Warrant to purchase shares of the Company’s common stock, as compensation for its role as placement agent in connection with the Private Placement. Prior to its exercise in full on September 1, 2011, as described below, the Roth Warrant represented the right to purchase an aggregate of 105,000 shares of the Company’s common stock, at an exercise price of $13.20 per share, subject to further adjustment for non-cash dividends, distributions, stock splits, or other reorganizations or reclassifications of the Company’s common stock. This warrant did not contain and was not subject to, price-based anti-dilution provisions. The Roth Warrant was subject to expire on April 29, 2016. At any time following the effectiveness of the Reverse Split, the warrant could have been “cashlessly” exercised by its holder by causing the Company to withhold a number of shares of its common stock otherwise issuable upon such exercise having a value, based upon the market price of Company common stock (such market price as defined in that Roth Warrant document), equal to the aggregate exercise price associated with such exercise. In other words, in such circumstances, the exercise of the warrant would occur without any cash being paid by the holder of the warrant to the Company. This warrant included a requirement that the Company reserve a sufficient number of shares of its common stock solely for the purpose of effecting the exercise of this warrant into shares of the Company’s common stock pursuant to the terms (and subject to the limitations) thereof.
The estimated fair value of the Roth Warrant of $0.4 million as of the consummation of the Private Placement on April 29, 2011 was determined using the same assumptions used to value the Private Placement Warrants described above, and by using the same inputs, but for its specific exercise price of $13.20 per share as adjusted for the Reverse Split. The Roth Warrant was classified as equity and was recorded as an adjustment between the Roth Warrant and the Company’s preferred stock equity. Unlike the Private Placement Warrants, the Roth Warrant did not contain, and was not otherwise subject to, any price-based anti-dilution provisions and could only be settled by the Company with a fixed number of shares of the Company’s common stock (subject to customary adjustments for non-cash dividends, distributions, stock splits or other reorganizations or reclassifications of the Company’s common stock). Under ASC 815-40-25, this lack of price-based anti-dilution provisions was the distinctive attribute as compared to the warrants issued in the Private Placement that required the Roth Warrant to be classified as equity on the Company’s consolidated balance sheet. The valuation of the Company’s preferred stock, common stock and warrants employed the Black-Scholes option pricing model and incorporated the purchase price of the Company’s preferred stock and related warrants issued to investors in the Private Placement, including the warrant issued to Roth, and the Company’s assessment relative to the interest rate, volatility factor, and other inputs utilized in the model. The warrant issued to Roth represented compensation for its services in its capacity as placement agent for the Private Placement, and the warrant’s $0.4 million estimated fair value ($3.80 per share of common stock issuable upon exercise of this warrant as adjusted for the Reverse Split) was recorded as a reduction of capital from the preferred stock issuance.
In accordance with its terms, on September 1, 2011, Roth “cashlessly” exercised, in full, the Roth Warrant, receiving 62,116 shares of the Company’s common stock on a net basis, with 42,884 of the 105,000 warrant shares issuable upon exercise thereof withheld by the Company in lieu of payment by Roth to the Company of an amount in cash equal to the aggregated exercise price thereof, in accordance with the provisions of the Roth Warrant.
Stock purchase agreement with management stockholder
The Company and Gary S. Winemaster, the Company’s Chief Executive Officer and President, and Chairman of the Board of Directors of the Company, entered into a Stock Purchase Agreement (“Stock Purchase Agreement”), pursuant to which, on October 31, 2011, the Company purchased from Mr. Winemaster 830,925 shares of Company common stock for $4.25 million, or $5.11 per share. These shares were returned to the Company’s treasury as authorized and issued, but not outstanding, shares of common stock of the Company.
F-26
Table of Contents
Transaction costs
The transaction costs incurred in connection with the Reverse Recapitalization and the Private Placement consist of cash costs of approximately $5.7 million, and the issuance to Roth, as placement agent for the Private Placement, of the Roth Warrant (with an estimated fair value of approximately $0.4 million). The cash costs consist of fees to the placement agent in the Private Placement, legal and accounting fees, consulting fees, fees for the repurchase of shares of Format stock from the former sole director and executive officer of Format and termination of his interest in and obligations owed by Format to him, and other expenses associated with the Reverse Recapitalization and Private Placement transactions. The cash transaction costs were required to be allocated between equity (approximately $4.9 million) for the costs allocated to the Company’s preferred stock, plus subsequent registration costs of the Company’s common stock, and operating results (approximately $0.8 million) for the costs allocated to the Private Placement Warrants in accordance with ASC 825, Financial Instruments.
Costs for filing registration statements with the SEC covering the resale of shares of common stock issued upon conversion of shares of preferred stock and exercise of the Roth Warrant and issuable upon exercise of the Private Placement Warrants totaled approximately $0.6 million as of December 31, 2011, and were recorded as a reduction of additional paid-in capital, as the Company was obligated to register all such shares of the Company’s common stock pursuant to the terms of the purchase agreement for the Private Placement.
Shares reserved for specific purposes
As of December 31, 2011, 750,002 shares of Company common stock remained reserved for the exercise of the Private Placement Warrants, in accordance with the terms of the purchase agreement for the Private Placement. Contingently issuable shares, as described below, will be reserved when the conditions for their issuance have been met.
Contingently issuable securities
Pursuant to the purchase agreement for the Private Placement, additional shares of the Company’s common stock and additional warrants may be issued to the investors in the Private Placement in the event that the Company issues securities in one or a series of related offerings at an effective price per share of its common stock at or below an effective price per share of $12.00 as adjusted for the Reverse Split, subject to further adjustment for stock splits, stock dividends or other reclassifications or combinations of the Company’s common stock. See Series A Convertible preferred stock above for a detailed description of this provision. The conditions under which such issuance may occur have not yet occurred as of December 31, 2011, nor are they reasonably certain to occur as of the date of issuance of the consolidated financial statements presented herein.
Registration rights agreement
In connection with the Private Placement, the Company entered into a Registration Rights Agreement (the “Registration Rights Agreement”) with the investors in the Private Placement and Roth Capital Partners, LLC, pursuant to which it agreed to file a registration statement on Form S-1, with the SEC, covering the resale of “Registrable Securities” (as defined below) (which includes the shares of the Company’s common stock that were issuable upon conversion of shares of the Company’s preferred stock originally issued in the Private Placement and shares of the Company’s common stock issuable upon exercise of the warrants originally issued in the Private Placement and shares of the Company’s common stock that were issuable upon exercise of the Roth Warrant), on or before the date which is 30 days after the closing date of the Private Placement, and to use its commercially reasonable efforts to have such registration statement declared effective by the SEC as soon as practicable. The Company further agreed, within 30 days after it becomes eligible to use a registration statement on Form S-3 to register the Registrable Securities for resale, to file a registration statement on Form S-3 covering the Registrable Securities. Pursuant to the Private Placement Registration Rights Agreement, the holders of Registrable Securities are also entitled to certain piggyback registration rights. “Registrable Securities,” as contemplated by the Private Placement Registration Rights Agreement, means certain shares of the Company’s common stock, including those shares that were issuable upon conversion of shares of Company preferred stock issued in the Private Placement and shares of the Company’s common stock issuable upon exercise of the warrants issued with the Company preferred stock in the Private Placement and the shares of the Company’s common stock that were issuable upon exercise of the Roth Warrant; provided, that, any such share shall cease to be a Registrable Security upon (A) sale pursuant to the registration statement or Rule 144 under the Securities Act, (B) such share becoming eligible for sale without
F-27
Table of Contents
restriction by the selling securityholder holding such security pursuant to Rule 144 under the Securities Act or (C) such share otherwise becoming eligible for sale without restriction pursuant to Section 4(1) of the Securities Act, provided that, any restrictive legend on any certificate or other instrument representing such shares has been removed or there has been delivered to the transfer agent for such shares irrevocable documentation (including any necessary legal opinion) to the effect that, upon submission by the applicable selling securityholder of the certificate or instrument representing such security, any such restrictive legend shall be removed.
The Company is also obligated to maintain the effectiveness of the registration statement until the earliest of (1) the first date on which all Registrable Securities covered by such registration statement have been sold, (2) the first date on which all Registrable Securities covered by such registration statement may be sold without restriction pursuant to Rule 144 or (3) the first date on which none of the securities included in the registration statement constitute Registrable Securities.
In addition, at any time beginning six months after the closing of the Private Placement at which the Company was required to register the shares issuable upon exercise of the warrants issued in the Private Placement, but such shares may not be freely sold to the public, the warrants may be “cashlessly” exercised by the holders thereof. In such circumstances, the warrant holders may “cashlessly” exercise the warrants by causing the Company to withhold a number of shares of its common stock otherwise issuable upon such exercise having a value, based upon the market price (such market price as defined in the purchase agreement for the Private Placement) of the Company’s common stock, equal to the aggregate exercise price associated with such exercise. In other words, in such circumstances, the exercise of the Private Placement Warrants will occur without any cash being paid by the holders of the Private Placement Warrants to the Company. Because the shares issuable upon exercise of the Private Placement Warrants are currently available for resale pursuant to effective registration statements filed by the Company with the SEC, the Private Placement Warrants may not be “cashlessly” exercised at this time. The Roth Warrant contained a similar cashless exercise feature, except that the Roth Warrant was not “cashlessly” exercisable by its holder prior to the effectiveness of the Reverse Split.
In connection with the consummation of the Reverse Recapitalization, the Company also entered into a registration rights agreement with the former stockholders of The W Group, pursuant to which it agreed to provide to such persons certain piggyback registration rights with respect to shares of the Company’s capital stock, including shares issuable upon exercise, conversion or exchange of securities, held by such persons at any time on or after the closing of the Reverse Recapitalization. The piggyback registration rights under this Registration Rights Agreement are subject to customary cutbacks and are junior to the piggyback registration rights granted to investors in the Private Placement and to Roth pursuant to the Registration Rights Agreement entered into in connection with the Private Placement.
The Company had a commitment to file a registration statement with the SEC as described above. If a registration statement was not filed with the SEC on or prior to the date which was 30 days after the closing date of the Private Placement, or if (1) a registration statement covering the Registrable Securities was not declared effective by the SEC prior to the earlier of (A) five business days after the SEC informed the Company that no review of such registration statement would be made or that the SEC had no further comments on such registration statement, or (B) the 120th day after the closing of the Private Placement, or (2) after a registration statement had been declared effective by the SEC, sales could not be made pursuant to such registration statement for any reason, but excluding any period for which the use of any prospectus included in a registration statement has been suspended if and so long as certain conditions exist (which period may not be for more than 20 consecutive days or for a total of more than 45 days in any 12-month period), then the Company would have been required to pay amounts representing liquidated damages to each of the investors. Specifically, in any such case the Company would have been required to pay each investor 1.5% of the aggregate amount invested by such investor for each 30-day period (or pro rata for any portion thereof) following the date by which such registration statement should have been filed with the SEC or been declared effective, or was unavailable, as applicable. Thus, liquidated damages to investors could have amounted to approximately $0.3 million every 30 days. The terms of the Registration Rights Agreement did not specify a maximum potential amount of liquidated damages and settlement alternatives were not provided. As the payment of liquidated damages did not appear probable at inception of the Private Placement, and remained so as of the date that any subsequent financial statements were issued, the Company did not record any contingent liability as an allocation of the gross proceeds from the Private Placement, nor subsequently, as an expense in accordance with ASC 450-20, Loss Contingencies. A registration statement covering the Registrable Securities was declared effective on August 26, 2011 by the SEC, which resolved the contingency regarding the registration statement being declared effective.
F-28
Table of Contents
15. Commitments and contingencies
The Registration Rights Agreement provided that the initial registration statement that the Company filed to cover Registrable Securities need not cover the shares of the Company’s common stock that were not issuable upon conversion of the Company’s preferred stock or exercise of the warrants issued in the Private Placement and to Roth Capital Partners prior to the Reverse Split if the Company was to determine (upon advice of counsel), or was to be advised by the SEC, that those shares may not be covered by that initial registration statement. Accordingly, the initial registration statement only covered the shares that were issuable upon conversion of the preferred stock prior to the Reverse Split (in other words, the shares that were issuable upon conversion of the preferred stock giving effect to the pre-Reverse Split limitation on conversion) and did not cover any of the shares issuable upon exercise of the warrants issued in the Private Placement or any of the shares that were issuable upon exercise of the warrants issued to Roth. Under the Registration Rights Agreement, upon the date which was two days after the Company’s stockholders approved the Migratory Merger and the Reverse Split, the Company was obligated to file a registration statement covering all of the remaining shares that were issuable upon conversion of the preferred stock and all of the shares issuable upon exercise of the warrants issued in the Private Placement and all of the shares that were issuable upon exercise of the warrants issued to Roth. The Registration Rights Agreement provided that if a registration statement covering those initial shares was not filed with the SEC on or prior to the date which was five business days after the date which was two business days after the Company’s stockholders approved the Migratory Merger and the Reverse Split or if (1) a registration statement covering those additional shares was not declared effective by the SEC prior to the earlier of (A) five business days after the SEC informed the Company that no review of such registration statement would be made or that the SEC had no further comments on such registration statement, or (B) the 120th day after the deadline for the Company’s filing of that registration statement, or (2) after such registration statement has been declared effective by the SEC, sales cannot be made pursuant to such registration statement for any reason, but excluding any period for which the use of any prospectus included in a registration statement has been suspended if and so long as certain conditions exist (which period may not be for more than 20 consecutive days or for a total of more than 45 days in any 12-month period), then the Company is required to pay amounts representing liquidated damages to each of the investors, on the same basis as the liquidated damages the Company could have been required to pay in connection with the initial registration statement. A registration statement covering the remaining Registrable Securities was declared effective on September 13, 2011 by the SEC, which resolved the contingency regarding the registration statement being declared effective.
The Company is involved in various legal proceedings arising in the normal course of doing business. The Company is required to record a provision for a liability when it is both probable that a liability has been incurred and the amount of the loss can be reasonably estimated; however, the resolution of the legal proceedings in which the Company is involved, either individually or in the aggregate, is not expected to have a material effect on the Company’s consolidated results of operations, financial condition or cash flows based upon a review of information currently available to the Company regarding the potential impact of negotiations, settlements, rulings, advice of legal counsel and other information and events pertaining to any particular case.
F-29
Table of Contents
EXHIBITS
INDEX TO EXHIBITS
| Exhibit Number |
Exhibit Description | |
| 2.1 | Agreement and Plan of Merger between Format, Inc., PSI Merger Sub, Inc. and The W Group, Inc. (incorporated by reference from Exhibit 2.1 to the registrant’s Current Report on Form 8-K, dated April 29, 2011, filed with the Commission May 5, 2011).† | |
| 3.1 | Certificate of Designation of Series A Convertible Preferred Stock of Power Solutions International, Inc. (f/k/a Format, Inc.) (incorporated by reference from Exhibit 3.1 to the registrant’s Current Report on Form 8-K, dated April 29, 2011, filed with the Commission May 5, 2011). | |
| 3.2 | Amended and Restated Bylaws of Power Solutions International, Inc. (f/k/a Format, Inc.) adopted April 29, 2011 (incorporated by reference from Exhibit 3.2 to the registrant’s Current Report on Form 8-K, dated April 29, 2011, filed with the Commission May 5, 2011). | |
| 3.3 | Articles of Incorporation of Power Solutions International, Inc. (f/k/a Format, Inc.), originally filed with the Secretary of State of the State of Nevada on March 21, 2011, including the Articles of Merger originally filed with the Secretary of State of the State of Nevada on April 29, 2011 and the Certificate of Designation of Series A Convertible Preferred Stock of Power Solutions International, Inc. originally filed with the Secretary of State of the State of Nevada on April 29, 2011 (incorporated by reference from Exhibit 3.3 to Amendment No. 2 to the registrant’s Registration Statement on Form S-1, Registration No. 333-174543, filed August 19, 2011). | |
| 3.4 | Certificate of Incorporation of Power Solutions International, Inc., a Delaware corporation, originally filed with the Secretary of State of the State of Delaware on August 12, 2011 (incorporated by reference from Exhibit 3.4 to Amendment No. 2 to the registrant’s Registration Statement on Form S-1, Registration No. 333-174543, filed August 19, 2011). | |
| 3.5 | Bylaws of Power Solutions International, Inc., a Delaware corporation, adopted August 12, 2011 (incorporated by reference from Exhibit 3.5 to Amendment No. 2 to the registrant’s Registration Statement on Form S-1, Registration No. 333-174543, filed August 19, 2011). | |
| 10.1 | Stock Repurchase and Debt Satisfaction Agreement, dated as of April 29, 2011, between Format, Inc. and Ryan Neely and Michelle Neely (incorporated by reference from Exhibit 10.1 to the registrant’s Current Report on Form 8-K, dated April 29, 2011, filed with the Commission May 5, 2011). | |
| 10.2 | Termination Agreement, dated as of April 28, 2011, between The W Group, Inc. and Thomas Somodi, including the Purchase and Sale Agreement, dated as of April 28, 2011, between Gary Winemaster and Thomas Somodi referenced therein (incorporated by reference from Exhibit 10.2 to the registrant’s Current Report on Form 8-K, dated April 29, 2011, filed with the Commission May 5, 2011). | |
| 10.3 | Employment Agreement, dated as of April 29, 2011, between Power Solutions International, Inc. and Thomas Somodi (incorporated by reference from Exhibit 10.3 to the registrant’s Current Report on Form 8-K, dated April 29, 2011, filed with the Commission August 1, 2011). | |
| 10.4 | Purchase Agreement, dated April 29, 2011, among Format, Inc. and the investors in the private placement (incorporated by reference from Exhibit 10.4 to Amendment No. 3 to the registrant’s Current Report on Form 8-K, dated April 29, 2011, filed with the Commission May 5, 2011). | |
69
Table of Contents
| 10.5 | Form of Voting Agreement, dated April 29, 2011, between Power Solutions International, Inc. and each of Gary Winemaster, Kenneth Winemaster, Thomas Somodi and Kenneth Landini (incorporated by reference from Exhibit 10.5 to the registrant’s Current Report on Form 8-K, dated April 29, 2011, filed with the Commission May 5, 2011). | |
| 10.6 | Form of Warrant, dated April 29, 2011, issued by Power Solutions International, Inc. to the investors in the private placement (incorporated by reference from Exhibit 10.6 to the registrant’s Current Report on Form 8-K, dated April 29, 2011, filed with the Commission May 5, 2011). | |
| 10.7 | Warrant, dated April 29, 2011, issued by Power Solutions International, Inc. to ROTH Capital Partners, LLC (incorporated by reference from Exhibit 10.7 to the registrant’s Current Report on Form 8-K, dated April 29, 2011, filed with the Commission May 5, 2011). | |
| 10.8 | Form of Lock-Up Agreement entered into by each of Gary Winemaster, Kenneth Winemaster, Thomas Somodi and Kenneth Landini (incorporated by reference from Exhibit 10.8 to the registrant’s Current Report on Form 8-K, dated April 29, 2011, filed with the Commission May 5, 2011). | |
| 10.9 | Registration Rights Agreement, dated as of April 29, 2011, among Power Solutions International, Inc., the investors in the private placement and ROTH Capital Partners, LLC (incorporated by reference from Exhibit 10.9 to the registrant’s Current Report on Form 8-K, dated April 29, 2011, filed with the Commission May 5, 2011). | |
| 10.10 | Registration Rights Agreement, dated as of April 29, 2011, among Power Solutions International, Inc. and Gary Winemaster, Kenneth Winemaster and Thomas Somodi (incorporated by reference from Exhibit 10.10 to the registrant’s Current Report on Form 8-K, as amended, dated April 29, 2011). | |
| 10.11 | Loan and Security Agreement, dated as of April 29, 2011, by and among Harris N.A., as agent for itself and other lenders party thereto, each of the lenders party thereto, Power Solutions International, Inc., The W Group, Inc., Power Solutions, Inc., Power Great Lakes, Inc., Auto Manufacturing, Inc., Torque Power Source Parts, Inc., Power Properties, L.L.C., Power Production, Inc., Power Global Solutions, Inc., PSI International, LLC and XISync LLC, and related documents (incorporated by reference from Exhibit 10.11 to Amendment No. 3 to the registrant’s Current Report on Form 8-K, dated April 29, 2011, filed with the Commission August 1, 2011). †† | |
| 10.12 | Supply Agreement, dated December 11, 2007, by and between PSI International, LLC and Doosan Infracore Co., Ltd., as amended (incorporated by reference from Exhibit 10.12 to Amendment No. 4 to the registrant’s Current Report on Form 8-K, dated April 29, 2011, filed with the Commission August 12, 2011).†† | |
| 10.13 | Distribution Agreement for Perkins Products, dated January 1, 2004, by and between Perkins Engines Inc. and Power Great Lakes, Inc., as amended (incorporated by reference from Exhibit 10.13 to Amendment No. 3 to the registrant’s Current Report on Form 8-K, dated April 29, 2011, filed with the Commission August 1, 2011). | |
| 10.14 | Consent and Waiver Agreement, dated January 20, 2011, by and among Fifth Third Bank, in its individual capacity and as agent for itself and other lenders party thereto, each of the lenders party thereto, The W Group, Inc., Power Solutions, Inc., Power Great Lakes, Inc., Auto Manufacturing, Inc., Torque Power Source Parts, Inc., Power Properties, L.L.C., Power Production, Inc., Power Global Solutions, Inc., PSI International, LLC and XISync LLC (incorporated by reference from Exhibit 10.14 to Amendment No. 1 to the registrant’s Registration Statement on Form S-1, Registration No. 333-174543, filed July 26, 2011). | |
70
Table of Contents
| 10.15 | Industrial Lease Agreement, dated as of June 30, 2011, by and between Power Great Lakes, Inc. and Centerpoint Properties Trust (incorporated by reference from Exhibit 10.12 to the Company’s Quarterly Report on Form 10-Q for the quarter ended June 30, 2011, filed August 15, 2011). | |
| 10.16 | Industrial Space Lease Agreement, dated as of January 11, 2011, by and between Power Great Lakes, Inc. and Dickal 770 L.L.C. (incorporated by reference from Exhibit 10.16 to Amendment No. 2 to the registrant’s Registration Statement on Form S-1, Registration No. 333-174543, filed August 19, 2011). | |
| 10.17 | Lease Agreement, dated as of August 28, 2006, as amended, by and between Power Great Lakes, Inc. and AMB Partners II Local, L.P. (incorporated by reference from Exhibit 10.17 to Amendment No. 2 to the registrant’s Registration Statement on Form S-1, Registration No. 333-174543, filed August 19, 2011). | |
| 10.18 | Lease Agreement, dated as of July 20, 2004, as amended, by and between Power Great Lakes, Inc. and Gateway Jefferson, Inc. (incorporated by reference from Exhibit 10.18 to Amendment No. 2 to the registrant’s Registration Statement on Form S-1, Registration No. 333- 174543, filed August 19, 2011). | |
| 10.19 | Stock Purchase Agreement, dated as of October 31, 2011, between Power Solutions International, Inc. and Gary S. Winemaster (incorporated by reference from Exhibit 10.1 to the registrant’s Current Report on Form 8-K, dated October 31, 2011, filed with the Commission November 4, 2011). | |
| 10.20 | Industrial Building Lease, dated as of February 28, 2012, between Power Great Lakes, Inc. and Centerpoint Properties Trust (incorporated by reference from Exhibit 10.1 to the registrant’s Current Report on Form 8-K, dated February 28, 2012, filed with the Commission March 2, 2012). | |
| 10.21 | Industrial Building Lease, dated as of March 13, 2012, between Power Great Lakes, Inc. and Centerpoint Properties Trust (incorporated by reference from Exhibit 10.1 to the registrant’s Current Report on Form 8-K, dated March 13, 2012, filed with the Commission March 16, 2012). | |
| 10.22 | Amendment No. 1, dated as of March 20, 2012, to Loan and Security Agreement, dated as of April 29, 2011, by and among BMO Harris Bank N.A., as agent for itself and other lenders party thereto, each of the lenders party thereto, Power Solutions International, Inc., The W Group, Inc., Power Solutions, Inc., Power Great Lakes, Inc., Auto Manufacturing, Inc., Torque Power Source Parts, Inc., Power Properties, L.L.C., Power Production, Inc., Power Global Solutions, Inc., PSI International, LLC and XISync, LLC, and related documents (incorporated by reference from Exhibit 10.1 to the registrant’s Current Report on Form 8-K, dated March 20, 2012, filed with the Commission March 23, 2012). †† | |
| 21.1 | Subsidiaries of Power Solutions International, Inc. | |
| 31.1 | Certification of Chief Executive Officer pursuant to Exchange Act Rule 13a-14(a) | |
| 31.2 | Certification of Chief Financial Officer pursuant to Exchange Act Rule 13a-14(a) | |
| 32.1 | Certification of Chief Executive Officer pursuant to Section 906 of the Sarbanes Oxley Act of 2002. | |
| 32.2 | Certification of Chief Financial Officer pursuant to Section 906 of the Sarbanes Oxley Act of 2002. | |
| 101.INS* | XBRL Instance Document. | |
| 101.SCH* | XBRL Taxonomy Extension Schema Document. | |
71
Table of Contents
| 101.CAL* | XBRL Taxonomy Extension Calculation Linkbase Document. | |
| 101.LAB* | XBRL Taxonomy Extension Labels Linkbase Document. | |
| 101.PRE* | XBRL Taxonomy Extension Presentation Linkbase Document. | |
| 101.DEF* | XBRL Taxonomy Definition Linkbase Document. | |
| * | Pursuant to Rule 406T of Regulation S-T, the XBRL-related information in Exhibit 101 to this Annual Report on Form 10-K shall be deemed “furnished” and not “filed.” | |
| † | Exhibits and schedules omitted pursuant to Item 601(b)(2) of Regulation S-K. The registrant agrees to furnish a supplemental copy of an omitted exhibit or schedule to the SEC upon request. | |
| †† | Confidential treatment has been requested with respect to certain portions of this exhibit. Omitted portions have been separately filed with the Securities and Exchange Commission. | |
72
Table of Contents
SIGNATURES
Pursuant to the requirements of Section 13 or 15(d) of the Securities Exchange Act of 1934, the registrant has duly caused this Report to be signed on its behalf by the undersigned, thereunto duly authorized, on the 30th day of March 2012.
| POWER SOLUTIONS INTERNATIONAL, INC. | ||
| By: |
/S/ THOMAS J. SOMODI | |
| Thomas J. Somodi | ||
| Chief Operating Officer and Chief Financial Officer (Principal Financial and Accounting Officer) | ||
Pursuant to the requirements of the Securities Exchange Act of 1934, this Report has been signed below by the following persons on behalf of the Registrant and in the capacities indicated on the 30th day of March 2012.
| Signature | Titles | |
| /S/ GARY S. WINEMASTER | Chief Executive Officer (principal executive officer), | |
| Gary S. Winemaster | President and Director | |
| /S/ THOMAS J. SOMODI | Chief Operating Officer and Chief Financial Officer | |
| Thomas J. Somodi | (principal financial and accounting officer) | |
| /S/ KENNETH W. LANDINI | Director | |
| Kenneth W. Landini | ||
| /S/ H. SAMUEL GREENAWALT | Director | |
| H. Samuel Greenawalt | ||
| /S/ JAY J. HANSEN | Director | |
| Jay J. Hansen | ||
| /S/ MARY E. VOGT | Director | |
| Mary E. Vogt | ||
* * *
73