Attached files
| file | filename |
|---|---|
| EX-4.1 - EX-4.1 - Rouse Properties, LLC | a2208496zex-4_1.htm |
| EX-32.2 - EX-32.2 - Rouse Properties, LLC | a2208496zex-32_2.htm |
| EX-23.1 - EX-23.1 - Rouse Properties, LLC | a2208496zex-23_1.htm |
| EX-21.1 - EX-21.1 - Rouse Properties, LLC | a2208496zex-21_1.htm |
| EX-31.1 - EX-31.1 - Rouse Properties, LLC | a2208496zex-31_1.htm |
| EX-31.2 - EX-31.2 - Rouse Properties, LLC | a2208496zex-31_2.htm |
| EX-10.8 - EX-10.8 - Rouse Properties, LLC | a2208496zex-10_8.htm |
| EX-10.9 - EX-10.9 - Rouse Properties, LLC | a2208496zex-10_9.htm |
| EX-10.14 - EX-10.14 - Rouse Properties, LLC | a2208496zex-10_14.htm |
| EX-10.10 - EX-10.10 - Rouse Properties, LLC | a2208496zex-10_10.htm |
| EX-10.12 - EX-10.12 - Rouse Properties, LLC | a2208496zex-10_12.htm |
| EX-10.11 - EX-10.11 - Rouse Properties, LLC | a2208496zex-10_11.htm |
| EX-10.13 - EX-10.13 - Rouse Properties, LLC | a2208496zex-10_13.htm |
| EX-32.1 - EX-32.1 - Rouse Properties, LLC | a2208496zex-32_1.htm |
Use these links to rapidly review the document
TABLE OF CONTENTS
Index to Combined Financial Statements and Combined Financial Statement Schedule
UNITED STATES
SECURITIES AND EXCHANGE COMMISSION
Washington, D.C. 20549
FORM 10-K
| (MARK ONE) | ||
ý |
ANNUAL REPORT PURSUANT TO SECTION 13 OR 15(d) OF THE SECURITIES EXCHANGE ACT OF 1934 |
|
For the fiscal year ended December 31, 2011 |
||
or |
||
o |
TRANSITION REPORT PURSUANT TO SECTION 13 OR 15(d) OF THE SECURITIES EXCHANGE ACT OF 1934 |
|
For the transition period from to |
||
COMMISSION FILE NUMBER 001-35287
ROUSE PROPERTIES, INC.
(Exact name of registrant as specified in its charter)
| Delaware (State or other jurisdiction of incorporation or organization) |
90-0750824 (I.R.S. Employer Identification Number) |
|
1114 Avenue of the Americas, Suite 2800, New York, NY (Address of principal executive offices) |
10110 (Zip Code) |
(212) 608-5108
(Registrant's telephone number, including area code)
Securities Registered Pursuant to Section 12(b) of the Act:
| Title of Each Class: | Name of Each Exchange on Which Registered: | |
|---|---|---|
| Common stock, $.01 par value | New York Stock Exchange |
Securities Registered Pursuant to Section 12(g) of the Act: None
Indicate by check mark if the registrant is a well-known seasoned issuer, as defined in Rule 405 of the Securities Act. YES o NO ý
Indicate by check mark if the registrant is not required to file reports pursuant to Section 13 or Section 15(d) of the Act. YES o NO ý
Indicate by check mark whether the registrant (1) has filed all reports required to be filed by Section 13 or 15(d) of the Securities Exchange Act of 1934 during the preceding 12 months (or for such shorter period that the registrant was required to file such reports), and (2) has been subject to such filing requirements for the past 90 days. YES ý NO o
Indicate by check mark whether the registrant has submitted electronically and posted on its corporate Web site, if any, every Interactive Data File required to be submitted and posted pursuant to Rule 405 of Regulation S-T (§ 232.405 of this chapter) during the preceding 12 months (or for such shorter period that the registrant was required to submit and post such files). YES o NO o
Indicate by check mark if disclosure of delinquent filers pursuant to Item 405 of Regulation S-K is not contained herein, and will not be contained, to the best of registrant's knowledge, in definitive proxy or annual reports incorporated by reference in Part III of this Form 10-K or any amendment to this Form 10-K. ý
Indicate by check mark whether the registrant is a large accelerated filer, an accelerated filer, a non-accelerated filer, or a smaller reporting company. See definition of "accelerated filer" and "large accelerated filer" and "smaller reporting company" in Rule 12b-2 of the Exchange Act. (Check one):
| Large accelerated filer o | Accelerated filer o | Non-accelerated filer ý (Do not check if a smaller reporting company) |
Smaller reporting company o |
Indicate by check mark whether the registrant is a shell company (as defined in Rule 12b-2 of the Act). YES o NO ý
The registrant commenced operations on January 12, 2012. Accordingly, there was no public market for the registrant's common stock as of June 30, 2011, the last day of the registrant's most recently completed second quarter.
As of March 26, 2012, there were 48,879,972 shares of the registrant's common stock outstanding.
ROUSE PROPERTIES, INC.
Annual Report on Form 10-K
December 31, 2011
i
Throughout this Annual Report on Form 10-K, (this "Annual Report") references to the "Company," "Rouse Properties," "Rouse," "we" and "our" refer to Rouse Properties, Inc. and its consolidated subsidiaries, unless the context requires otherwise. Rouse Properties, a Delaware corporation, was organized in August 2011.
Our mission is to own and manage dominant Class B regional malls in secondary and tertiary markets, and to reposition Class B regional malls in primary markets. We plan to increase the value of our properties by executing tailored business plans designed to improve their operating performance. We believe that the creation of an individual asset level-focused organization with dedicated capital will create high risk-adjusted returns for our stockholders.
As of December 31, 2011, our portfolio consisted of 30 regional malls in 19 states totaling over 21 million square feet of retail and ancillary space. Our portfolio includes regional malls with a historical record of steady occupancy and solid performance in the markets that they serve. These malls function as town centers and are located in one-mall markets, devoid of mall competition and have a high penetration of the trade area. In addition, our portfolio includes regional malls that we believe have significant growth potential through lease-up, repositioning and/or redevelopment. Some properties may require re-tenanting and re-constitution of the merchandising mix in order to provide new and relevant shopping and entertainment opportunities for the consumer.
We actively manage all of our properties, performing the day-to-day functions, operations, leasing, maintenance, marketing and promotional services. Our platform is national in scope and we believe it positions us to capitalize on existing department store and broad in-line retailer relationships across our portfolio.
Our malls are anchored by operators across the retail spectrum, including departments stores such as Macy's, JC Penney, Sears, Dillard's, Walmart and Target; mall shop tenants like Hollister, Victoria's Secret, Bath & Body Works, Aeropostale, American Eagle, Children's Place, Gap/Old Navy, Foot Locker, Maurices and Forever 21; restaurants ranging from food court leaders like Sarku Japan, Panda Express and Chick-Fil-A; best in class fast-casual chains like Chipotle, Panera Bread and Starbucks; and proven sit down restaurants including On The Border, Buffalo Wild Wings, Red Robin and multiple Darden concepts.
Our portfolio is also balanced, with no single tenant representing more than 4% of our total revenue in 2011.
We plan to elect to be treated as a real estate investment trust ("REIT") in connection with the filing of our federal income tax return for the 2011 taxable year, subject to our ability to meet the requirements of a REIT at the time of election, and we intend to maintain this status in future periods.
For the year ended December 31, 2011, we generated operating income, real estate property net operating income ("NOI"), core net operating income ("Core NOI"), funds from operations ("FFO"), and core funds from operations ("Core FFO") of $44.5 million, $135.6 million, $154.9 million, $51.2 million, and $83.9 million, respectively. See "Selected Financial Data" for a discussion of our use of NOI, Core NOI, FFO, and Core FFO which are non-GAAP measures, and for reconciliations of NOI and Core NOI to operating income and FFO and Core FFO to net income (loss).
A more detailed summary of our portfolio is presented under "Properties."
1
Competitive Strengths
We believe that we can distinguish ourselves through the following competitive strengths:
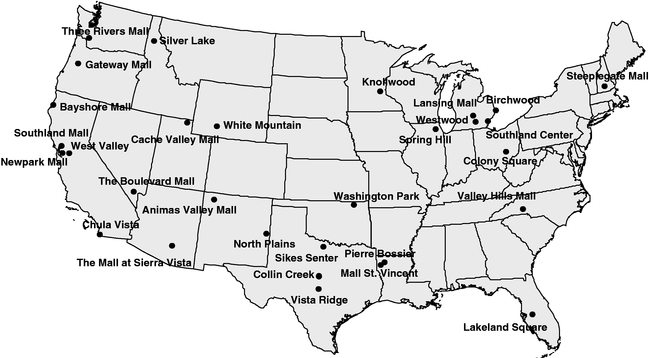
Size and Geographic Scope. We have a nationally diversified mall portfolio totaling over 21 million square feet, and we are one of the top 10 regional mall owners in the United States, based on total square footage. The map below illustrates the locations of each of our properties.
Strategic Relationships with Tenants. Our operations are national in scope and we have relationships with a wide range of tenants, which include anchor stores, sit-down restaurants, movie theatres, national in-line tenants and local retailers. We believe that these relationships provide us with a competitive advantage in many of our sub-markets.
Experienced Operational Management Team. Andrew Silberfein, our Chief Executive Officer, previously held the position of Executive Vice President—Retail and Finance for Forest City Ratner Companies, where he was employed for over 15 years. Mr. Silberfein was responsible for managing all aspects of Forest City Ratner Companies' retail portfolio, consisting of over 5.1 million square feet of existing and under construction shopping centers and malls. Mr. Silberfein has 22 years of experience in the retail real estate industry. Prior to joining Rouse Properties, our Chief Operating Officer, Benjamin Schall, served as the Senior Vice President of the Retail Division at Vornado Realty Trust. Mr. Schall was responsible for all facets of Vornado's suburban retail shopping center business and has over 11 years of experience in the real estate industry. Brian Harper, our Executive Vice President of Leasing, has over 13 years of experience in the retail real estate industry, including work with ground up development, asset repositions, distressed real estate and leasing. We believe that under the leadership of our executive operational management team, our operational team is well positioned to execute our strategic plans and unlock value in our properties. We intend to hire additional industry-leading senior executives with real estate management expertise to complement our seasoned operational management team.
2
Business Strategy
Our objective is to achieve high growth in NOI, Core NOI, FFO and Core FFO by leasing, operating and repositioning retail properties with locations that are either market dominant (the only mall within an extended distance to service the trade area) or trade area dominant (positioned to be the premier mall serving the defined regional consumer). We plan to control costs and to deliver an appropriate tenant mix, higher occupancy rates and increased sales productivity, resulting in higher minimum rents. In order to achieve our objective and to become the national leader in the regional Class B mall space, we intend to implement the following strategies:
Tailored Strategic Planning and Investment. We have identified value creation initiatives for each of our properties, taking into account customer demographics and the competitive environment of the property's market area, with a focus on increasing occupancy to the mall with a sustainable occupancy cost. We have identified opportunities to invest significant capital to reposition and refresh certain of our properties, but we will sequence long-term redevelopment projects with leasing activity. Examples of value creation initiatives include, but are not limited to:
- •
- Re-tenanting vacant anchor space and transforming low value in-line gross leaseable area ("GLA") into big box
space to meet the customer demand for uses such as fitness centers, sporting goods stores, electronics stores and supermarkets;
- •
- Enhancing the shopping experience and maximizing market relevance by aggressively targeting tenants that cater to the
market demographics; and
- •
- Improving the aesthetic appeal of our malls with a focus on facades, lighting and the common areas.
We believe that through execution of these initiatives we will position our properties for maximum stability and financial growth. While there can be no assurance, we believe these capital investments will assist in increasing our revenues significantly and deliver solid NOI growth over the medium term. For a discussion of factors that could have an impact on our ability to realize these goals, see "Risk Factors" and "Cautionary Statement Regarding Forward-Looking Statements."
Improve Tenant Mix and the Performance of Our Properties. We intend to proactively optimize the tenant mix of our malls by matching it to the consumer shopping patterns and needs and desires of the demographics in a particular market area, which we believe will strengthen our competitive position and increase tenant sales and consumer traffic. Additionally, as our occupancy rates rise we expect to convert selected temporary tenants to long-term tenants. To enhance the experience of our shoppers, we will actively market to our customers and seek to create shopping experiences that exceed their expectations. We believe our portfolio's lease expiration schedule over the next five years will provide an increase in NOI as the new rental rates will be higher than the expiring rents which are below our portfolio's average effective gross rent per square foot during the recession of the last two years. The increased revenue potential, coupled with an expected increase in overall occupancy, is a cornerstone of our growth model.
Leverage Our National Platform. We expect to maintain national contracts with certain vendors and suppliers for goods and services at generally more favorable terms than individual contracts. National retailers will benefit from our national platform for leasing, which will provide them with the efficiency of negotiating leases at multiple locations with just one landlord. This national platform will help position our properties as attractive destinations for retailers.
Actively Manage Our Portfolio. We intend to actively manage our portfolio of properties, executing our tailored initiatives and recycling capital, continually seeking opportunities to add value to our assets. We intend to seek and consider acquisition or disposition opportunities that would support our business strategy.
3
Improve Key Metrics. As of December 31, 2011, our portfolio sales per square foot were $284 and occupancy was approximately 88%, both of which are below our peer group average. We believe the factors contributing to this performance stem from the positioning of the properties within the General Growth Properties, Inc. ("GGP") portfolio. GGP was our parent company prior to the spin off ("the spin off") on January 12, 2012. As a "pure play" B mall company (i.e., having an exclusive focus on owning and operating B malls), we believe that the enhanced strategies and initiatives described in this Annual Report will alter the trajectory of our portfolio of malls and enhance these metrics and the value of our properties.
Recent Developments
On February 21, 2012, we completed the acquisition of Grand Traverse Mall, which had previously been owned by GGP. Grand Traverse is a 589,000 square foot, single level, enclosed regional mall located in Traverse City, Michigan. Grand Traverse Mall is the only enclosed mall within a 100-mile radius and it serves 22 surrounding counties with over 400,000 people inclusive of seasonal residents. The property is currently 85% leased with annual small shop tenant sales of approximately $300 per square foot and is anchored by Macy's, JCPenney and Target. We acquired the property for a total amount of approximately $66 million, consisting of cash payments for closing costs and required escrow reserves and the assumption of a restructured and discounted $62 million, five-year non-recourse loan at a 5.02% interest rate.
On March 26, 2012, we completed a rights offering and backstop purchase. Under the terms of the rights offering and backstop purchase, we issued 13,333,333 shares of our common stock at a subscription price of $15.00 per share. Net proceeds of the rights offering and backstop purchase approximated $192.0 million. In connection with the rights offering and backstop purchase Brookfield Asset Management Inc. and its affiliates ("Brookfield") owns approximately 54.38% of the Company.
Investor Information
Our website address is www.rouseproperties.com. Our SEC filings and amendments thereto filed or furnished pursuant to Section 13(a) or 15(d) of the Exchange Act are available or may be accessed free of charge through the "Investors" section of our website as soon as reasonably practicable after we electronically file such material with, or furnish it to, the SEC. Our website and included or linked information on the website are not intended to be incorporated into this Annual Report. Additionally, the public may read and copy any materials we file with the SEC at the SEC's Public Reference Room at 100 F Street, NE, Washington, DC 20549, and may obtain information on the operation of the Public Reference Room by calling the SEC at 1-800-SEC-0330. The SEC maintains an Internet site that contains reports, proxy and information statements, and other information regarding issuers that file electronically with the SEC, which can be accessed at http://www.sec.gov.
Competition
We are among the largest mall owners in the United States focused on a regional Class B mall strategy. The nature and extent of the competition we face varies from property to property. Our direct competitors include other publicly-traded retail mall development and operating companies, retail real estate companies, commercial property developers, internet retail sales and other owners of retail real estate that engage in similar businesses.
Within our portfolio of retail properties, we compete for retail tenants. We believe the principal factors that retailers consider in making their leasing decision include:
- •
- consumer demographics;
- •
- quality, design and location of properties;
4
- •
- total number and geographic distribution of properties;
- •
- diversity of retailers and anchor tenants at shopping center locations;
- •
- management and operational expertise; and
- •
- rental rates.
Because our revenue potential is linked to the success of our retailers, we indirectly share exposure to the same competitive factors that our retail tenants experience in their respective markets when trying to attract individual shoppers. These dynamics include general competition from other regional shopping malls, including outlet malls and other discount shopping malls, as well as competition with discount shopping clubs, catalog companies, internet sales and telemarketing.
We intend to actively manage our portfolio and expect to enhance the quality and desirability of our regional malls. The recent challenging economic conditions have resulted in suspensions and cancellations of many new mall projects, reducing an already small pipeline. While we operate on a much smaller scale than many of our competitors, we believe that our enhanced portfolio and the lack of a competitive pipeline will make us appealing for retailers who are reevaluating their positioning within their respective market areas.
Environmental
Under various federal, state and local laws, ordinances and regulations, an owner of real estate is liable for the costs of removal or remediation of certain hazardous or toxic substances on such real estate. These laws often impose such liability without regard to whether the owner knew of, or was responsible for, the presence of such hazardous or toxic substances. The costs of remediation or removal of such substances may be substantial and the presence of such substances, or the failure to promptly remediate such substances, may adversely affect the owner's ability to sell such real estate or to borrow using such real estate as collateral. In connection with our ownership and operation of our properties, we may be potentially liable for such costs. The operations of current and former tenants at our properties have involved, or may have involved, the use of hazardous materials or generated hazardous wastes. The release of such hazardous materials and wastes could result in our incurring liabilities to remediate any resulting contamination if the responsible party is unable or unwilling to do so. In addition, many of our properties are located in urban areas, and are therefore exposed to the risk of contamination originating from other sources. For example, groundwater beneath our property in Las Vegas, Nevada, is known to be contaminated as a result of releases of hazardous materials from an offsite source. We are currently working with the relevant governmental authorities to allow for sampling on our property in furtherance of the governments' efforts to determine the appropriate remedial action. While a property owner generally is not responsible for remediating contamination that has migrated onsite from an offsite source, the contaminant's presence can have adverse effects on operations and redevelopment of our properties.
Most of our properties have been subject, at some time, to environmental assessments, that are intended to evaluate the environmental condition of our property and surrounding properties. These environmental assessments generally have included a historical review, a public records review, a visual inspection of the site and surrounding properties, a visual screening for the presence of asbestos-containing materials, polychlorinated biphenyls and underground storage tanks and the preparation and issuance of a written report. They have not, however, included any sampling or subsurface investigations. Soil and/or groundwater testing is conducted at our properties, when necessary, to further investigate any issues raised by the initial assessment that could reasonably be expected to pose a material concern to the property or result in us incurring material environmental liabilities. In each case where the environmental assessments have identified conditions requiring remedial actions required by law, former management has either taken or scheduled the recommended action.
5
None of the environmental assessments conducted by us at the properties have revealed any environmental liability that we believe would have a material adverse effect on our overall business, financial condition or results of operations. Nevertheless, it is possible that these assessments do not reveal all environmental liabilities or that there are material environmental liabilities of which we are unaware.
Moreover, no assurances can be given that future laws, ordinances or regulations will not impose any material environmental liability or the current environmental condition of our properties will not be adversely affected by tenants and occupants of the properties, by the condition of properties in the vicinity of our properties (such as the presence on such properties of underground storage tanks) or by third parties unrelated to us.
Future development opportunities may require additional capital and other expenditures in order to comply with federal, state and local statutes and regulations relating to the protection of the environment. It is possible that we may not have sufficient liquidity to comply with such statutes and regulations and may be required to halt or defer such development projects. We cannot predict with any certainty the magnitude of any such expenditures or the long-range effect, if any, on our operations. Compliance with such laws has not had a material adverse effect on our operating results or competitive position in the past but could have such an effect in the future.
Other Policies
The following is a discussion of our investment policies, financing policies, conflict of interest policies and policies with respect to certain other activities. One or more of these policies may be amended or rescinded from time to time without a stockholder vote.
Investment Policies
We are in the business of owning and operating retail shopping malls across the United States. We plan to elect to be treated as a REIT in connection with the filing of our federal tax return for 2011, and intend to maintain this status in future periods. REIT limitations restrict us from making an investment that would cause our real estate assets to be less than 75% of our total assets. In addition, at least 75% of our gross income must be derived directly or indirectly from investments relating to real property or mortgages on real property, including "rents from real property," dividends from other REITs and, in certain circumstances, interest from certain types of temporary investments. At least 95% of our income must be derived from such real property investments, and from dividends, interest and gains from the sale or dispositions of stock or securities or from other combinations of the foregoing.
Subject to REIT limitations, we may invest in the securities of other issuers in connection with acquisitions of indirect interests in real estate. Such an investment would normally be in the form of general or limited partnership or membership interests in special purpose partnerships and limited liability companies that own one or more properties. We may, in the future, acquire all or substantially all of the securities or assets of other REITs, management companies or similar entities where such investments would be consistent with our investment policies.
Financing Policies
The successful execution of our business strategy will require the availability of substantial amounts of operating and development capital both initially and over time. Sources of such capital could include bank, life insurance company, pension plan or institutional investor borrowings, public and private offerings of debt or equity, including rights offerings, sale of certain assets, joint ventures, retention of cash flows or a combination of these methods. Our ability to retain cash flows is limited by the requirement for REITs to pay tax on or distribute 100% of their capital gains income and distribute at least 90% of their taxable income and our desire to avoid entity level U.S. federal income tax by
6
distributing 100% of our capital gains and ordinary taxable income. We have no present intention to pay any dividends on our common stock in the future other than in order to maintain our REIT status, which dividends our board of directors may decide to pay in the form of cash, common stock or a combination of cash and common stock. We must also take into account taxes that would be imposed on undistributed taxable income.
If our board of directors determines to raise additional equity capital, it may, without stockholder approval, issue additional shares of common stock or other capital stock. Our board of directors may issue a number of shares up to the amount of our authorized capital in any manner and on such terms and for such consideration as it deems appropriate. Such securities may be senior to the outstanding classes of common stock. Such securities also may include preferred stock, which may be convertible into common stock or redeemable for cash at the holder's option.
We decide upon the structure of the financing based upon the best terms then available to us and whether the proposed financing is consistent with our other business objectives. We do not have a policy limiting the number or amount of mortgages that may be placed on any particular property. Mortgage financing instruments, however, usually limit additional indebtedness on such properties and/or the direct and indirect equity interests of the entity owning such properties. Permanent financing may be structured as a mortgage loan on a single property and generally requires us to provide a mortgage interest on the property in favor of the underlying lender and in some instances will require a parent entity to provide an environmental indemnity or an indemnity related to certain bad faith acts. The originating lender of our permanent financing may not retain the loan and the same could be sold directly to another lender or in the secondary loan market. As a condition to obtaining a mortgage loan, our lenders will typically require us to form special purpose entities to own the properties, and act as the borrowing entity. These special purpose entities are structured so that they would not necessarily be consolidated with us in the event we would ever become subject to a bankruptcy proceeding or liquidation. Notwithstanding this bankruptcy remoteness, for accounting purposes we include the outstanding debt of special purpose entities owning consolidated properties as part of our consolidated indebtedness.
Conflict of Interest Policies
We have policies designed to reduce or eliminate potential conflicts of interest. We have adopted governance principles governing our affairs and the board of directors, as well as written charters for each of the standing committees of the board of directors. In addition, we have a Code of Business Conduct and Ethics, which applies to all of our officers, directors, and employees. At least a majority of the members of our board of directors must qualify as independent under the listing standards for New York Stock Exchange ("NYSE") companies unless we elect to avail ourselves of exemptions from certain corporate governance requirements as a controlled company. Any transaction between us and any director, officer or 5% stockholder must be approved pursuant to our related person transactions policy.
Policies with Respect to Certain Other Activities
We intend to make investments which are consistent with our qualification as a REIT, unless the board of directors determines that it is no longer in our best interests to so qualify as a REIT. We have authority to offer shares of our capital stock or other securities in exchange for property. We also have authority to repurchase or otherwise reacquire our shares or any other securities. Our policy prohibits direct or indirect personal loans to executive officers and directors to the extent required by law and stock exchange regulation.
We intend to borrow money as part of our business, and we also may issue senior securities, purchase and sell investments, offer securities in exchange for property and repurchase or reacquire
7
shares or other securities in the future. To the extent we engage in these activities, we will comply with applicable law. While we do not currently have a common stock repurchase program, we intend to implement one in the future.
We will make reports to our security holders in accordance with the NYSE rules and containing such information, including financial statements certified by independent public accountants, as required by the NYSE.
We do not currently have policies in place with respect to making loans to other persons (other than our conflict of interest policies described above) or investing in securities.
Employees
As of March 26, 2012, we had approximately 225 employees.
Insurance
We have comprehensive liability, fire, flood, extended coverage and rental loss insurance with respect to our portfolio of retail properties. Our management believes that such insurance provides adequate coverage.
Qualification as a Real Estate Investment Trust and Taxability of Distributions
Rouse Properties plans to elect to be qualified, as a REIT. If, as we contemplate, Rouse Properties qualifies as a REIT, we will not be subject to federal income tax on its real estate investment trust taxable income so long as, among other requirements, certain distribution requirements are met with respect to such income.
You should carefully consider the risks described below in addition to all other information provided to you in this Annual Report. Any of the following risks could materially and adversely affect our business, results of operations and financial condition.
Risks Related to our Business
We have a limited operating history as an independent company upon which you can evaluate our performance, and accordingly, our prospects must be considered in light of the risks that any newly independent company encounters.
We completed our spin-off from GGP on January 12, 2012, and have limited experience operating as an independent company and performing various corporate functions, including human resources, tax administration, legal (including compliance with the Sarbanes-Oxley Act of 2002 (the "Sarbanes-Oxley Act") and the Dodd-Frank Wall Street Reform and Consumer Protection Act (the "Dodd-Frank Act") and with the periodic reporting obligations of the Securities Exchange Act of 1934 (the "Exchange Act")), treasury administration, investor relations, internal audit, insurance, information technology and telecommunications services, as well as the accounting for items such as equity compensation.
8
Our business will be subject to the substantial risks inherent in the commencement of a new business enterprise in an intensely competitive industry. Our prospects must be considered in light of the risks, expenses and difficulties encountered by companies in the early stages of independent business operations, particularly companies that are heavily affected by economic conditions and operate in highly competitive environments.
We may face potential difficulties in obtaining operating and development capital.
The successful execution of our business strategy will require the availability of substantial amounts of operating and development capital both initially and over time. Sources of such capital could include bank, life insurance company, pension plan or institutional investor borrowings, public and private offerings of debt or equity, including rights offerings, sales of certain assets and joint ventures. We have identified opportunities to invest significant capital to redevelop and refresh our properties to pursue tailored strategic initiatives, but we will sequence long-term redevelopment projects with leasing activity. We believe these capital investments will assist in increasing our revenues significantly and deliver solid net operating income growth over the medium term. We cannot assure that any capital will be available on terms acceptable to us or at all in order to satisfy our short or long-term cash needs. See "Management's Discussion and Analysis of Financial Condition and Results of Operation—Liquidity and Capital Resources."
We may be unable to reposition or redevelop some of our properties, which may have an adverse impact on our profitability.
Our business strategy is focused on repositioning and redeveloping our properties. In connection with these repositioning and redevelopment projects, we will be subject to various risks, including the following:
- •
- we may not have sufficient capital to proceed with planned repositioning or redevelopment activities;
- •
- redevelopment costs of a project may exceed original estimates or available financing, possibly making the project
unfeasible or unprofitable;
- •
- we may not be able to obtain zoning or other required governmental permits and authorizations;
- •
- occupancy rates and rents at a completed project may not meet projections and, therefore, the project may not be
profitable; and
- •
- we may not be able to obtain anchor store and mortgage lender approvals, if applicable, for repositioning or redevelopment activities.
There can be no assurance that our repositioning and redevelopment projects will have the desired results of attracting and retaining desirable tenants and increasing customer traffic. If repositioning or redevelopment projects are unsuccessful, our investments in those projects may not be fully recoverable from future operations or sales.
We may increase our debt or raise additional capital in the future, which could affect our financial health and may decrease our profitability.
To execute our business strategy, we will require additional capital. Debt or equity financing, however, may not be available to us on terms acceptable to us, if at all. If we incur additional debt or raise equity through the issuance of preferred stock, the terms of the debt or preferred stock issued may give the holders rights, preferences and privileges senior to those of holders of our common stock, particularly in the event of liquidation. The terms of any new debt may also impose additional and more stringent restrictions on our operations than we currently have. If we raise funds through the
9
issuance of additional common equity, either through public or private offerings or rights offerings, your percentage ownership in us would decline if you do not ratably participate. If we are unable to raise additional capital when needed, it could affect our financial health, which could negatively affect your investment in us.
Economic conditions, especially in the retail sector, may have an adverse effect on our revenues and available cash.
Unemployment, weak income growth, tight credit, declining consumer confidence and the need to pay down existing obligations may negatively impact consumer spending. Given these economic conditions, we believe there is a risk that the sales at stores operating in our malls may be adversely affected. This may hinder our ability to implement our strategies and may have an unfavorable effect on our operations and our ability to retain existing tenants and attract new tenants.
We may be unable to lease or re-lease space in our properties on favorable terms or at all, which may adversely affect our revenues.
Our results of operations depend on our ability to strategically lease space in our properties, including re-leasing space in properties where leases are expiring, optimizing our tenant mix or leasing properties on more economically favorable terms. We are continually focused on our ability to lease properties and collect rents from tenants. If we are unable to lease or re-lease space in our properties this may adversely affect our operations and revenues.
Our tenants may be unable to pay minimum rents and expense recovery charges, which would have an adverse effect on our income and cash flow.
If the sales at certain stores operating in our regional malls do not improve, tenants might be unable to pay their existing minimum rents or expense recovery charges, since these rents and charges would represent a higher percentage of their sales. If our tenants' sales do not improve, new tenants would be less likely to be willing to pay minimum rents as high as they would otherwise pay. We may not be able to collect rent sufficient to meet our costs. Because substantially all of our income is derived from rentals of real property, our income and cash flow would be adversely affected if a significant number of tenants are unable to meet their obligations.
Certain co-tenancy provisions in our lease agreements may result in reduced rent payments, which may adversely affect our operations and occupancy.
Some of our lease agreements include a co-tenancy provision which allows the mall tenant to pay a reduced rent amount and, in certain instances, terminate the lease, if we fail to maintain certain occupancy levels at the mall. In addition, certain of our tenants have the ability to terminate their leases with us prior to the lease expiration date if their sales do not meet agreed upon thresholds. Therefore, if occupancy, tenancy or sales fall below certain thresholds, rents we are entitled to receive from our retail tenants could be reduced and our ability to attract new tenants may be limited.
The failure to fully recover cost reimbursements for common area maintenance, taxes and insurance from tenants could adversely affect our operating results.
The computation of cost reimbursements from tenants for common area maintenance ("CAM"), insurance and real estate taxes is complex and involves numerous judgments including interpretation of lease terms and other tenant lease provisions. Most tenants make monthly fixed payments of CAM, real estate taxes and other cost reimbursement items. After the end of the calendar year, we compute each tenant's final cost reimbursements and issue a bill or credit for the full amount, after considering amounts paid by the tenant during the year. The billed amounts could be disputed by the tenant or
10
become the subject of a tenant audit or even litigation. There can be no assurance that we will collect all or substantially this entire amount.
The bankruptcy or store closures of anchor stores or national tenants, may adversely affect our revenues.
Some of our properties depend on anchor stores or national tenants, which are large tenants such as department stores and tenants with chains of stores in many of our properties, respectively, to attract shoppers. We derive significant revenues from these tenants. Our leases generally do not contain provisions designed to ensure the creditworthiness of our tenants and in recent years a number of companies in the retail industry, including some of our tenants, have declared bankruptcy or voluntarily closed certain of their stores. We may be unable to re-lease such space or to re-lease it on comparable or more favorable terms. As a result, the bankruptcy, insolvency, closure or general downturn in the business of an anchor store or national tenant, as well as requests from such tenants for significant rent relief or other lease concessions, may adversely affect our financial position, results of operations and ability to make distributions.
Our ability to change our portfolio is limited because real estate investments are relatively illiquid.
Equity real estate investments are relatively illiquid, which may limit our ability to strategically change our portfolio promptly in response to changes in economic, financial, investment or other conditions. The real estate market is affected by many factors, such as general economic conditions, availability of financing and other factors, including supply and demand for space, that are beyond our control. Moreover, there are some limitations under federal income tax laws applicable to REITs that limit our ability to sell assets. We cannot predict whether we will be able to sell any property for the price or on the terms we set, or whether any price or other terms offered by a prospective purchaser would be acceptable to us. The number of prospective buyers interested in purchasing malls is limited. We cannot predict the length of time needed to find a willing purchaser and to close the sale of a property. In addition, economic and capital market conditions might make it more difficult for us to sell properties or might adversely affect the price we receive for properties that we do sell, as prospective buyers might experience increased costs of debt financing or other difficulties in obtaining debt financing.
In addition, significant expenditures associated with each equity investment, such as mortgage payments, real estate taxes and maintenance costs, generally are not reduced when circumstances cause a reduction in income from the investment. If income from a property declines while the related expenses do not decline, our income and cash available to us would be adversely affected. If it becomes necessary or desirable for us to dispose of one or more of our mortgaged properties, we might not be able to obtain a release of the lien on the mortgaged property without payment of the associated debt. The foreclosure of a mortgage on a property or inability to sell a property could adversely affect the level of cash available to us. These factors and any others that would impede our ability to respond to adverse changes in the performance of our properties could adversely affect our financial condition and results of operations.
We operate in a competitive business.
There are numerous shopping facilities that compete with our properties in attracting retailers to lease space and many of our competitors operate on a much larger scale than we do. In addition, retailers at our properties face continued competition from retailers at other regional malls, outlet malls and other discount shopping malls, discount shopping clubs, full-line large format value retailers, catalog companies, and through internet sales and telemarketing. Competition could adversely affect our revenues and cash flows.
11
In particular, the increase in both the availability and popularity of online shopping has created a growing source of competitive pressure on the retailers at our properties. The ability of online retailers to offer a wide range of products for sale, often with substantial price and tax savings, and free or discounted shipping, allows these online retailers to compete with the retailers at our properties by offering added convenience and cost-saving incentives to consumers in both high density major metropolitan markets and rural areas. Additionally, small businesses and specialty retailers, who have previously been limited to marketing and selling their products within their immediate geographical area, are now able to reach a broader group of consumers and compete with the retailers at our properties.
We also compete with other major real estate investors with significant capital for attractive investment opportunities. These competitors include REITs, investment banking firms and private institutional investors.
Our ability to realize our strategies and capitalize on our competitive strengths are dependent on our ability to effectively operate a large portfolio of malls, maintain good relationships with our tenants and consumers, and remain well-capitalized, and our failure to do any of the foregoing could affect our ability to compete effectively in the markets in which we operate.
Our business is dependent on perceptions by retailers and shoppers of the convenience and attractiveness of our retail properties, and our inability to maintain a positive perception may adversely affect our revenues.
We are dependent on perceptions by retailers or shoppers of the safety, convenience and attractiveness of our retail properties. If retailers and shoppers perceive competing retail properties and other retailing options such as the internet to be more convenient or of a higher quality, our revenues may be adversely affected.
Our significant indebtedness could have an adverse impact on our financial health and operating flexibility.
As of December 31, 2011, our total combined contractual debt, excluding non-cash debt market rate adjustments, was $1.12 billion on an actual basis. Our significant indebtedness could have important consequences on the value of our common stock including:
- •
- limiting our ability to borrow additional amounts for working capital, capital expenditures, debt service requirements,
execution of our business strategy or other purposes;
- •
- limiting our ability to use operating cash flow in other areas of the business or to pay dividends;
- •
- increasing our vulnerability to general adverse economic and industry conditions, including increases in interest rates,
particularly given that certain indebtedness bears interest at variable rates;
- •
- limiting our ability to capitalize on business opportunities, access equity, reinvest in and develop our properties, and
to react to competitive pressures and adverse changes in government regulation;
- •
- limiting our ability, or increasing the costs, to refinance indebtedness;
- •
- limiting our ability to enter into marketing and hedging transactions by reducing the number of potential counterparties
with whom we could enter into such transactions as well as the volume of those transactions; and
- •
- giving secured lenders the ability to foreclose on our assets.
12
Our debt obligations and ability to comply with related covenants could impact our financial condition or future operating results.
In January 2012, we became a party to a senior secured credit facility and a subordinated revolving credit facility, which expose us to the typical risks associated with the use of leverage. We also have property-level debt, which limits our ability to take certain actions with respect to the properties securing such debt. Increased leverage makes it more difficult for us to withstand adverse economic conditions or business plan variances, to take advantage of new business opportunities, or to make necessary capital expenditures.
The senior secured credit facility has affirmative and negative covenants that are customary for a real estate loan, including, without limitation, restrictions on incurrence of indebtedness and liens on the mortgage collateral; restrictions on pledges; restrictions on subsidiary distributions; with respect to the mortgage collateral, limitations on our ability to enter into transactions including mergers, consolidations, sales of assets for less than fair market value and similar transactions; conduct of business; restricted distributions; transactions with affiliates; and limitation on speculative hedge agreements. In addition, we are required to comply with the following financial maintenance covenants: (1) net indebtedness to value ratio, (2) liquidity, (3) minimum fixed charge coverage ratio, (4) minimum tangible net worth, and (5) minimum portfolio debt yield. Failure to comply with the covenants in the senior secured credit facilities would result in a default under the credit agreement governing these facilities and, absent a waiver or an amendment from our lenders, permit the acceleration of all outstanding borrowings under the senior secured credit facilities, which would also result in a cross-default our subordinated revolving credit facility. No assurance can be given that we would be successful in obtaining such waiver or amendment in this current financial climate, or that any accommodations that we were able to negotiate would be on terms as favorable as those in the senior secured credit facilities or subordinated revolving credit facility. In addition, any such default may result in the cross-default of our other indebtedness.
A substantial portion of our cash flow could be required for debt service and, as a result, might not be available for our operations or other purposes. Any substantial decrease in cash flows or any substantial increase in expenses could make it difficult for us to meet our debt service requirements or force us to modify our operations. Our level of indebtedness may make us more vulnerable to economic downturns and reduce our flexibility in responding to changing business, regulatory and economic conditions.
We have a history of net losses and may not be profitable in the future.
Our historical combined financial data was carved-out from the financial information of GGP and shows that we have a history of losses, and we cannot assure you that we will achieve sustained profitability going forward. For the years ended December 31, 2011, 2010 and 2009, we incurred net losses of $(27.0) million, $(23.9) million and $(30.2) million, respectively. See "Selected Historical Combined Financial Data." If we cannot improve our profitability or generate positive cash from operating activities, the trading value of our common stock may decline.
National, regional and local economic conditions may adversely affect our business.
Our real property investments are influenced by the national, regional and local economy, which may be negatively impacted by plant closings, industry slowdowns, increased unemployment, lack of availability of consumer credit, increased levels of consumer debt, declining consumer sentiment, poor housing market conditions, adverse weather conditions, natural disasters and other factors. Similarly, local real estate conditions, such as an oversupply of, or a reduction in demand for, retail space or retail goods, and the supply and creditworthiness of current and prospective tenants may affect the ability of our properties to generate significant revenue.
13
Some of our properties are subject to potential natural or other disasters.
A number of our properties are located in areas which are subject to natural or other disasters, including hurricanes, tornados, earthquakes and oil spills. For example, certain of our properties are located in California or in other areas with higher risk of earthquakes. Furthermore, some of our properties are located in coastal regions, and would therefore be affected by any future rises in sea levels.
Possible terrorist activity or other acts of violence could adversely affect our financial condition and results of operations.
Future terrorist attacks in the United States or other acts of violence may result in declining economic activity, which could harm the demand for goods and services offered by our tenants and the value of our properties and might adversely affect the value of an investment in our securities. Such a decrease in retail demand could make it difficult for us to renew or re-lease our properties at lease rates equal to or above historical rates. Terrorist activities or violence also could directly affect the value of our properties through damage, destruction or loss, and the availability of insurance for such acts, or of insurance generally, might be lower or cost more, which could increase our operating expenses and adversely affect our financial condition and results of operations. To the extent that our tenants are affected by future attacks, their businesses similarly could be adversely affected, including their ability to continue to meet obligations under their existing leases. These acts might erode business and consumer confidence and spending and might result in increased volatility in national and international financial markets and economies. Any one of these events might decrease demand for real estate, decrease or delay the occupancy of our properties, and limit our access to capital or increase our cost of raising capital.
We could incur significant costs related to government regulation and litigation over environmental matters and various other federal, state and local regulatory requirements.
Under various federal, state or local laws, ordinances and regulations, a current or previous owner or operator of real estate may be required to investigate and clean up hazardous or toxic substances released at a property and may be held liable to third parties for bodily injury or property damage (investigation and/or clean-up costs) incurred by the parties in connection with the contamination. These laws often impose liability without regard to whether the owner or operator knew of or otherwise caused the release of the hazardous or toxic substances. The presence of contamination or the failure to remediate contamination discovered at our properties may adversely affect our ability to sell, lease or borrow with respect to the real estate. Our properties have been subjected to varying degrees of environmental assessment at various times; however, the identification of new areas of contamination, a change in the extent or known scope of contamination or changes in cleanup requirements could result in significant costs to us.
Other federal, state and local laws, ordinances and regulations require abatement or removal of asbestos-containing materials in the event of demolition or certain renovations or remodeling, the cost of which may be substantial for certain redevelopments. These regulations also govern emissions of and exposure to asbestos fibers in the air, which may necessitate implementation of site specific maintenance practices. Certain laws also impose liability for release of asbestos-containing materials into the air and third parties may seek recovery from owners or operators of real properties for personal injury or property damage associated with asbestos-containing materials. Asbestos-containing building materials are present at some of our properties and may be present at others. To minimize the risk of onsite asbestos being improperly disturbed, we have developed and implemented asbestos operations and maintenance programs to manage asbestos-containing materials and suspected asbestos-containing materials in accordance with applicable legal requirements.
14
We also may incur costs to comply with the Americans with Disabilities Act of 1990 and similar laws, which require that all public accommodations meet federal requirements related to access and use by disabled persons. Compliance with such laws has not had a material adverse effect on our operating results or competitive position in the past, but could have such an effect in the future.
Some potential losses are not insured, which may adversely affect our profitability.
We carry comprehensive liability, fire, flood, earthquake, terrorism, extended coverage and rental loss insurance on all of our properties. We believe the policy specifications and insured limits of these policies are adequate and appropriate in light of the size and scope of our portfolio and business operations. There are, however, some types of losses, including lease and other contract claims, which generally are not insured. If an uninsured loss or a loss in excess of insured limits occurs, we could lose all or a portion of the capital we have invested in a property, as well as the anticipated future revenue from the property. If this happens, we might nevertheless remain obligated for any mortgage debt or other financial obligations related to the property.
Inflation may adversely affect our financial condition and results of operations.
While substantially all of our tenant leases contain provisions designed to partially mitigate the negative impact of inflation (such as overage rent and escalation clauses), they may not adequately do so.
A rise in interest rates may increase our overall interest rate expense.
A rise in interest rate could have an immediate adverse impact on us due to our outstanding variable-rate debt. This risk can be managed or mitigated by utilizing interest rate protection products that generally allow us to replace variable-rate debt with fixed-rate debt. However, in an increasing interest rate environment the fixed rates we can obtain with such interest rate protection products will also continue to increase. In addition, in the event of a rise in interest rates, we may be unable to replace maturing debt with new debt at equal or better interest rates.
We may not be able to meet the conditions for qualification as a REIT or thereafter maintain our status as a REIT, which would deny us certain favorable tax treatment.
We plan to elect to be treated as a REIT in connection with the filing of our federal income tax return for 2011 and we intend to maintain this status in future periods. Such election would be retroactive to the date of our formation. We believe that, commencing with the 2011 taxable year; we were organized and have operated so as to qualify as a REIT for U.S. Federal income tax purposes. It is possible that we may not meet the conditions for qualification as a REIT at the time of such election. In addition, once an entity is qualified as a REIT, the Internal Revenue Code (the "Code") generally requires that such entity pay tax on or distribute 100% of its capital gains and distribute at least 90% of its ordinary taxable income to stockholders. To avoid current entity level U.S. federal income taxes, we expect to distribute 100% of our capital gains and ordinary income to stockholders annually.
If, with respect to any taxable year, we fail to maintain our qualification as a REIT, we would not be allowed to deduct distributions to stockholders in computing our taxable income and federal income tax. If any of our REIT subsidiaries fail to qualify as a REIT, such failure could result in our loss of REIT status. If we lose our REIT status, corporate level income tax, including any applicable alternative minimum tax, would apply to our taxable income at regular corporate rates. As a result, the amount available for distribution to holders of equity securities that would otherwise receive dividends would be reduced for the year or years involved, and we would no longer be required to make
15
distributions. In addition, unless we were entitled to relief under the relevant statutory provisions, we would be disqualified from treatment as a REIT for four subsequent taxable years.
An ownership limit, certain anti-takeover defenses and applicable law may hinder any attempt to acquire us.
Our amended and restated certificate of incorporation and amended and restated bylaws contain the following limitations:
The ownership limit. Generally, for us to qualify as a REIT under the Code for a taxable year, not more than 50% in value of the outstanding shares of our capital stock may be owned, directly or indirectly, by five or fewer "individuals" at any time during the last half of such taxable year. Our amended and restated certificate of incorporation provides that no person may own more than 9.9% of the number or value, whichever is more restrictive, of our outstanding shares of capital stock unless our board of directors provides a waiver from the ownership restrictions. The Code defines "individuals" for purposes of the requirement described above to include some types of entities. However, our amended and restated certificate of incorporation also permits us to exempt a person from the ownership limit upon the satisfaction of certain conditions described therein.
Selected provisions of our amended and restated certificate of incorporation. Our amended and restated certificate of incorporation authorizes the board of directors:
- •
- to cause us to issue additional authorized but unissued shares of common stock or preferred stock;
- •
- to classify or reclassify, in one or more series, any unissued preferred stock; and
- •
- to set the preferences, rights and other terms of any classified or reclassified stock that we issue.
Our amended and restated certificate of incorporation also prohibits our stockholders from acting by written consent.
Selected provisions of our amended and restated bylaws.
Our amended and restated bylaws contain the following limitations:
- •
- restrictions on the ability of stockholders to call a special meeting without 20% or more of the voting power of the
issued and outstanding shares entitled to vote generally in the election of directors; and
- •
- rules regarding how stockholders may present proposals or nominate directors for election at stockholder meetings.
Selected provisions of Delaware law. We are a Delaware corporation, and Section 203 of the Delaware General Corporation Law applies to us. In general, Section 203 prevents an "interested stockholder" (as defined below), from engaging in a "business combination" (as defined in the statute) with us for three years following the date that person becomes an interested stockholder unless one or more of the following occurs:
- •
- before that person became an interested stockholder, our board of directors approved the transaction in which the
interested stockholder became an interested stockholder or approved the business combination;
- •
- upon completion of the transaction that resulted in the interested stockholder becoming an interested stockholder, the interested stockholder owned at least 85% of our voting stock outstanding at the time the transaction commenced, excluding for purposes of determining the voting stock outstanding (but not the outstanding voting stock owned by the interested stockholder) stock held by directors who are also officers of our company and by employee stock plans that do not provide employees with the right to determine confidentially whether shares held under the plan will be tendered in a tender or exchange offer; or
16
- •
- following the transaction in which that person became an interested stockholder, the business combination is approved by our board of directors and authorized at a meeting of stockholders by the affirmative vote of the holders of at least two-thirds of our outstanding voting stock not owned by the interested stockholder.
The statute defines "interested stockholder" as any person that is the owner of 15% or more of our outstanding voting stock or is our affiliate or associate and was the owner of 15% or more of our outstanding voting stock at any time within the three-year period immediately before the date of determination.
In addition, Brookfield and Brookfield's co-investors in GGP ("the Brookfield Consortium") have a significant ownership of our Common stock. This ownership of our Common stock may impede a change in control transaction. See "Risks Related to our Common stock Generally—Our substantial stockholders may exert influence over us that may be adverse to our best interests and those of our other stockholders."
Each item discussed above may delay, deter or prevent a change in control of our company, even if a proposed transaction is at a premium over the then current market price for our common stock. Further, these provisions may apply in instances where some stockholders consider a transaction beneficial to them. As a result, our stock price may be negatively affected by these provisions.
Risks Related to the Spin-off
Our ability to operate our business effectively may suffer if we do not establish our own financial, administrative and other support functions to operate as a stand-alone company.
Historically, we have relied on the financial, administrative and other support functions of GGP to operate our business and we continue to rely on GGP for these and other vital services on a transitional basis pursuant to the transition services agreement that we entered into with GGP. We will also need to rapidly establish our own financial structure. Any failure in our own financial structure or administrative policies and systems could materially harm our business and financial performance.
The agreements related to the spin-off of Rouse that we have entered into with GGP involve conflicts of interest.
Because the spin-off involved the separation of certain of GGP's existing businesses into two independent companies, we entered into certain agreements with GGP to provide a framework for our relationship with GGP following the spin-off. The terms of the spin-off agreed to in the separation agreement and the transition services agreement between GGP and us were determined by persons who were at the time employees, officers or directors of GGP or its subsidiaries and, accordingly, had a conflict of interest.
As a result of the spin-off from GGP, we may experience increased costs resulting from a decrease in the purchasing power and other operational efficiencies and a loss of other benefits we had due to our association with GGP.
Historically, we have shared economies of scope and scale in costs, employees, vendor relationships and retailer relationships with GGP. We have historically been able to take advantage of GGP's purchasing power in technology and services, including information technology, marketing, insurance, treasury services, property support and the procurement of goods. As a smaller, separate, stand-alone company, it may be more difficult for us to obtain goods, technology and services at prices and on terms as favorable as those available to us prior to our spin-off from GGP. Likewise, it may be more difficult for us to attract and retain desired retailers. The loss of these benefits of scope and scale may have an adverse effect on our business, results of operations and financial condition.
17
In connection with the spin-off from GGP, we became subject to the reporting requirements of the Exchange Act, the Sarbanes-Oxley Act and the Dodd-Frank Act and are required to prepare our financial statements according to the rules and regulations required by the SEC. In addition, the Exchange Act requires that we file annual, quarterly and current reports. Our failure to prepare and disclose this information in a timely manner or to otherwise comply with applicable law could subject us to penalties under federal securities laws, expose us to lawsuits and restrict our ability to access financing. The Sarbanes-Oxley Act requires that we, among other things, establish and maintain effective internal controls and procedures for financial reporting and disclosure purposes. Establishing and monitoring these controls could result in significant costs to us and require us to divert substantial resources, including management time, from other activities.
Prior to the spin-off, we entered into agreements with GGP pursuant to which GGP has agreed to provide some of these services to us on a transitional basis. These services, which will only be provided for a maximum of 18 months from the date of the spin-off, may not be sufficient to meet our needs and, after these agreements end, we may not be able to perform these services internally, replace these services at all or obtain these services at acceptable prices and terms.
Our historical combined financial information is not representative of the results we would have achieved as a stand-alone company and may not be a reliable indicator of our future results.
The historical combined financial information included herein does not reflect the financial condition, results of operations or cash flows we would have achieved as a stand-alone company during the periods presented or those we will achieve in the future.
We may not realize the benefits we anticipate from the spin-off, which may adversely affect our results of operations.
We may not realize the benefits that we anticipated from our spin-off from GGP. These benefits include the following:
- •
- allowing our management to focus its efforts on our strategic plans and tailored initiatives for each of our properties;
- •
- enabling us to allocate our capital more efficiently and gain direct access to capital by adopting the capital structure
and investment policy best suited to our financial profile and business needs;
- •
- pursuing growth opportunities through redevelopment of existing properties or acquisition of new properties;
- •
- improving the tenant mix of our malls;
- •
- providing us with direct access to the debt and equity capital markets; and
- •
- enhancing our profile with customers in the markets we serve.
We may not achieve the anticipated benefits from the spin-off for a variety of reasons. For example, the process of operating as a newly independent public company may distract our management from focusing on our business and strategic priorities. If we do not realize the anticipated benefits from our spin-off for any reason, our business may be adversely affected.
18
Risks Related to our Common Stock Generally
The trading price of our common stock may fluctuate widely.
We cannot predict the prices at which our common stock may trade. The market price of our common stock may fluctuate widely, depending upon many factors, some of which may be beyond our control, including:
- •
- our quarterly or annual earnings, or those of other comparable companies;
- •
- actual or anticipated fluctuations in our operating results and other factors related to our business;
- •
- announcements by us or our competitors of significant acquisitions or dispositions;
- •
- the failure of securities analysts to cover our common stock;
- •
- the operating and stock price performance of other comparable companies;
- •
- our ability to implement our business strategy;
- •
- our tax payments;
- •
- our ability to raise capital;
- •
- overall market fluctuations; and
- •
- general economic conditions.
Future sales of our shares could depress the market price of our Common Stock.
The market price of our common stock could decline as a result of sales of a large number of shares of our common stock in the market or the perception that these sales could occur. These sales, or the possibility that these sales may occur, also might make it more difficult for us to sell equity securities in the future at a time and at a price that we deem appropriate. As of March 26, 2012, approximately 48.88 million shares of our common stock are outstanding. All such shares will be freely tradable without restriction under the U.S. Securities Act of 1933, as amended (the "Securities Act") except for any such shares held at any time by any of our "affiliates," as such term is defined under Rule 144 promulgated under the Securities Act. Pursuant to a registration rights agreement we entered into with Brookfield, we will agree that upon Brookfield's request we will use our commercially reasonable efforts to effect a registration under applicable federal and state securities laws for shares of our common stock held by Brookfield. Brookfield is not subject to any lock-up agreements or any other contractual agreements not to dispose of our shares. Any disposition by Brookfield, or any of our substantial shareholders, of our common stock in the public market, or the perception that such dispositions could occur, could adversely affect prevailing market prices of our common stock.
Compliance with changing regulation of corporate governance and public disclosure may result in additional expenses.
Changing laws, regulations and standards relating to corporate governance and public disclosure, including the Sarbanes-Oxley Act and the Dodd-Frank Act, are creating uncertainty for companies such as ours. We are committed to maintaining high standards of corporate governance and public disclosure. As a result, we intend to invest reasonably necessary resources to comply with evolving standards, and this investment may result in increased general and administrative expenses and a diversion of management time and attention from revenue-generating activities to compliance activities, which could harm our business prospects.
19
Our substantial stockholder may exert influence over us that may be adverse to our best interests and those of our other stockholders.
Brookfield's consortium beneficially owns approximately 54.38% of our common stock (based on their publicly reported holdings). The concentration of ownership of our outstanding common stock held by our substantial stockholder may make some transactions more difficult or impossible without the support of some or all of these investors. The interests of our substantial stockholder, or any of its affiliates could conflict with or differ from the interests of our other stockholders. For example, the concentration of ownership held by the substantial stockholder, even if they are not acting in a coordinated manner, could allow them to influence our policies and strategy and could delay, defer or prevent a change of control or impede a merger, takeover or other business combination that may otherwise be favorable to us and our other stockholders. A substantial stockholder or affiliate thereof may also pursue acquisition opportunities that may be complementary to our business, and as a result, those acquisition opportunities may not be available to us.
Following the recently completed rights offering, Brookfield's consortium's ownership of our common stock increased to more than 50%, as a result of this, the Company is eligible to avail itself of exemptions relating to the independence of the board of directors and certain board committees, for NYSE purposes, including requirements that: (1) a majority of the board of directors consist of independent directors; (2) compensation of officers be determined or recommended to the board of directors by a majority of its independent directors or by a compensation committee that is composed entirely of independent directors; and (3) director nominees be selected or recommended by a majority of the independent directors or by a nominating committee composed solely of independent directors. As of March 27, 2012, the Company had not elected to avail itself of these exemptions for NYSE purposes. In addition, Brookfield's consortium is able to control virtually all matters requiring stockholder approval, including the election of our directors.
Brookfield has agreed that it will not, in connection with a merger, combination, sale of all or substantially all of our assets or other similar business combination transaction involving Rouse Properties, convert, sell, exchange, transfer or convey any shares of common stock that are owned, directly or indirectly, by it on terms that are more favorable than those available to all other holders of common stock. This restriction does not, however, limit Brookfield's ability to sell its shares of common stock to a third party at a higher price in circumstances other than the foregoing transactions.
CAUTIONARY STATEMENT REGARDING FORWARD-LOOKING STATEMENTS
This Annual Report contains forward looking statements that are subject to risks and uncertainties. Forward looking statements give our current expectations relating to our financial condition, results of operations, plans, objectives, future performance and business. You can identify forward looking statements by the fact that they do not relate strictly to current or historical facts. These statements may include words such as "anticipate," "estimate," "expect," "project," "forecast," "plan," "intend," "believe," "may," "should," "would," "could," "likely," and other words of similar expression.
Forward looking statements should not be unduly relied upon. They give our expectations about the future and are not guarantees. These statements involve known and unknown risks, uncertainties and other factors that may cause our actual results, performance and achievements to materially differ from any future results, performance and achievements expressed or implied by such forward looking statements. We caution you, therefore, not to rely on these forward looking statements.
In this Annual Report, for example, we make forward looking statements discussing our expectations about:
- •
- future repositioning and redevelopment opportunities;
20
- •
- expectations of our revenues, income, FFO, Core FFO, NOI, Core NOI, capital expenditures, income tax and other contingent
liabilities, dividends, leverage, capital structure or other financial items;
- •
- future liquidity; and
- •
- future management plans.
Factors that could cause actual results to differ materially from those expressed or implied by the forward looking statements include:
- •
- our limited operating history as an independent company;
- •
- our inability to obtain operating and development capital;
- •
- our inability to reposition and redevelop some of our properties;
- •
- adverse economic conditions in the retail sector;
- •
- our inability to lease or release space in our properties;
- •
- the inability of our tenants to pay minimum rents and expense recovery charges and the impact of co-tenancy
provisions in our leases;
- •
- our inability to sell real estate quickly and restrictions on transfer;
- •
- our inability to compete effectively;
- •
- our significant indebtedness;
- •
- the adverse effect of inflation;
- •
- our inability to qualify for or maintain our status as a REIT;
- •
- our new directors and officers may change our current long-range plans;
- •
- our inability to establish our own financial, administrative and other support functions to operate as a stand-alone
business and loss of operational efficiency we had as a part of GGP; and
- •
- the other risks described in "Risk Factors."
These forward looking statements present our estimates and assumptions only as of the date of this Annual Report. Except as may be required by law, we undertake no obligation to modify or revise any forward looking statements to reflect events or circumstances occurring after the date of this Annual Report.
ITEM 1B. UNRESOLVED STAFF COMMENTS
None.
21
Our investment in real estate as of December 31, 2011 consisted of our interests in the properties in our portfolio. We generally own the land underlying properties; however, at certain of our properties, all or part of the underlying land is owned by a third party that leases the land to us pursuant to a long-term ground lease. The leases generally contain various purchase options and typically provide us with a right of first refusal in the event of a proposed sale of the property by the landlord. Information regarding encumbrances on our properties is included in Schedule III of this Annual Report.
The following sets forth certain information regarding our retail properties as of December 31, 2011:
| |
|
|
GLA | |
|
||||||||||||
|---|---|---|---|---|---|---|---|---|---|---|---|---|---|---|---|---|---|
Property Count
|
Name of Center | Location(1) | Total | Mall and Freestanding |
Anchors | Anchor Stores Vacancies |
|||||||||||
| Arizona | |||||||||||||||||
| 1 | The Mall At Sierra Vista | Sierra Vista, AZ | 365,973 | 169,481 | Cinemark, Dillard's, Sears | — | |||||||||||
California |
|||||||||||||||||
| 2 | Bayshore Mall | Eureka, CA | 612,991 | 392,733 | Bed Bath & Beyond, Kohl's, Sears | — | |||||||||||
| 3 | Chula Vista Center | Chula Vista (San Diego), CA | 875,873 | 320,141 | Burlington Coat Factory, JCPenney, Macy's, Sears, Ultrstar Cinemas | — | |||||||||||
| 4 | Newpark Mall | Newark (San Francisco), CA | 1,113,327 | 372,453 | JCPenney, Macy's, Sears, Target, Burlington Coat Factory | 1 | |||||||||||
| 5 | Southland Mall Ca | Hayward, CA | 1,262,625 | 524,729 | JCPenney, Macy's, Sears, Kohl's | — | |||||||||||
| 6 | West Valley Mall | Tracy (San Francisco), CA | 884,673 | 536,383 | JCPenney, Movies 14, Macy's, Sears, Target | — | |||||||||||
Florida |
|||||||||||||||||
| 7 | Lakeland Square | Lakeland (Orlando), FL | 885,410 | 275,372 | Burlington Coat Factory, Dillard's Men's & Home, JCPenney, Macy's, Sears | 1 | |||||||||||
Idaho |
|||||||||||||||||
| 8 | Silver Lake Mall | Coeur D' Alene, ID | 321,243 | 148,990 | JCPenney, Macy's, Sears, Timberline Trading Company | — | |||||||||||
Illinois |
|||||||||||||||||
| 9 | Spring Hill Mall | West Dundee (Chicago), IL | 1,165,515 | 483,935 | Carson Pirie Scott, Home Furniture Mart, JCPenney, Kohl's, Macy's, Sears | 1 | |||||||||||
Louisiana |
|||||||||||||||||
| 10 | Mall St Vincent | Shreveport, LA | 532,862 | 184,862 | Dillard's, Sears | — | |||||||||||
| 11 | Pierre Bossier Mall | Bossier City, LA | 612,059 | 218,761 | Dillard's, JCPenney, Sears, Stage | — | |||||||||||
Michigan |
|||||||||||||||||
| 12 | Birchwood Mall | Port Huron, MI | 725,171 | 299,037 | GKC Theaters, JCPenney, Macy's, Sears, Target, Younkers | — | |||||||||||
| 13 | Lansing Mall | Lansing, MI | 834,812 | 443,642 | JCPenney, Macy's, T.J. Maxx, Younkers, Best Buy, Barnes & Noble | 1 | |||||||||||
| 14 | Southland Center | Taylor, MI | 903,210 | 320,173 | Best Buy, JCPenney, Macy's | 1 | |||||||||||
| 15 | Westwood Mall | Jackson, MI | 507,859 | 136,171 | Elder-Beerman, JCPenney, Wal-Mart | — | |||||||||||
22
| |
|
|
GLA | |
|
||||||||||||
|---|---|---|---|---|---|---|---|---|---|---|---|---|---|---|---|---|---|
Property Count
|
Name of Center | Location(1) | Total | Mall and Freestanding |
Anchors | Anchor Stores Vacancies |
|||||||||||
Minnesota |
|||||||||||||||||
| 16 | Knollwood Mall | St. Louis Park (Minneapolis), MN | 464,619 | 383,935 | Cub Foods, Keith's FurnitureOutlet, Kohl's, T.J. Maxx | — | |||||||||||
Nevada |
|||||||||||||||||
| 17 | The Boulevard Mall | Las Vegas, NV | 1,178,507 | 390,471 | JCPenney, Macy's, Sears | — | |||||||||||
New Hampshire |
|||||||||||||||||
| 18 | Steeplegate Mall | Concord, NH | 482,463 | 226,116 | The Bon Ton, JCPenney, Sears | — | |||||||||||
New Mexico |
|||||||||||||||||
| 19 | Animas Valley Mall | Farmington, NM | 464,101 | 275,284 | Allen Theaters, Dillard's, JCPenney, Ross Dress For Less, Sears | — | |||||||||||
| 20 | North Plains Mall | Clovis, NM | 303,188 | 109,107 | Beall's, Dillard's, JCPenney, Sears | — | |||||||||||
North Carolina |
|||||||||||||||||
| 21 | Valley Hills Mall | Hickory, NC | 933,668 | 322,152 | Belk, Dillard's, JCPenney, Sears | — | |||||||||||
Ohio |
|||||||||||||||||
| 22 | Colony Square Mall | Zanesville, OH | 492,030 | 284,152 | Cinemark, Elder-Beerman, JCPenney, Sears | — | |||||||||||
Oklahoma |
|||||||||||||||||
| 23 | Washington Park Mall | Bartlesville, OK | 356,691 | 162,395 | Dillard's, JCPenney, Sears | — | |||||||||||
Oregon |
|||||||||||||||||
| 24 | Gateway Mall | Springfield, OR | 818,381 | 486,713 | Cabela's, Cinemark 17, Kohl's, Movies 12, Oz Fitness, Ross Dress For Less, Sears, Target | — | |||||||||||
Texas |
|||||||||||||||||
| 25 | Collin Creek | Plano, TX | 1,020,138 | 327,887 | Amazing Jakes, Dillard's, JCPenney, Macy's, Sears | — | |||||||||||
| 26 | Sikes Senter | Wichita Falls, TX | 667,345 | 292,655 | Dillard's, JCPenney, Sears, Sikes Ten | — | |||||||||||
| 27 | Vista Ridge Mall | Lewisville (Dallas), TX | 1,061,181 | 390,971 | Cinemark, Dillard's, JCPenney, Macy's, Sears | — | |||||||||||
Utah |
|||||||||||||||||
| 28 | Cache Valley Mall | Logan, UT | 497,587 | 170,799 | Dillard's, Dillard's Men's & Home, JCPenney | — | |||||||||||
Washington |
|||||||||||||||||
| 29 | Three Rivers Mall | Kelso, WA | 419,477 | 226,244 | JCPenney, Macy's, Sears | 1 | |||||||||||
Wyoming |
|||||||||||||||||
| 30 | White Mountain Mall | Rock Springs, WY | 303,663 | 209,181 | Flaming Gorge Harley Davidson, Herberger's, JCPenney, State of Wyoming | — | |||||||||||
| 21,066,642 | 9,084,925 | ||||||||||||||||
- (1)
- In certain cases, where a center is located in part of a larger regional metropolitain area, the metropolitain area is identified in parenthesis.
Property Operating Data
For the year ended December 31, 2011, none of our properties accounted for more than 10% of our total combined assets and none of our properties accounted for more than 10% of our total combined gross revenue.
23
Operating Metrics
The following table sets forth our occupancy rates and the average in-place annual gross rental rate per square foot as of December 31 for each of the last five years. In 2011, the difference between expiring rental rates and new rental rates has been unfavorable, driven primarily by leases approved prior to 2011 that commenced in the 2011 fiscal year. In addition, current market rents are below expiring rents for the coming fiscal year.
Year End
|
Mall & Freestanding GLA |
Leased GLA | Occupancy(1) | Average In-Place Gross Rent per square foot Less than 10,000 square feet(2)(3) |
Average In-Place Gross Rent per square foot greater than 10,000 square feet(3)(4) |
Average Effective In-Place Gross Rent per square foot for anchors(5) |
|||||||||||||
|---|---|---|---|---|---|---|---|---|---|---|---|---|---|---|---|---|---|---|---|
2007 |
9,186,647 | 8,605,380 | 93.7 | % | $ | 39.88 | $ | 9.44 | $ | 4.32 | |||||||||
2008 |
9,144,576 | 8,320,291 | 91.0 | % | $ | 40.54 | $ | 9.10 | $ | 4.02 | |||||||||
2009 |
9,083,253 | 8,085,081 | 89.0 | % | $ | 39.51 | $ | 9.56 | $ | 3.89 | |||||||||
2010 |
9,065,852 | 7,996,849 | 88.2 | % | $ | 39.74 | $ | 9.58 | $ | 4.05 | |||||||||
2011 |
9,084,925 | 7,967,699 | 87.7 | % | $ | 38.71 | $ | 10.97 | $ | 4.16 | |||||||||
- (1)
- Occupancy
represents contractual obligations for space in regional malls and excludes traditional anchor stores.
- (2)
- Represents
permanent tenants with spaces less than 10,000 square feet.
- (3)
- Rent
is presented on a cash basis and consists of base minimum rent, common area costs, and real estate taxes. The average in-place gross rent
per square foot calculation includes the terms of each lease as in effect at the time of the calculation, including any tenant concessions that may have been granted.
- (4)
- Represents
permanent tenants with spaces in excess of 10,000 square feet, but excludes traditional anchors.
- (5)
- Represents traditional anchor tenants.
2011 Leasing Activity(1)(2)
Lease Type
|
# of Leases |
Square Feet |
Term | |||||||
|---|---|---|---|---|---|---|---|---|---|---|
New Leases |
111 | 449,113 | 7.7 | |||||||
Renewal Leases |
251 | 880,322 | 3.1 | |||||||
Total New/Renewal Leases |
362 | 1,329,435 | 4.8 | |||||||
Total Expirations |
378 |
1,297,619 |
n/a |
|||||||
- (1)
- Represents
signed leases as of December 31, 2011 commencing in 2011
- (2)
- Represents signed leases for regional malls and excludes traditional anchor stores
24
Lease Expirations(1)
The table below sets forth lease expiration data for all of our properties:
Year
|
Number of Expiring Leases |
Expiring GLA |
Percent of Total |
Expiring Effective Gross Rent per square foot(2)(3) |
|||||||||
|---|---|---|---|---|---|---|---|---|---|---|---|---|---|
Specialty Leasing(4) |
428 | 1,234,611 | 15.5 | % | $ | 9.23 | |||||||
2012 |
398 | 1,051,236 | 13.2 | % | $ | 37.36 | |||||||
2013 |
286 | 1,033,913 | 13.0 | % | $ | 31.09 | |||||||
2014 |
296 | 1,047,007 | 13.1 | % | $ | 33.15 | |||||||
2015 |
180 | 629,809 | 7.9 | % | $ | 34.48 | |||||||
2016 |
169 | 598,490 | 7.5 | % | $ | 35.56 | |||||||
2017 |
105 | 433,046 | 5.4 | % | $ | 46.32 | |||||||
2018 |
65 | 331,072 | 4.2 | % | $ | 41.70 | |||||||
2019 |
50 | 363,279 | 4.6 | % | $ | 26.97 | |||||||
2020 |
36 | 221,052 | 2.8 | % | $ | 28.85 | |||||||
Subsequent |
93 | 1,024,184 | 12.8 | % | $ | 17.25 | |||||||
Total |
2,106 | 7,967,699 | 100.0 | % | $ | 27.91 | |||||||
- (1)
- Represents
contractual obligations for space in regional malls and excludes traditional anchor stores.
- (2)
- Excluded
from the expiring rate calculation are 240, or approximately 10%, of our leases that pay percentage rates. These are excluded from the calculation
because these percentage rental rates are based on the tenant's future sales volume which is variable in nature and cannot be projected.
- (3)
- Rent
is presented on a cash basis and consists of base minimum rent, common area costs, and real estate taxes. The average effective gross rent per square
foot calculation includes the terms of each lease in effect at the time of the calculation, including any tenant concessions that may have been granted.
- (4)
- Specialty Leasing refers to arrangements with tenants on license agreements, as opposed to lease agreements, with initial terms in excess of 12 months. These license agreements are cancelable by us with 60 days notice.
Mortgage and Other Debt
Our ownership interests in real property are materially important as a whole; however, as described above, we do not own any individual materially important property based on book value or gross revenue for 2011 and therefore do not present a description of our title to, or other interest in, our properties and the nature and amount of our mortgages in such properties.
Legal Proceedings
In the ordinary course of our business, we are from time to time involved in legal proceedings related to the ownership and operations of our properties. We are not currently involved in any legal or administrative proceedings that we believe are likely to have a materially adverse effect on our business, results of operations or financial condition.
ITEM 4. MINE SAFETY DISCLOSURES
Not applicable.
25
ITEM 5. MARKET FOR REGISTRANT'S COMMON EQUITY, RELATED STOCKHOLDER MATTERS AND ISSUER PURCHASES OF EQUITY SECURITIES
Our common stock is listed on the NYSE under the symbol "RSE." Our common stock began "regular way" trading on January 13, 2012. The following table presents the high and low sales prices for our common stock on the NYSE for the fourth quarter beginning on December 28, 2011, the date that our common stock began "when-issued" trading on the NYSE.
| |
Stock Price | ||||||
|---|---|---|---|---|---|---|---|
| |
High | Low | |||||
2011: |
|||||||
Fourth Quarter (since December 28, 2011) |
$ | 14.00 | $ | 10.25 | |||
As of March 26, 2012, there were 2,063 holders of record of our common stock.
There were no dividends declared or paid during the year ended December 31, 2011. We plan to elect to be treated as a REIT in connection with the filing of our first tax return and intend to maintain this status in future periods. A REIT must pay tax on or distribute 100% of its capital gains and distribute 90% of its ordinary taxable income to its stockholders in order to maintain its REIT status. A REIT will avoid entity level federal tax if it distributes 100% of its capital gains and ordinary taxable income. To avoid current entity level U.S. federal income taxes, we plan to distribute 100% of our capital gains and ordinary income to our stockholders annually. We have no present intention to pay any dividends on our common stock in the future other than in order to maintain our REIT status and to avoid current entity level U.S. federal income taxes, which dividends our board of directors may decide to pay in the form of cash, common stock or a combination of cash and common stock.
On August 10, 2011, we issued 100 shares of our common stock to GGP Limited Partnership, our parent company at the time. The shares were issued in a private placement exempt from registration pursuant to 4(2) of the Securities Act.
On January 12, 2012, in connection with the restructuring transactions relating to, and as part of the consideration for, the spin-off, we issued 359,056 shares of our Class B common stock, par value $0.01 per share to GGP LP. The Class B common stock was issued in a private placement exempt from registration pursuant to Section 4(2) of the Securities Act of 1933, as amended.
26
ITEM 6. SELECTED FINANCIAL DATA
The following table sets forth the selected historical combined financial and other data of our business, which was carved-out from the financial information of GGP, as described below. We were formed for the purpose of holding certain assets and assuming certain liabilities of GGP. Prior to the completion of the spin-off, we did not conduct any business and did not have any material assets or liabilities. In April 2009, GGP's predecessor and certain of its domestic subsidiaries filed voluntary petitions for relief under Chapter 11 of Title II of the United States Code ("Chapter 11"). On November 9, 2010 (the "Effective Date"), GGP emerged from Chapter 11 bankruptcy after receiving a significant equity infusion from investors and other associated events. As a result of the emergence from bankruptcy and the related equity infusion, the majority of equity in GGP changed ownership, which triggered the application of acquisition accounting to the assets and liabilities of GGP. As a result, the application of acquisition accounting has been applied to the assets and liabilities of the 30 wholly-owned properties that were spun-off on January 12, 2012 ("RPI Businesses") and therefore the following tables have been presented separately for Predecessor and Successor for the year ended December 31, 2010. See Note 1 to our combined financial statements included elsewhere in this Annual Report for additional detail. The selected historical financial data set forth below as of December 31, 2011, 2010 and 2009 and for the years ended December 31, 2011, 2010 and 2009 has been derived from our audited combined financial statements. The selected historical combined financial data as of December 31, 2008 and 2007 and for the year ended December 31, 2007 has been derived from our unaudited combined financial statements.
Our combined financial statements were carved-out from the financial information of GGP at a carrying value reflective of such historical cost in such GGP records. Our historical financial results reflect allocations for certain corporate expenses which include, but are not limited to, costs related to property management, human resources, security, payroll and benefits, legal, corporate communications, information services and restructuring and reorganization. Costs of the services that were allocated or charged to us were based on either actual costs incurred or a proportion of costs estimated to be applicable to us based on a number of factors, most significantly our percentage of GGP's adjusted revenue and assets and the number of properties. We believe these allocations are reasonable; however, these results do not reflect what our expenses would have been had we been operating as a separate stand-alone public company. For the year ended December 31, 2011, the corporate cost allocation was $10.7 million. The corporate cost allocations for the period from November 10, 2010 through December 31, 2010 and the period from January 1, 2010 through November 9, 2010 were $1.7 million and $6.7 million, respectively. For the years ended 2009, 2008 and 2007 the allocations were $7.3 million, $6.6 million and $9.6 million, respectively. Effective with the spin-off, we assumed responsibility for all of these functions and related costs and anticipate our costs as a stand-alone entity will be higher than those allocated to us from GGP. The historical combined financial information presented are not indicative of the results of operations, financial position or cash flows that would have been obtained if we had been an independent, stand-alone entity during the periods shown. See "Management's Discussion and Analysis of Financial Condition and Results of Operations—Overview—Basis of Presentation."
The historical results set forth below do not indicate results expected for any future periods. The selected financial data set forth below are qualified in their entirety by, and should be read in conjunction with, "Management's Discussion and Analysis of Financial Condition and Results of
27
Operations" and our combined financial statements and related notes thereto included elsewhere in this Annual Report.
| |
Historical | ||||||||||||||||||
|---|---|---|---|---|---|---|---|---|---|---|---|---|---|---|---|---|---|---|---|
| |
Successor | Successor | Predecessor | ||||||||||||||||
| |
Year Ended December 31, |
November 10 - December 31 |
January 1 - November 9 |
Year Ended December 31, |
Year Ended December 31, |
Year Ended December 31, |
|||||||||||||
| |
2011 | 2010 | 2009 | 2008 | 2007 | ||||||||||||||
| |
(In thousands) |
||||||||||||||||||
Operating Data: |
|||||||||||||||||||
Total revenues |
$ | 234,816 | $ | 35,540 | $ | 219,741 | $ | 276,232 | $ | 308,756 | $ | 321,058 | |||||||
Depreciation and amortization |
(78,216 | ) | (11,019 | ) | (53,413 | ) | (74,193 | ) | (67,689 | ) | (70,689 | ) | |||||||
Provisions for impairment |
— | — | — | (81,854 | ) | (5,941 | ) | (388 | ) | ||||||||||
Other operating expenses |
(112,095 | ) | (16,912 | ) | (88,739 | ) | (110,060 | ) | (110,042 | ) | (114,228 | ) | |||||||
Operating income |
44,505 | 7,609 | 77,589 | 10,125 | 125,084 | 135,753 | |||||||||||||
Interest (expense) income, net |
(70,948 | ) | (10,393 | ) | (88,598 | ) | (72,071 | ) | (75,527 | ) | (75,039 | ) | |||||||
Reorganization items |
— | — | (9,515 | ) | 32,671 | — | — | ||||||||||||
Provision for income taxes |
(533 | ) | (82 | ) | (506 | ) | (877 | ) | (467 | ) | (173 | ) | |||||||
Net (loss) income |
$ | (26,976 | ) | $ | (2,866 | ) | $ | (21,030 | ) | $ | (30,152 | ) | $ | 49,090 | $ | 60,541 | |||
Cash Flow Data: |
|||||||||||||||||||
Operating activities |
$ | 80,723 | $ | 7,365 | $ | 41,103 | $ | 85,708 | $ | 113,894 | $ | 128,173 | |||||||
Investing activities |
(25,370 | ) | (14,300 | ) | (9,248 | ) | (8,218 | ) | (21,309 | ) | (37,842 | ) | |||||||
Financing activities |
(56,965 | ) | 2,333 | (25,786 | ) | (77,497 | ) | (92,459 | ) | (90,311 | ) | ||||||||
Other Financial Data: |
|||||||||||||||||||
NOI(1) |
$ | 135,577 | $ | 20,644 | $ | 137,687 | $ | 177,925 | $ | 205,528 | $ | 216,427 | |||||||
Core NOI(1) |
154,865 | 24,357 | 137,136 | 177,537 | 206,300 | 212,290 | |||||||||||||
FFO(2) |
51,240 | 8,153 | 32,383 | 125,895 | 122,720 | 131,618 | |||||||||||||
Core FFO(2) |
83,910 | 13,251 | 71,517 | 91,764 | 122,789 | 126,248 | |||||||||||||
| |
Historical | |||||||||||||||
|---|---|---|---|---|---|---|---|---|---|---|---|---|---|---|---|---|
| |
Successor | Successor | Predecessor | |||||||||||||
| |
|
December 31, | ||||||||||||||
| |
December 31, 2011 |
|||||||||||||||
| |
2010 | 2009 | 2008 | 2007 | ||||||||||||
| |
(In thousands) |
|||||||||||||||
Investments in real estate, cost(3) |
$ | 1,462,482 | $ | 1,434,197 | $ | 2,181,029 | $ | 2,315,686 | $ | 2,298,070 | ||||||
Total assets |
1,583,524 | 1,644,264 | 1,722,045 | 1,874,167 | 1,923,640 | |||||||||||
Mortgage, notes and loans payable(4) |
1,059,684 | 1,216,820 | 1,314,829 | 1,418,589 | 1,310,321 | |||||||||||
Total liabilities |
1,157,196 | 1,314,402 | 1,366,058 | 1,469,431 | 1,366,013 | |||||||||||
Total equity |
426,328 | 329,862 | 355,987 | 404,737 | 557,628 | |||||||||||
- (1)
- NOI and Core NOI do not represent income from operations as defined by GAAP. We use NOI and Core NOI as supplemental measures of our operating performance. For our definition of NOI and Core NOI, as well as a discussion of their uses and inherent limitations, see "Real Estate Property Net Operating Income and Core Net Operating Income" below.
28
- (2)
- FFO
and Core FFO do not represent cash flow from operations as defined by GAAP. We use FFO and Core FFO as a supplemental measure of our operating
performance. For a definition of FFO and Core FFO as well as a discussion of its uses and inherent limitations see "Funds from Operations and Core Funds from Operations" below.
- (3)
- Includes
the application of acquisition accounting at GGP's emergence in November 2010, and excludes accumulated depreciation for all periods presented. At
emergence, the balance of the "Investments in real estate—cost" reflected the fair value of these assets (see Note 3 in the combined financial statements.)
- (4)
- Total debt includes $58.0 million, $67.7 million, $46.7 million, $(4.5) million and $(5.8) million of non-cash market rate adjustments at December 31, 2011, 2010, 2009, 2008 and 2007, respectively.
Real Estate Property Net Operating Income and Core Net Operating Income
We present NOI and Core NOI, as defined below, in this Annual Report as supplemental measures of our performance that are not required by, or presented in accordance with, accounting principles generally accepted in the United States of America ("GAAP"). We believe that NOI and Core NOI are useful supplemental measures of our operating performance. We define NOI as operating revenues (rental income, including lease termination fees, tenant recoveries and other income) less property and related expenses (real estate taxes, operating costs, repairs and maintenance, marketing and other property expenses). We define Core NOI as NOI excluding straight-line rent, amortization of above and below-market tenant leases. Other real estate companies may use different methodologies for calculating NOI and Core NOI, and accordingly, our NOI and Core NOI may not be comparable to other real estate companies.
Because NOI and Core NOI exclude general and administrative expenses, interest expense, impairment or other non-recoverable development costs, depreciation and amortization, reorganization items, strategic initiatives, provision for income taxes, straight-line rent, above and below-market tenant leases, we believe that NOI and Core NOI provide performance measures that, when compared year over year, reflect the revenues and expenses directly associated with owning and operating regional shopping malls and the impact on operations from trends in occupancy rates, rental rates and operating costs. These measures thereby provide an operating perspective not immediately apparent from GAAP operating or net income. We use NOI and Core NOI to evaluate our operating performance on a property-by-property basis because NOI and Core NOI allow us to evaluate the impact that factors such as lease structure, lease rates and tenant base, which vary by property, have on our operating results, gross margins and investment returns.
In addition, management believes that NOI and Core NOI provide useful information to the investment community about our operating performance. However, due to the exclusions noted above, NOI and Core NOI should only be used as supplemental measures of our financial performance and not as an alternative to GAAP operating income (loss) or net income (loss). For reference, and as an aid in understanding management's computation of NOI and Core NOI, a reconciliation of NOI and
29
Core NOI to combined operating income as computed in accordance with GAAP has been presented below.
| |
Historical | ||||||||||||||||||
|---|---|---|---|---|---|---|---|---|---|---|---|---|---|---|---|---|---|---|---|
| |
Successor | Successor | Predecessor | ||||||||||||||||
| |
Year Ended December 31, |
November 10 - December 31 |
January 1 - November 9 |
Year Ended December 31, |
Year Ended December 31, |
Year Ended December 31, |
|||||||||||||
| |
2011 | 2010 | 2009 | 2008 | 2007 | ||||||||||||||
| |
(In thousands) |
|
|
||||||||||||||||
Reconciliation of Core NOI and NOI to operating income: |
|||||||||||||||||||
Core NOI |
$ | 154,865 | $ | 24,357 | $ | 137,136 | $ | 177,537 | $ | 206,300 | $ | 212,290 | |||||||
Amortization of straight-line rent |
6,031 | 98 | (137 | ) | (80 | ) | 595 | 1,429 | |||||||||||
Above- and below-market tenant leases, net |
(25,194 | ) | (3,793 | ) | 688 | 468 | (1,367 | ) | 2,708 | ||||||||||
Above- and below-market ground rent expense, net |
(125 | ) | (18 | ) | — | — | — | — | |||||||||||
NOI |
135,577 | 20,644 | 137,687 | 177,925 | 205,528 | 216,427 | |||||||||||||
Property management and other costs |
(11,330 | ) | (1,703 | ) | (6,669 | ) | (7,282 | ) | (6,601 | ) | (9,597 | ) | |||||||
Other |
(1,526 | ) | (313 | ) | (16 | ) | — | — | — | ||||||||||
Strategic initiatives |
— | — | — | (4,471 | ) | (213 | ) | — | |||||||||||
Provision for impairment |
— | — | — | (81,854 | ) | (5,941 | ) | (388 | ) | ||||||||||
Depreciation and amortization |
(78,216 | ) | (11,019 | ) | (53,413 | ) | (74,193 | ) | (67,689 | ) | (70,689 | ) | |||||||
Operating Income |
$ | 44,505 | $ | 7,609 | $ | 77,589 | $ | 10,125 | $ | 125,084 | $ | 135,753 | |||||||
Funds from Operations and Core Funds from Operations
Consistent with real estate industry and investment community practices, we use FFO, as defined by the National Association of Real Estate Investment Trusts ("NAREIT"), as a supplemental measure of our operating performance. NAREIT defines FFO as net income (loss) (computed in accordance with current GAAP), excluding impairment write-downs on depreciable real estate, gains or losses from cumulative effects of accounting changes, extraordinary items and sales of depreciable properties, plus real estate related depreciation and amortization. We also include Core FFO as a supplemental measurement of operating performance. We define Core FFO as FFO excluding straight-line rent, amortization of above-and below-market tenant leases, net, amortization of above-and below-market ground rent expense, net, reorganization items, interest expense related to extinguished debt, mark-to-market adjustments on debt, debt extinguishment costs, provision for income taxes and depreciation and amortization of capitalized real estate costs. Other real estate companies may use different methodologies for calculating FFO and Core FFO, and accordingly, our FFO and Core FFO may not be comparable to other real estate companies.
We consider FFO and Core FFO useful supplemental measures and a complement to GAAP measures because it facilitates an understanding of the operating performance of our properties. FFO does not include real estate depreciation and amortization required by GAAP because these amounts are computed to allocate the cost of a property over its useful life. Since values for well-maintained real estate assets have historically increased or decreased based upon prevailing market conditions, we believe that FFO provides investors with a clearer view of our operating performance, particularly with respect to our rental properties. Core FFO does not include certain items that are non-cash and certain non-comparable items. FFO and Core FFO are not measurements of our financial performance under GAAP and should not be considered as an alternative to revenues, operating income (loss), net income (loss) or any other performance measures derived in accordance with GAAP or as an alternative to cash flows from operating activities as a measure of our liquidity.
30
For reference, and as an aid in understanding management's computation of FFO and Core FFO, a reconciliation of FFO and Core FFO to net (loss) income has been presented below:
| |
Historical | ||||||||||||||||||
|---|---|---|---|---|---|---|---|---|---|---|---|---|---|---|---|---|---|---|---|
| |
Successor | Successor | Predecessor | ||||||||||||||||
| |
Year Ended December 31, |
November 10 - December 31 |
January 1 - November 9 |
Year Ended December 31, |
Year Ended December 31, |
Year Ended December 31, |
|||||||||||||
| |
2011 | 2010 | 2009 | 2008 | 2007 | ||||||||||||||
| |
(In thousands) |
|
|
||||||||||||||||
Reconciliation of Core FFO and FFO to net loss: |
|||||||||||||||||||
Core FFO |
$ | 83,910 | $ | 13,251 | $ | 71,517 | $ | 91,764 | $ | 122,789 | $ | 126,248 | |||||||
Amortization of straight-line rent |
6,031 | 98 | (137 | ) | (80 | ) | 595 | 1,429 | |||||||||||
Above- and below-market tenant leases, net |
(25,194 | ) | (3,793 | ) | 688 | 468 | (1,367 | ) | 2,708 | ||||||||||
Above- and below-market ground rent expense, net |
(125 | ) | (18 | ) | — | — | — | — | |||||||||||
Reorganization items |
— | — | (9,515 | ) | 32,671 | — | — | ||||||||||||
Mark-to-market adjustments on debt |
(11,323 | ) | (990 | ) | (29,648 | ) | 1,949 | 1,170 | 1,406 | ||||||||||
Other |
(1,526 | ) | (313 | ) | (16 | ) | — | — | — | ||||||||||
Provision for income taxes |
(533 | ) | (82 | ) | (506 | ) | (877 | ) | (467 | ) | (173 | ) | |||||||
FFO |
51,240 | 8,153 | 32,383 | 125,895 | 122,720 | 131,618 | |||||||||||||
Depreciation and amortization of capitalized real estate costs |
(78,216 | ) | (11,019 | ) | (53,413 | ) | (74,193 | ) | (67,689 | ) | (70,689 | ) | |||||||
Provision for impairment |
— | — | — | (81,854 | ) | (5,941 | ) | (388 | ) | ||||||||||
Net (loss) income |
$ | (26,976 | ) | $ | (2,866 | ) | $ | (21,030 | ) | $ | (30,152 | ) | $ | 49,090 | $ | 60,541 | |||
31
ITEM 7. MANAGEMENT'S DISCUSSION AND ANALYSIS OF FINANCIAL CONDITION AND RESULTS OF OPERATIONS
This section contains forward-looking statements that involve risks and uncertainties. Our actual results may vary materially from those discussed in the forward-looking statements as a result of various factors, including, without limitation, those set forth in "Risk Factors" and the matters set forth in this Annual Report. See "Cautionary Statement Regarding Forward-Looking Statements."
All references to numbered Notes are to specific footnotes to our combined financial statements for the years ended December 31, 2011, 2010 and 2009, as applicable, included in this Annual Report. You should read this discussion in conjunction with our combined financial statements, the notes thereto and other financial information included elsewhere in this Annual Report. Our financial statements are prepared in accordance with GAAP. Capitalized terms used, but not defined, in this Management's Discussion and Analysis of Financial Condition and Results of Operations ("MD&A") have the same meanings as in such Notes.
Overview—Introduction
Our portfolio consists of 30 regional malls in 19 states totaling over 21 million square feet of retail and ancillary space. We plan to elect to be treated as a REIT in connection with the filing of our first tax return, subject to meeting the requirements of a REIT at the time of election, and intend to maintain this status in future periods.
The majority of the income from our properties is derived from rents received through long-term leases with retail tenants. These long-term leases generally require the tenants to pay base rent which is a fixed amount specified in the lease. The base rent is often subject to scheduled increases during the term of the lease. Our financial statements refer to this as "minimum rents." Certain of our leases also include a component which requires tenants to pay amounts related to all or substantially all of their share of real estate taxes and certain property operating expenses, including common area maintenance and insurance. The revenue earned attributable to real estate tax and operating expense recoveries are recorded as "tenant recoveries." Another component of income is overage rent. Overage rent is paid by a tenant when its sales exceed an agreed upon minimum amount. Overage rent is calculated by multiplying the tenant's sales in excess of the minimum amount by a percentage defined in the lease, the majority of which is typically earned in the fourth quarter.
Our objective is to achieve high growth in NOI, Core NOI, FFO and Core FFO (as defined below) by leasing, operating and repositioning retail properties with locations that are either market dominant (the only mall within an extended distance to service the trade area) or trade area dominant (positioned to be the premier mall serving the defined regional consumer). We plan to control costs and to deliver an appropriate tenant mix, higher occupancy rates and increased sales productivity, resulting in higher minimum rent.
NOI is defined as income from property operations after operating expenses have been deducted, but prior to deducting depreciation, financing, administrative and income tax expenses. Core NOI is defined as NOI excluding straight-line rent, amortization of above and below-market tenant leases and amortization of above and below market ground rent expense. FFO is defined as net income (loss) in accordance with GAAP, excluding impairment write-downs on depreciable assets, gains (or losses) from cumulative effects of accounting changes, extraordinary items and sales of properties, plus real estate related depreciation and amortization.
32
We believe that the most significant operating factor affecting incremental cash flow, NOI, Core NOI, FFO and Core FFO is increased rents earned from tenants at our properties. These rental revenue increases are primarily achieved by:
- •
- Renewing expiring leases and re-leasing existing space at rates higher than expiring or existing rates;
- •
- Increasing occupancy at the properties so that more space is generating rent;
- •
- Increasing tenant sales in which we participate through overage rent;
and
- •
- Prudently investing capital into our properties.
Overview—Basis of Presentation
We were formed in August 2011 for the purpose of holding certain assets and assuming certain liabilities of GGP. Following the distribution of these assets and liabilities to us on January 12, 2012, we began operating our business as a stand-alone owner and operator of regional malls. The financial information included in this Annual Report was carved-out from the financial information of GGP, has been presented on a combined basis as the entities presented are under common control and ownership, and reflects the allocation of certain overhead items within property management and other costs in the accompanying combined financial statements.
In April 2009, GGP filed voluntary petitions for relief under Chapter 11. On the Effective Date, GGP emerged from Chapter 11 bankruptcy after receiving a significant equity infusion from investors and other associated events. As a result of the emergence from bankruptcy and the related equity infusion, the majority of equity in GGP changed ownership, which triggered the application of acquisition accounting to the assets and liabilities of GGP. As a result, the application of acquisition accounting has been applied to the assets and liabilities of Rouse Properties and therefore the financial results presented in this MD&A have been presented separately for the Predecessor and Successor for the year ended December 31, 2010. See Note 1 for additional detail.
The historical combined financial information included in this Annual Report does not necessarily reflect the financial condition, results of operations or cash flows that we would have achieved as a separate, publicly-traded company during the periods presented or those that we will achieve in the future primarily as a result of the following factors:
- •
- Prior to the spin-off, our business was operated by GGP as part of its broader corporate organization, rather
than as a separate, stand-alone company. GGP or its affiliates performed various corporate functions for us, including, but not limited to, property management, human resources, security, payroll and
benefits, legal, corporate communications, information services and restructuring and reorganization. Costs of the services that were allocated or charged to us were based on either actual costs
incurred or a proportion of costs estimated to be applicable to us based on a number of factors, most significantly our percentage of GGP's adjusted revenue and assets and the number of properties.
Our historical financial results reflect allocations for certain corporate costs and we believe such allocations are reasonable; however, such results do not reflect what our expenses would have been
had we been operating as a separate, stand-alone public company.
- •
- Prior to the spin-off, portions of our business were integrated with the other businesses of GGP. Historically, we have shared economies of scope and scale in costs, employees, vendor relationships and certain customer relationships. We entered into a transition services agreement with GGP that governs certain commercial and other relationships. These contractual arrangements may not capture the benefits our business has enjoyed as a result of being integrated with GGP and the transition services will only be provided for a limited period of
33
time. The loss of these benefits of scope and scale may have an adverse effect on our business, results of operations and financial condition.
Results of Operations
To provide a more meaningful comparison between annual periods, we have aggregated the Predecessor results for 2010 with the Successor 2010 results. The Successor 2010 results reflect the application of acquisition accounting; therefore, the combined results will not be indicative of the results of operations in the Predecessor and Successor periods had they been presented consistently. Our revenues are primarily received from tenants in the form of fixed minimum rents, overage rents and tenant recoveries.
Year Ended December 31, 2011 and 2010
Summary of NOI to Core NOI to operating income
We present NOI and Core NOI in this Annual Report as supplemental measures of our performance that are not required by, or presented in accordance with, GAAP. See "Selected Financial Data" for a discussion of our use of NOI and Core NOI and reconciliations of Core NOI to NOI and NOI to operating income.
34
The following table compares items within NOI and Core NOI and provides a reconciliation from Core NOI to NOI and NOI to operating income:
| |
2011 | 2010 | |
|
|||||||||||||||
|---|---|---|---|---|---|---|---|---|---|---|---|---|---|---|---|---|---|---|---|
| |
Successor | Predecessor | |
|
|
||||||||||||||
| |
Year Ended December 31, |
Period from November 10 through December 31, |
Period from January 1 through November 9, |
Year Ended December 31, |
$ Change | % Change | |||||||||||||
| |
(In thousands) |
||||||||||||||||||
Property revenues: |
|||||||||||||||||||
Minimum rents |
$ | 153,431 | $ | 22,751 | $ | 147,403 | $ | 170,154 | $ | (16,723 | ) | (9.8 | )% | ||||||
Tenant recoveries |
69,606 | 9,498 | 64,387 | 73,885 | (4,279 | ) | (5.8 | ) | |||||||||||
Overage rents |
5,442 | 1,736 | 2,862 | 4,598 | 844 | 18.4 | |||||||||||||
Other |
6,337 | 1,555 | 5,089 | 6,644 | (307 | ) | (4.6 | ) | |||||||||||
Total property revenues |
234,816 | 35,540 | 219,741 | 255,281 | (20,465 | ) | (8.0 | ) | |||||||||||
Property operating expenses: |
|||||||||||||||||||
Real estate taxes |
23,465 | 3,046 | 20,595 | 23,641 | (176 | ) | (0.7 | ) | |||||||||||
Property maintenance costs |
13,462 | 2,017 | 10,517 | 12,534 | 928 | 7.4 | |||||||||||||
Marketing |
4,061 | 1,383 | 2,356 | 3,739 | 322 | 8.6 | |||||||||||||
Other property operating costs |
57,650 | 8,072 | 46,333 | 54,405 | 3,245 | 6.0 | |||||||||||||
Provision for doubtful accounts |
601 | 378 | 2,253 | 2,631 | (2,030 | ) | (77.2 | ) | |||||||||||
Total property operating expenses |
99,239 | 14,896 | 82,054 | 96,950 | 2,289 | 2.4 | |||||||||||||
NOI |
$ | 135,577 | $ | 20,644 | $ | 137,687 | $ | 158,331 | $ | (22,754 | ) | (14.4 | )% | ||||||
NOI |
$ | 135,577 | $ | 20,644 | $ | 137,687 | $ | 158,331 | $ | (22,754 | ) | (14.4 | )% | ||||||
Non-cash components of minimum rent |
|||||||||||||||||||
Amortization of straight-line rent |
(6,031 | ) | (98 | ) | 137 | 39 | (6,070 | ) | (15,564.1 | ) | |||||||||
Above- and below-market tenant leases, net |
25,194 | 3,793 | (688 | ) | 3,105 | 22,089 | 711.4 | ||||||||||||
Above- and below-market ground rent expense, net |
125 | 18 | — | 18 | 107 | 594.4 | |||||||||||||
Total non-cash components of minimum rent |
19,288 | 3,713 | (551 | ) | 3,162 | 16,126 | 510.0 | ||||||||||||
Core NOI |
$ | 154,865 | $ | 24,357 | $ | 137,136 | $ | 161,493 | $ | (6,628 | ) | (4.1 | )% | ||||||
Core NOI |
$ | 154,865 | $ | 24,357 | $ | 137,136 | $ | 161,493 | $ | (6,628 | ) | (4.1 | )% | ||||||
Amortization of straight-line rent |
6,031 | 98 | (137 | ) | (39 | ) | 6,070 | (15,564.1 | ) | ||||||||||
Above- and below-market tenant leases, net |
(25,194 | ) | (3,793 | ) | 688 | (3,105 | ) | (22,089 | ) | 711.4 | |||||||||
Above- and below-market ground rent expense, net |
(125 | ) | (18 | ) | — | (18 | ) | (107 | ) | 594.4 | |||||||||
NOI |
135,577 | 20,644 | 137,687 | 158,331 | (22,754 | ) | (14.4 | ) | |||||||||||
Property management and other costs |
(11,330 | ) | (1,703 | ) | (6,669 | ) | (8,372 | ) | (2,958 | ) | 35.3 | ||||||||
Other |
(1,526 | ) | (313 | ) | (16 | ) | (329 | ) | (1,197 | ) | 363.8 | ||||||||
Depreciation and amortization |
(78,216 | ) | (11,019 | ) | (53,413 | ) | (64,432 | ) | (13,784 | ) | 21.4 | ||||||||
Operating income |
$ | 44,505 | $ | 7,609 | $ | 77,589 | $ | 85,198 | $ | (40,693 | ) | (47.8 | )% | ||||||
Minimum rents include base minimum rents, percent-in-lieu rents, termination income and non-cash revenues such as straight-line rent and amortization of above- and below-market tenant leases. Minimum rents decreased $16.7 million for the year ended December 31, 2011 compared to 2010 primarily due to a $22.1 million increase in above-and below-market rent amortization, which was partially offset by a $6.1 million decrease in straight-line rent, reflecting the impact of the application of the acquisition method of accounting in the fourth quarter of 2010.
Tenant recoveries decreased $4.3 million for the year ended December 31, 2011 primarily due to the conversion of certain tenants to gross leases.
Overage rents increased $0.8 million for the year ended December 31, 2011 primarily due to increased tenant sales in 2011.
Property maintenance costs increased $0.9 million for the year ended December 31, 2011 primarily due to increased spending on mall upkeep, including equipment and supplies and increased snow removal.
Marketing expense increased $0.3 million for the year ended December 31, 2011 primarily due to increased marketing efforts related to internal, external and national advertising.
35
Other property operating costs increased $3.2 million for the year ended December 31, 2011 primarily due to a $1.6 million favorable adjustment in 2010 related to the final settlements of the termination of utility contracts that were subject to compromise and a $0.6 million increase in electric expenses compared to the prior year and $0.4 million increase in contract services for cleaning, landscapers, and professional services.
The provision for doubtful accounts decreased $2.0 million for the year ended December 31, 2011 primarily due to improved collections of outstanding accounts receivable in the year ended December 31, 2011 in addition to the higher allowances in the same period of 2010 related to tenant bankruptcies and weaker economic conditions.
Summary of NOI to FFO and Core FFO
We present FFO and Core FFO in this Annual Report as a supplemental measure of our performance that is not required by, or presented in accordance with, GAAP. See "Selected Financial Data" for a discussion of our use of FFO and a reconciliation of net loss to FFO . The following table reconciles NOI, FFO and Core FFO with net loss:
| |
2011 | 2010 | |
|
|||||||||||||||
|---|---|---|---|---|---|---|---|---|---|---|---|---|---|---|---|---|---|---|---|
| |
Successor | Predecessor | |
|
|
||||||||||||||
| |
Year Ended December 31, |
Period from November 10 through December 31, |
Period from January 1 through November 9, |
Year Ended December 31, |
$ Change | % Change | |||||||||||||
| |
(in thousands) |
||||||||||||||||||
NOI |
$ | 135,577 | $ | 20,644 | $ | 137,687 | $ | 158,331 | $ | (22,754 | ) | (14.4 | )% | ||||||
Property management and other costs |
(11,330 | ) | (1,703 | ) | (6,669 | ) | (8,372 | ) | (2,958 | ) | 35.3 | ||||||||
Other |
(1,526 | ) | (313 | ) | (16 | ) | (329 | ) | (1,197 | ) | 363.8 | ||||||||
Depreciation and amortization |
(78,216 | ) | (11,019 | ) | (53,413 | ) | (64,432 | ) | (13,784 | ) | 21.4 | ||||||||
Operating income |
44,505 | 7,609 | 77,589 | 85,198 | (40,693 | ) | (47.8 | ) | |||||||||||
Interest income |
36 | 1 | 56 | 57 | (21 | ) | (36.8 | ) | |||||||||||
Interest expense |
(70,984 | ) | (10,394 | ) | (88,654 | ) | (99,048 | ) | 28,064 | (28.3 | ) | ||||||||
Provision for income taxes |
(533 | ) | (82 | ) | (506 | ) | (588 | ) | 55 | (9.4 | ) | ||||||||
Reorganization items |
— | — | (9,515 | ) | (9,515 | ) | 9,515 | (100.0 | ) | ||||||||||
Net loss |
(26,976 | ) | (2,866 | ) | (21,030 | ) | (23,896 | ) | (3,080 | ) | 12.9 | ||||||||
Depreciation and amortization of capitalized real estate costs |
78,216 | 11,019 | 53,413 | 64,432 | 13,784 | 21.4 | |||||||||||||
FFO |
51,240 | 8,153 | 32,383 | 40,536 | 10,704 | 26.4 | |||||||||||||
Amortization of straight-line rent |
(6,031 | ) | (98 | ) | 137 | 39 | (6,070 | ) | (15,564.1 | ) | |||||||||
Above- and below-market tenant leases, net |
25,194 | 3,793 | (688 | ) | 3,105 | 22,089 | 711.4 | ||||||||||||
Above- and below-market ground rent expense, net |
125 | 18 | — | 18 | 107 | 594.4 | |||||||||||||
Reorganization items |
— | — | 9,515 | 9,515 | (9,515 | ) | (100.0 | ) | |||||||||||
Mark-to-market adjustments on debt |
11,323 | 990 | 29,648 | 30,638 | (19,315 | ) | (63.0 | ) | |||||||||||
Other |
1,526 | 313 | 16 | 329 | 1,197 | 363.8 | |||||||||||||
Provision for income taxes |
533 | 82 | 506 | 588 | (55 | ) | (9.4 | ) | |||||||||||
Core FFO |
$ | 83,910 | $ | 13,251 | $ | 71,517 | $ | 84,768 | $ | (858 | ) | (1.0 | )% | ||||||
Property management and other costs increased $2.3 million for the year ended December 31, 2011 due to an increase in overhead costs allocated to the properties due to GGP having fewer properties to allocate expenses to in 2011 compared to 2010, without a corresponding decrease in such overhead costs.
Other expenses increased $1.2 million for the year ended December 31, 2011 primarily due to professional and audit fees related to the distribution and rights offering.
Depreciation and amortization increased $13.8 million for the year ended December 31, 2011 primarily due to the impact of the application of the acquisition method of accounting in the fourth quarter of 2010.
Net interest expense decreased $28.0 million for the year ended December 31, 2011 primarily due to a $19.3 million decrease of amortization of the market rate adjustments related to the fair value of debt and a $7.8 million decrease in mortgage interest expense primarily due to the repayment of debt for Mall St. Vincent and Southland Center on April 25, 2011 and Gateway Mall on June 1, 2011.
36
Reorganization items under the bankruptcy filings are expense or income items that were incurred or realized in connection with the bankruptcy of GGP. These items include professional fees and similar types of expenses incurred that are directly related to the bankruptcy filings, gains or losses resulting from activities of the reorganization process, including gains related to recording the mortgage debt at fair value upon emergence from bankruptcy and interest earned on cash accumulated by GGP. Bankruptcy-related items incurred after the Effective Date are reported within other expense.
Year Ended December 31, 2010 and 2009
Summary of NOI to Core NOI to operating income
| |
|
2010 | |
2009 | |
|
|||||||||||||
|---|---|---|---|---|---|---|---|---|---|---|---|---|---|---|---|---|---|---|---|
| |
Successor | Predecessor | |
Predecessor | |
|
|||||||||||||
| |
Period from November 10 through December 31, |
Period from January 1 through November 9, |
Year Ended December 31, |
Year Ended December 31, |
$ Change | % Change | |||||||||||||
| |
|
|
(in thousands) |
|
|
||||||||||||||
Property revenues: |
|||||||||||||||||||
Minimum rents |
$ | 22,751 | $ | 147,403 | $ | 170,154 | $ | 184,330 | $ | (14,176 | ) | (7.7 | )% | ||||||
Tenant recoveries |
9,498 | 64,387 | 73,885 | 80,511 | (6,626 | ) | (8.2 | ) | |||||||||||
Overage rents |
1,736 | 2,862 | 4,598 | 4,406 | 192 | 4.4 | |||||||||||||
Other |
1,555 | 5,089 | 6,644 | 6,985 | (341 | ) | (4.9 | ) | |||||||||||
Total property revenues |
35,540 | 219,741 | 255,281 | 276,232 | (20,951 | ) | (7.6 | ) | |||||||||||
Property operating expenses: |
|||||||||||||||||||
Real estate taxes |
3,046 | 20,595 | 23,641 | 24,590 | (949 | ) | (3.9 | ) | |||||||||||
Property maintenance costs |
2,017 | 10,517 | 12,534 | 12,269 | 265 | 2.2 | |||||||||||||
Marketing |
1,383 | 2,356 | 3,739 | 3,452 | 287 | 8.3 | |||||||||||||
Other property operating costs |
8,072 | 46,333 | 54,405 | 55,337 | (932 | ) | (1.7 | ) | |||||||||||
Provision for doubtful accounts |
378 | 2,253 | 2,631 | 2,659 | (28 | ) | (1.1 | ) | |||||||||||
Total property operating expenses |
14,896 | 82,054 | 96,950 | 98,307 | (1,357 | ) | (1.4 | ) | |||||||||||
NOI |
$ | 20,644 | $ | 137,687 | $ | 158,331 | $ | 177,925 | $ | (19,594 | ) | (11.0 | )% | ||||||
NOI |
$ | 20,644 | $ | 137,687 | $ | 158,331 | $ | 177,925 | $ | (19,594 | ) | (11.0 | )% | ||||||
Non-cash components of minimum rent |
|||||||||||||||||||
Amortization of straight-line rent |
(98 | ) | 137 | 39 | 80 | (41 | ) | (51.3 | ) | ||||||||||
Above- and below-market tenant leases, net |
3,793 | (688 | ) | 3,105 | (468 | ) | 3,573 | (763.5 | ) | ||||||||||
Above- and below-market ground rent expense, net |
18 | — | 18 | — | 18 | 100.0 | |||||||||||||
Total non-cash components of minimum rent |
3,713 | (551 | ) | 3,162 | (388 | ) | 3,550 | (915.0 | ) | ||||||||||
Core NOI |
$ | 24,357 | $ | 137,136 | $ | 161,493 | $ | 177,537 | $ | (16,044 | ) | (9.0 | )% | ||||||
Core NOI |
$ | 24,357 | $ | 137,136 | $ | 161,493 | $ | 177,537 | $ | (16,044 | ) | (9.0 | )% | ||||||
Amortization of straight-line rent |
98 | (137 | ) | (39 | ) | (80 | ) | 41 | (51.3 | ) | |||||||||
Above- and below-market tenant leases, net |
(3,793 | ) | 688 | (3,105 | ) | 468 | (3,573 | ) | (763.5 | ) | |||||||||
Above- and below-market ground rent expense, net |
(18 | ) | — | (18 | ) | — | (18 | ) | (100.0 | ) | |||||||||
NOI |
20,644 | 137,687 | 158,331 | 177,925 | (19,594 | ) | (11.0 | ) | |||||||||||
Property management and other costs |
(1,703 | ) | (6,669 | ) | (8,372 | ) | (7,282 | ) | (1,090 | ) | 15.0 | ||||||||
General and administrative |
(313 | ) | (16 | ) | (329 | ) | — | (329 | ) | 100.0 | |||||||||
Strategic initiatives |
— | — | — | (4,471 | ) | 4,471 | (100.0 | ) | |||||||||||
Provision for impairment |
— | — | — | (81,854 | ) | 81,854 | (100.0 | ) | |||||||||||
Depreciation and amortization |
(11,019 | ) | (53,413 | ) | (64,432 | ) | (74,193 | ) | 9,761 | (13.2 | ) | ||||||||
Operating income |
$ | 7,609 | $ | 77,589 | $ | 85,198 | $ | 10,125 | $ | 75,073 | 741.5 | % | |||||||
37
Minimum rents include base minimum rents, percent-in-lieu rents, termination income and non-cash revenues such as straight-line rent and amortization of above- and below-market tenant leases. Minimum rents decreased $14.2 million for the year ended December 31, 2010 compared to 2009 primarily due to a $8.8 million decrease in long-term tenant revenues, a $1.7 million decrease in temporary rental revenues, and a $3.6 million decrease in above- and below-market rent amortization reflecting the impact of the application of the acquisition method of accounting in the fourth quarter of 2010. In addition, termination income decreased $0.7 million to $0.9 million for the year ended December 31, 2010 compared to $1.6 million for the year ended December 31, 2009. These decreases were partially offset by a $1.0 million increase in percent in lieu income.
Tenant recoveries for the year ended December 31, 2010 as compared to the year ended December 31, 2009 decreased $6.6 million primarily due to the conversion of certain tenants to gross leases. In addition, recoveries related to marketing and promotional revenue decreased $0.8 million for the year ended December 31, 2010 compared to the year ended December 31, 2009.
Real estate taxes decreased $0.9 million for the year ended December 31, 2010 primarily due to significant savings at two properties.
Other property operating costs decreased $0.9 million due to a decrease in utility expense at three properties, and was partially offset by an increase in landscaping, cleaning and security costs.
38
Summary of NOI to FFO and Core FFO
| |
|
2010 | |
2009 | |
|
|||||||||||||
|---|---|---|---|---|---|---|---|---|---|---|---|---|---|---|---|---|---|---|---|
| |
Successor | Predecessor | |
Predecessor | |
|
|||||||||||||
| |
Period from November 10 through December 31, |
Period from January 1 through November 9, |
Year Ended December 31, |
Year Ended December 31, |
$ Change | % Change | |||||||||||||
| |
|
|
(in thousands) |
|
|
||||||||||||||
NOI |
$ | 20,644 | $ | 137,687 | $ | 158,331 | $ | 177,925 | $ | (19,594 | ) | (11.0 | )% | ||||||
Property management and other costs |
(1,703 | ) | (6,669 | ) | (8,372 | ) | (7,282 | ) | (1,090 | ) | 15.0 | ||||||||
Other |
(313 | ) | (16 | ) | (329 | ) | — | (329 | ) | — | |||||||||
Strategic initiatives |
— | — | — | (4,471 | ) | 4,471 | (100.0 | ) | |||||||||||
Provisions for impairment |
— | — | — | (81,854 | ) | 81,854 | (100.0 | ) | |||||||||||
Depreciation and amortization |
(11,019 | ) | (53,413 | ) | (64,432 | ) | (74,193 | ) | 9,761 | (13.2 | ) | ||||||||
Operating income |
7,609 | 77,589 | 85,198 | 10,125 | 75,073 | 741.5 | |||||||||||||
Interest income |
1 | 56 | 57 | 18 | 39 | 216.7 | |||||||||||||
Interest expense |
(10,394 | ) | (88,654 | ) | (99,048 | ) | (72,089 | ) | (26,959 | ) | 37.4 | ||||||||
Provision for income taxes |
(82 | ) | (506 | ) | (588 | ) | (877 | ) | 289 | (33.0 | ) | ||||||||
Reorganization items |
— | (9,515 | ) | (9,515 | ) | 32,671 | (42,186 | ) | (129.1 | ) | |||||||||
Net loss |
(2,866 | ) | (21,030 | ) | (23,896 | ) | (30,152 | ) | 6,256 | (20.8 | ) | ||||||||
Depreciation and amortization of capitalized real estate costs |
11,019 | 53,413 | 64,432 | 74,193 | (9,761 | ) | (13.2 | ) | |||||||||||
Provisions for impairment |
— | — | — | 81,854 | (81,854 | ) | (100.0 | ) | |||||||||||
FFO |
$ | 8,153 | $ | 32,383 | $ | 40,536 | $ | 125,895 | $ | (85,359 | ) | $ | (67.8 | )% | |||||
Amortization of straight-line rent |
(98 | ) | 137 | 39 | 80 | (41 | ) | (51.3 | ) | ||||||||||
Above- and below-market tenant leases, net |
3,793 | (688 | ) | 3,105 | (468 | ) | 3,573 | (763.5 | ) | ||||||||||
Above- and below-market ground rent expense, net |
18 | — | 18 | — | 18 | 100.0 | |||||||||||||
Reorganization items |
— | 9,515 | 9,515 | (32,671 | ) | 42,186 | (129.1 | ) | |||||||||||
Mark-to-market adjustments on debt |
990 | 29,648 | 30,638 | (1,949 | ) | 32,587 | (1,672.0 | ) | |||||||||||
Other |
313 | 16 | 329 | — | 329 | 100.0 | |||||||||||||
Provision for income taxes |
82 | 506 | 588 | 877 | (289 | ) | (33.0 | ) | |||||||||||
Core FFO |
$ | 13,251 | $ | 71,517 | $ | 84,768 | $ | 91,764 | $ | (6,996 | ) | (7.6 | )% | ||||||
Property management and other costs increased $1.1 million for the year ended December 31, 2010 primarily due to an increase in overhead costs allocated to the properties.
Strategic initiatives for the year ended December 31, 2009 is primarily due to the allocation of professional fees for restructuring that were incurred prior to filing for Chapter 11 protection. Similar fees incurred after filing for Chapter 11 protection are recorded as reorganization items.
Other for the year ended December 31, 2010 included the reversal of previously accrued bankruptcy costs and gains on settlements, which were partially offset by post-emergence costs.
We recorded impairment charges of $81.9 million for the year ended December 31, 2009 due to the results of our evaluations for impairment. These impairment charges consisted of $75.8 million related to five operating properties, $4.7 million related to goodwill and $1.4 million related to the write-off of non-recoverable development costs as certain previously planned or proposed projects terminated in 2009.
The decrease in depreciation and amortization of $9.8 million primarily resulted from the decrease in the carrying amount of building and equipment due to the impairment charges recorded in 2009.
39
Net interest expense increased $27.0 million for the year ended December 31, 2010 primarily due to the amortization of the market rate adjustments related to the fair value of debt upon the emergence of certain GGP properties from Chapter 11.
Reorganization items changed $42.2 million for the year ended December 31, 2010 compared to 2009. Professional fees and other expenses related to the bankruptcy increased $29.1 million for the year ended December 31, 2010 as the Plan was developed and finalized. In addition, gains recognized subject to compromise decreased $13.6 million as properties emerged from bankruptcy in 2009 and 2010.
Liquidity and Capital Resources
Our primary uses of cash include payment of operating expenses, working capital, debt repayment, including principal and interest, reinvestment in properties, development and redevelopment of properties, tenant allowance, dividends and restructuring costs.
Our primary sources of cash are operating cash flow, borrowings under our senior revolving credit facility, borrowings under our subordinated revolving credit facility as described under "—Financings" below and the proceeds of our recently completed rights offering.
The successful execution of our business strategy will require the availability of substantial amounts of operating and development capital both initially and over time. Sources of such capital could include bank, life insurance company, pension plan or institutional investor borrowings, public and private offerings of debt or equity, sale of certain assets and joint ventures. We have identified opportunities to invest significant capital to reposition and refresh certain of our properties, but we will sequence long-term redevelopment projects with leasing activity. We believe these capital investments will assist in increasing our revenues significantly and deliver solid net operating income growth over the medium term. For a discussion of factors that could have an impact on our ability to realize these goals, see "Risk Factors" and "Cautionary Statement Regarding Forward-Looking Statements."
As of December 31, 2011, our combined contractual debt, excluding non-cash debt market rate adjustments, was approximately $1.12 billion. The aggregate principal and interest payments on our outstanding indebtedness as of December 31, 2011 is approximately $82.8 million for the year ended 2012 and approximately $136.1 million for the year ended 2013.
On the date of the spin-off, after giving effect to the financings described below, our combined contractual debt, excluding non-cash debt market rate adjustments, was approximately $1.16 billion. The aggregate principal and interest payments on our outstanding indebtedness as of the spin-off was approximately $90.6 million for the year ended 2012 and approximately $146.8 million for the year ended 2013.
We believe that cash generated from operations, together with amounts available under our subordinated revolving credit facility and our recently completed rights offering will be sufficient to permit us to meet our debt service obligations, ongoing cost of operations, working capital needs, distribution requirements and capital expenditure requirements for at least the next 12 months. Our future financial and operating performance, ability to service or refinance our debt and ability to comply with the covenants and restrictions contained in our debt agreements will be subject to future economic conditions and to financial, business and other factors, many of which are beyond our control. See "Risk Factors" and "Cautionary Statement Regarding Forward-Looking Statements."
Financings
Senior Secured Credit Facility. On January 12, 2012, we entered into a three year senior secured credit facility with a syndicate of banks, as lenders, and Wells Fargo Bank, National Association, as administrative agent, and Wells Fargo Securities, LLC, RBC Capital Markets, LLC and U.S. Bank
40
National Association, as joint lead arrangers, that provides borrowings on a revolving basis of up to $50.0 million, and a senior secured term loan that has provided an advance of approximately $433.5 million. We used the proceeds of the term loan facility to refinance certain mortgage debt that was not assumed by us in connection with the spin-off and to pay other transaction fees and expenses. The senior secured credit facility has affirmative and negative covenants that are customary for a real estate loan, including, without limitation, restrictions on incurrence of indebtedness and liens on the mortgage collateral; restrictions on pledges; restrictions on subsidiary distributions; with respect to the mortgage collateral, limitations on our ability to enter into transactions including mergers, consolidations, sales of assets for less than fair market value and similar transactions; conduct of business; restricted distributions; transactions with affiliates; and limitation on speculative hedge agreements. In addition, we are required to comply with the following financial maintenance covenants: (1) net indebtedness to value ratio, (2) liquidity, (3) minimum fixed charge coverage ratio, (4) minimum tangible net worth, and (5) minimum portfolio debt yield. Failure to comply with the covenants in the senior secured credit facilities could result in a default under the credit agreement governing these facilities and, absent a waiver or an amendment from our lenders, permit the acceleration of all outstanding borrowings under the senior secured credit facilities and would cross-default our subordinated revolving credit facility. Any such default may result in the cross-default of our other indebtedness. See "Risk Factors—Our debt obligations and ability to comply with related covenants could impact our financial condition or future operating results."
Property-Level Debt. The debt on 13 of our 30 assets, representing approximately $725.6 million (excluding $49.1 million of market rate adjustments) has remained outstanding after the spin-off date (the "Assigned Debt"). The Assigned Debt has an average weighted interest rate of 5.33% and an average remaining term of four years. The Assigned Debt is stand-alone (not crossed-collateralized) first mortgage debt and is non-recourse with the exception of customary contingent guaranties/indemnities initially posted by GGP parent entities such as non-recourse carve-out guaranties and environmental indemnities, which we assumed as of the spin-off date.
Subordinated Revolving Credit Facility. On January 12, 2012, we entered into a subordinated unsecured revolving credit facility with a wholly-owned subsidiary of Brookfield (Trilon), that provides for borrowings on a revolving basis of up to $100.0 million. The subordinated facility does not have any affirmative covenants and has the following negative covenants: merger, consolidation and sale of all or substantially all assets; modifications of organizational documents; no adverse modifications to the facilities; and no refinancing or replacement of the facilities without Trilon's consent. There are cross-default provisions with the Senior Secured Facility. If the facilities are repaid or refinanced prior to the maturity of the subordinated facility, then the covenants (other than the covenants related to the mortgage collateral) from the facilities shall be incorporated by reference to the subordinated facility.
Unaudited Pro Forma Combined Financial Data
The following unaudited pro forma combined financial data has been developed by applying pro forma adjustments to the historical combined financial information which reflect the separation of Rouse Properties, Inc. from GGP. The unaudited pro forma combined balance sheet gives effect to the transactions described below as if they had occurred on December 31, 2011. The unaudited pro forma statement of operations gives effect to the transactions described below as if they had occurred on January 1, 2011. All significant pro forma adjustments and their underlying assumptions are described more fully in the notes to the unaudited pro forma combined financial data which should be read in conjunction with such unaudited pro forma combined financial information.
The unaudited pro forma combined financial data gives effect to the following:
- •
- the contribution from GGP to us of the assets and liabilities that comprise our business;
41
- •
- the issuance of approximately 35.54 million shares of our common stock and approximately 0.36 million shares
of our Class B common stock on the spin-off date. This number of shares is based upon the number of GGP shares and operating partnership units outstanding on the record date of the
spin-off and a distribution ratio of approximately 0.0375 shares of Rouse common stock for each GGP common share;
- •
- our post-separation capital structure which includes proceeds from the $200 million rights offering;
- •
- the impact of a transition services agreement between us and GGP and a services agreement between us and Brookfield and
the provisions contained therein; and
- •
- the leasing of corporate office space.
The unaudited pro forma combined financial data is not necessarily indicative of the results of operations or financial position that would have actually been reported had the transactions reflected in the pro forma adjustments occurred on January 1, 2011 or as of December 31, 2011, as applicable, nor is it indicative of our future results of operations or financial position.
Our combined financial statements were carved-out from the financial information of GGP. Our historical financial results reflect allocations for certain corporate expenses which include, but are not limited to, costs related to property management, human resources, security, payroll and benefits, legal, corporate communications, information services and restructuring and reorganization. Costs of the services that were allocated or charged to us were based on either actual costs incurred or a proportion of costs estimated to be applicable to us based on a number of factors, most significantly, our percentage of GGP's adjusted revenue and assets and the number of properties. We believe these allocations are reasonable; however, these results do not reflect what our expenses would have been had we been operating as a separate stand- alone public company. Effective with the separation, we assumed responsibility for all of these functions and related costs and anticipate our costs as a stand-alone entity will be higher than those allocated to us from GGP. No pro forma adjustments have been made to our financial statements to reflect the additional costs and expenses described in this paragraph because they are projected amounts based on judgmental estimates and, as such, are not includable as pro forma adjustments in accordance with the requirements of Rule 11-02 of Regulation S-X.
The unaudited pro forma combined financial data should be read in conjunction with the information contained in "Selected Financial Data" and the combined financial statements and related notes.
42
ROUSE PROPERTIES, INC.
UNAUDITED PRO FORMA COMBINED STATEMENT OF OPERATIONS
YEAR ENDED DECEMBER 31, 2011
| |
Historical | Adjustments | Footnotes | Total | ||||||||
|---|---|---|---|---|---|---|---|---|---|---|---|---|
| |
(In thousands) |
|||||||||||
Revenues: |
||||||||||||
Minimum rents |
$ | 153,431 | $ | — | $ | 153,431 | ||||||
Tenant recoveries |
69,606 | — | 69,606 | |||||||||
Overage rents |
5,442 | — | 5,442 | |||||||||
Other |
6,337 | — | 6,337 | |||||||||
Total revenues |
234,816 | — | 234,816 | |||||||||
Expenses: |
||||||||||||
Real estate taxes |
23,465 | — | 23,465 | |||||||||
Property maintenance costs |
13,462 | — | 13,462 | |||||||||
Marketing |
4,061 | — | 4,061 | |||||||||
Other property operating costs |
57,650 | — | 57,650 | |||||||||
Provision for doubtful accounts |
601 | — | 601 | |||||||||
Property management and other costs |
11,330 | 7,434 | (A) | 18,764 | ||||||||
Depreciation and amortization |
78,216 | — | 78,216 | |||||||||
Other |
1,526 | — | 1,526 | |||||||||
Total expenses |
190,311 | 7,434 | 197,745 | |||||||||
Operating income |
44,505 | (7,434 | ) | 37,071 | ||||||||
Interest income |
36 |
— |
36 |
|||||||||
Interest expense |
(70,984 | ) | (2,607 | ) | (B) | (73,591 | ) | |||||
Loss before income taxes |
(26,443 | ) | (10,041 | ) | (36,484 | ) | ||||||
Provision for income taxes |
(533 | ) | — | (533 | ) | |||||||
Net loss |
$ | (26,976 | ) | $ | (10,041 | ) | $ | (37,017 | ) | |||
Weighted average number of common shares—basic and diluted |
48,721 | |||||||||||
Basic and diluted loss per share |
(C) | $ | (0.76 | ) | ||||||||
43
ROUSE PROPERTIES, INC.
UNAUDITED PRO FORMA COMBINED BALANCE SHEET
AS OF DECEMBER 31, 2011
| |
Historical | Adjustments | Footnotes | Total | ||||||||
|---|---|---|---|---|---|---|---|---|---|---|---|---|
| |
(In thousands) |
|||||||||||
Assets: |
||||||||||||
Investment in real estate: |
||||||||||||
Land |
$ | 299,941 | $ | — | $ | 299,941 | ||||||
Buildings and equipment |
1,162,541 | — | 1,162,541 | |||||||||
Less accumulated depreciation |
(72,620 | ) | — | (72,620 | ) | |||||||
Net investment in real estate |
1,389,862 | — | 1,389,862 | |||||||||
Cash and cash equivalents |
204 | 200,737 | (D) | 200,941 | ||||||||
Accounts and notes receivable, net |
17,561 | — | 17,561 | |||||||||
Deferred expenses, net |
35,549 | 6,357 | (E) | 41,906 | ||||||||
Prepaid expenses and other assets |
140,348 | 9,143 | (D) | 149,491 | ||||||||
Total assets |
$ | 1,583,524 | $ | 216,237 | $ | 1,799,761 | ||||||
Liabilities: |
||||||||||||
Mortgages, notes and loans payable |
$ | 1,059,684 | $ | 50,280 | (D) | $ | 1,109,964 | |||||
Accounts payable and accrued expenses |
97,512 | (17,079 | ) | (F) | 80,433 | |||||||
Total liabilities |
1,157,196 | 33,201 | 1,190,397 | |||||||||
Equity: |
||||||||||||
GGP equity |
426,328 | 183,036 | (D) | 609,364 | ||||||||
Total liabilities and equity |
$ | 1,583,524 | $ | 216,237 | $ | 1,799,761 | ||||||
44
A. Property management and other costs:
Reflects adjustments for the year ended December 31, 2011 related to fees pursuant to the transition services agreement between Rouse and GGP as well as the services agreement between Rouse and Brookfield. The transition services agreement with GGP provides for various services to be provided to us by GGP, including accounting, asset management, development, human resources, information technology, leasing, legal, marketing, public reporting and tax. The charges for the services are estimated based on an hourly fee arrangement and pass-through of out-of-pocket costs. The services agreement with Brookfield provides for the lease of two of our executive officers on an interim basis. In addition, there is an adjustment related to fees pursuant to a lease agreement at current market rates between Rouse and Brookfield for corporate office space located in New York.
| |
For the year ended December 31, 2011 |
|||
|---|---|---|---|---|
Transition service agreement—GGP |
$ | 5,266 | ||
Transition service agreement—Brookfield |
1,056 | |||
Operating lease |
1,112 | |||
Property management and other costs |
$ | 7,434 | ||
B. Interest expense:
Reflects an adjustment of $2,607 for the year ended December 31, 2011 related to a $4,196 increase in interest expense due to the replacement of certain existing variable debt, $7,329 of amortization of deferred financing costs, mitigated by $(8,918) due to the write off of certain non-cash market rate debt adjustment. The new term loan has an interest rate equal to LIBOR plus 500 basis points. LIBOR is subject to a floor of 1%. The facility is being used primarily to pay down $392.1 million of existing debt that is primarily variable with an interest rate of LIBOR + 3.25%. The pro forma adjustment consisted of the new debt at an assumed 6% interest rate (1% LIBOR floor + 5%). Since LIBOR is approximately 0.30% at December 31, 2011 and below the LIBOR floor, we used 6% (1% floor + 5%) to calculate pro forma interest expense. If we had increased the effective interest rate to 61/8%, the pro forma interest expense would have increased $0.5 million for the year ended December 31, 2011.
C. Pro Forma Earnings and Earnings Per Share:
Reflects the historical number of GGP weighted average basic shares outstanding of 943,669,000 for the year ended December 31, 2011 based on a distribution ratio of approximately 0.0375 shares of Rouse common stock for each GGP common share. In addition, includes the issuance of approximately 13.33 million shares that were issued in the rights offering.
D. Capital Structure:
Reflects an adjustment of $200.0 million as of December 31, 2011 related to the proceeds of the rights offering / backstop commitment, net of $31.5 million in fees and expenses incurred in connection with the spin-off transaction and fees and expenses incurred in connection with the rights offering (these amounts include the preparation and negotiation of the Separation Agreement and related agreements, SEC filings and organization documents, and professional and loan assumption fees), and a $50.3 million increase to mortgages, notes and loans payable representing a new secured portfolio loan of $433.5 million less the pay down of $392.1 million of mortgages at 14 properties. In addition, reflects
45
an adjustment of $9.1 million related to an escrow designated for tenant allowance, lease commission and capital expenditure purposes.
| |
December 31, 2011 | |||
|---|---|---|---|---|
Rights offering and/or backstop commitment |
$ | 200,000 | ||
Backstop fees and expenses |
(6,100 | ) | ||
Third party offering costs and expenses |
(1,946 | ) | ||
Third party spin costs and expenses |
(23,436 | ) | ||
Mortgages, notes and loans payable |
41,362 | |||
Prepaid Expenses and other assets |
(9,143 | ) | ||
Cash and cash equivalents |
$ | 200,737 | ||
Rights offering and/or backstop commitment |
$ | 200,000 | ||
Backstop fees and expenses |
(6,100 | ) | ||
Market rate amortization |
(8,918 | ) | ||
Third party offering costs and expenses |
(1,946 | ) | ||
GGP Equity |
$ | 183,036 | ||
E. Deferred expenses:
Reflects an adjustment to record an additional $6.4 million of deferred financing costs associated to the term loan. Deferred financing costs of $15.6 million are reflected within the historical balance as of December 31, 2011.
F. Accounts payable and accrued expenses:
Reflects an adjustment to record the accrual of the third party spin costs and expenses that were recorded with the historical balance as of December 31, 2011 and paid on the spin date.
Summary of Cash Flows
Years Ended December 31, 2011, 2010 and 2009
Cash Flows from Operating Activities
Net cash provided by operating activities was $80.7 million for the year ended December 31, 2011, $7.4 million for the period from November 10, 2010 through December 31, 2010, $41.1 million for the period from January 1, 2010 through November 9, 2010 and $85.7 million for the year ended December 31, 2009.
Net cash (used in) provided by certain assets and liabilities, including accounts and notes receivable, prepaid expense and other assets, deferred expenses, restricted cash and accounts payable and accrued expenses totaled $(1.6) million for the year ended December 31, 2011, $(5.9) million for the period from November 10, 2010 through December 31, 2010, $(27.6) million for the period from January 1, 2010 through November 9, 2010 and $(12.4) million in 2009.
Cash Flows from Investing Activities
Net cash used in investing activities was $25.4 million for the year ended December 31, 2011, $14.3 million from November 10, 2010 through December 31, 2010, $9.2 million from January 1, 2010 through November 9, 2010 and $8.2 million for the year ended December 31, 2009. Cash used for acquisition/development of real estate and property additions/improvements was $25.2 million for the year ended December 31, 2011, $14.3 million from November 10, 2010 through December 31, 2010, $9.2 million from January 1, 2010 through November 9, 2010 and $8.3 million for the year ended December 31, 2009.
46
Cash Flows from Financing Activities
Net cash provided by (used in) financing activities was $(57.0) for the year ended December 31, 2011, $2.3 million from November 10, 2010 through December 31, 2010, $(25.8) million from January 1, 2010 through November 9, 2010 and $(77.5) million for the year ended December 31, 2009.
Principal payments were $168.4 million for the year ended December 31, 2011, $2.6 million from November 10, 2010 through December 31, 2010, and $44.8 million from January 1, 2010 through November 9, 2010 and $53.0 million during the year ended December 31, 2009.
Contractual Cash Obligations and Commitments
The following table aggregates our contractual cash obligations and commitments as of December 31, 2011:
| |
2012 | 2013 | 2014 | 2015 | 2016 | Subsequent | Total | |||||||||||||||
|---|---|---|---|---|---|---|---|---|---|---|---|---|---|---|---|---|---|---|---|---|---|---|
| |
(In thousands) |
|||||||||||||||||||||
Long-term debt-principal(1) |
$ | 28,410 | $ | 83,963 | $ | 289,195 | $ | 24,735 | $ | 528,409 | $ | 162,955 | $ | 1,117,667 | ||||||||
Interest payments(2) |
54,350 | 52,185 | 41,236 | 33,400 | 14,519 | 7,998 | 203,688 | |||||||||||||||
Operating lease obligations |
1,076 | 1,076 | 1,076 | 1,076 | 1,076 | 5,735 | 11,115 | |||||||||||||||
Total |
$ | 83,836 | $ | 137,224 | $ | 331,507 | $ | 59,211 | $ | 544,004 | $ | 176,688 | $ | 1,332,470 | ||||||||
- (1)
- Excludes
$58.0 million of non-cash debt market rate adjustments.
- (2)
- Based on rates as of December 31, 2011. Variable rates are based on LIBOR rate of 0.30%.
The following table aggregates our contractual cash obligations and commitments as of January 12, 2012, the date of the spin-off and the issuance of the debt facility described in "—Financings".
| |
2012 | 2013 | 2014 | 2015 | 2016 | Subsequent | Total | |||||||||||||||
|---|---|---|---|---|---|---|---|---|---|---|---|---|---|---|---|---|---|---|---|---|---|---|
| |
(In thousands) |
|||||||||||||||||||||
Long-term debt-principal(1) |
$ | 27,892 | $ | 85,463 | $ | 251,993 | $ | 417,275 | $ | 213,447 | $ | 162,959 | $ | 1,159,029 | ||||||||
Interest payments(2) |
62,739 | 61,295 | 51,630 | 22,576 | 7,090 | 7,998 | 213,328 | |||||||||||||||
Operating lease obligations |
1,076 | 1,076 | 1,076 | 1,076 | 1,076 | 5,735 | 11,115 | |||||||||||||||
Total |
$ | 91,707 | $ | 147,834 | $ | 304,699 | $ | 440,927 | $ | 221,613 | $ | 176,692 | $ | 1,383,472 | ||||||||
- (1)
- Excludes
$49.1 million of non-cash debt market rate adjustments.
- (2)
- Based on rates as of December 31, 2011. Variable rates are based on LIBOR rate of 0.30%.
In the normal course of business, from time to time, we are involved in legal proceedings relating to the ownership and operations of our properties. See "Business—Legal Proceedings."
We lease land or buildings at certain properties from third parties. The leases generally provide us with a right of first refusal in the event of a proposed sale of the property by the landlord. Rental payments are expensed as incurred and have, to the extent applicable, been straight-lined over the term of the lease.
Off-Balance Sheet Financing Arrangements
We do not have any off-balance sheet financing arrangements.
47
REIT Requirements
In order to qualify as a real estate investment trust for federal income tax purposes, among other requirements, we must distribute or pay tax on 100% of our capital gains and we must distribute at least 90% of our ordinary taxable income to stockholders. To avoid current entity level U.S. federal income taxes, we plan to distribute 100% of our capital gains and ordinary income to our stockholders annually. We may not have sufficient liquidity to meet these distribution requirements. We have no present intention to pay any dividends on our common stock in the future other than in order to maintain our REIT status, which dividends our board of directors may decide to pay in the form of cash, common stock or a combination of cash and common stock.
Seasonality
Although we have a year-long temporary leasing program, occupancies for short-term tenants and, therefore, rental income recognized, are higher during the second half of the year. In addition, the majority of our tenants have December or January lease years for purposes of calculating annual overage rent amounts. Accordingly, overage rent thresholds are most commonly achieved in the fourth quarter. As a result, revenue production is generally highest in the fourth quarter of each year.
Use of Estimates
The preparation of financial statements in conformity with accounting principles generally accepted in the United States of America requires management to make estimates and assumptions. These estimates and assumptions affect the reported amounts of assets and liabilities and the disclosure of contingent assets and liabilities at the date of the financial statements and the reported amounts of revenues and expenses during the reporting periods. For example, estimates and assumptions have been made with respect to fair values of assets and liabilities for purposes of applying the acquisition method of accounting, the useful lives of assets, capitalization of development and leasing costs, recoverable amounts of receivables, initial valuations and related amortization periods of deferred costs and intangibles, particularly with respect to acquisitions, impairment of long-lived assets, goodwill and fair value of debt. Actual results could differ from these and other estimates.
Critical Accounting Policies
Critical accounting policies are those that are both significant to the overall presentation of our financial condition and results of operations and require management to make difficult, complex or subjective judgments. Our critical accounting policies are those applicable to the following:
Acquisition Adjustments
The acquisition method of accounting has been applied to the assets and liabilities of the Successor to reflect GGP's plan of reorganization (the "Plan"). The acquisition method of accounting adjustments recorded on the Effective Date reflects the allocation of the estimated purchase price as presented in Note 3 to the audited combined financial statements. Such adjustments reflect the amounts required to adjust the carrying values of our assets and liabilities, after giving effect to the transactions pursuant to the Plan, to the fair values of such remaining assets and liabilities, with the offset to common equity, as provided by the acquisition method of accounting.
Impairment—Operating Properties, Intangible Assets and Developments in Progress
We review our real estate assets, including operating properties and developments in progress, for potential impairment indicators whenever events or changes in circumstances indicate that the carrying amount may not be recoverable.
48
Impairment indicators are assessed separately for each property and include, but are not limited to, significant decreases in real estate property net operating income, significant occupancy percentage changes, debt maturities and management's intent with respect to the assets.
Impairment indicators for pre-development costs, which are typically costs incurred during the beginning stages of a potential development, and developments in progress are assessed by project and include, but are not limited to, significant changes in projected completion dates, revenues or cash flows, development costs, market factors and sustainability of development projects.
If an indicator of potential impairment exists, the asset is tested for recoverability by comparing its carrying amount to the estimated future undiscounted operating cash flow. A real estate asset is considered to be impaired when its carrying amount cannot be recovered through estimated future undiscounted cash flows. To the extent an impairment provision is necessary, the excess of the carrying amount of the asset over its estimated fair value is expensed to operations. In addition, the impairment is allocated proportionately to adjust the carrying amount of the asset. The adjusted carrying amount, which represents the new cost basis of the asset, is depreciated over the remaining useful life of the asset.
Recoverable Amounts of Receivables
We make periodic assessments of the collectibility of receivables (including those resulting from the difference between rental revenue recognized and rents currently due from tenants) based on a specific review of the risk of loss on specific accounts or amounts. The receivable analysis places particular emphasis on past-due accounts and considers the nature and age of the receivables, the payment history and financial condition of the payee, the basis for any disputes or negotiations with the payee and other information which may impact collectibility. For straight-line rents receivable, the analysis considers the probability of collection of the unbilled deferred rent receivable given our experience regarding such amounts. The resulting estimates of any allowance or reserve related to the recovery of these items is subject to revision as these factors change and is sensitive to the effects of economic and market conditions on such payees.
Capitalization of Development and Leasing Costs
We capitalize the costs of development and leasing activities of our properties. The amount of capitalization depends, in part, on the identification and justifiable allocation of certain activities to specific projects and leases. Differences in methodologies of cost identification and documentation, as well as differing assumptions as to the time incurred on projects, can yield significant differences in the amounts capitalized and, as a result, the amount of depreciation recognized.
Revenue Recognition and Related Matters
Minimum rent revenues are recognized on a straight-line basis over the terms of the related leases. Minimum rent revenues also include amounts collected from tenants to allow the termination of their leases prior to their scheduled termination dates and accretion related to above and below-market tenant leases on acquired properties. Straight-line rents receivable represents the current net cumulative rents recognized prior to when billed and collectible as provided by the terms of the leases. Overage rent is recognized on an accrual basis once tenant sales exceed contractual tenant lease thresholds. Recoveries from tenants are established in the leases or computed based upon a formula related to real estate taxes, insurance and other shopping center operating expenses and are generally recognized as revenues in the period the related costs are incurred.
49
Economy and Inflation
Substantially all of our tenant leases contain provisions designed to partially mitigate the negative impact of inflation. Such provisions include clauses enabling us to receive overage rent based on tenants' gross sales, which generally increase as prices rise, and/or escalation clauses, which generally increase rental rates during the terms of the leases. In addition, many of the leases expire each year which may enable us to replace or renew such expiring leases with new leases at higher rents. Finally, many of the existing leases require the tenants to pay amounts related to all, or substantially all, of their share of certain operating expenses, including CAM, real estate taxes and insurance, thereby partially reducing our exposure to increases in costs and operating expenses resulting from inflation. In general, these amounts either vary annually based on actual expenditures or are set on an initial share of costs with provisions for annual increases. Inflation also poses a risk to us due to the probability of future increases in interest rates. Such increases would adversely impact us due to our outstanding variable-rate debt.
The real estate industry continues to recover from the recent recession and difficult capital market and retail environments. There have been some positive signs in the industry, despite continued high unemployment and uncertainty as to when the economy will fully recover. Although a number of regional and national retailers have announced store closings or filed for bankruptcy in 2009, 2010 and 2011, those numbers have not been significantly higher than in previous years and have not had a material impact on our overall operations.
ITEM 7A. QUANTITATIVE AND QUALITATIVE DISCLOSURES ABOUT MARKET RISK
We are subject to market risk associated with changes in interest rates both in terms of variable-rate debt and the price of new fixed-rate debt upon maturity of existing debt. As of December 31, 2011, we had combined debt of $1.06 billion, including $328.4 million of variable-rate debt. A 25 basis point movement in the interest rate on the variable-rate debt would result in a $0.8 million annualized increase or decrease in combined interest expense and operating cash flows.
We are further subject to interest rate risk with respect to our fixed-rate financing in that changes in interest rates will impact the fair value of our fixed-rate financing. For additional information concerning our debt, and management's estimation process to arrive at a fair value of our debt as required by GAAP, reference is made to Item 7, the discussion of Liquidity and Capital Resources in Management's Discussion and Analysis of Financial Condition and Results of Operations and Notes 2 and 4 to the combined financial statements. At December 31, 2011, the fair value of our combined debt has been estimated for this purpose to be $56.0 million higher than the carrying amount of $1.06 billion.
ITEM 8. FINANCIAL STATEMENTS AND SUPPLEMENTARY DATA
Reference is made to the Combined Financial Statements and Combined Financial Statement Schedule beginning on page F-1 for the required information.
ITEM 9. CHANGES IN AND DISAGREEMENTS WITH ACCOUNTANTS ON ACCOUNTING AND FINANCIAL DISCLOSURE
None.
ITEM 9A. CONTROLS AND PROCEDURES
Disclosure Controls and Procedures
We maintain disclosure controls and procedures (as defined in Rule 13a-15(e) under the Exchange Act) that are designed to provide reasonable assurance that information required to be disclosed in our
50
reports to the SEC is recorded, processed, summarized and reported within the time periods specified in the SEC's rules and forms, and that such information is accumulated and communicated to our management, including our principal executive officer and our principal financial and accounting officer, as appropriate, to allow timely decisions regarding required disclosure.
As required by SEC rules, we carried out an evaluation, under the supervision and with the participation of our management, including our principal executive officer and our principal financial and accounting officer, of the effectiveness of the design and operation of our disclosure controls and procedures as of December 31, 2011, the end of the period covered by this report. Based on the foregoing, our principal executive officer and principal financial and accounting officer concluded that our disclosure controls and procedures were effective as of December 31, 2011.
Internal Controls over Financial Reporting
There have been no changes in our internal controls during our most recently completed fiscal quarter that have materially affected or are reasonably likely to materially affect our internal control over financial reporting.
Management's Report on Internal Control Over Financial Reporting
This Annual Report on Form 10-K does not include a report of management's assessment regarding internal control over financial reporting or an attestation report of our registered public accounting firm due to a transition period established by rules of the SEC for newly public companies.
Not applicable.
51
ITEM 10. DIRECTORS, EXECUTIVE OFFICERS AND CORPORATE GOVERNANCE
Directors
The following table sets forth the names, ages, positions and starting date for each of our current directors.
Name
|
Age | Director Since | Position | |||||
|---|---|---|---|---|---|---|---|---|
Andrew Silberfein |
47 | 2012 | President, Chief Executive Officer and Director | |||||
Leonard Abramsky |
49 | 2012 | Director | |||||
David Arthur |
57 | 2012 | Director | |||||
Jeffrey Blidner |
64 | 2012 | Director | |||||
Christopher Haley |
43 | 2012 | Director | |||||
David Kruth |
48 | 2012 | Director | |||||
Michael Mullen |
57 | 2012 | Director | |||||
Steven Shepsman |
59 | 2012 | Director | |||||
Andrew Silberfein has served as our President and Chief Executive Officer since January 2, 2012 and has served as a director since January 12, 2012. Mr. Silberfein previously held the position of Executive Vice President—Retail and Finance for Forest City Ratner Companies, where he was employed from 1995 to 2011. Mr. Silberfein was responsible for managing all aspects of Forest City Ratner Companies' retail portfolio, consisting of over 5.1 million square feet of existing and under construction shopping centers and malls. Also, Mr. Silberfein had the overall responsibility of managing all aspects of Forest City Ratner Companies' debt and equity financing requirements for its real estate portfolio. Prior to joining Forest City Ratner Companies, from 1989 to 1995, Mr. Silberfein was a Senior Vice President of Sanford Nalitt and Associates, a firm focused on the development of supermarket and discount department store anchored shopping centers along the east coast of the United States. In his role as Senior Vice President, Mr. Silberfein was principally involved in the leasing, financing, asset management, acquisitions and dispositions of the retail shopping center portfolio. Mr. Silberfein holds a Bachelor of Arts degree from Lafayette College and a Master of Business Administration degree from Columbia University School of Business. Mr. Silberfein's 22 years of experience in the retail real estate industry, including experience in leasing, financing, development, construction, tenant coordination, acquisitions, dispositions, asset management and marketing have prepared him to make strategic contributions to our board of directors and to the leadership of our company.
Leonard M. Abramsky has served as a director since January 12, 2012. Mr. Abramsky is a Managing Partner for Brookfield Financial, overseeing Brookfield Financial's property advisory business on a global basis. Prior to joining Brookfield Financial in 2005, Mr. Abramsky was a Managing Director of TD Cornerstone, which he joined after TD Securities acquired Cornerstone Commercial Realty, the boutique property advisory that he established in 1995. Prior to founding Cornerstone Commercial Realty, Mr. Abramsky spent twelve years, beginning in 1983, as one of CBRE's leading investment sales professionals in Canada. He is a graduate of Boston University School of Management and holds a Bachelor of Science degree in Business Administration Real Estate Finance. Mr. Abramsky's over 27 years of experience in real estate on the investment banking and brokerage sides of the industry, including property brokerage, M&A advisory and debt and equity financing, allows him to make key contributions on investment and other strategies to our board of directors.
David Arthur has served as a director since January 12, 2012. Mr. Arthur is Managing Partner, Real Estate Investments, North America for Brookfield Asset Management. Mr. Arthur has also served as the President and CEO of the Brookfield Real Estate Opportunity Fund (the "Fund"), a real estate opportunity fund investing in high yield office, industrial and residential real estate opportunities in
52
major markets in the United States and Canada, since 2003. Prior to joining the Fund, he was President and CEO of Brookfield Properties Ltd. Mr. Arthur was founding Chairman of Brookfield LePage Johnson Controls, a major Canadian facilities management company. Mr. Arthur also previously served as Executive Vice President and Chief Operating Officer for Brookfield Properties from 2002 to 2006. In addition, he has previously held positions as Cadillac Fairview, Cambridge Leaseholds and Coscan. Mr. Arthur received his Honours degree in Urban and Regional Planning from the University of Waterloo and his Master of Science in Urban Land Economics from the University of British Columbia. He is a member of the World President's Organization, REALpac, ULI and NAIOP, and ICSC. Mr. Arthur's extensive experience in the real estate industry along with his many leadership roles and board service enables him to make key contributions on operational, investment and other strategy matters to our board of directors.
Jeffrey Blidner has served as a director since January 12, 2012. Mr. Blidner is the Senior Managing Partner of Brookfield responsible for strategic planning as well as transaction execution. Mr. Blidner also currently serves as a director on the boards of several companies, including Brookfield Infrastructure Partners L.P. and Brookfield Renewable Energy Partners L.P., for which he serves as Chairman of the board. Prior to joining Brookfield in 2000, Mr. Blidner was a senior partner at a Canadian law firm. Mr. Blidner was called to the Bar in Ontario as a Gold Medalist in 1974. Mr. Blidner's extensive experience in private equity, particularly in the real estate industry, and board service allows him to make key contributions in investment and other strategies to our board of directors.
Christopher Haley has served as a director since January 12, 2012. Mr. Haley has held the position of Managing Principal of Palladian Realty Capital LLC, a real estate investment banking and advisory company which Mr. Haley founded, since 2009. Prior to his position at Palladian Realty Capital LLC, Mr. Haley held various leadership positions at Wheat First/First Union/Wachovia/Wells Fargo, beginning in 1993. These included his lead role in the firm's research department focused on real estate company analysis. Mr. Haley is a lead instructor for SNL Securities' Financial Statement Analysis for Real Estate/REIT School and is a former member of the NAREIT Financial Standards Task Force. Mr. Haley's experience in leadership and analytic positions and in the real estate industry enable him to make key contributions on operational, investment and other strategy matters to our board of directors.
David Kruth has served as a director since January 12, 2012. Mr. Kruth was Vice President and Co-Portfolio Manager of the Global Real Estate Securities Funds at Goldman Sachs Asset Management, where he oversaw an investment team of eight professionals from 2005 through March 2011. Prior to his tenure at Goldman Sachs, Mr. Kruth was a Portfolio Manager and Senior Analyst at both Citigroup Property Investors and Alliance Capital Management for eight years, where he was responsible for investing in REITs and other public real estate related companies in the US and internationally. Mr. Kruth began his career in private equity at the Yarmouth Group (also known as Lend Lease) in 1988, where he worked on teams that made direct investments in North America, Europe and Asia. He founded the firm's entity level investment platform, which was a prelude to the public REIT sector's growth in the mid-1990s. Mr. Kruth is a Chartered Financial Analyst and has over 20 years of experience in global real estate investing in both the direct property market and through public securities. Mr. Kruth's extensive professional accounting and financial expertise, including with respect to the real estate industry, allow him to make key contributions to the board of directors on financial, accounting, corporate governance and strategic matters.
Michael Mullen has served as a director since January 12, 2012. Mr. Mullen currently serves as Vice Chairman of CenterPoint Properties Trust ("CenterPoint"), a company for which he was one of the founding partners in 1993 and holds a position on the Asset Allocation and Compensation Committee. He has served on the board of directors of CenterPoint since 1999. During his career at CenterPoint, Mr. Mullen has held various positions including Chief Investment Officer, Chief Operating
53
Officer and President. In December 2005, Mr. Mullen became the Chief Executive Officer of CenterPoint, a title which he held until September 30, 2011. Mr. Mullen also currently serves on the board of directors of CONE, a subsidiary of Moura Dubeaux Engineering, a construction and engineering firm based in Redfe, Brazil. From 2001 until 2005, Mr. Mullen served on the board of directors of Brauvin Capital, a private REIT that was the owner of a large portfolio of free standing single tenant retail and restaurant facilities. Mr. Mullen has worked in the real estate industry since 1976 and has held a variety of positions including: Project Manager at JL William & Company, an industrial real estate developer; Junior Partner with a focus on sales and leasing at Four Columns, Ltd.; and Vice President of Sales at FCL/Stava Group, a real estate development company focusing on industrial facilities, as well as retail, medical office, manufacturing and land development. Mr. Mullen's leadership roles, extensive real estate experience and board service allow him to make key contributions on development, investment and operational matters to our board of directors.
Steven H. Shepsman has served as a director since January 12, 2012. Mr. Shepsman is an Executive Managing Director and Founder of New World Realty Advisors, a real estate advisory firm with expertise in real estate restructuring, development and finance. Mr. Shepsman was recently Chair of the Official Committee of Equity Holders in the Chapter 11 proceedings of GGP from September 2009 to November 2010. He also currently holds the position of director, and chairs the Audit Committee, of the Howard Hughes Corporation. Since 2003, Mr. Shepsman has been a co-founder, owner and officer of a variety of private finance companies and a real estate investment and advisory company. As a principal in a real estate fund, Mr. Shepsman had oversight responsibility for the fund's due diligence and acquisition of investment platforms, and with subsequent asset acquisitions, financings and dispositions. Earlier in his career, Mr. Shepsman, a CPA, was a Managing Partner of Kenneth Leventhal and Company from October 1992 to May 1995 and of Ernst & Young's Real Estate Practice from June 1995 to March 1998. Mr. Shepsman was formerly a member of the Real Estate Committee of the American Institute of Certified Public Accountants and was the Chair of the Real Estate Committee of the New York State Society of Certified Public Accountants. Mr. Shepsman is presently the Chair of the Dean's Advisory Council for the School of Management at the University of Buffalo. Mr. Shepsman's extensive professional accounting and financial expertise, including with respect to the real estate industry, allow him to make key contributions to the board of directors, on financial, accounting, corporation governance and strategic matters.
Executive Officers
Set forth below is information concerning the individuals that currently serve as our executive officers:
Name
|
Age | Position | |||
|---|---|---|---|---|---|
Andrew Silberfein |
47 | President and Chief Executive Officer | |||
Rael Diamond |
35 | Chief Financial Officer | |||
Brian Harper |
35 | Executive Vice-President, Leasing | |||
Benjamin Schall |
36 | Chief Operating Officer | |||
Andrew Silberfein has served as our President and Chief Executive Officer since January 2, 2012 and has served as a director since January 12, 2012. For Mr. Silberfein's biography, see the section entitled "—Board of Directors" above.
Rael Diamond has been our chief financial officer since January 12, 2012. Mr. Diamond served as chief financial officer of Brookfield Office Properties Canada since 2011 and served as interim chief financial officer for The Howard Hughes Corporation from 2010 to 2011 and has been Senior Vice President Finance of Brookfield Asset Management's real estate platform since 2009. In 2008, Mr. Diamond was the chief financial officer of a private investment firm. Prior to 2008 he held various finance positions within Brookfield Office Properties including Vice President & Controller of
54
Brookfield Office Properties. Prior to 2003 he was with the Financial Advisory Services Group of Deloitte & Touche LLP. He is a Chartered Accountant.
Brian Harper has been Executive Vice-President of Leasing since January 12, 2012. He also previously served as GGP's Senior Vice President of Leasing in 2011. Prior to 2011, Mr. Harper served in various positions at GGP, including Vice President of Mall Leasing and Vice President of Leasing/Big Box for both the Western and Eastern Regions. Before joining GGP, Mr. Harper was a leasing associate and then Vice President of Leasing at RED Development from 2002 to 2005 and an associate at Cohen-Esrey Real Estate Services, LLC from 1998 to 2002. His wide range of experience includes work with ground up development, asset repositions, distressed real estate and "regular" mall leasing.
Benjamin Schall has served as our Chief Operating Officer since March 8, 2012. Prior to joining the Company, he served as the Senior Vice President of the Retail Division at Vornado Realty Trust, where he was employed from 2003 to 2012. Mr. Schall was responsible for all facets of Vornado's suburban retail shopping center business consisting of 18 million square feet in 140 assets. Mr. Schall holds a Masters of Business Administration from Harvard Business School and a Bachelor of Arts degree from Swarthmore College.
Audit Committee
The audit committee was formed in accordance with the requirements of the SEC in January 2012 in connection with the Company's spin-off. The board of directors has determined each member of the audit committee is "independent" as defined by NYSE corporate governance standards and Rule 10A-3 of the Securities Exchange Act of 1934. The board of directors has also determined that Mr. Shepsman qualifies as an "audit committee financial expert" as such term has been defined by the SEC in Item 401(h)(2) of Regulation S-K.
Section 16(a) Beneficial Ownership Reporting Compliance
Not applicable.
Code of Business Conduct and Ethics
We have a Code of Business Conduct and Ethics which applies to all of our employees, officers and directors, including our Chairman, Chief Executive Officer and Chief Financial Officer. The code includes a process and a toll-free telephone number for anonymous reports of potentially inappropriate conduct or potential violations of the code. The code is available on the Corporate Governance page of our website at www.rouseproperties.com and we will provide a copy of the code without charge to any person who requests it in writing to: Rouse Properties, Inc., 1114 Avenue of the Americas, Suite 2800, New York, NY 10110, Attn: Investor Relations. We will post on our website amendments to or waivers of the code for executive officers, in accordance with applicable laws and regulations.
ITEM 11. EXECUTIVE COMPENSATION
Compensation Discussion and Analysis
Executive Compensation
The Company became an independent public company following the completion of its spin-off from GGP on January 12, 2012. Prior to the spin-off, the Company did not conduct any business and did not have any significant assets or liabilities. No compensation was paid by Rouse to any employee, including executive employees, on or before December 31, 2011. GGP employees who provided services on behalf of Rouse were compensated by GGP prior to the spin-off date, and GGP reimbursed Rouse for any amounts paid on account of services provided by GGP employees prior to the spin-off date.
55
The compensation committee was formed in January 2012 following the completion of the Company's spin-off. The compensation committee will establish our executive compensation philosophy for 2012 and future periods, and determine the material elements of the compensation of our executive officers.
The executive compensation program being designed by the compensation committee is intended to attract, retain and motivate the key people necessary to enable the Company to maximize operational efficiency and profitability over the long term. The compensation committee believes that executive compensation should seek to align the interests of the Company's executives and other key employees with those of the Company and its stockholders. The Company's executive compensation program is also being designed to differentiate compensation based upon individual contribution, performance and experience.
In establishing compensation, the compensation committee intends to provide employees, including its executive officers, with a competitive total compensation package. The compensation committee intends to set compensation in this manner to ensure that the Company's compensation practices do not put the Company at a disadvantage in attracting and retaining executives and other employees, while also ensuring a competitive cost structure for the Company.
Employment Agreements
President and Chief Executive Officer
We have entered into an employment agreement with Andrew Silberfein (the "Silberfein Agreement"), our President and Chief Executive Officer since January 2, 2012. Pursuant to the Silberfein Agreement, Mr. Silberfein will receive annual base compensation of $750,000, and received a signing bonus of $1,200,000 in cash. Mr. Silberfein will have a target annual cash bonus equal to 100% of his base salary, with a guaranteed bonus of $750,000 for 2012.
Pursuant to the Silberfein Agreement, Mr. Silberfein received a one-time initial award of $1,900,000 payable in restricted shares of our common stock (the "signing restricted stock"). Such restricted shares will vest in three equal annual installments on each of the first three anniversaries of January 13, 2012, the commencement date of Mr. Silberfein's employment. Mr. Silberfein also received a one-time award of options (the "signing options") to acquire 679,400 shares of our common stock (which was equal to the number obtained by dividing $10,000,000 by the closing price per share of our common stock on the date before the date of grant.) The signing options will vest in five equal annual installments on each of the first five anniversaries of January 3, 2012. In addition, Mr. Silberfein will be entitled to receive annual stock option awards, beginning in 2013, subject to the satisfaction of performance measures and other criteria. Such annual awards will be based on the number of shares obtained by dividing (i) three times Mr. Silberfein's base salary by (ii) the closing price per share of our common stock on the date of the grant. Such annual stock option awards will vest in five annual installments on each of the first five anniversaries of the applicable award date of Mr. Silberfein's employment.
In the event that Mr. Silberfein is terminated by us without cause or resigns for good reason, Mr. Silberfein will be entitled to receive the following: (i) two times the sum of his base salary and target annual cash bonus; (ii) any earned by unpaid annual cash bonus related to a fiscal year prior to the year of termination; (iii) a pro-rata annual cash bonus for the fiscal year in which the termination occurs; (iv) immediate vesting of any unvested portion of the signing restricted stock; and (v) up to 18 months of welfare benefit continuation at the active employee rate. In the event that Mr. Silberfein is terminated due to death or disability, he will be entitled to the following: (i) any earned but unpaid annual cash bonus relating to a fiscal year prior to the year of termination; (ii) a pro-rata annual cash bonus for the fiscal year in which the termination occurs and; (iii) immediate vesting of any unvested portion of the signing restricted stock. Pursuant to a letter agreement between us and Mr. Silberfein, in
56
the event that Mr. Silberfein is terminated by us without cause, the portion of his signing options, if any, that would have vested during the one year period following the termination date shall vest on the termination date.
Chief Operating Officer
We have entered into an employment agreement with Benjamin Schall, (the "Schall Agreement") our Chief Operating Officer since March 8, 2012. Pursuant to the Schall Agreement, Mr. Schall will receive annual base compensation of $500,000 and have a target annual cash bonus equal to 75% of his base salary, with a guaranteed bonus of $375,000 for 2012.
Mr. Schall received a one-time award of $2,150,000 payable in restricted shares of our common stock (the "signing restricted stock"). Such restricted shares will vest in four equal annual installments on each of the first four anniversaries of March 12, 2012. Mr. Schall also received a one-time award of options in 2012 to acquire 322,700 shares of our common stock (which was equal to the number obtained by dividing $4,750,000 by the closing price per share of our common stock on the date before the date of grant.) These options will vest in five equal annual installments on each of the first five anniversaries of March 12, 2012. In addition, Mr. Schall will be entitled to receive annual stock option awards, beginning in 2013, subject to the satisfaction of performance measures and other criteria. Such annual awards will be based on the number of shares obtained by dividing (i) two times Mr. Schall's base salary by (ii) the closing price per share of our common stock on the date of the grant. Such annual stock option awards will vest in five annual installments on each of the first five anniversaries of the applicable award date.
If Mr. Schall is terminated by the Company without cause prior to the vesting of the signing restricted stock, the signing restricted stock will vest in full. In addition, if Mr. Schall is terminated without cause within the first 12 months of employment, Mr. Schall will be eligible to receive a severance payment equal to 12 months' base salary and a pro rated bonus for the year of termination. If Mr. Schall is terminated without cause after the first 12 months of employment, Mr. Schall will be eligible to receive a severance payment equal to six months' base salary and a pro rated bonus for the year of termination.
Services Agreement with Brookfield for Chief Financial Officer and Vice President, Finance
We have entered into a services agreement with Brookfield, pursuant to which Brookfield employees Rael Diamond and Timothy Salvemini will act as our Chief Financial Officer and Vice President, Finance, respectively, for a period of up to 12 months following the spin-off. See "Certain Relationships and Related Person Transactions—Services Agreement with Brookfield."
Stock Ownership Guidelines
The compensation committee has not established formal stock ownership guidelines for the Company's executive officers.
Compensation Committee Interlocks and Insider Participation
None of our executive officers serve on the compensation committee or board of directors of any other company of which any of the members of our compensation committee or any of our directors is an executive officer.
Compensation Committee Report
The Compensation Committee of the board of directors of Rouse has reviewed and discussed the Compensation Discussion and Analysis with management. Based on this review and consultation with
57
management, the Compensation Committee has recommended to the board of directors that the Compensation Discussion and Analysis be included in this Annual Report on Form 10-K for the year ended December 31, 2011.
The Compensation Committee of the Board of Directors:
David
Arthur (Chair)
David Kruth
Michael Mullen
Grants of Plan Based Awards
The Company did not grant any plan based awards in 2011.
Outstanding Equity Awards at Fiscal Year-End
None of our executive officers held outstanding equity awards as of December 31, 2011.
Option Exercises and Stock Vested
None of our executive officers held any equity incentive awards that vested during 2011.
Director Compensation
We did not pay compensation to any person serving as a director in the year ended December 31, 2011. As of January 12, 2012 our non-employee directors, including the chairman of the board, are entitled to be paid an annual retainer of $75,000, 50% in cash and 50% in restricted stock (until a minimum stock ownership level is achieved). The chairman of the board and the chairman of the audit committee are entitled to be paid an additional annual retainer of $35,000 and $25,000, respectively. The chairman of the compensation committee and the chairman of the nominating and governance committee are entitled to be paid an additional annual retainer of $12,500. For the first year following the spin-off, each of the non-chair committee members will receive a retainer equal to half of the amount paid to the applicable committee chairman. A director who is, or becomes, an employee of the Company does not receive additional compensation for serving as a director. In addition, Mr. Arthur, Mr. Blidner and Mr. Abramsky have waived all compensation relating to their service as directors of the Company. The Company reimburses all directors for all expenses incurred in attending board and board committee meetings.
58
ITEM 12. SECURITY OWNERSHIP OF CERTAIN BENEFICIAL OWNERS AND MANAGEMENT AND RELATED STOCKHOLDER MATTERS
The following table sets forth information regarding the beneficial ownership of our common stock as of March 26, 2012 after giving effect to our recently completed rights offering. The table lists the applicable percentage ownership based on 48,879,972 shares of common stock outstanding as of March 26, 2012. The table below sets forth such estimated beneficial ownership for:
- •
- each stockholder that is a beneficial owner of more than 5% of our common stock;
- •
- each director;
- •
- each named executive officer;
- •
- all of such directors and executive officers as a group.
Beneficial ownership of shares is determined under rules of the SEC and generally includes any shares over which a person exercises sole or shared voting or investment power. Shares of common stock subject to options currently exercisable or exercisable within 60 days of March 26, 2012 are deemed to be outstanding and beneficially owned by the person and any group of which that person is a member, but are not deemed outstanding for the purpose of computing the percentage of beneficial ownership for any other person. In the case of persons other than our executive officers and directors or where we have received additional information from the beneficial owner, the information presented in this table is based on filings with the SEC as of March 26, 2012. Except as noted by footnote, and subject to community property laws where applicable, we believe based on the information provided to us that the persons and entities named in the table below have sole voting and investment power with respect to all shares of our common stock shown as beneficially owned by them. The address of each director and executive officer shown in the table below is c/o Rouse Properties, Inc., 1114 Avenue of the Americas, Suite 2800, New York, NY 10110.
| |
Beneficial Ownership | ||||||
|---|---|---|---|---|---|---|---|
Name of Beneficial Owner
|
Number of Shares |
Percent of Total |
|||||
Brookfield Asset Management(1) |
26,580,603 | 54.38 | % | ||||
Leonard Abramsky, Director |
— | — | |||||
David Arthur, Director |
— | — | |||||
Jeffrey Blidner, Director |
— | — | |||||
Christopher Haley, Director |
2,606 | * | |||||
David Kruth, Director |
2,548 | * | |||||
Michael Mullen, Director |
2,548 | * | |||||
Steven Shepsman, Director |
2,548 | * | |||||
Andrew Silberfein, President and Chief Executive Officer and Director |
129,270 | * | |||||
Benjamin Schall, Chief Operating Officer |
146,084 | * | |||||
Rael Diamond, Chief Financial Officer |
76 | * | |||||
Brian Harper, Executive Vice President, Leasing |
7,818 | * | |||||
All Directors and Executive Officers as a Group |
293,498 | * | |||||
- *
- Represents
beneficial ownership of less than 1% of our outstanding common stock
- (1)
- The following Brookfield entities may be deemed to constitute a "group" within the meaning of Section 13(d)(3) under the Exchange Act and Rule 13d-5(b)(1) thereunder and each member of the "group" may be deemed to beneficially own all shares of common stock held by all members of the "group": Brookfield Retail Holdings LLC, Brookfield Retail Holdings II LLC, Brookfield Retail Holdings III LLC, Brookfield Retail Holdings IV-A LLC, Brookfield Retail Holdings IV-D LLC, Brookfield Retail Holdings V LP, Brookfield Retail Holdings VI LLC, Brookfield US Retail
59
Holdings LLC, Brookfield Retail Holdings IV-B LLC, Brookfield Retail Holdings IV-C LLC, Brookfield Asset Management Inc., Brookfield Asset Management Private Institutional Capital Adviser (Canada) LP, Brookfield Private Funds Holdings Inc., Brookfield Retail Split LP, Brookfield Holdings Canada, Inc., Partners Limited, Brookfield US Holdings Inc., Brookfield US Corporation, Brookfield REP GP Inc., Brookfield Retail Split II LLC, Brookfield Retail Holdings R 1 Inc. and Brookfield Retail Holdings R 2 Inc. Accordingly, each of the above Brookfield entities may be deemed to beneficially own 26,580,603 shares of common stock constituting beneficial ownership of 54.38% of the shares of the Company's common stock after giving effect to the rights offering and the obligations under the Standby Purchase Agreement, dated as of December 16, 2011 (the "Standby Agreement"), among Rouse Properties, Inc., General Growth Properties, Inc., Brookfield US Corporation, and Brookfield Asset Management, Inc. The following Brookfield entities directly own more than 5% of the outstanding shares of the Company's common stock in the following amounts: (i) Brookfield Retail Holdings R 1 Inc. directly owns 9,019,367 shares of common stock, representing approximately 18.45% of the shares of the Company's common stock, (ii) Brookfield Retail Holdings R 2 Inc. directly owns 14,995,702 shares of common stock, representing approximately 30.68% of the shares of the Company's common stock and (iii) Brookfield Retail Holdings V LP directly owns 2,565,534 shares of common stock, representing approximately 5.25% of the shares of the Company's common stock. The following investors in such entities may be deemed to beneficially own more than 5% of the outstanding shares of the Company's common stock in the following amounts: (i) Future Fund Board of Guardians may be deemed to share voting and investment power over 11,585,741 shares of common stock of the Company (which includes 11,584,901 of the shares of common stock held by Brookfield, and an additional 840 shares of common stock held by Future Fund Board of Guardians), representing approximately 23.70% of the Company's common stock; and (ii) Stable Investment Corporation and Best Investment Corporation, both subsidiaries of China Investment Corporation, may be deemed to share voting and investment power over 11,584,901 of the shares of common stock held by Brookfield, representing approximately 23.70% of the Company's common stock. China Investment Corporation may be deemed to beneficially own a total of 11,589,818 shares of common stock (which includes 11,584,901 of the shares of common stock held by Brookfield and an additional 4,917 shares of common stock held by another wholly owned subsidiary of China Investment Corporation), representing approximately 23.71% of the shares of the Company's common stock. By virtue of the various agreements and arrangements among the Brookfield entities, Future Fund Board of Guardians and/or Stable Investment Corporation and Best Investment Corporation may be deemed to be members of a "group" with certain Brookfield entities. Each of Brookfield Retail Holdings LLC, Brookfield Retail Holdings II LLC, Brookfield Retail Holdings III LLC, Brookfield Retail Holdings IV-A LLC, Brookfield Retail Holdings IV-D LLC, Brookfield Retail Holdings V LP, Brookfield Retail Holdings IV LLC, Brookfield US Retail Holdings LLC and Brookfield Retail Holdings R 1 Inc. (collectively, the "Investment Vehicles") expressly disclaims, to the extent permitted by applicable law, (a) beneficial ownership of any shares of common stock held by each of the other Investment Vehicles and (b) beneficial ownership of any shares of common stock held by Brookfield Retail Holdings VI LLC or Brookfield Retail Holdings R 2 Inc. The address of each such Brookfield-managed entity is c/o Brookfield Retail Holdings LLC, Level 22, 135 King Street, Sydney NSW 2000, Australia.
Equity Compensation Plan Information
Not applicable.
60
ITEM 13. CERTAIN RELATIONSHIPS AND RELATED PERSON TRANSACTIONS AND DIRECTOR INDEPENDENCE
Registration Rights Agreement
We entered into a registration rights agreement with Brookfield with respect to all registrable securities to be held by Brookfield. The registration rights agreement provides for demand rights and customary piggyback registration rights. Pursuant to the registration rights agreement, we are obligated to file a resale shelf registration statement with the SEC.
Services Agreement with Brookfield
We have entered into a services agreement with Brookfield, pursuant to which Brookfield employees Rael Diamond and Timothy Salvemini serve as our Chief Financial Officer and Vice President, Finance, respectively for a period of up to 12 months following the spin-off. We expect to pay Brookfield an estimated $88,000 per month for these services.
Office Lease with Brookfield
Rouse Properties entered into a 10-year lease agreement with Brookfield, as landlord, for office space. This lease was assigned to us following the spin-off. The lease agreement calls for annual rent of $1,076,120 during the first five years of the lease and $1,146,975 during the last five years of the lease.
Subordinated Credit Facility with Brookfield
We entered into a credit agreement with a wholly owned subsidiary of Brookfield, as lender, for a $100.0 million revolving subordinated credit facility. See "Management's Discussion and Analysis of Financial Condition—Financings."
Transition Services Agreement
We have entered into a transition services agreement with GGP whereby GGP or its subsidiaries will provide to us, on a transitional basis, certain specified services for various terms not exceeding 18 months following the spin-off. The services that GGP provides to us include, among others, payroll, human resources and employee benefits, financial systems management, treasury and cash management, accounts payable services, telecommunications services, information technology services, asset management services, legal and accounting services and various other corporate services. The charges for the transition services generally are intended to allow GGP to fully recover the costs directly associated with providing the services, plus a level of profit consistent with an arm's length transaction together with all out-of-pocket costs and expenses. The charges of each of the transition services are generally based on an hourly fee arrangement and pass-through out-of-pocket costs. We may terminate certain specified services by giving prior written notice to GGP of any such termination.
61
Director Independence
Our board of directors has affirmatively determined that Christopher Haley, David Kruth, Michael Mullen and Steven Shepsman are independent directors under the applicable rules of the NYSE and as such term is defined in Rule 10A-3(b)(1) under the Exchange Act.
Related Person Transactions Policy
We have adopted a written policy relating to the approval of related person transactions. Our audit committee will review and approve all relationships and related person transactions between us and (i) our directors, director nominees or executive officers (other than compensatory and dealt with by the compensation committee), (ii) any 5% record or beneficial owner of our common stock, (iii) any immediate family member of any person specified in (i) and (ii) above or (iv) an entity that is either wholly or substantially owned or controlled by someone specified in (i), (ii) or (iii) above.
As set forth in the related person transactions policy, in the course of its review and approval of a related person transaction, the audit committee will consider:
- •
- whether the transaction is in, or not inconsistent with, our best interests;
- •
- the position within or relationship of the related person with us;
- •
- the materiality of the transaction to the related person and us;
- •
- whether the transaction is on terms comparable to those that could be obtained in arm's length dealings with an unrelated
third party; and
- •
- whether the term of the transaction does not exceed one year or the agreement reflecting the related person transaction is terminable by us in our sole discretion upon reasonable notice.
If a transaction under review involves a member of the audit committee who is a related person, the transaction must be approved by disinterested members who constitute a majority of disinterested members of the audit committee.
ITEM 14. PRINCIPAL ACCOUNTING FEES AND SERVICES
The following table presents the fees paid by the Company to its independent registered public accountants, Deloitte & Touche, LLP. Audit fees consisted principally of the audit of RPI Businesses included in this Annual Report. Audit-related fees consisted principally of the carve-out audits of RPI Businesses for the years ended December 31, 2010, 2009 and 2008 included in the Company's Form 10 and Form S-11 associated with the spin-off and rights offering as well as other services related to SEC matters.
| |
2011 | |||
|---|---|---|---|---|
Audit fees |
$ | 500,000 | ||
Audit-related fees |
$ |
1,438,000 |
||
Tax fees |
$ | — | ||
All other fees |
$ | — | ||
The audit committee's charter requires the audit committee to pre-approve all of the audit and non-audit services provided to the Company by its independent registered public accounting firm (except for items exempt from preapproval requirements under applicable laws and rules).
62
ITEM 15. EXHIBITS AND FINANCIAL STATEMENT SCHEDULES.
- (1)
- Combined Financial Statements and Combined Financial Statement Schedule.
The combined financial statements and combined financial statement schedule listed in the accompanying Index to Combined Financial Statements and Combined Financial Statement Schedule are filed as part of this Annual Report.
- (2)
- Exhibits.
See Exhibit Index on page S-1.
- (3)
- Separate Financial Statements.
Not applicable.
63
Pursuant to the requirements of Section 13 or 15(d) of the Securities Exchange Act of 1934, the registrant has duly caused this report to be signed on its behalf by the undersigned, thereunto duly authorized.
| ROUSE PROPERTIES, INC. | ||
/s/ RAEL DIAMOND Rael Diamond Chief Financial Officer (Principal Financial and Accounting Officer) |
March 29, 2012 |
We, the undersigned officers and directors of Rouse Properties, Inc., hereby severally constitute Andrew Silberfein and Rael Diamond, and each of them singly, our true and lawful attorneys with full power to them, and each of them singly, to sign for us and in our names in the capacities indicated below, any and all amendments, to this Annual Report of Form 10-K and generally to do all such things in our name and behalf in such capacities to enable Rouse Properties, Inc. to comply with the applicable provisions of the Securities Exchange Act of 1934, and we hereby ratify and confirm our signatures as they may be signed by our said attorneys, or any of them, to any and all such amendments.
Pursuant to the requirements of the Securities Exchange Act of 1934, this report has been signed below by the following persons on behalf of the registrant and in the capacities and on the dates indicated.
Signature
|
Title
|
Date
|
||
|---|---|---|---|---|
| /s/ ANDREW SILBERFEIN Andrew Silberfein |
Director and Chief Executive Officer (Principal Executive Officer) |
March 29, 2012 | ||
/s/ RAEL DIAMOND Rael Diamond |
Chief Financial Officer (Principal Financial and Accounting Officer) |
March 29, 2012 |
||
/s/ LEONARD ABRAMSKY Leonard Abramsky |
Director |
March 29, 2012 |
||
/s/ DAVID ARTHUR David Arthur |
Director |
March 29, 2012 |
||
/s/ JEFFREY BLIDNER Jeffrey Blidner |
Director |
March 29, 2012 |
64
Signature
|
Title
|
Date
|
||
|---|---|---|---|---|
| /s/ CHRISTOPHER HALEY Christopher Haley |
Director | March 29, 2012 | ||
/s/ DAVID KRUTH David Kruth |
Director |
March 29, 2012 |
||
/s/ MICHAEL MULLEN Michael Mullen |
Director |
March 29, 2012 |
||
/s/ STEVEN SHEPSMAN Steven Shepsman |
Director |
March 29, 2012 |
65
Index to Combined Financial Statements and Combined Financial Statement Schedule
F-1
REPORT OF INDEPENDENT REGISTERED PUBLIC ACCOUNTING FIRM
To
the Board of Directors and Stockholders of
Rouse Properties, Inc.
New York, New York
We have audited the accompanying combined balance sheets of certain entities as described in Note 1 to the combined financial statements (the "RPI Businesses") as of December 31, 2011 and 2010 and the related combined statements of operations, equity, and cash flows for the year ended December 31, 2011, the period from November 10, 2010 through December 31, 2010 (Successor RPI Businesses' operations), the period from January 1, 2010 through November 9, 2010, and for the year ended December 31, 2009 (Predecessor RPI Businesses' operations). These financial statements are the responsibility of RPI Businesses' management. Our responsibility is to express an opinion on these financial statements based on our audits.
We conducted our audits in accordance with the standards of the Public Company Accounting Oversight Board (United States). Those standards require that we plan and perform the audit to obtain reasonable assurance about whether the financial statements are free of material misstatement. The RPI Businesses are not required to have, nor were we engaged to perform, an audit of its internal control over financial reporting. Our audits included consideration of internal control over financial reporting as a basis for designing audit procedures that are appropriate in the circumstances, but not for the purpose of expressing an opinion on the effectiveness of the RPI Businesses' internal control over financial reporting. Accordingly, we express no such opinion. An audit also includes examining, on a test basis, evidence supporting the amounts and disclosures in the financial statements, assessing the accounting principles used and significant estimates made by management, as well as evaluating the overall financial statement presentation. We believe that our audits provide a reasonable basis for our opinion.
In our opinion, the Successor RPI Businesses' combined financial statements present fairly, in all material respects, the combined financial position of the Successor RPI Businesses as of December 31, 2011 and 2010 and the combined results of their operations and their combined cash flows for the year ended December 31, 2011 and the period from November 10, 2010 through December 31, 2010, in conformity with accounting principles generally accepted in the United States of America. Further, in our opinion, the Predecessor RPI Businesses' combined financial statements referred to above present fairly, in all material respects, the combined results of their operations and their cash flows for the period from January 1, 2010 through November 9, 2010 and for the year ended December 31, 2009, in conformity with accounting principles generally accepted in the United States of America.
As discussed in Note 1 to the combined financial statements, on October 21, 2010, the Bankruptcy Court entered an order confirming the plan of reorganization which became effective on November 9, 2010. Accordingly, the accompanying combined financial statements have been prepared in conformity with ASC 852-10, Reorganizations, and ASC 805-10, Business Combinations, for the Successor RPI Businesses as a new entity with assets, liabilities, and a capital structure having carrying values not comparable with prior periods as described in Note 1 to the combined financial statements.
As discussed in Note 1 to the combined financial statements, the combined financial statements of the RPI Businesses include allocations of certain operating expenses from General Growth Properties, Inc. These costs may not be reflective of the actual level of costs which would have been incurred had the RPI Businesses operated as an independent, stand-alone entity separate from General Growth Properties, Inc.
/s/ Deloitte & Touche LLP
Chicago,
Illinois
March 29, 2012
F-2
RPI BUSINESSES
COMBINED BALANCE SHEETS
| |
December 31, 2011 |
December 31, 2010 |
|||||
|---|---|---|---|---|---|---|---|
| |
(In thousands) |
||||||
Assets: |
|||||||
Investment in real estate: |
|||||||
Land |
$ | 299,941 | $ | 298,791 | |||
Buildings and equipment |
1,162,541 | 1,135,406 | |||||
Less accumulated depreciation |
(72,620 | ) | (9,908 | ) | |||
Net investment in real estate |
1,389,862 | 1,424,289 | |||||
Cash and cash equivalents |
204 | 1,816 | |||||
Accounts and notes receivable, net |
17,561 | 8,390 | |||||
Deferred expenses, net |
35,549 | 20,741 | |||||
Goodwill |
— |
— |
|||||
Prepaid expenses and other assets |
140,348 | 189,028 | |||||
Total assets |
$ | 1,583,524 | $ | 1,644,264 | |||
Liabilities: |
|||||||
Mortgages, notes and loans payable |
$ | 1,059,684 | $ | 1,216,820 | |||
Accounts payable and accrued expenses |
97,512 | 97,582 | |||||
Total liabilities |
1,157,196 | 1,314,402 | |||||
Commitments and contingencies |
— | — | |||||
Equity: |
|||||||
GGP equity |
426,328 | 329,862 | |||||
Total liabilities and equity |
$ | 1,583,524 | $ | 1,644,264 | |||
The accompanying notes are an integral part of these combined financial statements.
F-3
RPI BUSINESSES
COMBINED STATEMENTS OF OPERATIONS
| |
Successor | Predecessor | |||||||||||
|---|---|---|---|---|---|---|---|---|---|---|---|---|---|
| |
Year Ended December 31, 2011 |
Period from November 10, 2010 through December 31, 2010 |
Period from January 1, 2010 through November 9, 2010 |
Year Ended December 31, 2009 |
|||||||||
| |
(In thousands) |
||||||||||||
Revenues: |
|||||||||||||
Minimum rents |
$ | 153,431 | $ | 22,751 | $ | 147,403 | $ | 184,330 | |||||
Tenant recoveries |
69,606 | 9,498 | 64,387 | 80,511 | |||||||||
Overage rents |
5,442 | 1,736 | 2,862 | 4,406 | |||||||||
Other |
6,337 | 1,555 | 5,089 | 6,985 | |||||||||
Total revenues |
234,816 | 35,540 | 219,741 | 276,232 | |||||||||
Expenses: |
|||||||||||||
Real estate taxes |
23,465 | 3,046 | 20,595 | 24,590 | |||||||||
Property maintenance costs |
13,462 | 2,017 | 10,517 | 12,269 | |||||||||
Marketing |
4,061 | 1,383 | 2,356 | 3,452 | |||||||||
Other property operating costs |
57,650 | 8,072 | 46,333 | 55,337 | |||||||||
Provision for doubtful accounts |
601 | 378 | 2,253 | 2,659 | |||||||||
Property management and other costs |
11,330 | 1,703 | 6,669 | 7,282 | |||||||||
Strategic initiatives |
— | — | — | 4,471 | |||||||||
Provisions for impairment |
— | — | — | 81,854 | |||||||||
Depreciation and amortization |
78,216 | 11,019 | 53,413 | 74,193 | |||||||||
Other |
1,526 | 313 | 16 | — | |||||||||
Total expenses |
190,311 | 27,931 | 142,152 | 266,107 | |||||||||
Operating income |
44,505 | 7,609 | 77,589 | 10,125 | |||||||||
Interest income |
36 |
1 |
56 |
18 |
|||||||||
Interest expense |
(70,984 | ) | (10,394 | ) | (88,654 | ) | (72,089 | ) | |||||
Loss before income taxes and reorganization items |
(26,443 | ) | (2,784 | ) | (11,009 | ) | (61,946 | ) | |||||
Provision for income taxes |
(533 | ) | (82 | ) | (506 | ) | (877 | ) | |||||
Reorganization items |
— | — | (9,515 | ) | 32,671 | ||||||||
Net loss |
$ | (26,976 | ) | $ | (2,866 | ) | $ | (21,030 | ) | $ | (30,152 | ) | |
The accompanying notes are an integral part of these combined financial statements.
F-4
RPI BUSINESSES
COMBINED STATEMENTS OF EQUITY
| |
Total Equity | |||
|---|---|---|---|---|
| |
(In thousands) |
|||
Predecessor |
||||
Balance at January 1, 2009 |
$ | 404,736 | ||
Net loss |
(30,152 | ) | ||
Distributions to GGP, net |
(18,597 | ) | ||
Balance at December 31, 2009 |
355,987 | |||
Net loss |
(21,030 | ) | ||
Contributions from GGP, net |
18,923 | |||
Balance at November 9, 2010 |
353,880 | |||
Successor |
||||
Effects of acquisition accounting: |
||||
Elimination of Predecessor equity |
(353,880 | ) | ||
Allocated portion of New GGP purchase price |
327,830 | |||
Balance at November 9, 2010 |
327,830 | |||
Net loss |
(2,866 | ) | ||
Contributions from GGP, net |
4,898 | |||
Balance at December 31, 2010 |
329,862 | |||
Net loss |
(26,976 | ) | ||
Contributions from GGP, net |
123,442 | |||
Balance at December 31, 2011 |
$ | 426,328 | ||
The accompanying notes are an integral part of these combined financial statements.
F-5
RPI BUSINESSES
COMBINED STATEMENTS OF CASH FLOWS
| |
Successor | Predecessor | |||||||||||
|---|---|---|---|---|---|---|---|---|---|---|---|---|---|
| |
Year Ended December 31, 2011 |
Period from November 10, 2010 through December 31, 2010 |
Period from January 1, 2010 through November 9, 2010 |
Year Ended December 31, 2009 |
|||||||||
| |
(In thousands) |
||||||||||||
Cash Flows from Operating Activities: |
|||||||||||||
Net loss |
$ | (26,976 | ) | $ | (2,866 | ) | $ | (21,030 | ) | $ | (30,152 | ) | |
Adjustments to reconcile net loss to net cash provided by operating activities: |
|||||||||||||
Provision for doubtful accounts |
601 | 378 | 2,253 | 2,659 | |||||||||
Depreciation |
71,592 | 10,364 | 46,942 | 65,394 | |||||||||
Amortization |
6,624 | 655 | 6,471 | 8,799 | |||||||||
Amortization/write-off of deferred finance costs |
— | — | 934 | 4,874 | |||||||||
Amortization (accretion) of debt market rate adjustments |
11,309 | 990 | 29,648 | (1,949 | ) | ||||||||
Amortization (accretion) of above/below market leases |
25,194 | 3,793 | (688 | ) | (468 | ) | |||||||
Straight-line rent amortization |
(6,031 | ) | (98 | ) | 137 | 80 | |||||||
Provisions for impairment |
— | — | — | 81,854 | |||||||||
Reorganization items—finance costs related to emerged entities |
— | — | 11,073 | 5,948 | |||||||||
Non-cash reorganization items |
— | — | (7,066 | ) | (38,931 | ) | |||||||
Net changes: |
|||||||||||||
Accounts and notes receivable |
(3,742 | ) | 3,376 | (1,991 | ) | (2,194 | ) | ||||||
Prepaid expenses and other assets |
(2,371 | ) | 1,625 | 4,685 | (1,204 | ) | |||||||
Deferred expenses |
(5,793 | ) | (134 | ) | (2,291 | ) | (5,844 | ) | |||||
Restricted cash |
10,536 | (13,290 | ) | (6,762 | ) | 1,809 | |||||||
Accounts payable and accrued expenses |
(220 | ) | 2,572 | (21,212 | ) | (4,967 | ) | ||||||
Net cash provided by operating activities |
80,723 | 7,365 | 41,103 | 85,708 | |||||||||
Cash Flows from Investing Activities: |
|||||||||||||
Acquisition/development of real estate and property additions/improvements |
(25,167 | ) | (14,271 | ) | (9,204 | ) | (8,307 | ) | |||||
Decrease (increase) in restricted cash |
(203 | ) | (29 | ) | (44 | ) | 89 | ||||||
Net cash used in investing activities |
(25,370 | ) | (14,300 | ) | (9,248 | ) | (8,218 | ) | |||||
Cash Flows from Financing Activities: |
|||||||||||||
Change in GGP investment, net |
111,494 | 4,898 | 30,070 | (18,597 | ) | ||||||||
Principal payments on mortgages, notes and loans payable |
(168,459 | ) | (2,565 | ) | (44,783 | ) | (52,952 | ) | |||||
Reorganization items—finance costs related to emerged entities |
— | — | (11,073 | ) | (5,948 | ) | |||||||
Net cash provided by (used in) financing activities |
(56,965 | ) | 2,333 | (25,786 | ) | (77,497 | ) | ||||||
Net change in cash and cash equivalents |
(1,612 | ) | (4,602 | ) | 6,069 | (7 | ) | ||||||
Cash and cash equivalents at beginning of period |
1,816 | 6,418 | 349 | 356 | |||||||||
Cash and cash equivalents at end of period |
$ | 204 | $ | 1,816 | $ | 6,418 | $ | 349 | |||||
Supplemental Disclosure of Cash Flow Information: |
|||||||||||||
Interest paid |
$ | 59,943 | $ | 7,509 | $ | 58,404 | $ | 70,660 | |||||
Reorganization items paid |
— | — | 16,581 | 6,260 | |||||||||
Non-Cash Transactions: |
|||||||||||||
Balance in accrued capital expenditures included in accounts payable and accrued expenses |
$ | 50 | $ | (6,722 | ) | $ | 8,136 | $ | (1,494 | ) | |||
Other non-cash GGP equity transactions |
11,948 | — | (11,147 | ) | — | ||||||||
Mortgage debt market rate adjustments related to RPI Businesses prior to the Effective Date |
— | — | 36,581 | 48,860 | |||||||||
Supplemental Cash flow Information Related to Acquisition Accounting: |
|||||||||||||
Non-cash changes related to acquisition accounting: |
|||||||||||||
Land |
$ | — | $ | — | $ | 59,188 | $ | — | |||||
Buildings and equipment, net |
— | — | (247,295 | ) | — | ||||||||
Accounts and notes receivable, net |
— | — | (23,039 | ) | — | ||||||||
Deferred expenses, net |
— | — | 8,253 | — | |||||||||
Prepaid and other assets |
— | — | 158,990 | — | |||||||||
Mortgages, notes and loans payable |
— | — | (55,866 | ) | — | ||||||||
Accounts payable and accrued expenses |
— | — | 38,013 | — | |||||||||
Equity |
— | — | (26,050 | ) | — | ||||||||
The accompanying notes are an integral part of these combined financial statements.
F-6
RPI BUSINESSES
NOTES TO COMBINED FINANCIAL STATEMENTS
NOTE 1 ORGANIZATION
General
Rouse Properties, Inc. ("Rouse" or the "Company") is a newly formed Delaware corporation that was created to hold certain assets and liabilities of General Growth Properties, Inc. ("GGP") and its subsidiaries. As of December 31, 2011, Rouse was a wholly owned subsidiary of GGP Limited Partnership ("GGPLP"). GGP distributed the assets and liabilities of 30 of its wholly owned properties ("RPI Businesses") to Rouse on January 12, 2012 (the "Spin-Off Date"). Before the spin-off, we had not conducted any business as a separate company and had no material assets or liabilities. The operations of the business transferred to us by GGP on the spin-off date is presented as if the transferred business was our business for all historical periods described and at the carrying value of such assets and liabilities reflected in GGP's books and records. Unless the context otherwise requires, references to "we", "us" and "our" refer to RPI Businesses after giving effect to the transfer of assets and liabilities from GGP. Before the spin-off, RPI Businesses were operated as subsidiaries of GGP, which operates as a real estate investment trust ("REIT"). We are expected to operate as a REIT subsequent to the spin-off.
The successful execution of our business strategy will require the availability of substantial amounts of operating and development capital both initially and over time. Sources of such capital initially include bank borrowings and equity capital to be raised from a rights offering which is disclosed further in Note 13 to the combined financial statements. We do not believe GGP will have an ongoing long term relationship with Rouse and GGP will not have any ongoing financial commitments to Rouse.
In April of 2009, GGP's predecessor ("Old GGP" or the "Predecessor") and certain of its domestic subsidiaries filed voluntary petitions for relief under Chapter 11 of Title 11 of the United States Code ("Chapter 11"). On October 21, 2010, the Bankruptcy Court entered an order confirming the plan of reorganization which became effective on November 9, 2010 (the "Effective Date"). On the Effective Date, General Growth Properties, Inc. ("GGP" or the "Successor") emerged from Chapter 11 bankruptcy after receiving a significant equity infusion from investors and other associated events. As a result of the emergence from bankruptcy and the related equity infusion, the majority of equity in GGP changed ownership, which triggered the application of acquisition accounting to the assets and liabilities of GGP. As a result, the application of acquisition accounting has been applied to the assets and liabilities of RPI Businesses and therefore the combined financial statements are presented separately for the Predecessor and Successor for all periods presented. In addition, the accompanying combined financial statements have been prepared in conformity with ASC 852-10, Reorganizations, and ASC 805-10, Business Combinations, for the Successor RPI Businesses as a new entity with assets, liabilities, and a capital structure having carrying values not comparable with prior periods as described in Note 3 to the combined financial statements.
Principles of Combination and Basis of Presentation
The accompanying combined financial statements include the accounts of RPI Businesses presented on a combined basis under accounting principles generally accepted in the United States of America ("GAAP") as RPI Businesses are under common control and 100% ownership of GGP. All significant intercompany balances and transactions between RPI Businesses have been eliminated.
Our combined financial statements are derived from the books and records of GGP and were carved-out from GGP at a carrying value reflective of such historical cost in such GGP records. Our historical financial results reflect allocations for certain corporate costs and we believe such allocations
F-7
RPI BUSINESSES
NOTES TO COMBINED FINANCIAL STATEMENTS (Continued)
NOTE 1 ORGANIZATION (Continued)
are reasonable; however, such results do not reflect what our expenses would have been had the Company been operating as a separate stand-alone public company. The corporate allocations for the year ended December 31, 2011 aggregated $10.7 million. The allocations for the period from November 10, 2010 through December 31, 2010 and the period from January 1, 2010 through November 9, 2010 were $1.7 million and $6.7 million, respectively. For the year ended December 31, 2009, the allocations were $7.3 million. These allocations have been included in property management and other costs on the combined statements of operations. Costs of the services that were allocated or charged to us were based on either actual costs incurred or a proportion of costs estimated to be applicable to us based on a number of factors, most significantly our percentages of GGP's adjusted revenue and carrying value of assets and also the number of properties. Our historical financial statements also include costs that have been paid by GGP specifically attributable to Rouse in conjunction with the spin-off and the rights offering. Approximately $9.3 million of these costs are capitalized as deferred expenses, net and approximately $1.7 million are capitalized as prepaid expenses and other assets on the combined balance sheets as of December 31, 2011 and $1.4 million are expensed as other in the combined statements of operations for the year ended December 31, 2011. The historical combined financial information presented will therefore not be indicative of the results of operations, financial position or cash flows that would have been obtained if we had been an independent, stand-alone public REIT entity during the periods presented or of our future performance as an independent, stand-alone public entity.
We operate in a single reportable segment referred to as our retail segment, which includes the operation, development and management of regional malls. Each of our operating properties is considered a separate operating segment, as each property earns revenues and incurs expenses, individual operating results are reviewed and discrete financial information is available. We do not distinguish or group our consolidated operations based on geography, size or type. Further, all material operations are within the United States and no customer or tenant comprises more than 10% of combined revenues. As a result, the Company's operating properties are aggregated into a single reportable segment.
NOTE 2 SUMMARY OF SIGNIFICANT ACCOUNTING POLICIES
Properties
Real estate assets acquired subsequent to the Effective Date are stated at cost less any provisions for impairments. As discussed in Note 3 to the combined financial statements, the real estate assets of RPI Businesses were recorded at fair value pursuant to the application of acquisition accounting on the Effective Date. Construction and improvement costs incurred in connection with the development of new properties or the redevelopment of existing properties are capitalized to the extent the total carrying amount of the property does not exceed the estimated fair value of the completed property. Real estate taxes and interest costs incurred during construction periods are capitalized. Capitalized interest costs are based on qualified expenditures and interest rates in place during the construction period. Capitalized real estate taxes and interest costs are amortized over lives which are consistent with the constructed assets.
Pre-development costs, which generally include legal and professional fees and other directly-related third-party costs, are capitalized as part of the property being developed. In the event a development is no longer deemed to be probable, the costs previously capitalized are expensed.
F-8
RPI BUSINESSES
NOTES TO COMBINED FINANCIAL STATEMENTS (Continued)
NOTE 2 SUMMARY OF SIGNIFICANT ACCOUNTING POLICIES (Continued)
Tenant improvements, either paid directly or in the form of construction allowances paid to tenants, are capitalized and depreciated over the shorter of the useful life or applicable lease term. Maintenance and repairs are charged to expense when incurred. Expenditures for significant betterments and improvements are capitalized. In leasing tenant space, we may provide funding to the lessee through a tenant allowance. In accounting for a tenant allowance, we determine whether the allowance represents funding for the construction of leasehold improvements and evaluate the ownership, for accounting purposes, of such improvements. If we are considered the owner of the leasehold improvements for accounting purposes, we capitalize the amount of the tenant allowance and depreciate it over the shorter of the useful life of the leasehold improvements or the related lease term. If the tenant allowance represents a payment for a purpose other than funding leasehold improvements, or in the event we are not considered the owner of the improvements for accounting purposes, the allowance is considered to be a lease incentive and is recognized over the lease term as a reduction of rental revenue on a straight-line basis.
Depreciation or amortization expense is computed using the straight-line method based upon the following estimated useful lives:
| |
Years | |
|---|---|---|
Buildings and improvements |
45 | |
Equipment and fixtures |
5 - 10 | |
Tenant improvements |
Shorter of useful life or applicable lease term |
Accumulated depreciation was reset to zero on the Effective Date in conjunction with the application of the acquisition method of accounting.
Impairment
Operating properties and intangible assets
Accounting for the impairment or disposal of long-lived assets require that if impairment indicators exist and the undiscounted cash flows expected to be generated by an asset are less than its carrying amount, an impairment provision should be recorded to write down the carrying amount of such asset to its fair value. We review our real estate assets for potential impairment indicators whenever events or changes in circumstances indicate that the carrying amount may not be recoverable.
Impairment indicators are assessed separately for each property and include, but are not limited to, significant decreases in real estate property net operating income and occupancy percentages.
Impairment indicators for pre-development costs, which are typically costs incurred during the beginning stages of a potential development and developments in progress are assessed by project and include, but are not limited to, significant changes the Company's plans with respect to the project, significant changes in projected completion dates, revenues or cash flows, development costs, market factors and sustainability of development projects.
If an indicator of potential impairment exists, the asset is tested for recoverability by comparing its carrying amount to the estimated future undiscounted cash flows. The cash flow estimates used both for determining recoverability and estimating fair value are inherently judgmental and reflect current
F-9
RPI BUSINESSES
NOTES TO COMBINED FINANCIAL STATEMENTS (Continued)
NOTE 2 SUMMARY OF SIGNIFICANT ACCOUNTING POLICIES (Continued)
and projected trends in rental, occupancy and capitalization rates, and estimated holding periods for the applicable assets. Although the estimated fair value of certain assets may be exceeded by the carrying amount, a real estate asset is only considered to be impaired when its carrying amount cannot be recovered through estimated future undiscounted cash flows. To the extent an impairment provision is determined to be necessary, the excess of the carrying amount of the asset over its estimated fair value is expensed to operations. In addition, the impairment provision is allocated proportionately to adjust the carrying amount of the asset. The adjusted carrying amount, which represents the new cost basis of the asset, is depreciated over the remaining useful life of the asset.
RPI Businesses recorded no impairment charges related to its operating properties for the year ended December 31, 2011, the period from November 10, 2010 to December 31, 2010, or the period from January 1, 2010 to November 9, 2010. RPI Businesses did record an impairment of $77.1 million for the year ended December 31, 2009 related to its operating properties. These impairment charges are included in provisions for impairment in the Predecessor's combined statements of operations.
Goodwill
With respect to RPI Businesses, the excess of the cost of an acquired entity over the net of the amounts assigned to assets acquired (including identified intangible assets) and liabilities assumed was recorded as goodwill. Goodwill was recognized and allocated to specific properties since each individual rental property or each operating property is an operating segment and considered a reporting unit. Goodwill is tested for impairment annually or more frequently if events or changes in circumstances indicate that the asset might be impaired. RPI Businesses performed this test by first comparing the estimated fair value of each property to the book value of the property, including, if applicable, its allocated portion of aggregate goodwill. RPI Businesses assessed fair value based on estimated future cash flow projections that utilize discount and capitalization rates which are generally unobservable in the market place (Level 3 inputs) under these principles, but approximate the inputs we believe would be utilized by market participants in assessing fair value. Estimates of future cash flows were based on a number of factors including the historical operating results, known trends, and market/economic conditions. If the carrying amount of a property, including its goodwill, exceeded its estimated fair value, the second step of the goodwill impairment test was performed to measure the amount of impairment loss, if any. In this second step, if the implied fair value of goodwill was less than the carrying amount of goodwill, an impairment charge was recorded. The application of acquisition accounting on the Effective Date did not yield any goodwill for the Successor and all prior RPI Businesses goodwill amounts were eliminated.
As of December 31, 2009 and as of the end of each quarter in 2009, RPI Businesses performed interim impairment tests of goodwill as changes in market and economic conditions indicated an impairment might have occurred. As a result of the procedures performed, RPI Businesses recorded provisions for impairment of goodwill of $4.7 million for the year ended December 31, 2009, as
F-10
RPI BUSINESSES
NOTES TO COMBINED FINANCIAL STATEMENTS (Continued)
NOTE 2 SUMMARY OF SIGNIFICANT ACCOUNTING POLICIES (Continued)
presented in the table below. During 2010, until the Effective Date, there were no events or circumstances that indicated that the then current carrying amount of goodwill might be impaired.
| |
Predecessor | ||||||
|---|---|---|---|---|---|---|---|
| |
2010 | 2009 | |||||
Balance as of January 1, |
|||||||
Goodwill before accumulated impairment losses |
$ | 9,819 | $ | 9,819 | |||
Accumulated impairment losses |
(5,484 | ) | (738 | ) | |||
Goodwill, net |
4,335 | 9,081 | |||||
Goodwill impairment losses during the year |
— | (4,746 | ) | ||||
Balance as of December 31 (November 9 for 2010) |
$ | 4,335 | $ | 4,335 | |||
Summary of Impairment Provisions:
| |
|
|
Predecessor | |||||
|---|---|---|---|---|---|---|---|---|
| |
|
Method of Determining Fair Value | ||||||
Impaired Asset
|
Location | 2009 | ||||||
| |
|
|
(In thousands) |
|||||
Cache Valley Mall |
Logan, UT | Discounted cash flow analysis | $ | 3,169 | ||||
Cache Valley Marketplace |
Logan, UT | Discounted cash flow analysis | 938 | |||||
North Plains Mall |
Clovis, NM | Discounted cash flow analysis | 2,496 | |||||
Silver Lake Mall |
Couer d'Alene, ID | Discounted cash flow analysis | 10,134 | |||||
Spring Hill Mall |
West Dundee, IL | Discounted cash flow analysis | 59,050 | |||||
Various pre-development costs |
1,321 | |||||||
Total provisions for impairment |
77,108 | |||||||
Goodwill impairment |
4,746 | |||||||
Total provisions for impairment |
$ | 81,854 | ||||||
Acquisitions of Operating Properties
Acquisitions of properties are accounted for utilizing the acquisition method of accounting and, accordingly, the results of operations of acquired properties were included in the results of operations from the respective dates of acquisition. Estimates of future cash flows and other valuation techniques were used to allocate the purchase price of acquired property between land, buildings and improvements, equipment, debt liabilities assumed and identifiable intangible assets and liabilities such as amounts related to in-place tenant leases, acquired above and below-market tenant and ground leases and tenant relationships. No significant value had been ascribed to the tenant relationships at the acquired properties in previous years by RPI Businesses or by the Successor in 2010 (Note 3).
Cash and Cash Equivalents
Highly-liquid investments with maturities, at dates of purchase, of three months or less are classified as cash equivalents.
F-11
RPI BUSINESSES
NOTES TO COMBINED FINANCIAL STATEMENTS (Continued)
NOTE 2 SUMMARY OF SIGNIFICANT ACCOUNTING POLICIES (Continued)
Leases
Leases which transfer substantially all the risks and benefits of ownership to tenants are considered finance leases and the present values of the minimum lease payments and the estimated residual values of the leased properties, if any, are accounted for as receivables. Leases which transfer substantially all the risks and benefits of ownership to us are considered capital leases and the present values of the minimum lease payments are accounted for as assets and liabilities. All other leases are treated as operating leases.
Deferred Expenses
Deferred expenses consist principally of financing fees and leasing costs and commissions. Deferred financing fees are amortized to interest expense using the effective interest method (or other methods which approximate the effective interest method) over the terms of the respective financing agreements. The acquisition method of accounting eliminated such balances of deferred finance fees and the Successor only has amounts incurred subsequent to the Effective Date. Deferred leasing costs and commissions are capitalized and amortized using the straight-line method over periods that approximate the related lease terms.
Revenue recognition and related matters
Minimum rent revenues are recognized on a straight-line basis over the terms of the related leases. Minimum rent revenues also include amounts collected from tenants to allow the termination of their leases prior to their scheduled termination dates as well as the amortization/accretion related to above and below-market tenant leases on acquired properties and the impact of acquisition accounting. Minimum rent revenues also include percentage rents in lieu of minimum rent which are leases that we receive a percentage of tenant revenues. The following is a summary of termination income, net amortization/accretion related to above and below-market tenant leases and percentage rent in lieu of minimum rent:
| |
Successor | Predecessor | |||||||||||
|---|---|---|---|---|---|---|---|---|---|---|---|---|---|
| |
Year Ended December 31, 2011 |
Period from November 10 through December 31, 2010 |
Period from January 1 through November 9, 2010 |
Year Ended December 31, 2009 |
|||||||||
| |
(In thousands) |
||||||||||||
Amortization of straight-line rent |
6,031 | 98 | (137 | ) | (80 | ) | |||||||
Lease termination income |
1,389 | 15 | 845 | 1,568 | |||||||||
Net amortization/accretion of above and below-market tenant leases |
(25,194 | ) | (3,793 | ) | 688 | 468 | |||||||
Percentage rents in lieu of minimum rent |
9,443 | 2,145 | 7,430 | 8,541 | |||||||||
Straight-line rent receivables represent the current net cumulative rents recognized prior to when billed and collectible as provided by the terms of the leases. The following is a summary of straight-line
F-12
RPI BUSINESSES
NOTES TO COMBINED FINANCIAL STATEMENTS (Continued)
NOTE 2 SUMMARY OF SIGNIFICANT ACCOUNTING POLICIES (Continued)
rent receivables, which are included in accounts and notes receivable, net in our combined balance sheets and are reduced for allowances and amounts doubtful of collection:
| |
December 31, 2011 |
December 31, 2010 |
|||||
|---|---|---|---|---|---|---|---|
| |
(In thousands) |
||||||
Straight-line rent receivables, net |
$ | 6,086 | $ | 55 | |||
We provide an allowance for doubtful accounts against the portion of accounts receivable, including straight-line rents, which is estimated to be uncollectible. Such allowances are reviewed periodically based upon our recovery experience. We also evaluate the probability of collecting future rent which is recognized currently under a straight- line methodology. This analysis considers the long-term nature of our leases, as a certain portion of the straight-line rent currently recognizable will not be billed to the tenant until future periods. Our experience relative to unbilled deferred rent receivable is that a certain portion of the amounts recorded as straight-line rental revenue are never collected from (or billed to) tenants due to early lease terminations. For that portion of the recognized deferred rent that is not deemed to be probable of collection, an allowance for doubtful accounts has been provided. Accounts receivable are shown net of an allowance for doubtful accounts of $2.9 million as of December 31, 2011, $4.1 million as of December 31, 2010, $5.5 million as of November 9, 2010 and $4.7 million as of December 31, 2009. The following table summarizes the changes in allowance for doubtful accounts:
| |
Successor | Predecessor | |||||||||||
|---|---|---|---|---|---|---|---|---|---|---|---|---|---|
| |
2011 | 2010 | 2010 | 2009 | |||||||||
| |
(In thousands) |
||||||||||||
Balance at beginning of period |
$ | 4,070 | $ | 5,497 | $ | 4,734 | $ | 3,442 | |||||
Provision for doubtful accounts |
601 |
378 |
2,253 |
2,659 |
|||||||||
Write-offs |
(1,728 | ) | (1,805 | ) | (1,490 | ) | (1,367 | ) | |||||
Balance at end of period |
$ | 2,943 | $ | 4,070 | $ | 5,497 | $ | 4,734 | |||||
Overage rent is paid by a tenant when its sales exceed an agreed upon minimum amount. Overage rent is calculated by multiplying the sales in excess of the minimum amount by a percentage defined in the lease. Overage rent is recognized on an accrual basis once tenant sales exceed contractual tenant lease thresholds. Recoveries from tenants are established in the leases or computed based upon a formula related to real estate taxes, insurance and other shopping center operating expenses and are generally recognized as revenues in the period the related costs are incurred. The Company makes certain assumptions and judgments in estimating the reimbursements at the end of each reporting period. The Company does not expect the actual results to materially differ from the estimated reimbursement.
Income Taxes
RPI Businesses have historically operated under GGP's REIT structure. Subsequent to the spin-off of RPI Businesses to Rouse, we expect to operate as a REIT. To avoid current entity level U.S. federal income taxes, we expect to distribute 100% of our capital gains and at least 90% of our ordinary income to shareholders annually. If, with respect to any taxable year, we fail to maintain our
F-13
RPI BUSINESSES
NOTES TO COMBINED FINANCIAL STATEMENTS (Continued)
NOTE 2 SUMMARY OF SIGNIFICANT ACCOUNTING POLICIES (Continued)
qualification as a REIT, we would not be allowed to deduct distributions to shareholders in computing our taxable income and federal income tax. If we lose our REIT status, corporate level income tax, including any applicable alternative minimum tax, would apply to our taxable income at regular corporate rates. As a result, the amount available for distribution to holders of equity securities that would otherwise receive dividends would be reduced for the year or years involved, and we would no longer be required to make distributions. In addition, unless we were entitled to relief under the relevant statutory provisions, we would be disqualified from treatment as a REIT for four subsequent taxable years.
Fair value Measurements
The accounting principles for fair value measurements establish a three-tier fair value hierarchy, which prioritizes the inputs used in measuring fair value. These tiers include:
- •
- Level 1—defined as observable inputs such as quoted prices for identical assets or liabilities in
active markets;
- •
- Level 2—defined as inputs other than quoted prices in active markets that are either directly or
indirectly observable; and
- •
- Level 3—defined as unobservable inputs in which little or no market data exists, therefore requiring an entity to develop its own assumptions.
The following table summarizes our assets and liabilities that are measured at fair value on a nonrecurring basis. There were no such assets and liabilities measured on a nonrecurring basis for the year ended December 31, 2011 or the period from November 10, 2010 through December 31, 2010.
| |
Total Fair Value Measurement |
Quoted Prices in Active Markets for Identical Assets (Level 1) |
Significant Other Observable Inputs (Level 2) |
Significant Unobservable Inputs (Level 3) |
Total (Loss) Gain Period from January 1, 2010 through November 9, 2010 |
Total (Loss) Gain Year Ended December 31, 2009 |
|||||||||||||
|---|---|---|---|---|---|---|---|---|---|---|---|---|---|---|---|---|---|---|---|
| |
(In thousands) |
||||||||||||||||||
Investments in real estate: |
|||||||||||||||||||
Cache Valley Mall |
$ | 26,695 | $ | — | $ | — | $ | 26,695 | $ | — | $ | (3,169 | ) | ||||||
Cache Valley Marketplace |
8,100 | — | — | 8,100 | — | (938 | ) | ||||||||||||
North Plains Mall |
15,252 | — | — | 15,252 | — | (2,496 | ) | ||||||||||||
Silver Lake Mall |
16,038 | — | — | 16,038 | — | (10,134 | ) | ||||||||||||
Spring Hill Mall |
49,294 | — | — | 49,294 | — | (59,050 | ) | ||||||||||||
Various pre-development costs |
1,321 | 1,321 | (1,321 | ) | |||||||||||||||
Total |
$ | 116,700 | $ | — | $ | — | $ | 116,700 | $ | — | $ | (77,108 | ) | ||||||
Goodwill |
$ | 4,335 | $ | — | $ | — | $ | 4,335 | $ | — | $ | (4,746 | ) | ||||||
Liabilities: |
|||||||||||||||||||
Fair value of emerged entity mortgage debt(1) |
$ | 314,997 | $ | — | $ | — | $ | 314,997 | $ | 36,581 | $ | 48,860 | |||||||
- (1)
- The fair value of debt relates to all properties that filed for bankruptcy under the Plan and have emerged during the year ended November 9, 2010.
F-14
RPI BUSINESSES
NOTES TO COMBINED FINANCIAL STATEMENTS (Continued)
NOTE 2 SUMMARY OF SIGNIFICANT ACCOUNTING POLICIES (Continued)
We estimated fair value relating to these impairment assessments based upon discounted cash flow and direct capitalization models that included all projected cash inflows and outflows over a specific holding period, or the negotiated sales price, if applicable. Such projected cash flows are comprised of unobservable inputs which include contractual rental revenues and forecasted rental revenues and expenses based upon market conditions and expectations for growth. Capitalization rates and discount rates utilized in these models were based upon observable rates that we believed to be within a reasonable range of current market rates for each property analyzed. Based upon these inputs, we determined that our valuations of properties using a discounted cash flow or a direct capitalization model were classified within Level 3 of the fair value hierarchy.
In addition, the fair value of liabilities related to debt on the properties that filed for bankruptcy and emerged during the period from April 9, 2009 through November 9, 2010 was $315.0 million as of November 9, 2010 which was determined based on Level 3 inputs by calculating the net present value of debt using current market rates.
Fair value of Financial Instruments
The fair values of our financial instruments approximate their carrying amount in our combined financial statements except for debt. At December 31, 2011 and 2010, management's required estimates of fair value are presented below. We estimated the fair value of this debt based on recent financing transactions (which may not be comparable), estimates of the fair value of the property that serves as collateral for such debt, historical risk premiums for loans of comparable quality, current London Interbank Offered Rate ("LIBOR"), a widely quoted market interest rate which is frequently the index used to determine the rate at which we borrow funds, U.S. treasury obligation interest rates and on the discounted estimated future cash payments to be made on such debt. The discount rates estimated reflect our judgment as to what the approximate current lending rates for loans or groups of loans with similar maturities and credit quality would be if credit markets were operating efficiently and assume that the debt is outstanding through maturity. We have utilized market information as available or present value techniques to estimate the amounts required to be disclosed, or, in the case of the fair value calculation as of the Effective Date, recorded due to GAAP bankruptcy emergence guidance. Since such amounts are estimates that are based on limited available market information for similar transactions and do not acknowledge transfer or other repayment restrictions that may exist in specific loans, it is unlikely that the estimated fair value of any of such debt could be realized by immediate settlement of the obligation.
| |
December 31, 2011 | December 31, 2010 | |||||||||||
|---|---|---|---|---|---|---|---|---|---|---|---|---|---|
| |
Carrying Amount | Estimated Fair Value |
Carrying Amount | Estimated Fair Value |
|||||||||
| |
(In thousands) |
||||||||||||
Fixed-rate debt |
$ | 731,235 | $ | 787,551 | $ | 880,673 | $ | 942,088 | |||||
Variable-rate debt |
328,449 | 328,162 | 336,147 | 336,216 | |||||||||
Total Mortgages, notes and loans payable |
$ | 1,059,684 | $ | 1,115,713 | $ | 1,216,820 | $ | 1,278,304 | |||||
F-15
RPI BUSINESSES
NOTES TO COMBINED FINANCIAL STATEMENTS (Continued)
NOTE 2 SUMMARY OF SIGNIFICANT ACCOUNTING POLICIES (Continued)
Reorganization Items
Reorganization items are expense or income items that were incurred or realized as a result of the Chapter 11 Cases and are presented separately in the combined statements of operations of the Predecessor. These items include professional fees and similar types of expenses and gains on liabilities subject to compromise directly related to the Chapter 11 Cases, resulting from activities of the reorganization process, and interest earned on cash accumulated as a result of the Chapter 11 cases. No reorganization items were recorded for the year ended December 31, 2011 or the period from November 10, 2010 through December 31, 2010.
Reorganization items are as follows:
| |
Predecessor | ||||||
|---|---|---|---|---|---|---|---|
Reorganization Items
|
Period from January 1, 2010 to November 9, 2010 |
Period Ended December 31, 2009 |
|||||
| |
(In thousands) |
||||||
(Gains) loss on liabilities subject to compromise—other(1) |
$ | 868 | $ | (420 | ) | ||
(Gains) on liabilities subject to compromise—mortgage debt(2) |
(36,581 | ) | (48,860 | ) | |||
U.S. Trustee fees |
748 | 312 | |||||
Restructuring costs(3) |
44,480 | 16,297 | |||||
Total reorganization items |
$ | 9,515 | $ | (32,671 | ) | ||
- (1)
- This
amount includes gains from repudiation, rejection or termination of contracts or guarantee of obligations. Such gains reflect agreements reached with
certain critical vendors, which were authorized by the Bankruptcy Court and for which payments on an installment basis began in July 2009.
- (2)
- Such
net gains include the fair value adjustments of mortgage debt resulting from the write off of existing fair value of debt adjustments for the entities
that emerged from bankruptcy prior to GGP emerging from bankruptcy.
- (3)
- Restructuring costs primarily include professional fees incurred related to the bankruptcy filings, the estimated Key Employee Incentive Program ("KEIP") payment, finance costs related to the RPI Businesses and the write off of unamortized deferred finance costs related to the RPI Businesses.
Use of Estimates
The preparation of financial statements in conformity with accounting principles generally accepted in the United States of America requires management to make estimates and assumptions. These estimates and assumptions affect the reported amounts of assets and liabilities and the disclosure of contingent assets and liabilities at the date of the financial statements and the reported amounts of revenues and expenses during the reporting periods. For example, estimates and assumptions have been made with respect to fair values of assets and liabilities for purposes of applying the acquisition method of accounting, the useful lives of assets, capitalization of development and leasing costs, recoverable amounts of receivables, initial valuations and related amortization periods of deferred costs and intangibles, particularly with respect to acquisitions, impairment of long-lived assets, goodwill and fair value of debt. Actual results could differ from these and other estimates.
F-16
RPI BUSINESSES
NOTES TO COMBINED FINANCIAL STATEMENTS (Continued)
NOTE 3 ACQUISITIONS AND INTANGIBLES
Acquisition Method of Accounting Adjustments on the Effective Date
As discussed in Note 1 to the combined financial statements, the application of acquisition accounting has been applied to the assets and liabilities of the RPI Businesses and therefore the combined financial statements are presented separately for the Predecessor and Successor. The acquisition method of accounting adjustments recorded on the Effective Date reflect the allocation of the estimated purchase price as presented in the table below. Such adjustments reflect the amounts required to adjust the carrying values of our assets and liabilities, after giving effect to the transactions pursuant to the Plan. The fair values of such remaining assets and liabilities, with the offset to capital, as provided by the acquisition method of accounting is presented in the following table.
| |
November 9, 2010 | ||||||
|---|---|---|---|---|---|---|---|
| |
(In thousands) |
||||||
Allocated portion of New GGP purchase price |
$ | 334,247 | |||||
Less: Cash on hand |
(6,417 | ) | |||||
Plus: Assumed liabilities |
|||||||
Fair value of mortgages, notes and loans payable |
1,218,401 | ||||||
Accounts payable and accrued expenses: |
|||||||
Below-market tenant leases |
57,361 | ||||||
Accounts payable |
2,096 | ||||||
Real estate tax payable |
11,075 | ||||||
Other accounts payable and accrued expenses |
33,375 | ||||||
Total accounts payable and accrued expenses |
103,907 | ||||||
Total assumed liabilities |
1,322,308 | ||||||
Total purchase price |
$ | 1,650,138 | |||||
Land |
$ | 298,791 | |||||
Buildings and equipment: |
|||||||
Buildings and equipment |
959,928 | ||||||
Tenant improvements |
64,168 | ||||||
In-place leases |
102,750 | ||||||
Total buildings and equipment |
1,126,846 | ||||||
Developments in progress |
1,467 | ||||||
Cash and cash equivalents |
6,417 | ||||||
Accounts and notes receivable, net |
12,046 | ||||||
Deferred expenses, net: |
|||||||
Lease commissions |
18,433 | ||||||
Capitalized legal / marketing costs |
2,830 | ||||||
Total deferred expenses, net |
21,263 | ||||||
Prepaid expenses and other assets: |
|||||||
Above-market tenant leases |
163,224 | ||||||
Below-market ground leases |
2,173 | ||||||
Security and escrow deposits |
10,336 | ||||||
Prepaid expenses |
4,747 | ||||||
Other |
2,828 | ||||||
Total prepaid expenses and other assets |
183,308 | ||||||
Total fair value of assets |
$ | 1,650,138 | |||||
F-17
RPI BUSINESSES
NOTES TO COMBINED FINANCIAL STATEMENTS (Continued)
NOTE 3 ACQUISITIONS AND INTANGIBLES (Continued)
The aggregate fair value of the assets and liabilities of RPI Businesses were computed using estimates of future cash flows and other valuation techniques, including estimated discount and capitalization rates, and such estimates and techniques were also used to allocate the purchase price of acquired property between land, buildings, equipment, tenant improvements and identifiable intangible assets and liabilities such as amounts related to in-place at-market tenant leases, acquired above and below-market tenant and ground leases. Elements of the Predecessor's working capital have been reflected at current carrying amounts as such short-term items are assumed to be settled in cash within 12 months at such values.
The fair values of tangible assets are determined on an "if vacant" basis. The "if vacant" fair value is allocated to land, where applicable, buildings, equipment and tenant improvements based on comparable sales and other relevant information with respect to the property. Specifically, the "if vacant" value of the buildings and equipment was calculated using a cost approach utilizing published guidelines for current replacement cost or actual construction costs for similar, recently developed properties; and an income approach. Assumptions used in the income approach to the value of buildings include: capitalization and discount rates, lease-up time, market rents, make ready costs, land value, and site improvement value. We believe that the most influential assumption in the estimation of value based on the income approach is the assumed discount rate and an average one half of one percent change in the aggregate discount rates applied to our estimates of future cash flows would result in an approximate 3.5 percent change in the aggregate estimated value of our real estate investments. With respect to developments in progress, the fair value of such projects approximated the carrying value.
The estimated fair value of in-place tenant leases includes lease origination costs (the costs we would have incurred to lease the property to the current occupancy level of the property) and the lost revenues during the period necessary to lease-up from vacant to the current occupancy level. Such estimate includes the fair value of leasing commissions, legal costs and tenant coordination costs that would be incurred to lease the property to this occupancy level. Additionally, we evaluate the time period over which such occupancy level would be achieved and include an estimate of the net operating costs (primarily real estate taxes, insurance and utilities) incurred during the lease-up period, which generally ranges up to one year. The fair value of acquired in-place tenant leases is included in the balance of buildings and equipment and amortized over the remaining lease term for each tenant.
Intangible assets and liabilities were calculated for above-market and below-market tenant and ground leases where we are either the lessor or the lessee. Above-market and below-market tenant and ground lease values were valued (using an interest rate which reflects the risks associated with the leases acquired) based on the difference between the contractual amounts to be received or paid pursuant to the leases and our estimate of fair market lease rates for the corresponding leases, measured over a period equal to the remaining non-cancelable term of the leases, including below market renewal options. The variance between contract rent versus prevailing market rent is projected to expiration for each particular tenant and discounted back to the date of acquisition. Significant assumptions used in determining the fair value of leasehold assets and liabilities include: (1) the market rental rate, (2) market reimbursements, (3) the market rent growth rate and (4) discount rates. Above and below-market lease values are amortized over the remaining non-cancelable terms of the respective leases (approximately five years for tenant leases and approximately 35 years for ground leases). The remaining term of leases with lease renewal options with terms significantly below (25% or more discount to the assumed market rate of the tenant's space at the time the renewal option is to apply)
F-18
RPI BUSINESSES
NOTES TO COMBINED FINANCIAL STATEMENTS (Continued)
NOTE 3 ACQUISITIONS AND INTANGIBLES (Continued)
market reflect the assumed exercise of such renewal options and assume the amortization period would coincide with the extended lease term. Due to existing contacts and relationships with tenants at our currently owned properties and that there was no significant perceived difference in the renewal probability of a tenant based on such relationship, no significant value has been ascribed to the tenant relationships at the properties.
In estimating the fair value of the related below market lease liability, we assumed that tenants with renewal options would exercise this option if the renewal rate was at least 25% below the estimated market rate at the time of renewal. We have utilized this assumption, which we believe to be reasonable, because we believe that such a discount would be compelling and that tenants would elect to renew their leases under such favorable terms. We believe that at a discount of less than 25%, the tenant also considers qualitative factors in deciding whether to renew a below-market lease and, accordingly, renewal can not be assumed. In cases where we have assumed renewal of the below-market lease, we have used the terms of the leases, as renewed, including any below market renewal options, to amortize the calculated below-market lease intangible. If we had used a discount to estimated market rates of 10% rather than 25%, there would not have been a material change in the below-market lease intangible or the amortization of such intangible.
We estimated the fair value of debt based on quoted market prices for publicly-traded debt, recent financing transactions (which may not be comparable), estimates of the fair value of the property that serves as collateral for such debt, historical risk premiums for loans of comparable quality, the current London Interbank Offered Rate ("LIBOR"), a widely quoted market interest rate which is frequently the index used to determine the rate at which we borrow funds and U.S. treasury obligation interest rates, and on the discounted estimated future cash payments to be made on such debt. The discount rates estimated reflect our judgment as to what the approximate current lending rates for loans or groups of loans with similar maturities and credit quality would be if credit markets were operating efficiently and assume that the debt is outstanding through maturity. We have utilized market information as available or present value techniques to estimate such amounts. Since such amounts are estimates that are based on limited available market information for similar transactions and do not acknowledge transfer or other repayment restrictions that may exist in specific loans, it is unlikely that the estimated fair value of any of such debt could be realized by immediate settlement of the obligation.
F-19
RPI BUSINESSES
NOTES TO COMBINED FINANCIAL STATEMENTS (Continued)
NOTE 3 ACQUISITIONS AND INTANGIBLES (Continued)
Intangible Assets and Liabilities
The following table summarizes our intangible assets and liabilities:
| |
Gross Asset (Liability) |
Accumulated (Amortization)/ Accretion |
Net Carrying Amount |
|||||||
|---|---|---|---|---|---|---|---|---|---|---|
| |
|
(In thousands) |
|
|||||||
Successor—As of December 31, 2011 |
||||||||||
Tenant leases: |
||||||||||
In-place value |
$ | 101,425 | $ | (33,389 | ) | $ | 68,036 | |||
Above-market |
157,139 | (40,464 | ) | 116,675 | ||||||
Below-market |
(53,882 | ) | 13,762 | (40,120 | ) | |||||
Ground leases: |
||||||||||
Below-market |
2,173 | (142 | ) | 2,031 | ||||||
Successor—As of December 31, 2010 |
||||||||||
Tenant leases: |
||||||||||
In-place value |
$ | 102,487 | $ | (4,822 | ) | $ | 97,665 | |||
Above-market |
162,663 | (5,394 | ) | 157,269 | ||||||
Below-market |
(57,208 | ) | 2,003 | (55,205 | ) | |||||
Ground leases: |
||||||||||
Below-market |
2,173 | (18 | ) | 2,155 | ||||||
The gross asset balances of the in-place value of tenant leases are included in buildings and equipment in our combined balance sheets. Acquired in-place tenant leases are amortized over periods that approximate the related lease terms. The above-market and below-market tenant and below-market ground leases are included in Prepaid expenses and other assets and accounts payable and accrued expenses as detailed in Notes 8 and 9, respectively. Above and below-market lease values are amortized to revenue over the remaining non-cancelable terms of the respective leases (averaging approximately five years for tenant leases and approximately 35 years for ground leases).
Amortization/accretion of these intangible assets and liabilities decreased our income by $60.6 million for the year ended December 31, 2011, $8.9 million for the period from November 10, 2010 through December 31, 2010, $1.7 million for the period from January 1, 2010 through November 9, 2010 and $2.0 million for the year ended December 31, 2009.
Future amortization is estimated to decrease income by $42.0 million in 2012, $30.9 million in 2013, $22.3 million in 2014, $16.2 million in 2015 and $12.1 million in 2016.
F-20
RPI BUSINESSES
NOTES TO COMBINED FINANCIAL STATEMENTS (Continued)
NOTE 4 MORTGAGES, NOTES AND LOANS PAYABLE
Mortgages, notes and loans payable are summarized as follows:
| |
December 31, 2011 |
December 31, 2010 |
|||||
|---|---|---|---|---|---|---|---|
| |
(In thousands) |
||||||
Fixed-rate debt: |
|||||||
Collateralized mortgages, notes and loans payable |
$ | 731,235 | $ | 880,673 | |||
Variable-rate debt: |
|||||||
Collateralized mortgages, notes and loans payable |
328,449 | 336,147 | |||||
Total Mortgages, notes and loans payable |
$ | 1,059,684 | $ | 1,216,820 | |||
The weighted-average interest rate on our collateralized mortgages, notes and loans payable was approximately 4.9% at December 31, 2011 and 2010. With respect to those loans and debtors that were in bankruptcy in 2010 and 2009, RPI Businesses recognized interest expense on its loans based on contract rates in effect prior to bankruptcy as the Bankruptcy Court had ruled that interest payments based on such contract rates constituted adequate protection to the secured lenders.
Collateralized Mortgages, Notes and Loans Payable
As of December 31, 2011, $1.23 billion of land, buildings and equipment (before accumulated depreciation) have been pledged as collateral for our mortgages, notes and loans payable. Although a majority of the $1.06 billion of fixed and variable rate collateralized mortgages, notes and loans payable are non-recourse, $350.1 million of such mortgages, notes and loans payable are recourse due to guaranties or other security provisions for the benefit of the note holder. Certain mortgage notes payable may be prepaid but are generally subject to a prepayment penalty equal to a yield-maintenance premium, defeasance or a percentage of the loan balance.
NOTE 5 INCOME TAXES
RPI Businesses have historically operated under GGP's REIT structure. Subsequent to the spin-off of RPI Businesses to Rouse, we plan to elect to be taxed as a REIT in connection with the filing of our tax return for the 2011 fiscal year, subject to our ability to meet the requirements of a REIT at the time of election, and intend to maintain this status in future periods. To qualify as a REIT, we must meet a number of organizational and operational requirements, including requirements to distribute at least 90% of our ordinary taxable income and to either distribute capital gains to stockholders, or pay corporate income tax on the undistributed capital gains. In addition, the Company is required to meet certain asset and income tests.
As a REIT, we will generally not be subject to corporate level federal income tax on taxable income we distribute currently to our stockholders. If we fail to qualify as a REIT in any taxable year, we will be subject to federal income taxes at regular corporate rates (including any applicable alternative minimum tax) and may not be able to qualify as a REIT for four subsequent taxable years. Even if we qualify for taxation as a REIT, we may be subject to certain state and local taxes on our income or property, and to federal income and excise taxes on our undistributed taxable income.
We may have subsidiaries which we elect to treat as taxable REIT subsidiaries and which are therefore subject to federal and state income taxes.
F-21
RPI BUSINESSES
NOTES TO COMBINED FINANCIAL STATEMENTS (Continued)
NOTE 6 RENTALS UNDER OPERATING LEASES
We receive rental income from the leasing of retail space under operating leases. The minimum future rentals based on operating leases of our combined properties held as of December 31, 2011 are as follows:
Year
|
Amount | |||
|---|---|---|---|---|
| |
(In thousands) |
|||
2012 |
$ | 126,317 | ||
2013 |
111,530 | |||
2014 |
94,362 | |||
2015 |
76,073 | |||
2016 |
60,199 | |||
Subsequent |
194,803 | |||
|
$ | 663,284 | ||
Minimum future rentals exclude amounts which are payable by certain tenants based upon a percentage of their gross sales or as reimbursement of operating expenses and amortization of above and below-market tenant leases. Such operating leases are with a variety of tenants, the majority of which are national and regional retail chains and local retailers, and consequently, our credit risk is concentrated in the retail industry.
NOTE 7 TRANSACTIONS WITH GGP AND OTHER GGP SUBSIDIARIES
Intercompany Transactions
As described in Note 1 to the combined financial statements, the accompanying combined financial statements present the operations of RPI Businesses as carved-out from the financial statements of GGP. Transactions between RPI Businesses have been eliminated in the combined presentation. Also as described in Note 1, an allocation of certain centralized GGP costs incurred for activities such as employee benefit programs (including incentive stock plans and stock based compensation expense), property management and asset management functions, centralized treasury, payroll and administrative functions have been made to the property operating costs of RPI Businesses. Costs that have been paid by GGP specifically attributable to Rouse in conjunction with the spin-off and the rights offering are recorded in the financial statements. These costs were subsequently reimbursed by Rouse on the date of the spin-off. Approximately $9.3 million of these costs are capitalized as deferred expenses, net and approximately $1.7 million are capitalized as prepaid expenses and other assets on the combined balance sheets as of December 31, 2011 and $1.4 million are expensed as other in the combined statements of operations for the year ended December 31, 2011. Transactions between the RPI Businesses and GGP or other GGP subsidiaries have not been eliminated except that end-of-period intercompany balances between GGP and RPI Businesses have been considered elements of RPI Businesses equity.
Transition Services Agreement
We have entered into a transition services agreement with GGP whereby GGP or its subsidiaries will provide to us, on a transitional basis, certain specified services for various terms not exceeding 18 months following the spin-off. The services that GGP provides to us include, among others, payroll,
F-22
RPI BUSINESSES
NOTES TO COMBINED FINANCIAL STATEMENTS (Continued)
NOTE 7 TRANSACTIONS WITH GGP AND OTHER GGP SUBSIDIARIES (Continued)
human resources and employee benefits, financial systems management, treasury and cash management, accounts payable services, telecommunications services, information technology services, asset management services, legal and accounting services and various other corporate services. The charges for the transition services generally are intended to allow GGP to fully recover the costs directly associated with providing the services, plus a level of profit consistent with an arm's length transaction together with all out-of-pocket costs and expenses. The charges of each of the transition services are generally based on an hourly fee arrangement and pass-through out-of-pocket costs. We may terminate certain specified services by giving prior written notice to GGP of any such termination.
NOTE 8 OTHER ASSETS
The following table summarizes the significant components of prepaid expenses and other assets.
| |
December 31, 2011 |
December 31, 2010 |
|||||
|---|---|---|---|---|---|---|---|
| |
(In thousands) |
||||||
Above-market tenant leases, net (Note 3) |
$ | 116,675 | $ | 157,269 | |||
Security and escrow deposits |
14,225 | 25,168 | |||||
Below-market ground leases, net (Note 3) |
2,031 | 2,155 | |||||
Prepaid expenses |
4,349 | 3,304 | |||||
Other |
3,068 | 1,132 | |||||
Total prepaid expenses and other assets |
$ | 140,348 | $ | 189,028 | |||
NOTE 9 OTHER LIABILITIES
The following table summarizes the significant components of accounts payable and accrued expenses.
| |
December 31, 2011 |
December 31, 2010 |
|||||
|---|---|---|---|---|---|---|---|
| |
(In thousands) |
||||||
Below-market tenant leases, net (Note 3) |
$ | 40,120 | $ | 55,205 | |||
Accounts payable and accrued expenses |
28,454 | 9,637 | |||||
Accrued interest |
4,065 | 4,674 | |||||
Accrued real estate taxes |
6,553 | 8,441 | |||||
Deferred income |
1,211 | 2,453 | |||||
Accrued payroll and other employee liabilities |
76 | 112 | |||||
Construction payable |
6,719 | 6,582 | |||||
Tenant and other deposits |
1,424 | 1,421 | |||||
Conditional asset retirement obligation liability |
4,252 | 4,141 | |||||
Other |
4,638 | 4,916 | |||||
Total accounts payable and accrued expenses |
$ | 97,512 | $ | 97,582 | |||
F-23
RPI BUSINESSES
NOTES TO COMBINED FINANCIAL STATEMENTS (Continued)
NOTE 10 COMMITMENTS AND CONTINGENCIES
In the normal course of business, from time to time, we are involved in legal proceedings relating to the ownership and operations of our properties. In management's opinion, the liabilities, if any, that may ultimately result from such legal actions are not expected to have a material effect on our combined financial position, results of operations or liquidity.
The following table summarizes the contractual maturities of our long-term commitments as of December 31, 2011. Long-term debt includes the related acquisition accounting fair value adjustments:
| |
2012 | 2013 | 2014 | 2015 | 2016 | Subsequent / Other |
Total | |||||||||||||||
|---|---|---|---|---|---|---|---|---|---|---|---|---|---|---|---|---|---|---|---|---|---|---|
| |
(In thousands) |
|||||||||||||||||||||
Contractual debt—principal |
$ | 28,410 | $ | 83,963 | $ | 289,195 | $ | 24,735 | $ | 528,409 | $ | 162,955 | $ | 1,117,667 | ||||||||
Market rate adjustments(1) |
(11,841 | ) | (12,768 | ) | (10,175 | ) | (7,489 | ) | (8,428 | ) | (7,282 | ) | (57,983 | ) | ||||||||
Long term debt |
$ | 16,569 | $ | 71,195 | $ | 279,020 | $ | 17,246 | $ | 519,981 | $ | 155,673 | $ | 1,059,684 | ||||||||
- (1)
- Amortization related to the fair value adjustment as a result of acquisition accounting
The following table summarizes the contractual maturities of our long-term commitments as of January 12, 2012 to give effect to the new senior secured credit facility discussed in Note 13 to the combined financial statements.
| |
2012 | 2013 | 2014 | 2015 | 2016 | Subsequent / Other |
Total | |||||||||||||||
|---|---|---|---|---|---|---|---|---|---|---|---|---|---|---|---|---|---|---|---|---|---|---|
| |
(In thousands) |
|||||||||||||||||||||
Contractual debt—principal |
$ | 27,892 | $ | 85,463 | $ | 251,993 | $ | 417,275 | $ | 213,447 | $ | 162,959 | $ | 1,159,029 | ||||||||
Market rate adjustments(1) |
(9,978 | ) | (10,728 | ) | (7,886 | ) | (6,171 | ) | (7,015 | ) | (7,287 | ) | (49,065 | ) | ||||||||
Long term debt |
$ | 17,914 | $ | 74,735 | $ | 244,107 | $ | 411,104 | $ | 206,432 | $ | 155,672 | $ | 1,109,964 | ||||||||
- (1)
- Amortization related to the fair value adjustment as a result of acquisition accounting
NOTE 11 QUARTERLY FINANCIAL INFORMATION (UNAUDITED)
| |
2011 | ||||||||||||
|---|---|---|---|---|---|---|---|---|---|---|---|---|---|
| |
Successor | ||||||||||||
| |
First Quarter |
Second Quarter |
Third Quarter |
Fourth Quarter |
|||||||||
| |
(In thousands) |
||||||||||||
Total revenues |
$ | 59,100 | $ | 56,255 | $ | 58,554 | $ | 60,907 | |||||
Operating income |
12,153 | 10,343 | 10,055 | 11,954 | |||||||||
Net loss |
(6,534 | ) | (6,572 | ) | (8,999 | ) | (4,871 | ) | |||||
| |
2010 | |||||||||||||||
|---|---|---|---|---|---|---|---|---|---|---|---|---|---|---|---|---|
| |
Predecessor | Successor | ||||||||||||||
| |
First Quarter |
Second Quarter |
Third Quarter |
Period from October 1 through November 9 |
Period from November 10 through December 31 |
|||||||||||
| |
(In thousands) |
|||||||||||||||
Total revenues |
$ | 65,268 | $ | 63,739 | $ | 63,024 | $ | 27,710 | $ | 35,540 | ||||||
Operating income |
23,938 | 23,046 | 22,092 | 8,513 | 7,609 | |||||||||||
Net income (loss) |
20,286 | (8,099 | ) | (6,139 | ) | (27,078 | ) | (2,866 | ) | |||||||
F-24
RPI BUSINESSES
NOTES TO COMBINED FINANCIAL STATEMENTS (Continued)
NOTE 12 PRO FORMA FINANCIAL INFORMATION (UNAUDITED)
The following pro forma financial information has been presented as a result of the acquisition of the Predecessor pursuant to the Plan during 2010. The pro forma financial information is based upon the historical financial information of the Predecessor and the Successor as if the transaction had been consummated on the first day of the earliest period presented.
The following pro forma financial information may not necessarily be indicative of what our actual results would have been if the Plan of Reorganization had been consummated as of the date assumed, nor does it purport to represent our results of operations for future periods.
| |
Successor Historical |
Predecessor Historical |
|
|||||||
|---|---|---|---|---|---|---|---|---|---|---|
| |
For the Period from November 10, 2010 through December 31, 2010 |
For the Period from January 1, 2010 through November 9, 2010 |
Pro Forma Year Ended December 31, 2010 |
|||||||
| |
(In thousands) |
|||||||||
Total revenues |
$ | 35,540 | $ | 219,741 | $ | 237,858 | ||||
Net loss |
(2,866 | ) | (21,030 | ) | (21,152 | ) | ||||
| |
Year Ended December 31, 2009 |
Pro Forma Year Ended December 31, 2009 |
|||||
|---|---|---|---|---|---|---|---|
| |
(In thousands) |
||||||
Total revenues |
$ | 276,232 | $ | 256,133 | |||
Net loss |
(30,152 | ) | (95,114 | ) | |||
Included in the above pro forma financial information for the years ended December 31, 2010 and 2009 are the following adjustments:
Minimum rents are recognized on a straight-line basis over periods that reflect the related lease terms, and include accretion and amortization related to above and below market portions of tenant leases. Acquisition accounting pro forma adjustments reflect a change in the periods over which such items are recognized. The adjustment related to straight line rent and accretion and amortization related to above and below market portions of tenant leases was a decrease in revenues of $17.4 million for the year ended December 31, 2010 and $20.1 million for the year ended December 31, 2009.
Depreciation and amortization have been adjusted to reflect adjustments of estimated useful lives and contractual terms as well as the fair valuation of the underlying assets and liabilities, resulting in changes to the rate and amount of depreciation and amortization. The adjustment related to depreciation and amortization was an increase of $12.5 million for the year ended December 31, 2010 and $2.8 million for the year ended December 31, 2009.
The pro forma information reflects non-cash adjustments to interest expense to reflect the fair value of debt and deferred expenses and other amounts in historical interest expense as a result of the acquisition method of accounting. The adjustment related to interest expense was a decrease of $23.2 million for the year ended December 31, 2010 and an increase of $9.2 million for the year ended December 31, 2009.
F-25
RPI BUSINESSES
NOTES TO COMBINED FINANCIAL STATEMENTS (Continued)
NOTE 12 PRO FORMA FINANCIAL INFORMATION (UNAUDITED) (Continued)
Reorganization items have been reversed as the Plan is assumed to be effective and all the RPI Businesses are deemed to have emerged from bankruptcy as of the first day of the periods presented and, accordingly, such expenses or items would not be incurred. The adjustment related to the reversal of reorganization items resulted in a decrease in pro forma net loss of $9.5 million for the year ended December 31, 2010 and resulted in an increase in pro forma net loss of $32.7 million for the year ended December 31, 2009.
NOTE 13 SUBSEQUENT EVENTS
On January 2, 2012 Andrew Silberfein joined the Company as our President and Chief Executive Officer. Pursuant to Mr. Silberfein's employment agreement he will receive an annual salary of $0.8 million, and a signing bonus of $1.2 million that was paid in cash. In addition, Mr. Silberfein will have a target annual cash bonus equal to 100% of his base salary with a guaranteed bonus of $0.8 million for 2012. Mr. Silberfein received a one-time initial award of $1.9 million payable in restricted shares of our common stock. Finally, Mr. Silberfein also received a one-time award of options to acquire 679,400 shares of our common stock (which was equal to the number obtained by dividing $10 million by the closing price per share of our common stock on the date before the date of grant).
On January 12, 2012, GGP distributed the assets and liabilities of RPI Businesses to us. Pursuant to the spin-off, we received certain of the assets and liabilities of GGP. Upon this spin-off we issued approximately 35.5 million shares of our common stock to the existing GGP shareholders. The GGP shareholders received approximately 0.0375 shares of Rouse common stock for every share of GGP common stock owned as of the record date of December 30, 2011. We also issued 359,056 shares of our Class B common stock, par value $0.01 per share to GGP LP.
On January 12, 2012, we entered into a senior secured credit facility ("Senior Facility") with a syndicate of banks, as lenders, and Wells Fargo Bank, National Association, as administrative agent, and Wells Fargo Securities, LLC, RBC Capital Markets, LLC, and U.S. Bank National Association, as joint lead arrangers that provides borrowings on a revolving basis of up to $50.0 million (the "Revolver") and a senior secured term loan (the "Term Loan" and together with the Revolver, the "Facilities") which provided an advance of approximately $433.5 million. The Facilities closed concurrently with the consummations of the spin-off and have a term of three years. The Facilities bear interest at a base rate (daily LIBOR based on one month LIBOR, with a LIBOR floor of 1%) plus 5.00%. The proceeds from the Term Loan were used to paydown existing debt of the portfolio and costs associated to the spin-off and the Facilities.
The Senior Facility has affirmative and negative covenants that are customary for a real estate loan, including, without limitation, restrictions on incurrence of indebtedness and liens on the mortgage collateral; restrictions on pledges; restrictions on subsidiary distributions; with respect to the mortgage collateral, limitations on our ability to enter into transactions including mergers, consolidations, sales of assets for less than fair market value and similar transactions; conduct of business; restricted distributions; transactions with affiliates; and limitation on speculative hedge agreements. In addition, we are required to comply with the following financial maintenance covenants: (1) net indebtedness to value ratio, (2) liquidity, (3) minimum fixed charge coverage ratio, (4) minimum tangible net worth, and (5) minimum portfolio debt yield. Failure to comply with the covenants in the senior secured credit facilities would result in a default under the credit agreement governing these facilities and, absent a
F-26
RPI BUSINESSES
NOTES TO COMBINED FINANCIAL STATEMENTS (Continued)
NOTE 13 SUBSEQUENT EVENTS (Continued)
waiver or an amendment from our lenders, permit the acceleration of all outstanding borrowings under the senior secured credit facilities, which would also result in a cross-default our subordinated revolving credit facility.
On January 12, 2012, we also entered into a subordinated unsecured revolving credit facility with a wholly owned subsidiary of Brookfield that provides borrowings on a revolving basis of up to $100.0 million (the "Subordinated Facility"). The Subordinated Facility has a term of three years and six months and will bear interest at LIBOR (with a LIBOR floor of 1%) plus 850 basis points. The default interest rate following a payment event of default under the Subordinated Facility will be 2.00% more than the then applicable interest rate. Interest will be payable monthly.
On February 15, 2012, we borrowed $10.0 million on our Revolver.
On February 21, 2012, we acquired Grand Traverse Mall, which had previously been owned by GGP, for a total amount of approximately $66.0 million, consisting of cash payments for closing costs and required escrow reserves and the assumption of a $62.0 million loan. Grand Traverse Mall is a 589,000 square foot retail mall located in Traverse City, Michigan.
On March 8, 2012, Benjamin Schall joined the Company as our Chief Operating Officer. Pursuant to Mr. Schall's employment agreement he will receive an annual salary of $0.5 million. In addition, Mr. Schall will have a target bonus of 75% of his base salary with a guaranteed bonus of $0.4 million for 2012. Mr. Schall received a one-time initial award of $2.2 million payable in restricted shares of our common stock. Finally, Mr. Schall also received a one-time award of options to acquire 322,700 shares of our common stock (which was equal to the number obtained by dividing $4.8 million by the closing price per share of our common stock on the date before the date of grant).
On March 12, 2012, we filed our 2012 Equity Incentive Plan. Under our Equity Incentive Plan we have registered 4,887,997 shares of common stock.
On March 12, 2012 we issued 1,615,986 options to employees of our Company.
On March 12, 2012 we issued 334,541 restricted shares to employees of our Company and members of our Board of Directors.
On March 26, 2012, we completed a rights offering and backstop purchase. Under the terms of the rights offering and backstop purchase, we issued 13,333,333 shares of our common stock at a subscription price of $15.00 per share. Net proceeds of the rights offering and backstop purchase approximated $192.0 million. In connection with the rights offering and backstop purchase Brookfield owns approximately 54.38% of the Company.
F-27
REPORT OF INDEPENDENT REGISTERED PUBLIC ACCOUNTING FIRM
To
the Board of Directors and Stockholders of
Rouse Properties, Inc.
New York, New York
We have audited the combined balance sheets of certain entities as described in Note 1 to the combined financial statements (the "RPI Businesses") as of December 31, 2011 and 2010 and the related combined statements of operations, equity, and cash flows for the year ended December 31, 2011, the period from November 10, 2010 through December 31, 2010 (Successor RPI Businesses' operations), the period from January 1, 2010 through November 9, 2010,and for the year ended December 31, 2009 (Predecessor RPI Businesses' operations), and have issued our report thereon dated March 29, 2012 (which report expresses an unqualified opinion and includes explanatory paragraphs regarding the RPI Businesses' combined financial statements with assets, liabilities, and a capital structure having carrying values not comparable with prior periods and the RPI Businesses inclusion of allocations of certain operating expenses from General Growth Properties, Inc.); such combined financial statements and report are included elsewhere in this Form 10-K. Our audits also included the combined financial statement schedule of the RPI Businesses listed in the Index to Combined Financial Statements on page F-1 of this Form 10-K. This combined financial statement schedule is the responsibility of the RPI Businesses' management. Our responsibility is to express an opinion based on our audits. In our opinion, such combined financial statement schedule, when considered in relation to the basic combined financial statements taken as a whole, presents fairly, in all material respects, the information set forth therein.
/s/ Deloitte & Touche LLP
Chicago,
Illinois
March 29, 2012
F-28
SCHEDULE III—REAL ESTATE AND ACCUMULATED DEPRECIATION
DECEMBER 31, 2011
| |
|
|
|
|
Costs Capitalized Subsequent to Acquisition |
Gross Amounts at Which Carried at Close of Period(d) |
|
|
|
|||||||||||||||||||||||||||
|---|---|---|---|---|---|---|---|---|---|---|---|---|---|---|---|---|---|---|---|---|---|---|---|---|---|---|---|---|---|---|---|---|---|---|---|---|
| |
|
|
Initial Cost | |
|
Life Upon Which Latest Income Statement is Computed |
||||||||||||||||||||||||||||||
Name of Center
|
Location | Encumbrances(a) | Land(b) | Buildings and Improvements(b) |
Land | Buildings and Improvements |
Land | Buildings and Improvements |
Total | Accumulated Depreciation(e) |
Date Acquired(c) |
|||||||||||||||||||||||||
| (In thousands) |
||||||||||||||||||||||||||||||||||||
Retail and Other: |
||||||||||||||||||||||||||||||||||||
Animas Valley Mall |
Farmington, NM |
43,451 |
6,509 |
32,270 |
— |
979 |
6,509 |
33,249 |
39,758 |
2,745 |
2010 |
(e) |
||||||||||||||||||||||||
Bayshore Mall |
Eureka, CA | 30,436 | 4,770 | 33,305 | — | 148 | 4,770 | 33,453 | 38,223 | 2,005 | 2010 | (e) | ||||||||||||||||||||||||
Birchwood Mall |
Port Huron, MI | 46,924 | 8,316 | 44,884 | — | 69 | 8,316 | 44,953 | 53,269 | 2,578 | 2010 | (e) | ||||||||||||||||||||||||
Cache Valley Mall |
Logan, UT | 28,623 | 2,890 | 19,402 | — | 54 | 2,890 | 19,456 | 22,346 | 1,115 | 2010 | (e) | ||||||||||||||||||||||||
Cache Valley Marktplace |
Logan, UT | — | 1,072 | 7,440 | — | 13 | 1,072 | 7,453 | 8,525 | 503 | 2010 | (e) | ||||||||||||||||||||||||
Chula Vista Center |
Chula Vista, CA | — | 13,214 | 71,598 | 1,150 | 7,382 | 14,364 | 78,980 | 93,344 | 4,052 | 2010 | (e) | ||||||||||||||||||||||||
Collin Creek Mall |
Plano, TX | 63,659 | 14,746 | 48,103 | — | 665 | 14,746 | 48,768 | 63,514 | 2,997 | 2010 | (e) | ||||||||||||||||||||||||
Colony Square Mall |
Zanesville, OH | 28,212 | 4,253 | 29,578 | — | 556 | 4,253 | 30,134 | 34,387 | 2,150 | 2010 | (e) | ||||||||||||||||||||||||
Gateway Mall |
Springfield, OR | — | 7,097 | 36,573 | — | 2,687 | 7,097 | 39,260 | 46,357 | 2,457 | 2010 | (e) | ||||||||||||||||||||||||
Knollwood Mall |
St. Louis Park, MN | 34,872 | 6,127 | 32,905 | — | 222 | 6,127 | 33,127 | 39,254 | 1,987 | 2010 | (e) | ||||||||||||||||||||||||
Lakeland Square Mall |
Lakeland, FL | 51,357 | 10,938 | 56,867 | — | 620 | 10,938 | 57,487 | 68,425 | 3,226 | 2010 | (e) | ||||||||||||||||||||||||
Lansing Mall |
Lansing, MI | 22,129 | 9,615 | 49,220 | — | 371 | 9,615 | 49,591 | 59,206 | 2,980 | 2010 | (e) | ||||||||||||||||||||||||
Mall at Sierra Vista |
Sierra Vista, AZ | 23,335 | 7,078 | 36,441 | — | 16 | 7,078 | 36,457 | 43,535 | 1,764 | 2010 | (e) | ||||||||||||||||||||||||
Mall St Vincent |
Shreveport, LA | — | 4,604 | 21,927 | — | (308 | ) | 4,604 | 21,619 | 26,223 | 1,396 | 2010 | (e) | |||||||||||||||||||||||
Newpark Mall |
Newark, CA | 67,056 | 17,848 | 58,384 | — | 599 | 17,848 | 58,983 | 76,831 | 3,797 | 2010 | (e) | ||||||||||||||||||||||||
North Plains Mall |
Clovis, NM | 13,160 | 2,218 | 11,768 | — | 830 | 2,218 | 12,598 | 14,816 | 958 | 2010 | (e) | ||||||||||||||||||||||||
Pierre Bossier Mall |
Bossier City, LA | 41,440 | 7,522 | 38,247 | — | (16 | ) | 7,522 | 38,231 | 45,753 | 1,828 | 2010 | (e) | |||||||||||||||||||||||
Sikes Senter |
Wichita Falls, TX | 47,426 | 5,915 | 34,075 | — | 1,603 | 5,915 | 35,678 | 41,593 | 3,097 | 2010 | (e) | ||||||||||||||||||||||||
Silver Lake Mall |
Coeur d'Alene, ID | 13,078 | 3,237 | 12,914 | — | 119 | 3,237 | 13,033 | 16,270 | 730 | 2010 | (e) | ||||||||||||||||||||||||
Southland Mall |
Hayward, CA | 72,935 | 23,407 | 81,474 | — | 6,709 | 23,407 | 88,183 | 111,590 | 4,890 | 2010 | (e) | ||||||||||||||||||||||||
Southland Center |
Taylor, MI | — | 13,697 | 51,860 | — | (495 | ) | 13,697 | 51,365 | 65,062 | 2,234 | 2010 | (e) | |||||||||||||||||||||||
Spring Hill Mall |
West Dundee, IL | 52,611 | 8,219 | 23,679 | — | 196 | 8,219 | 23,875 | 32,094 | 1,803 | 2010 | (e) | ||||||||||||||||||||||||
Steeplegate Mall |
Concord, NH | 60,319 | 11,438 | 42,032 | — | 299 | 11,438 | 42,331 | 53,769 | 2,481 | 2010 | (e) | ||||||||||||||||||||||||
The Boulevard Mall |
Las Vegas, NV | 81,895 | 34,523 | 46,428 | — | 6,193 | 34,523 | 52,621 | 87,144 | 4,340 | 2010 | (e) | ||||||||||||||||||||||||
Three Rivers Mall |
Kelso, WA | 14,227 | 2,080 | 11,142 | — | 739 | 2,080 | 11,881 | 13,961 | 1,057 | 2010 | (e) | ||||||||||||||||||||||||
Valley Hills Mall |
Hickory, NC | 52,110 | 10,047 | 61,817 | — | 686 | 10,047 | 62,503 | 72,550 | 3,438 | 2010 | (e) | ||||||||||||||||||||||||
Vista Ridge Mall |
Lewisville, TX | 73,926 | 15,965 | 46,560 | — | 96 | 15,965 | 46,656 | 62,621 | 3,253 | 2010 | (e) | ||||||||||||||||||||||||
Washington Park Mall |
Bartlesville, OK | 10,451 | 1,388 | 8,213 | — | 297 | 1,388 | 8,510 | 9,898 | 730 | 2010 | (e) | ||||||||||||||||||||||||
West Valley Mall |
Tracy, CA | 48,437 | 31,340 | 38,316 | — | 3,612 | 31,340 | 41,928 | 73,268 | 3,080 | 2010 | (e) | ||||||||||||||||||||||||
Westwood Mall |
Jackson, MI | 27,019 | 5,708 | 28,006 | — | 171 | 5,708 | 28,177 | 33,885 | 1,675 | 2010 | (e) | ||||||||||||||||||||||||
White Mountain Mall |
Rock Springs, WY | 10,596 | 3,010 | 11,418 | — | 583 | 3,010 | 12,001 | 15,011 | 1,274 | 2010 | (e) | ||||||||||||||||||||||||
|
$ | 1,059,684 | $ | 298,791 | $ | 1,126,846 | $ | 1,150 | $ | 35,695 | $ | 299,941 | $ | 1,162,541 | $ | 1,462,482 | $ | 72,620 | ||||||||||||||||||
- (a)
- See
description of mortgages, notes and loans payable in Note 4 of Notes to Combined Financial Statements.
- (b)
- Initial cost is the carrying value at the Effective Date due to the application of the acquisition method of accounting (Note 3).
F-29
RPI BUSINESSES
NOTES TO SCHEDULE III
- (c)
- Due to the application of the acquisition method of accounting, all dates are November 9, 2010, the Effective
Date.
- (d)
- The
aggregate cost of land, buildings and improvements for federal income tax purposes is approximately $1.47 billion.
- (e)
- Depreciation is computed based upon the following estimated lives:
| |
Years | |
|---|---|---|
Buildings, improvements and carrying costs |
45 | |
Equipment and fixtures |
5 - 10 | |
Tenant improvements |
Shorter of the useful life or applicable lease term |
| |
Successor | Successor | Predecessor | |||||||
|---|---|---|---|---|---|---|---|---|---|---|
| |
2011 | 2010 | 2009 | |||||||
| |
|
(In thousands) |
||||||||
Balance at beginning of period |
$ | 1,434,197 | $ | 2,181,029 | $ | 2,315,688 | ||||
Additions |
37,165 | 23,152 | 8,307 | |||||||
Acquisitions |
— | — | — | |||||||
Impairments |
— | — | (77,108 | ) | ||||||
Acquisition accounting adjustments at emergence |
— | (768,074 | ) | — | ||||||
Dispositions and write-offs |
(8,880 | ) | (1,910 | ) | (65,858 | ) | ||||
Balance at end of period |
$ | 1,462,482 | $ | 1,434,197 | $ | 2,181,029 | ||||
Reconciliation of Accumulated Depreciation
| |
Successor | Successor | Predecessor | |||||||
|---|---|---|---|---|---|---|---|---|---|---|
| |
2011 | 2010 | 2009 | |||||||
| |
|
(In thousands) |
||||||||
Balance at beginning of period |
$ | 9,908 | $ | 536,216 | $ | 535,184 | ||||
Depreciation expense |
71,592 | 57,306 | 65,394 | |||||||
Acquisition accounting adjustments at emergence |
— | (580,290 | ) | — | ||||||
Dispositions and write-offs |
(8,880 | ) | (3,324 | ) | (64,362 | ) | ||||
Balance at end of period |
$ | 72,620 | $ | 9,908 | $ | 536,216 | ||||
F-30
| Exhibit Number |
Exhibit Description | ||
|---|---|---|---|
| 2.1 | Separation Agreement, dated January 12, 2012, between Rouse Properties, Inc. and General Growth Properties, Inc. (incorporated by reference to Exhibit 2.1 to the Company's Current Report on Form 8-K, filed January 19, 2012). | ||
3.1 |
Amended and Restated Certificate of Incorporation of Rouse Properties, Inc. (incorporated by reference to Exhibit 3.1 to the Company's Current Report on Form 8-K, filed January 19, 2012). |
||
3.2 |
Amended and Restated Bylaws of Rouse Properties, Inc. (incorporated by reference to Exhibit 3.2 to the Company's Current Report on Form 8-K, filed January 19, 2012). |
||
3.3 |
Exchange Agreement, dated January 12, 2012 between Rouse Properties, Inc. and GGP Limited Partnership. (incorporated by reference to Exhibit 3.2 to the Company's Current Report on Form 8-K, filed January 19, 2012). |
||
4.1 |
Registration Rights Agreement dated March 26, 2012, between Rouse Properties, Inc. and affiliates of Brookfield Asset Management. |
||
10.1 |
Transition Services Agreement among GGP Limited Partnership, General Growth Management, Inc. and Rouse Properties, Inc. (incorporated by reference to Exhibit 10.1 to the Company's Current Report on Form 8-K, filed January 19, 2012). |
||
10.2 |
Tax Matters Agreement, dated January 12, 2012, between Rouse Properties, Inc. and General Growth Properties, Inc. (incorporated by reference to Exhibit 10.2 to the Company's Current Report on Form 8-K, filed January 19, 2012). |
||
10.3 |
Employee Matters Agreement, dated January 12, 2012, among General Growth Management, Inc., GGP Limited Partnership and Rouse Properties, Inc. (incorporated by reference to Exhibit 10.3 to the Company's Current Report on Form 8-K, filed January 19, 2012). |
||
10.4 |
Services Agreement, dated January 12, 2012, between affiliates of Brookfield Asset Management, GGP Limited Partnership and Rouse Properties, Inc. (incorporated by reference to Exhibit 10.4 to the Company's Current Report on Form 8-K, filed January 19, 2012). |
||
10.5 |
Form of Indemnification Agreement between Rouse Properties, Inc. and individual directors and officers (incorporated by reference to Exhibit 10.5 to the Company's Current Report on Form 8-K, filed January 19, 2012). |
||
10.6 |
Senior Secured Credit Facility Agreement dated January 12, 2012 with Wells Fargo Bank, N.A., as administrative agent, and the lenders party thereto (incorporated by reference to Exhibit 10.6 to the Company's Current Report on Form 8-K, filed January 19, 2012). |
||
10.7 |
Subordinated Revolving Facility Agreement dated January 12, 2012 with Trilon (Luxembourg) S.a.r.l., a wholly-owned subsidiary of Brookfield Asset Management Inc. (incorporated by reference to Exhibit 10.7 to the Company's Current Report on Form 8-K, filed January 19, 2012). |
||
10.8 |
2012 Equity Incentive Plan for directors, employees and consultants. |
||
10.9 |
Form of Non-Qualified Stock Option Agreement. |
||
10.10 |
Form of Restricted Stock Award Agreement for employees. |
||
10.11 |
Form of Restricted Stock Award Agreement for directors. |
||
S-1
| Exhibit Number |
Exhibit Description | ||
|---|---|---|---|
| 10.12 | Non-Qualified Stock Option Agreement between Rouse Properties, Inc and Andrew Silberfein dated March 12, 2012. | ||
10.13 |
Restricted Stock Award Agreement between Rouse Properties, Inc. and Andrew Silberfein dated March 12, 2012. |
||
10.14 |
Restricted Stock Award Agreement between Rouse Properties, Inc and Benjamin Schall dated March 12, 2012. |
||
10.15 |
Employment Agreement between Andrew Silberfein and Rouse Properties, Inc. dated November 14, 2011 (incorporated by reference to Exhibit 10.12 to the Company's Registration Statement on Form 10, filed December 14, 2011). |
||
10.16 |
Letter Agreement between Andrew Silberfein and Rouse Properties, Inc. dated November 14, 2011 (incorporated by reference to Exhibit 10.13 to the Company's Registration Statement on Form 10, filed December 14, 2011). |
||
10.17 |
Standby Purchase Agreement dated as of December 16, 2011 by and among Rouse Properties, Inc., General Growth Properties, Inc., Brookfield US Corporation and Brookfield Asset Management Inc. (incorporated by reference to Exhibit 10.6 to the Company's Registration Statement on Form 10, filed December 20, 2011). |
||
21.1 |
List of Subsidiaries of Rouse Properties, Inc. |
||
23.1 |
Consent of Deloitte & Touche LLP, Independent Registered Public Accounting Firm, relating to RPI Businesses. |
||
31.1 |
Certification of Chief Executive Officer Pursuant to Section 302 of the Sarbanes-Oxley Act of 2002. |
||
31.2 |
Certification of Chief Financial Officer Pursuant to Section 302 of the Sarbanes-Oxley Act of 2002. |
||
32.1 |
Certification of Chief Executive Officer Pursuant to Section 906 of the Sarbanes-Oxley Act of 2002. |
||
32.2 |
Certification of Chief Financial Officer Pursuant to Section 906 of the Sarbanes-Oxley Act of 2002. |
||
S-2