Attached files
| file | filename |
|---|---|
| EX-23.1 - CONSENT OF PMB HELIN DONOVAN - ENOVA SYSTEMS INC | d320064dex231.htm |
| EX-10.23 - AGREEMENT RELATING TO THE APPOINTMENT OF A NOMINATED ADVISER AND BROKER - ENOVA SYSTEMS INC | d320064dex1023.htm |
| EXCEL - IDEA: XBRL DOCUMENT - ENOVA SYSTEMS INC | Financial_Report.xls |
| EX-32 - CERTIFICATION OF CEO AND CFO PURSUANT TO SECTION 906 - ENOVA SYSTEMS INC | d320064dex32.htm |
| EX-31.1 - CERTIFICATION OF CEO PURSUANT TO SECTION 302 - ENOVA SYSTEMS INC | d320064dex311.htm |
| EX-31.2 - CERTIFICATION OF CFO PURSUANT TO SECTION 302 - ENOVA SYSTEMS INC | d320064dex312.htm |
Table of Contents
UNITED STATES SECURITIES AND EXCHANGE COMMISSION
Washington, D.C. 20549
Form 10-K
| þ | ANNUAL REPORT PURSUANT TO SECTION 13 OR 15(d) OF THE SECURITIES EXCHANGE ACT OF 1934 |
For the fiscal year ended December 31, 2011
Or
| ¨ | TRANSITION REPORT PURSUANT TO SECTION 13 OR 15(d) OF THE SECURITIES EXCHANGE ACT OF 1934 |
For the transition period from to
Commission file no. 1-33001
ENOVA SYSTEMS, INC.
(Exact name of registrant as specified in its charter)
| California | 95-3056150 | |
| (State or Other Jurisdiction of | (I.R.S. Employer | |
| Incorporation or Organization) | Identification Number) |
1560 West 190th Street, Torrance, California 90501
(Address of principal executive offices, including zip code)
Registrant’s telephone number, including area code:
(310) 527-2800
Securities registered pursuant to Section 12(b) of the Act:
| Title of Each Class | Name of Each Exchange on Which Registered | |
| Common Stock, no par value | The NYSE Amex |
Securities registered pursuant to Section 12(g) of the Act:
None.
Indicate by check mark if the registrant is a well-known seasoned issuer, as defined in Rule 405 of the Securities Act: Yes ¨ No þ
Indicate by check mark if the registrant is not required to file reports pursuant to Section 13 or Section 15(d) of the Act: Yes ¨ No þ
Indicate by check mark whether the registrant (1) has filed all reports required to be filed by Section 13 or 15(d) of the Securities Exchange Act of 1934 during the preceding 12 months (or for such shorter period that the registrant was required to file such reports), and (2) has been subject to such filing requirements for the past 90 days. Yes þ No ¨
Indicate by check mark whether the registrant has submitted electronically and posted on its corporate Web site, if any, every Interactive Data File required to be submitted and posted pursuant to Rule 405 of Regulation S-T during the preceding 12 months (or for such shorter period that the registrant was required to submit and post such files). Yes þ No ¨
Indicate by check mark if disclosure of delinquent filers pursuant to Item 405 of Regulation S-K is not contained herein, and will not be contained, to the best of the registrant’s knowledge, in definitive proxy or information statements incorporated by reference in Part III of this Form 10-K or any amendment to this Form 10-K. ¨
Indicate by check mark whether the registrant is a large accelerated filer, an accelerated filer, a non-accelerated filer, or a smaller reporting company. See the definitions of “large accelerated filer,” “accelerated filer” and “smaller reporting company” in Rule 12b-2 of the Exchange Act. (Check one):
| Large accelerated filer ¨ |
Accelerated filer ¨ | Non-accelerated filer ¨ | Smaller reporting company þ | |||
| (Do not check if a smaller reporting company) | ||||||
Indicate by check mark whether the registrant is a shell company (as defined in Rule 12b-2 of the Act.) Yes ¨ No þ
As of June 30, 2011, the approximate aggregate market value of common stock held by non-affiliates of the Registrant was $9,426,000 (based upon the closing price for shares of the Registrant’s common stock as reported by The NYSE Amex). As of February 29, 2012, there were 42,765,223 shares of common stock, no par value, outstanding.
DOCUMENTS INCORPORATED BY REFERENCE
None.
Table of Contents
2011 FORM 10-K ANNUAL REPORT
TABLE OF CONTENTS
| PART I | ||||||
| Item 1. |
3 | |||||
| Item 1A. |
12 | |||||
| Item 1B. |
14 | |||||
| Item 2. |
14 | |||||
| Item 3. |
14 | |||||
| Item 4. |
15 | |||||
| PART II | ||||||
| Item 5. |
15 | |||||
| Item 6. |
16 | |||||
| Item 7. |
MANAGEMENT’S DISCUSSION AND ANALYSIS OF FINANCIAL CONDITION AND RESULTS OF OPERATIONS | 16 | ||||
| Item 7A. |
QUANTITATIVE AND QUALITATIVE DISCLOSURES ABOUT MARKET RISK | 24 | ||||
| Item 8. |
FINANCIAL STATEMENTS AND SUPPLEMENTARY DATA | 25 | ||||
| Item 9. |
CHANGES IN AND DISAGREEMENTS WITH ACCOUNTANTS ON ACCOUNTING AND FINANCIAL DISCLOSURE | 44 | ||||
| Item 9A. |
CONTROLS AND PROCEDURES | 44 | ||||
| Item 9B. |
45 | |||||
| PART III | ||||||
| Item 10. |
DIRECTORS, EXECUTIVE OFFICERS AND CORPORATE GOVERNANCE | 45 | ||||
| Item 11. |
EXECUTIVE COMPENSATION | 48 | ||||
| Item 12. |
SECURITY OWNERSHIP OF CERTAIN BENEFICIAL OWNERS AND MANAGEMENT AND RELATED STOCKHOLDER MATTERS | 52 | ||||
| Item 13. |
CERTAIN RELATIONSHIPS AND RELATED TRANSACTIONS, AND DIRECTOR INDEPENDENCE | 54 | ||||
| Item 14. |
PRINCIPAL ACCOUNTANT FEES AND SERVICES | 54 | ||||
| PART IV | ||||||
| Item 15. |
EXHIBITS AND FINANCIAL STATEMENT SCHEDULES | 55 | ||||
2
Table of Contents
General
In July 2000, we changed our name to Enova Systems, Inc. (“Enova” or “the Company”). Our company, previously known as U.S. Electricar, Inc., a California corporation, was incorporated on July 30, 1976.
Enova believes it is a leader in the development, design and production of proprietary, power train systems and related components for electric and hybrid electric buses and medium and heavy duty commercial vehicles. Electric drive systems are comprised of an electric motor, electronics control unit and a gear unit which power a vehicle. Hybrid electric systems, which are similar to pure electric drive systems, contain an internal combustion engine in addition to the electric motor, and may eliminate external recharging of the battery system. A hydrogen fuel cell based system is similar to a hybrid system, except that instead of an internal combustion engine, a fuel cell is utilized as the power source. A fuel cell is a system which combines hydrogen and oxygen in a chemical process to produce electricity.
A fundamental element of Enova’s strategy is to develop and produce advanced proprietary software and hardware for applications in these alternative power markets. Our focus is powertrain systems including digital power conversion, power management and system integration, focusing chiefly on vehicle power generation.
Specifically, we develop, design and produce drive systems and related components for electric, hybrid electric and fuel cell powered vehicles in both the new and retrofit markets. We also perform internal research and development (“R&D”) and funded third party R&D to augment our product development and support our customers.
Our product development strategy is to design and introduce to market successively advanced products, each based on our core technical competencies. In each of our product/market segments, we provide products and services to leverage our core competencies in digital power management, power conversion and system integration. We believe that the underlying technical requirements shared among the market segments will allow us to more quickly transition from one emerging market to the next, with the goal of capturing early market share.
Enova’s primary market focus centers on aligning ourselves with key customers and integrating with original equipment manufacturers (“OEMs”) in our target markets. We believe that alliances will result in the latest technology being implemented and customer requirements being met, with an optimized level of additional time and expense. As we penetrate new market areas, we are continually refining both our market strategy and our product line to maintain our leading edge in power management and conversion systems for vehicle applications.
Our website, www.enovasystems.com, contains up-to-date information on our company, our products, programs and current events. Our website is a prime focal point for current and prospective customers, investors and other affiliated parties seeking additional information on our business. We have also added a supplementary section to our website via www.greenforfree.com. The Green for Free™ program allows fleet executives to purchase all-electric vehicles for the cost of a diesel-powered commercial vehicle. The savings that fleets benefit through the reduced maintenance and fuel savings of the electric vehicles (EVs) is then used over a period of time to cover the incremental expense for the technology.
We continue to develop existing relationships and enter into new development programs with both governmental and private industry with regards to both commercial and military application of our electric and hybrid electric drive systems and fuel cell power management technologies. Although we believe that current negotiations with several parties may result in development and production contracts during 2012 and beyond, there are no assurances that such additional agreements will be realized.
During 2011, we continued to produce electric and hybrid electric drive systems and components for First Auto Works of China (“FAW”), Smith Electric Vehicles (“Smith”), Freightliner Custom Chassis Corporation (“Freightliner”), Navistar Corporation (“Navistar”), Optare Bus (“Optare”) and the US Military as well as other domestic and international vehicle and bus manufacturers. Our various electric and hybrid-electric drive systems, power management and power conversion systems are being used in applications including several light, medium and heavy duty trucks, train locomotives, transit buses and industrial vehicles.
3
Table of Contents
Enova continues to believe that its business outlook will improve in line with the recovery of the world economy and in light of messages from the governments in the United States, China and the United Kingdom regarding their intentions to mandate the reduction of greenhouse gas emissions in the future as well as intentions to provide government incentives that may induce consumption of our products and services.
In 2011, the Company delivered a total of 305 full systems and 85 additional motor controller units of Enova drive systems to its customers. Enova delivered 170 all-electric drive systems to Smith in 2011. Enova also delivered 112 pre-transmission hybrid drive systems to FAW for their Jiefang 103 passenger hybrid bus and 11 charge depleting bus systems to Navistar during 2011.
For the year ended December 31, 2011, the following customers each accounted for more than ten percent (10%) of our total revenues:
| Customer |
Percent | |||
| Smith Electric Vehicles N.A. Inc. |
52% | |||
| Navistar, Inc. |
16% | |||
| First Auto Works Group Corporation |
16% | |||
Please refer to the Management’s Discussion and Analysis of Financial Condition and Results of Operations in Item 7 below and our financial statements in Item 8 below for further analysis of our results.
Climate Change Initiatives and Environmental Legislation
Because vehicles powered by internal combustion engines cause pollution (greenhouse gasses), there has been significant public pressure in Europe and Asia to reduce these emissions. Thus, the US (federal and state levels) and countries in Europe and Asia have enacted legislation to promote the use of zero or low emission vehicles. We believe legislation requiring or promoting zero or low emission vehicles is necessary to create a significant market for both hybrid electric (“HEV”) and electric vehicles (“EV”).
As our products reduce emissions and dependence on foreign energy, they are subject to federal, state, local and foreign laws and regulations, governing, among other things, emissions as well as laws relating to occupational health and safety. Regulatory agencies may impose special requirements for implementation and operation of our products or may significantly impact or even eliminate some of our target markets. We may incur material costs or liabilities in complying with government regulations. In addition, potentially significant expenditures could be required in order to comply with evolving environmental and health and safety laws, regulations and requirements that may be adopted or imposed in the future.
Strategic Alliances, Partnering and Technology Developments
Our continuing strategy is to adapt ourselves to the ever-changing environment of alternative fuel markets for mobile applications. Originally focusing on pure electric drive systems, we are currently positioned as a global supplier of drive systems for electric, hybrid and fuel cell applications.
We continue to seek and establish alliances with major players in the automotive and fuel cell fields. In 2011, Enova furthered its penetration into the U.S. and Asian markets. We believe the medium and heavy-duty hybrid market’s best chances of significant growth lie in identifying and pooling the largest possible numbers of early adopters in high-volume applications. We seek to utilize our competitive advantages, including customer alliances, to gain greater market share. By aligning ourselves with key customers in our target market(s), we believe that the alliance will result in the latest technology being implemented and customer requirements being met, with a minimal level of additional time or expense.
Some highlights of our accomplishments in 2011:
| • | Green For Free™. In November 2011, Enova announced its Green for Free™ Program, which is designed to allow fleet executives to operate full 100% electric commercial vehicles (EVs) for similar life cycle costs as those of diesel-powered commercial vehicles. The anticipated savings fleets are expected to realize from the reduced maintenance and fuel cost of electricity of the electric vehicles are used over a period of time to cover the incremental expense for the technology. Fleet vehicles targeted with the Green for Free™ Program stand out as possessing unique characteristics that make them clear beneficiaries of electric drive technology. With more than 16.3 million vehicles in operation, the nation’s fleets possess enough capacity to drive initial ramp-up scale in the EV OEM supply chains. This is the first program that is engineered to eliminate the overall incremental costs associated with buying and operating an all-electric vehicle, making the Green for Free™ Program attractive to fleets that are both large and small. |
4
Table of Contents
| • | Freightliner Custom Chassis Corporation (“FCCC”), a division of Daimler Trucks North America. Enova and FCCC began deploying new and retrofit all-electric vehicles to major fleet customers. The resulting integration of our all-electric drive system into the MT-45 chassis provides FCCC an all-electric product offering: the FCCC MT-EV. The MT-EV (the FCCC model name) chassis boasts a GVWR of 14,000 to 19,500 lbs. The durable steel straight-rail chassis frame reduces flex and bowing to minimize stress while carrying heavy payloads. The quiet operation of the all-electric MT-EV also makes for an enjoyable driver experience. The MT-EV has a flat-leaf spring front and rear suspension, allowing for a smooth, solid ride that minimizes cargo shifts on uneven road surfaces. Enova and FCCC also jointly announced intentions to deploy 3000 vehicles via the Green for Free™ Program (described above). |
| • | First Auto Works (“FAW”) - Enova continues to supply FAW drive systems for their hybrid buses. Since the 2008 Olympics in Beijing, Enova Systems and First Auto Works have deployed nearly 500 vehicles, all utilizing Enova’s pre-transmission hybrid drive system components. First Auto Works is one of China’s largest vehicle producers, manufacturing in excess of 1,000,000 vehicles annually. The Enova drive system is integrated and branded under the name of Jiefang CA6120URH hybrid. The Jiefang 40 ft. long hybrid city bus can carry up to 103 passengers and travel at a speeds of over 50 miles per hour. With the Enova hybrid system components, the Jiefang bus meets Euro III emission standards, consumes only 7.84 miles per gallon and achieves a reduction of 20 percent in harmful emissions. |
| • | U.S. General Services Administration (“GSA”). GSA extended its contract with Enova as the exclusive supplier contract of the all-electric step van. GSA procures vehicles for government agencies and the armed forces. Under this contract, Enova will coordinate the supply of MT-EV all-electric walk-in step vans to GSA under the Cargo Vans category. Enova continues to benefit from federal fleet penetration via GSA with the Smith Newton product offering in the Medium and Heavy Duty vehicle category. The Smith Newton is another exclusive, all-electric medium and heavy duty truck offering on the GSA product menu. Moreover, Navistar continued to demonstrate its leadership in the American school bus market with its exclusive GSA contract to supply hybrid school buses. Enova is supplies hybrid electric drive systems to IC Bus, an affiliated division of Navistar. |
| • | Remy Inc. (“Remy”). Enova and Remy signed a long-term electric motor supply agreement. Under the five-year agreement, Remy will provide its electric motors to Enova for its all-electric drive systems. With more than 2500 drive systems sold, deployed, and integrated, Enova's clean electric and hybrid electric vehicle technologies are powering fleets around the globe. Remy motors feature the company's patented High Voltage Hairpin (HVH) winding technology, which is claimed to increase torque and power density for greater speed and range in electric vehicles. |
| • | Smith Electric Vehicles N.A. Inc. (“Smith”) – Enova continues to supply Smith with electric drive systems. Smith has deployed several hundred vehicles utilizing Enova's electric drive system. Smith develops, produces and sells zero-emission commercial electric vehicles that are designed to be an alternative to traditional diesel trucks, providing higher efficiency and lower total cost of ownership. Smith has manufacturing facilities in Kansas City, Missouri, and outside of Newcastle, UK. Smith's vehicle designs leverage more than 80 years of market knowledge from selling and servicing electric vehicles in the United Kingdom. Smith produces the Newton and the Edison. |
Smith most recently announced its intention to deploy vehicles in the all-electric school bus sector. The 42-passenger Newton school bus travels up to 100 miles on a single charge at speeds of up to 50 mph, and is intended for the fixed routes in urban areas most school buses take each day.
| • | Optare plc (“Optare”) awarded Enova a contract as the production drive system supplier for their all electric buses. Enova has shipped systems to Optare that are currently being integrated into buses. Optare designs, manufactures and sells single deck and double deck buses and mini coaches. Its buses operate in the UK, Continental Europe, and North America. |
Throughout 2011, we finalized the development of our next generation Omni power management and drive system component. We are also finalizing design of a next generation on-board 10kW charger. Our various electric and hybrid-electric drive systems, power management and power conversion systems continue to be used in applications including Class 3-6 trucks, transit buses and heavy industrial vehicles. We also are continuing our current research and development programs and formulating new programs with the U.S. government and other private sector companies for electric and hybrid systems.
5
Table of Contents
Some technological developments in 2011:
Omni Inverter. Enova Systems introduced its next-generation of power electronics with the new Omni-series 200kVA-capable power inverter for hybrid-electric and all-electric vehicles. Power-source agnostic, the new Omni-series controller also offers increased flexibility and ease-of-integration. With plug-and-play connectivity, it is compatible with a wide range of vehicle drive systems and motors, and can be configured for HEV, PHEV and EV applications. The inverter has undergone a series of rigorous tests, based on specifications from FCCC, Navistar, Ford and Enova’s own internal requirements. Features include:
| • | Proprietary new liquid cooling strategy enabling leading power density; |
| • | Software configurable control allowing common hardware to be used across many sizes of hybrid or electric vehicles; |
| • | Compatible with a wide range of induction and permanent magnet motors; |
| • | True continuous power output of 110 kW, with peak over 200 kVA making the Omni capable of powering the Enova P90, P120, and even P240 drive systems; and |
| • | Heavy-duty cast aluminum chassis and robust design using minimal harnesses and interconnects allows flexible vehicle mounting in any orientation. |
Omni On-Board Charger. The new Omni-series charger is expected to increase flexibility and ease-of-integration. With plug-and-play connectivity, it is compatible with a wide range of vehicle drive systems and motors, and can be configured for HEV, PHEV and EV applications. Features will include:
| • | Charger unit, single phase 208-240V input @ 48A, single output, regulated 250-450Vdc, CAN controlled (2 CAN lines), liquid cooled (as little as 4 lpm at 60 degrees C ambient temperature) |
| • | Independent unit instead of module and compatible with any power inverter |
| • | Compliant with SAE J1772 and CENELEC standards |
| • | Ruggedized and environmentally tested to SAE J1455 standards/IP67 |
| • | Higher efficiency with reduced cooling requirements |
| • | Higher power, accommodates US standard single phase outlets up to 60A for faster charging |
| • | Integrated 600W DC/DC converter charges 12V or 24V battery configurations |
Omni DC/DC Converter. Enova is developing a DC/DC converter unit either within the housing of the Omni charger or as a standalone unit. Key features of the product will include:
| • | Independent unit instead of module and compatible with any power electronics |
| • | Compliant with SAE standards (environmental and electrical) |
Battery Suppliers
LG Chem Power Inc. (“LGCPI”). Enova continues to work with LGCPI, the North American subsidiary of LG Chem Ltd., for power oriented battery packs on Enova’s charge sustaining hybrid systems. LG Chem’s client list includes major domestic and international OEMs. Combined with Enova’s new Omni inverter, we believe these LGCPI battery packs will provide Enova’s customers with an advanced and robust medium duty truck and bus hybrid systems while presenting strong value and performance to the end user.
Enova also continues to mature its long standing relationship with Valence for their battery packs, as well as evaluating technologies offered by A123, Tesla, Samsung Bosch and Dow Kokam.
Research and development programs included our advanced power management systems for fuel cells and upgrades and improvements to our current power conversion and management components. We also continued evaluation of new technologies for electric motors, gear drive units and peripheral mechanical components to improve product performance and manufacturing efficiency. Additionally, we continue to optimize our technologies to be more universally adaptable to the requirements of our current
6
Table of Contents
and prospective customers. By modifying our software, we believe we should be able to provide a more comprehensive, adaptive and effective solution to a larger base of customers and applications. We intend to continue to research and develop new technologies and products, both internally and in conjunction with our alliance partners and other manufacturers as we deem beneficial to our global growth strategy.
Electric and Hybrid-Electric Drive Products
Enova’s hybrid and electric drive systems provide all the functionality one would find under the hood of an internal combustion engine powered vehicle. The hybrid and electric power system consists of an enhanced electric motor and the electronic controls that regulate the flow of electricity to and from the batteries at various voltages and power to propel the vehicle. In addition to the motor and controller, the system includes a gear reduction/differential unit which ensures the desired propulsion and performance. The system is designed to be installed as a “drop in,” fully integrated turnkey fashion, or on a modular, “as-needed” basis. Regardless of power source (battery, fuel cell, diesel generator or turbine) the hybrid and electric power system is designed to meet the customer’s drive cycle requirements. Enova’s all electric drive systems use largely the same designs as the hybrid systems, except that there is no internal combustion engine in the vehicle.
Hybrid vehicles are those that utilize an electric motor and batteries in conjunction with an internal combustion engine (“ICE”), whether piston or turbine. With a hybrid system, a small piston or turbine engine — fueled by gasoline or diesel, CNG, methane, etc., in a tank — supplements the electric motor and battery. These systems are self-charging, in that the operating ICE recharges the battery.
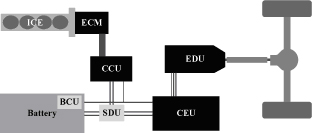
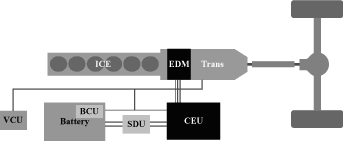
There are two types of hybrid systems: series and parallel. In a series hybrid system, only the electric motor connects to the drive shaft and in a parallel hybrid system, both the internal combustion engine and the electric motor connect to the drive shaft. In a series hybrid system, the ICE turns the generator, which charges the battery, which — through a control unit — powers the electric motor that turns the wheels. In a parallel hybrid system, both the electric motor and the ICE can operate simultaneously to drive the wheels (see diagrams below). In both hybrid systems and in pure electric systems, regenerative braking occurs which assists in the charging of the batteries.
The parallel hybrid system is ideally suited for conditions where most of the driving is done at constant speed cruising, with a smaller amount of the driving involving random acceleration, such as “uphill” or with “stop and go” conditions. For acceleration, the controller causes the electric motor to assist the ICE, both running simultaneously. When speed is steady or the ground is flat, only the ICE runs. Additionally, when the batteries are low, the controller causes the ICE and motor to charge the batteries. As a result, the series hybrid system is best suited for starts and stops, and is ideal for applications such as urban transit buses and urban garbage trucks. The design of the series hybrid system is based on a driving cycle with a high percentage of random acceleration conditions.
Hybrid and Electric Drive Configurations
Enova has identified four primary configurations based upon how well they meet market needs economic requirements. We have developed all of the relevant technology required to produce these drive systems and we are currently introducing the Hybrid Power product line worldwide. All of our innovative hybrid drive systems are compatible with a wide range of fuel sources and engine configurations.
7
Table of Contents
Series Hybrid with Diesel Generator
The Series Hybrid is typically ideal for low floor vehicles with a driving cycle that has a high percentage of stop and go and/or hilly terrain. Refuse trucks, urban delivery trucks and intra-city buses are the primary target markets for these drive systems.
Post Transmission Parallel Hybrid
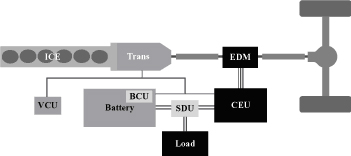
The Post Transmission Parallel Hybrid is ideal for vehicles with a driving cycle with a high percentage of stop and go, as well as constant speed cruising. Target markets include refuse trucks, urban delivery trucks, school buses and intra-city buses.
Pre Transmission Parallel Hybrid
The Pre-Transmission Parallel Hybrid is ideal for vehicles with a driving cycle having a small percentage of constant speed cruising and a large percentage of stop and go. Target markets include inter-city transit buses and trucks as well as military vehicles.
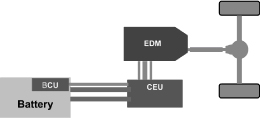
All Electric Vehicle Drive System
8
Table of Contents
The Electric Drive Systems works well with vehicles with a disciplined driving route that has a high percentage of stop and go conditions. Refuse trucks, urban delivery trucks and intra-city vehicles are the primary markets for these drive systems.
Definitions:
BCU — Battery Care Unit; HCU — Hybrid Control Unit; SDU — Safety Disconnect Unit; VCU — Vehicle Control Unit
CEU — Control Electronics Unit (Houses MCU, DC-DC, and Charger); MCU — Motor Control Unit;
EDM — Electric Drive Motor; EDU — Electric Drive Unit (Includes EDM & GDU); GDU — Gear Drive Unit
GCU — Generator Control Unit; EGM — Electric Generator Motor; ICE — Internal Combustion Engine
Electric Drive Motors
The electric drive unit is essentially an electric motor with additional features and functionality. The motor is liquid-cooled, environmentally sealed, designed to handle automotive shock and vibration, and includes parking pawl, which stops the vehicle when the driver parks the car. It also permits regenerative braking to provide power recovery, in which the mechanical energy of momentum is converted into electrical energy as the motor slows during braking or deceleration. The optional gear reduction unit takes the electric motor’s high rpm and gears it down to the lower rpm required by the vehicle’s conventional drive shaft. As the revolutions per minute (“rpm”) go down, the torque of the electric motor increases.
The hybrid electric drive systems exclusively utilize Permanent Magnet or induction motor technology. The drive system is scalable and can be customized for different applications. Due to the large operating range that these propulsion systems offer, all parameters can be optimized; the user will not have to choose between acceleration, torque or vehicle speed.
Motor Controllers
The controller houses all the components necessary to control the powering of a vehicle, in one easy-to-install package. Our main component is an inverter, which converts DC electricity to AC electricity. We also offers optional controllers for the air conditioning, power steering and heat pumps, 12VDC/24VDC DC-to-DC converter for vehicle auxiliary loads such as cell phones, radio, lights, and a 6.6kW AC-to-DC on-board conductive charger which allows for direct 110 VAC or 220 VAC battery charging. These are located in the same housing as the controller, thus extra interconnects are not required. This approach simplifies the vehicle wiring harness and increases system reliability. Using our proprietary Windows based software package, vehicle interfaces and control parameters can be programmed in-vehicle. Real-time vehicle performance parameters can be monitored and collected.
Drive System Accessories
Enova’s drive system accessories range from battery management systems to hybrid controllers, to rapid charging systems. These critical components are designed to complement the drive system family by providing the elements necessary to create a complete technical solution for alternative energy drive systems.
Enova’s drive system accessories are not only integral, but also are the perfect complement to our drive systems and are designed to provide our customers with a complete solution to their drive system needs.
Manufacturing Strategy
We have developed a multi-tiered manufacturing strategy that allows us to meet the market’s demand for high quality production goods while optimizing cost of goods sold across the spectrum of low to high volumes. At the core of this strategy is a strong reliance on pre-selected highly qualified outside manufacturing houses that specialize in various aspects of the manufacturing process. This closely managed outsourcing strategy helps Enova control product costs while also minimizing fixed costs within the organization.
Competitive Conditions
The competition to develop and market electric, hybrid and fuel cell powered vehicles continued to accelerate during the last year and we expect this trend to continue as governments in our target markets adopt initiatives to reduce greenhouse gas emissions. In the event governments in our target markets completely rescinded their support for the reduction of greenhouse gas emissions and sustainability initiatives, our business model would be adversely and significantly affected. Moreover, although competition within the
9
Table of Contents
mobile hybrid sector is still somewhat fragmented, there are indications of some consolidation at this time. The competition consists of development stage companies as well as major U.S. and international companies. The larger companies tend to focus on single solutions and maintain the capital and wherewithal to aggressively market such. The smaller competitors offer a more diversified product line, but do not have the market presence to generate significant penetration at this juncture.
Our research and experience has indicated that our target market segments certainly focus on price, but would buy based on reliability, performance and quality support when presented the life-cycle business model for EV-HEV technologies for their application. Our future prospects are highly dependent upon the successful development and introduction of new products that are responsive to market needs and can be manufactured and sold at a profit. There can be no assurance that we will be able to successfully develop or market any such products.
The development of hybrid-electric and alternative fuel vehicles, such as compressed natural gas, fuel cells and hybrid cars poses a competitive threat to our markets for low emission vehicles or LEVs but not in markets where government mandates call for zero emission vehicles or ZEVs. Enova is involved in the development of hybrid vehicles and fuel cell systems in order to meet future government requirements and applications.
Various providers of electric vehicles have proposed products or offer products for sale in this emerging market. These products encompass a wide variety of technologies aimed at both consumer and commercial markets. As the industry matures, key technologies and capabilities are expected to play critical competitive roles. Our goal is to position ourselves as a long term competitor in this industry by focusing on all-electric, hybrid and fuel cell powered drive systems and related sub systems, component integration, technology application and strategic alliances.
We believe the hybrid and electric vehicle market is poised for growth over the medium and long term and that Enova’s products are positioned to capitalize on demands being placed on the market by offering solutions. Enova believes that our competitive advantages include:
| • | Providing a full product line of power management and power conversion, and supporting system integration |
| • | Providing products that allow the hardware to be software programmable and configurable |
| • | Offering a product line designed for the most advanced new fuel systems: electric, hybrid, fuel cell and solar power applications |
| • | Providing fully integrated, “drop-in” energy management and conversion system in “one box” |
| • | Offering systems with reduced footprint and weight, high functionality and low cost — characteristics essential for all market applications |
| • | Meeting changing and sophisticated requirements of emerging alternative power markets and applications. |
| • | Positioning ourselves as a strategic ally with our global customer base, manufacturers and our R&D partners. |
By building a business based on long-standing relationships with clients such as Freightliner Custom Chassis Corporation, Smith Electric Vehicles, First Auto Works and Optare, we believe we are building defenses against competition by securing customers with global reach and OEM status. Teaming with recognized global manufacturers allows Enova to avoid devoting resources to manufacturing infrastructure and allows us access to production capacity at relatively low costs.
Research and Development
Enova maintains a strategy of continual enhancement of its current product line and development of more efficient and reliable products for the ever-changing alternative energy sectors. Management believes R&D must be continued in order to be remain competitive, minimize production costs and meet our customers’ specifications. Because microprocessors and other components continue to advance in speed, miniaturization and reduction of cost, we must re-examine our designs to take advantage of such developments. We seek to provide internal funding where technology development is critical to our future.
For the years ended December 31, 2011, and 2010, we spent $2,039,000 and $1,838,000, respectively, on internal research and development activities. Enova is continually evaluating and updating the technology and equipment used in developing each of its products. The electric and hybrid vehicle industry utilizes rapidly changing technology and we will endeavor to modernize our current products as well as continue to develop new leading edge technologies to maintain our competitive position in the market.
10
Table of Contents
Intellectual Property
Enova is actively evaluating and applying for technology protection on its Omni Drive System. The Omni system contains many areas where Enova will have unique advantages in comparison to existing technologies and the company is working to fully protect these areas. This process involves complex legal and factual questions, and the breadth of claims allowed is uncertain. Accordingly, there can be no assurance that patent applications filed by us will result in patents being issued. Moreover, there can be no assurance that third parties will not assert claims against us with respect to existing and future products. Although we intend to vigorously protect our rights, there can be no assurance that these measures will be successful. In the event of litigation to determine the validity of any third party claims, such litigation could result in significant expense to Enova. Additionally, the laws of certain countries in which our products are or may be developed, manufactured or sold may not protect our products and intellectual property rights to the same extent as the laws of the United States.
Enova currently holds three U.S. patents relating to power management and control that will expire in 2015. We also have trademarks or service marks in the United States. We continually review and append our protection of proprietary technology. We continue to place emphasis on the development and acquisition of patentable technology. A majority of our intellectual property is contained within our software which we believe is best protected under trade secret intellectual property law. Under such provisions, Enova does not have to publish its proprietary code in order to maintain protection. In light of advancements and initiatives to produce our next-generation Omni drive system, Enova made an immaterial adjustment to bring the three U.S patents to a zero book value balance as of December 31, 2010.
Enova’s pending or future patent applications may not be approved and the claims covered by such applications may be reduced. If allowed, patents may not be of sufficient scope or strength, others may independently develop similar technologies or products, duplicate any of Enova’s products or design around its patents, and the patents may not provide Enova with competitive advantages. Further, patents held by third parties may prevent the commercialization of products incorporating Enova’s technologies or third parties may challenge or seek to narrow, invalidate or circumvent any of Enova’s pending or future patents. Enova also believes that foreign patents, if obtained, and the protection afforded by such foreign patents and foreign intellectual property laws, may be more limited than that provided under United States patents and intellectual property laws. Litigation, which could result in substantial costs and diversion of effort by Enova, may also be necessary to enforce any patents issued or licensed to Enova or to determine the scope and validity of third-party proprietary rights. Any such litigation, regardless of outcome, could be expensive and time-consuming, and adverse determinations in any such litigation could seriously harm Enova’s business. Enova relies on unpatented trade secrets and know-how and proprietary technological innovation and expertise which are protected in part by confidentiality and invention assignment agreements with its employees, advisors and consultants and non-disclosure agreements with certain of its suppliers and distributors. If these agreements are breached, Enova may not have adequate remedies for any breach and Enova’s unpatented proprietary intellectual property may otherwise become known or independently discovered by competitors.
Employees
As of December 31, 2011, we had a total of 30 employees comprising of 27 full-time, 1 part-time and 2 temporary employee positions. In addition, we employ one individual as an independent contractor engaged on a monthly basis.
Available and Additional Information
Included in Item 8 of this 10K are audited financial statements which include revenues, a measure of profit or loss and total assets.
We file electronically with the SEC our annual report on Form 10-K, quarterly reports on Form 10-Q, current reports on Form 8-K, and amendments to those reports filed or furnished pursuant to Section 13(a) or 15(d) of the Securities Exchange Act of 1934. We make available free of charge on or through our website copies of these reports as soon as reasonably practicable after we electronically file such material with, or furnish it to, the SEC. The SEC maintains an internet site that contains reports, proxy and information statements and other information regarding our filings at www.sec.gov. You may also read and copy any of our materials filed with the SEC at the SEC’s Public Reference Room at 100 F Street, NE, Washington, DC 20549. Information regarding the operation of the Public Reference Room can be obtained by calling the SEC at 1-800-SEC-0330. Our website address is www.enovasystems.com. Information found on, or that can be accessed through, our website is not incorporated by reference into this annual report.
11
Table of Contents
| ITEM 1A. RISK | FACTORS |
The statements in this Section describe the major risks to our business and should be considered carefully. In addition, these statements constitute our cautionary statements under the Private Securities Litigation Reform Act of 1995 and apply to all sections of this Form 10-K.
This annual report on Form 10-K, including the documents that we incorporate by reference, contains statements indicating expectations about future performance and other forward-looking statements that involve risks and uncertainties. We usually use words such as “may,” “will,” “should,” “expect,” “plan,” “anticipate,” “believe,” “estimate,” “predict,” “future,” “intend,” “potential,” or “continue” or the negative of these terms or similar expressions to identify forward-looking statements. These statements appear throughout the Form 10-K and are statements regarding our current intent, belief, or expectation, primarily with respect to our operations and related industry developments. Examples of these statements include, but are not limited to, statements regarding the following: our expansion plans, our future operating expenses, our future losses, our future expenditures for research and development and the sufficiency of our cash resources. You should not place undue reliance on these forward-looking statements, which apply only as of the date of this annual report. Our actual results could differ materially from those anticipated in these forward-looking statements for many reasons, including the risks faced by us and described in this “Risk Factors” section and elsewhere in this annual report.
We cannot guarantee that any forward-looking statement will be realized, although we believe we have been prudent in our plans and assumptions. Achievement of future results is subject to risks, uncertainties and potentially inaccurate assumptions. Should known or unknown risks or uncertainties materialize, or should underlying assumptions prove inaccurate, actual results could differ materially from past results and those anticipated, estimated or projected. You should bear this in mind as you consider forward-looking statements.
We undertake no obligation to publicly update forward-looking statements, whether as a result of new information, future events or otherwise. You are advised, however, to consult any further disclosures we make on related subjects in our 10-Q and 8-K reports to the SEC. Also note that we provide the following cautionary discussion of risks, uncertainties and possibly inaccurate assumptions relevant to our businesses. These are factors that, individually or in the aggregate, we think could cause our actual results to differ materially from expected and historical results. We note these factors for investors as permitted by the Private Securities Litigation Reform Act of 1995. You should understand that it is not possible to predict or identify all such factors. Consequently, you should not consider the following to be a complete discussion of all potential risks or uncertainties.
Our history of operating losses and our expectation of continuing losses may hurt our ability to reach profitability or continue operations.
We have experienced significant operating losses since our inception. Our net loss was $6,984,000 for the fiscal year ended December 31, 2011 and our accumulated deficit was $151,112,000 as of December 31, 2011. It is likely that we will continue to incur substantial net operating losses for the foreseeable future, which may adversely affect our ability to continue operations. To achieve profitable operations, we must successfully develop and market our products at higher margins. We may not be able to generate sufficient product revenue to become profitable. Even if we do achieve profitability, we may not be able to sustain or increase our profitability on a quarterly or yearly basis.
We are dependent on access to capital markets in order to fund continued operations of the Company.
We do not currently have adequate internal liquidity to fund the Company’s operations on an ongoing basis. We will need to continue to look for partnering opportunities and other external sources of liquidity, including the public and private financial markets and strategic partners. We may not be able to obtain financing arrangements in amounts or on terms acceptable to us in the future. In the event we are unable to obtain additional financing when needed, and without substantial reductions in development programs and strategic initiatives, we do not expect that our cash and cash equivalents and short-term investments will be sufficient to fund our operating and capital needs for the twelve months following December 31, 2011.
Because we depend upon sales to a limited number of customers, our revenues will be reduced if we lose a major customer
Our revenue is dependent on significant orders from a limited number of customers. We typically enter into supply agreements with major customers establishing product and price standards for future periods. Subsequent events may change the needs of the customer, requiring us to make corresponding adjustments. In the fiscal year ended December 31, 2011, Smith accounted for 52% of our total revenues and our four largest customers, inclusive of Smith, comprised 94% of revenues. We believe that revenues from major customers will continue to represent a significant portion of our revenues. This customer concentration increases the risk of quarterly
12
Table of Contents
fluctuations in our revenues and operating results. The loss or reduction of business from one or a combination of our significant customers could adversely affect our revenues, financial condition and results of operations. Moreover, our success will depend in part upon our ability to obtain orders from new customers, as well as the financial condition and success of our customers and general economic conditions.
Our future growth depends on consumers’ willingness to accept hybrid and electric vehicles
Our growth is highly dependent upon the acceptance by consumers of, and we are subject to an elevated risk of any reduced demand for, alternative fuel vehicles in general and electric vehicles in particular. If the market for electric vehicles does not develop as we expect or develops more slowly than we expect, our business, prospects, financial condition and operating results will be materially and adversely affected. The market for alternative fuel vehicles is relatively new, rapidly evolving, characterized by rapidly evolving and changing technologies, price competition, additional competitors and changing consumer demands or behaviors. Factors that may influence the acceptance of alternative fuel vehicles include:
| • | perceptions about alternative fuel vehicles safety (in particular with respect to lithium-ion battery packs), design, performance and cost, especially if adverse events or accidents occur that are linked to the quality or safety of alternative fuel vehicles; |
| • | volatility in the cost of oil and gasoline; |
| • | consumer’s perceptions of the dependency of the United States on oil from unstable or hostile countries; |
| • | improvements in fuel of the internal combustion engine; |
| • | the environmental consciousness of consumers; |
| • | government regulation |
| • | macroeconomics |
We extend credit to our customers, which exposes us to credit risk
Most of our outstanding accounts receivable are from a limited number of large customers. At December 31, 2011, the two highest outstanding accounts receivable balances totaled approximately $780,000 which represents 91% of our gross accounts receivable. If we fail to monitor and manage effectively the resulting credit risk and a material portion of our accounts receivable is not paid in a timely manner or becomes uncollectible, our business would be significantly harmed, and we could incur a significant loss associated with any outstanding accounts receivable.
Our business is affected by current economic and financial market conditions in the markets we serve
Current global economic and financial markets conditions, including severe disruptions in the credit markets and the significant and potentially prolonged global economic recession, may materially and adversely affect our results of operations and financial condition. We are particularly impacted by any global automotive slowdown and its effects on OEM inventory levels, production schedules, support for our products and decreased ability to accurately forecast future product demand.
The nature of our industry is dependent on technological advancement and is highly competitive
The mobile power market, including electric vehicle and hybrid electric vehicles, continue to be subject to rapid technological changes. Most of the major domestic and foreign automobile manufacturers: (1) have already produced electric and hybrid vehicles, (2) have developed improved electric storage, propulsion and control systems, and/or (3) are now entering or have entered into production, while continuing to improve technology or incorporate newer technology. Various companies are also developing improved electric storage, propulsion and control systems.
Our industry is affected by political and legislative changes
In recent years there has been significant legislation enacted in the United States and abroad to reduce or eliminate automobile pollution, promote or mandate the use of vehicles with no tailpipe emissions (“zero emission vehicles”) or reduced tailpipe emissions (“low emission vehicles”). Although states such as California have enacted such legislation, we cannot assure you that there will not be further legislation enacted changing current requirements or that current legislation or state mandates will not be repealed or amended, or that a different form of zero emission or low emission vehicle will not be invented, developed and produced, and achieve greater market acceptance than electric or hybrid electric vehicles.
13
Table of Contents
We may be unable to effectively compete with other companies who have significantly greater resources than we have
Many of our competitors, in the automotive, electronic, and other industries, have substantially greater financial, personnel, and other resources than we do. Because of their greater resources, some of our competitors may be able to adapt more quickly to new or emerging technologies and changes in customer requirements, or to devote greater resources to the promotion and sales of their products than we can.
We may be exposed to product liability or tort claims if our products fail, which could adversely impact our results of operations
A malfunction or the inadequate design of our products could result in product liability or other tort claims. Any liability for damages resulting from malfunctions could be substantial and could materially adversely affect our business and results of operations. In addition, a well-publicized actual or perceived problem could adversely affect the market’s perception of our products.
We are highly dependent on a few key personnel and will need to retain and attract such personnel in a labor competitive market
Our success is largely dependent on the performance of our key management and technical personnel, the loss of one or more of whom could adversely affect our business. Additionally, in order to successfully implement our anticipated growth, we will be dependent on our ability to hire additional qualified personnel. There can be no assurance that we will be able to retain or hire other necessary personnel. We do not maintain key man life insurance on any of our key personnel. We believe that our future success will depend in part upon our continued ability to attract, retain, and motivate additional highly skilled personnel in an increasingly competitive market.
We are highly dependent on a few vendors for key system components made to our engineering specifications and disruption of vendor supply could adversely impact our results of operations.
Our product specifications often involve upfront investment in tooling and machinery, which result in our commitment to a limited number of high quality vendors that can meet our manufacturing standards. Any disruption to our supply of key components from the suppliers would have an adverse impact on our business and results of operations.
There are minimal barriers to entry in our market
We presently license or own only certain proprietary technology, and therefore have created little or no barrier to entry for competitors other than the time and significant expense required to assemble and develop similar production and design capabilities.
Our competitors may enter into exclusive arrangements with our current or potential suppliers, thereby giving them a competitive edge which we may not be able to overcome, and which may exclude us from similar relationships.
ITEM 1B. UNRESOLVED STAFF COMMENTS
Not applicable.
Our corporate offices are located at an office and manufacturing facility at 1560 West 190th Street, Torrance, California. We lease this 43,000 square foot office and manufacturing facility. Enova also rented an office in Hawaii on a month-to-month basis, but closed the office in November 2011.
Given the nature of our business, we are subject from time to time to lawsuits, investigations and disputes (some of which involve substantial amounts claimed) arising out of the conduct of our business, including matters relating to commercial transactions. Other than the Arens matter outlined below, we are not aware of any other pending legal matters. We recognize a liability for any contingency that is probable of occurrence and reasonably estimable. We continually assess the likelihood of adverse outcomes in these matters, as well as potential ranges of probable losses (taking into consideration any insurance recoveries), based on a careful analysis of each matter with the assistance of outside legal counsel and, if applicable, other experts.
14
Table of Contents
Most contingencies are resolved over long periods of time, potential liabilities are subject to change due to new developments, changes in settlement strategy or the impact of evidentiary requirements, which could cause us to pay damage awards or settlements (or become subject to equitable remedies) that could have a material adverse effect on our results of operations or operating cash flows in the periods recognized or paid.
The Company reported in an 8-K filed January 20, 2011 with date of earliest event reported being January 14, 2011, on January 6, 2011, that we entered into a Partial Settlement Agreement, dated January 5, 2011 (the “Settlement Agreement”), with Arens Controls Company, L.L.C. (“Arens”) to resolve certain claims made by Arens in connection with its action captioned Arens Controls Company, L.L.C. v. Enova Systems, Inc., filed in 2008 with the Northern District of Illinois of the U.S. District Court (the “Legal Action”). The Settlement Agreement was amended by Amendment No. 1 to Partial Settlement Agreement (the “Amendment”) dated January 14, 2011.
In the Legal Action, Arens asserted eight counts against Enova, including certain claims regarding inventory asserted by Arens to be valued at $1,671,000 (the “Inventory Claim”), a claim for payment under certain invoices, and claims for certain other monetary obligations of Enova to Arens.
Under the terms of the Settlement Agreement, we paid $327,000 directly to Arens and Arens dismissed with prejudice all but two of the counts under the Legal Action. Additionally, under the Settlement Agreement (as amended), on January 14, 2011, we acquired the inventory that was the subject of the Inventory Claim (the “Inventory”) for payment of $1,498,000, net of an agreed upon reduction of $173,000 for the acquisition price of such Inventory. In return, Arens was deemed to have released us from any further liability on the Inventory Claim. However, per the terms of the Settlement Agreement (as amended), Arens is not deemed to have released us from (but instead is deemed to have preserved its claims under) two of the counts in the Legal Action.
The two counts that were not settled remain outstanding and there have been no material developments with respect thereto during the period covered by this report. The Company has meritorious defenses and intends to contest all remaining matters vigorously.
ITEM 4. MINE SAFETY DISCLOSURES
Not applicable.
| ITEM 5. | MARKET FOR REGISTRANT’S COMMON EQUITY, RELATED STOCKHOLDER MATTERS AND ISSUER PURCHASES OF EQUITY SECURITIES |
| Shares of our common stock now trade on the NYSE Amex under the same and previous trading symbol “ENA” and on the London Stock Exchange AIM Market under the symbol “ENVS.L” or “ENV.L”. Our common stock became listed on the NYSE Amex on August 29, 2006. The following table sets forth the high and low sales closing prices of our Common Stock as reflected on the NYSE Amex. |
||||||||
| Common Stock | ||||||||
| High Price | Low Price | |||||||
| Calendar 2011 |
||||||||
| Fourth Quarter |
$ | 0.39 | $ | 0.15 | ||||
| Third Quarter |
$ | 0.87 | $ | 0.40 | ||||
| Second Quarter |
$ | 1.40 | $ | 0.82 | ||||
| First Quarter |
$ | 1.49 | $ | 0.86 | ||||
| Calendar 2010 |
||||||||
| Fourth Quarter |
$ | 1.47 | $ | 0.64 | ||||
| Third Quarter |
$ | 1.05 | $ | 0.60 | ||||
| Second Quarter |
$ | 1.57 | $ | 0.89 | ||||
| First Quarter |
$ | 2.22 | $ | 1.42 | ||||
As of February 29, 2012, there were approximately 1,000 holders of record of our Common Stock. As of February 29, 2012, approximately 100 shareholders held our Series A Preferred Stock and approximately 32 shareholders held our Series B Preferred Stock. The number of holders of record excludes beneficial holders whose shares are held in the name of nominees or trustees.
15
Table of Contents
Dividend Policy
To date, we have neither declared nor paid any cash dividends on shares of our Common Stock or Series A or B Preferred Stock. We presently intend to retain all future earnings for our business and do not anticipate paying cash dividends on our Common Stock or Series A or B Preferred Stock in the foreseeable future. We are required to pay dividends on our Series A and B Preferred Stock before dividends may be paid on any shares of Common Stock. At December 31, 2011, Enova had an accumulated deficit of approximately $151,112,000 and, until this deficit is eliminated, will be prohibited from paying dividends on any class of stock except out of net profits, unless it meets certain asset and other tests under Section 500 et. seq. of the California Corporations Code.
| ITEM 6. | SELECTED FINANCIAL DATA |
The following selected financial data tables set forth selected financial data for the years ended December 31, 2011, 2010 and 2009. The statement of operations data and balance sheet data for and as of the years ended December 31, 2011, 2010, and 2009 are derived from the audited financial statements of Enova. The following selected financial data should be read in conjunction with “Management’s Discussion and Analysis of Financial Condition and Results of Operations” and the Financial Statements, including the notes thereto, appearing elsewhere in this Form 10-K.
| For and as of the Years
Ended December 31, | |||||||||||||||
| 2011 | 2010 | 2009 | |||||||||||||
| (In thousands, except per share data) | |||||||||||||||
| Statement of Operations Data |
|||||||||||||||
| Net revenues |
$ | 6,622 | $ | 8,572 | $ | 5,622 | |||||||||
| Cost of revenues |
6,364 | 7,159 | 5,016 | ||||||||||||
|
|
|
|
|
|
|
||||||||||
| Gross profit (loss) |
258 | 1,413 | 606 | ||||||||||||
|
|
|
|
|
|
|
||||||||||
| Operating expenses |
|||||||||||||||
| Research and development |
2,039 | 1,838 | 1,228 | ||||||||||||
| Selling, general and administrative |
5,075 | 6,558 | 6,223 | ||||||||||||
|
|
|
|
|
|
|
||||||||||
| Total operating expenses |
7,114 | 8,396 | 7,451 | ||||||||||||
| Other income and (expense) |
|||||||||||||||
| Interest and other income (expense), net |
(128 | ) | (437 | ) | (196 | ) | |||||||||
| Equity in losses of non-consolidated joint venture, net |
— | — | (4 | ) | |||||||||||
|
|
|
|
|
|
|
||||||||||
| Total other income and (expense) |
(128 | ) | (437 | ) | (200 | ) | |||||||||
|
|
|
|
|
|
|
||||||||||
| Net loss |
$ | (6,984 | ) | $ | (7,420 | ) | $ | (7,045 | ) | ||||||
|
|
|
|
|
|
|
||||||||||
| Per common share: |
|||||||||||||||
| Basic and diluted loss per share |
$ | (0.22 | ) | $ | (0.24 | ) | $ | (0.33 | ) | ||||||
|
|
|
|
|
|
|
||||||||||
| Weighted average number of common shares outstanding |
31,537 | 31,422 | 21,385 | ||||||||||||
|
|
|
|
|
|
|
||||||||||
| Balance Sheet Data |
|||||||||||||||
| Total assets |
$ | 9,340 | $ | 17,690 | $ | 22,011 | |||||||||
|
|
|
|
|
|
|
||||||||||
| Long-term debt |
$ | 1,286 | $ | 1,286 | $ | 1,286 | |||||||||
|
|
|
|
|
|
|
||||||||||
| Shareholders’ equity |
$ | 5,298 | $ | 10,646 | $ | 17,247 | |||||||||
|
|
|
|
|
|
|
||||||||||
| ITEM 7. | MANAGEMENT’S DISCUSSION AND ANALYSIS OF FINANCIAL CONDITION AND RESULTS OF OPERATIONS |
You should read this Management’s Discussion and Analysis of Financial Condition and Results of Operations in conjunction with our 2011 Financial Statements and accompanying Notes. The matters addressed in this Management’s Discussion and Analysis of Financial Condition and Results of Operations may contain certain forward-looking statements involving risks and uncertainties.
Overview
Enova Systems believes it is a leading innovator of proprietary hybrid and electric drive systems propelling the alternative energy industry. Our core competencies are focused on the development and commercialization of power management and conversion systems for mobile applications. Enova applies unique ‘enabling technologies’ in the areas of alternative energy propulsion systems for medium and heavy-duty vehicles as well as power conditioning and management systems for distributed generation systems. Our products can be found in a variety of OEM vehicles including those from Freightliner Customer Chassis Corporation, Navistar Corporation, First Auto Works, trucks and buses for Smith Electric Vehicles, Wright Bus, Optare Plc. and the U.S. Military, as well as digital power systems for EDO and other major manufacturers.
16
Table of Contents
We continue to support our customers in their efforts to maximize exposure in the market. We have been involved in large shows throughout the USA and look to continue increasing our exposure at future worldwide events. The exposure via shows and direct interface were aggressively pursued throughout 2011 in an effort to promote our drive system for medium and heavy duty applications.
Some notable highlights of Enova’s accomplishments in 2011, as noted earlier are:
| • | Green For Free™. In November 2011, Enova announced its Green for Free™ Program, which is designed to allow fleet executives to operate full 100% electric commercial vehicles (EVs) for similar life cycle costs as those of diesel-powered commercial vehicles. The anticipated savings fleets are expected to realize from the reduced maintenance and fuel cost of electricity of the electric vehicles are used over a period of time to cover the incremental expense for the technology. Fleet vehicles targeted with the Green for Free™ Program stand out as possessing unique characteristics that make them clear beneficiaries of electric drive technology. With more than 16.3 million vehicles in operation, the nation’s fleets possess enough capacity to drive initial ramp-up scale in the EV OEM supply chains. This is the first Program that is engineered to eliminate the overall incremental costs associated with buying and operating an all-electric vehicle, making the Program attractive to fleets that are both large and small. |
| • | Freightliner Custom Chassis Corporation (“FCCC”), a division of Daimler Trucks North America. Enova and FCCC began deploying new and retrofit all electric vehicles to major fleet customers. The resulting integration of our all-electric drive system into the MT-45 chassis provides FCCC an all-electric product offering: the FCCC MT-EV. The MT-EV (the FCCC model name) chassis boasts a GVWR of 14,000 to 19,500 lbs. The durable steel straight-rail chassis frame reduces flex and bowing to minimize stress while carrying heavy payloads. The quiet operation of the all-electric MT-EV also makes for an enjoyable driver experience. The MT-EV has a flat-leaf spring front and rear suspension, allowing for a smooth, solid ride that minimizes cargo shifts on uneven road surfaces. Enova and FCCC also jointly announced intentions to deploy 3000 vehicles via the Green for Free™ Program (described above). |
| • | First Auto Works (“FAW”) - Enova continues to supply FAW drive systems for their hybrid buses. Since the 2008 Olympics in Beijing, Enova Systems and First Auto Works have deployed nearly 500 vehicles, all utilizing Enova’s pre-transmission hybrid drive system components. First Auto Works is one of China’s largest vehicle producers, manufacturing in excess of 1,000,000 vehicles annually. The Enova drive system is integrated and branded under the name of Jiefang CA6120URH hybrid. The Jiefang 40 ft. long hybrid city bus can carry up to 103 passengers and travel at a speeds of over 50 miles per hour. With the Enova hybrid system components, the Jiefang bus meets Euro III emission standards, consumes only 7.84 miles per gallon and achieves a reduction of 20 percent in harmful emissions. |
| • | U.S. General Services Administration (“GSA”). GSA extended its contract with Enova as the exclusive supplier contract of the all-electric step van. GSA procures vehicles for government agencies and the armed forces. Under this contract, Enova will coordinate the supply of MT-EV all-electric walk-in step vans to GSA under the Cargo Vans category. Enova continues to benefit from federal fleet penetration via GSA with the Smith Newton product offering in the Medium and Heavy Duty vehicle category. The Smith Newton is another exclusive, all-electric medium and heavy duty truck offering on the GSA product menu. Moreover, Navistar continued to demonstrate its leadership in the American school bus market with its exclusive GSA contract to supply hybrid school buses. Enova is supplies hybrid electric drive systems to IC Bus, an affiliated division of Navistar. |
| • | Remy Inc. (“Remy”). Enova and Remy signed a long-term electric motor supply agreement. Under the five-year agreement, Remy will provide its electric motors to Enova for its all-electric drive systems. With more than 2500 drive systems sold, deployed, and integrated, Enova’s clean electric and hybrid electric vehicle technologies are powering fleets around the globe. Remy motors feature the company’s patented High Voltage Hairpin (HVH) winding technology, which is claimed to increase torque and power density for greater speed and range in electric vehicles. |
| • | Smith Electric Vehicles N.A. Inc. (“Smith”) – Enova continues to supply Smith with electric drive systems. Smith has deployed several hundred vehicles utilizing Enova’s electric drive system. Smith develops, produces and sells zero-emission commercial electric vehicles that are designed to be an alternative to traditional diesel trucks, providing higher efficiency and lower total cost of ownership. Smith has manufacturing facilities in Kansas City, Missouri, and outside of Newcastle, UK. Smith’s vehicle designs leverage more than 80 years of market knowledge from selling and servicing electric vehicles in the United Kingdom. Smith produces the Newton and the Edison. |
17
Table of Contents
Smith most recently announced its intention to deploy vehicles in the all-electric school bus sector. The 42-passenger Newton school bus travels up to 100 miles on a single charge at speeds of up to 50 mph, and is intended for the fixed routes in urban areas most school buses take each day.
| • | Optare plc. (“Optare”) awarded Enova a contract as the production drive system supplier for their all electric buses. Enova has shipped systems to Optare that are currently being integrated into buses. Optare designs, manufactures and sells single deck and double deck buses and mini coaches. Its buses operate in the UK, Continental Europe, and North America. |
| • | The Company delivered a total of 305 full systems and 85 additional motor controller units of Enova drive systems to its broad range of customers. Enova delivered 170 all-electric drive systems plus additional motor control units and other components to Smith in 2011. Enova also delivered 120 pre-transmission hybrid drive systems to FAW for their Jiefang 112 passenger hybrid bus and 11 charge depleting bus systems to Navistar during the year. |
Enova’s product focus is digital power management and power conversion systems. Its software and hardware manage and control the power that drives a vehicle. They convert the power into the appropriate forms required by the vehicle or device and manage the flow of this energy to optimize efficiency and provide protection for both the system and its users. Our products and systems are the enabling technologies for power systems.
The latest state-of-the-art technologies in hybrid and electric vehicles and fuel cell systems all require some type of power management and conversion mechanism. Enova Systems supplies these essential components. Enova drive systems are ‘fuel-neutral,’ meaning that they have the ability to utilize any type of fuel, including diesel, liquid natural gas or bio-diesel fuels. Enova also performs significant research and development to augment and support others’ and our internal product development efforts.
Our products are “production-engineered.” This means they are designed so they can be commercially produced (i.e., all formats and files are designed with manufacturability in mind, from the start). For the automotive market, Enova designs its products to ISO 9001 manufacturing and quality standards. We believe Enova’s redundancy of systems and rigorous quality standards result in high performance and reduced risk. For every component and piece of hardware, there are detailed performance specifications. Each piece is tested and evaluated against these specifications, which enhances and confirms the value of the systems to OEM customers. Our engineering services focus on system integration support for product sales and custom product design.
In light of our efforts to grow market share in our target markets and penetrate emerging ones, the Company continues to acknowledge the principal barrier to commercialization of our drive systems is cost. The cost of engineering proprietary software and hardware for our drive systems is high because economies of production in specialized hybrid drive system component parts, batteries, and vehicle integration have not been achieved. Therefore, the cost of our products and engineering services are currently higher than our gasoline and diesel competitor counterparts. We also believe maturation into commercialization of our drive systems will result in decreases to our long run average costs of materials and services as volume increases over time.
Critical Accounting Policies
The preparation of consolidated financial statements requires us to make estimates and judgments that affect the reported amounts of assets, liabilities, revenues and expenses, and related disclosure of contingent assets and liabilities. On an ongoing basis, we evaluate our estimates, including those related to product returns, bad debts, inventories, intangible assets, income taxes, stock-based compensation, warranty obligations, contingencies, and litigation. We base our estimates on historical experience and on various other assumptions believed to be reasonable under the circumstances, including current and anticipated worldwide economic conditions, both in general and specifically in relation to the hybrid and electric vehicle markets, the results of which form the basis for making judgments about the carrying values of assets and liabilities that are not readily apparent from other sources. Actual results may differ from these estimates under different assumptions or conditions.
Our significant accounting policies are described in Note 2 to the consolidated financial statements included in Item 8 of this Form 10-K. We believe the following critical accounting policies necessitated that significant judgments and estimates be used in the preparation of its consolidated financial statements. We have reviewed these policies with our Audit Committee.
Revenue Recognition — We generally recognizes revenue at the time of shipment when title and risk of loss have passed to the customer, persuasive evidence of an arrangement exists, performance of our obligation is complete, our price to the buyer is fixed or determinable, and we are reasonably assured of collection. If a loss is anticipated on any contract, a provision for the entire loss is made immediately. Determination of these criteria, in some cases, requires management’s judgment. Should changes in conditions cause management to determine that these criteria are not met for certain future transactions, revenue for any reporting period could be adversely affected.
18
Table of Contents
The Company also recognizes engineering and construction contract revenues using the percentage-of-completion method, based primarily on contract costs incurred to date compared with total estimated contract costs. Customer-furnished materials, labor, and equipment, and in certain cases subcontractor materials, labor, and equipment, are included in revenues and cost of revenues when management believes that the company is responsible for the ultimate acceptability of the project. Contracts are segmented between types of services, such as engineering and construction, and accordingly, gross margin related to each activity is recognized as those separate services are rendered.
Changes to total estimated contract costs or losses, if any, are recognized in the period in which they are determined. Claims against customers are recognized as revenue upon settlement. Revenues recognized in excess of amounts billed are classified as current assets under contract work-in-progress. Amounts billed to clients in excess of revenues recognized to date are classified as current liabilities on contracts.
Changes in project performance and conditions, estimated profitability, and final contract settlements may result in future revisions to engineering and development contract costs and revenue.
Warranty — The Company provides product warranties for specific product lines and accrues for estimated future warranty costs in the period in which revenue is recognized. Our products are generally warranted to be free of defects in materials and workmanship for a period of 12 to 24 months from the date of installation, subject to standard limitations for equipment that has been altered by other than Enova Systems personnel and equipment which has been subject to negligent use. Warranty provisions are based on past experience of product returns, number of units repaired and our historical warranty incidence over the past twenty-four month period. The warranty liability is evaluated on an ongoing basis for adequacy and may be adjusted as additional information regarding expected warranty costs becomes known.
Allowance for doubtful accounts — The allowance for doubtful accounts is the Company’s best estimate of the amount of probable credit losses in the Company’s existing accounts receivable; however, changes in circumstances relating to accounts receivable may result in a requirement for additional allowances in the future. Past due balances over 90 days and other higher risk amounts are reviewed individually for collectibility. If the financial condition of the Company’s customers were to deteriorate resulting in an impairment of their ability to make payment, additional allowances may be required. In addition, the Company maintains a general reserve for all invoices by applying a percentage based on the age category. Account balances are charged against the allowance after all collection efforts have been exhausted and the potential for recovery is considered remote.
Inventory — Inventories include material, labor, and manufacturing overhead are priced at the lower of cost or market utilizing the first-in, first-out (FIFO) cost flow assumption. We maintain a perpetual inventory system and continuously record the quantity on-hand and standard cost for each product, including purchased components, subassemblies and finished goods. We maintain the integrity of perpetual inventory records through periodic physical counts of quantities on hand (i.e., cycle counts). Finished goods are reported as inventories until the point of transfer to the customer. Generally, title transfer is documented in the terms of sale.
Inventory reserve — We maintain an allowance against inventory for the potential future obsolescence or excess inventory. A substantial decrease in expected demand for our products, or decreases in our selling prices could lead to excess or overvalued inventories and could require us to substantially increase our allowance for excess inventory. If future customer demand or market conditions are less favorable than our projections, additional inventory write-downs may be required and would be reflected in cost of revenues in the period the revision is made.
Property and Equipment — Property and equipment are stated at cost and depreciated over the estimated useful lives of the related assets, which range from three to seven years using the straight-line method for financial statement purposes. The Company uses other depreciation methods (generally, accelerated depreciation methods) for tax purposes where appropriate. Amortization of leasehold improvements is computed using the straight-line method over the shorter of the remaining lease term or the estimated useful lives of the improvements.
Repairs and maintenance are expensed as incurred. Expenditures that increase the value or productive capacity of assets are capitalized. When property and equipment are retired, sold, or otherwise disposed of, the asset’s cost and related accumulated depreciation are removed from the accounts and any gain or loss is included in operations.
Impairment of Long-Lived Assets — The Company reviews the carrying value of property and equipment for impairment whenever events and circumstances indicate that the carrying value of an asset may not be recoverable from the estimated future cash flows expected to result from its use and eventual disposition. In cases where undiscounted expected future cash flows are less than the
19
Table of Contents
carrying value, an impairment loss is recognized equal to an amount by which the carrying value exceeds the fair value of assets. The factors considered by management in performing this assessment include current operating results, trends, and prospects, as well as the effects of obsolescence, demand, competition, and other economic factors. Long-lived assets that management commits to sell or abandon are reported at the lower of carrying amount or fair value less cost to sell.
Stock-Based Compensation — The Company measures and recognizes compensation expense for all share-based payment awards made to employees and directors, including employee stock options based on the estimated fair values at the date of grant. The compensation expense is recognized over the requisite service period.
The Company’s determination of estimated fair value of share-based awards utilizes the Black-Scholes option-pricing model. The Black-Scholes model is affected by the Company’s stock price as well as assumptions regarding certain highly complex and subjective variables. These variables include, but are not limited to; the Company’s expected stock price volatility over the term of the awards as well as actual and projected employee stock option exercise behaviors.
Deferred Income Taxes — We evaluate the need for a valuation allowance to reduce our deferred tax assets to the amount that is more likely than not to be realized. We have considered future taxable income and ongoing prudent and feasible tax planning strategies in assessing the need for a valuation allowance. We determined that we may not be able to realize all or part of its net deferred tax asset in the future, thus a full valuation allowance was recorded against our deferred tax assets.
These accounting policies were applied consistently for all periods presented. Our operating results would be affected if other alternatives were used. Information about the impact on our operating results is included in the footnotes to our financial statements.
Research and Development — Research, development, and engineering costs are expensed in the period incurred. Costs of significantly altering existing technology are expensed as incurred.
Recent Accounting Pronouncements
In May of 2011, the FASB issued ASU 2011-04, “Amendments to Achieve Common Fair Value Measurement and Disclosure Requirements in U. S. GAAP & IFRS,” which results in common fair value measurement and disclosure requirements in U.S. GAAP and IFRS. Consequently, the amendments change the wording used to describe many of the requirements in U.S. GAAP for measuring fair value and for disclosing information about fair value measurements. ASU 2011-04 is effective for interim and annual periods beginning after December 15, 2011. The future adoption of ASU 2011-04 is not expected to have a material impact on the Company’s consolidated financial statements.
In June 2011, the FASB issued ASU No. 2011-05, Presentation of Comprehensive Income. This standard eliminates the current option to report other comprehensive income and its components in the statement of changes in equity. The standard is intended to enhance comparability between entities that report under US GAAP and those that report under IFRS, and to provide a more consistent method of presenting non-owner transactions that affect an entity’s equity. Under the ASU, an entity can elect to present items of net income and other comprehensive income in one continuous statement, referred to as the statement of comprehensive income, or in two separate, but consecutive, statements. Each component of net income and each component of other comprehensive income, together with totals for comprehensive income and its two parts, net income and other comprehensive income, would need to be displayed under either alternative. The statement(s) would need to be presented with equal prominence as the other primary financial statements. The ASU does not change items that constitute net income and other comprehensive income, when an item of other comprehensive income must be reclassified to net income or the earnings-per-share computation (which will continue to be based on net income). The new US GAAP requirements are effective for public entities as of the beginning of a fiscal year that begins after December 15, 2011 and interim and annual periods thereafter. Early adoption is permitted, but full retrospective application is required under the accounting standard. The Company does not expect that the adoption of this standard will have a material impact on our results of operations, cash flows, and financial position.
In December 2011, the FASB issued ASU No. 2011-12, Deferral of Effective Date for Amendments to the Presentation of Reclassifications of Items Out of Accumulated Other Comprehensive Income in ASU 2011-05, which defers the requirement in ASU No. 2011-05 that companies’ present reclassification adjustments for each component of accumulated other comprehensive income. All other requirements of ASU No. 2011-05 remain unchanged.
20
Table of Contents
Results of Operations
Years Ended December 31, 2011 and 2010
Net Revenues. Net revenues were $6,622,000 for the year ended December 31, 2011, representing a decrease of $1,950,000 or 23% from net revenues of $8,572,000 during the same period in 2010. Revenues in the current year benefited from fulfillment of major orders from Smith Electric Vehicles, Freightliner and Navistar Inc. in the first half of 2011. In the second half of 2011, revenues decreased due to tightened government and school district budgets resulting in decreased demand for vehicles of our major customers’ vehicles. Smith Electric Vehicles, Navistar, FAW and HCATT comprised 52%, 16%, 16% and 10% of our 2011 revenues, respectively. In the prior year, Smith Electric Vehicles, Navistar and FAW comprised 45%, 26% and 14% of our 2010 revenues, respectively. The Company continued its strategy to concentrate support to core customers in 2011 in our migration to a first tier production company, recording sales with several OEMs, including Freightliner and Smith Electric Vehicles in the United States and FAW in China. Although we have seen indications for future production growth, there can be no assurance there will be continuing demand for our products and services.
Cost of Revenues. Cost of revenues were $6,364,000 for the year ended December 31, 2011, compared to $7,159,000 for the year ended December 31, 2010, representing a decrease of $795,000, or 11%. Cost of revenues decreased in 2011 compared to the same period in the prior year primarily due to the decrease in revenue. In addition, cost of revenues was affected by charges to increase inventory reserve associated with certain obsolete parts. Cost of revenues consists of component and material costs, direct labor costs, integration costs and overhead related to manufacturing our products as well as warranty accruals and inventory valuation reserve amounts. Product development costs incurred in the performance of engineering development contracts for the U.S. Government and private companies are charged to cost of sales. Our customers continue to require additional integration and support services to customize, integrate and evaluate our products. We believe that a portion of these costs are initial, one-time costs for these customers and anticipate similar costs to be incurred with respect to new customers as we pursue a greater market share. Typically we do not incur these same types of costs for customers who have been using our products for over one year.
Gross Margin. The gross margin for the year ended December 31, 2011 was 3.9% compared to 16.5% in the prior year, a decrease of 12.6 percentage points. The decrease in gross margin is primarily attributable to lower production volumes, to a change in product mix towards lower profitability components, to charges to increase the inventory reserve in the fourth quarter of 2011 associated with certain obsolete parts as well as charges to the warranty reserve due to higher than anticipated warranty claims. We continued our focus on key customer production contracts, maturity of our supply chain, and efficiencies gained through focus on manufacturing and inventory processes to tighten controls over production costs. As we make deliveries on production contracts in 2012, we expect to achieve benefit from these initiatives, although we may continue to experience variability in our gross margin.
Research and Development Expenses. Research and development expenses consist primarily of personnel, facilities, equipment and supplies for our research and development activities. Non-funded development costs are reported as research and development expense. Research and development expenses during the year ended December 31, 2011 were $2,039,000 compared to $1,838,000 for the same period in 2010, an increase of $201,000 or approximately 11%. R&D costs were higher in 2011 as we continued to devote engineering personnel resources to the development of our next generation Omni motor control unit, charger and DC/DC converter. In addition, we focused effort into integration of new electric motors into our system, which culminated in our entering into a formal supply agreement with Remy Corporation in March 2012. We also continued to allocate necessary resources to the development and testing of upgraded proprietary control software, new battery technologies and internal development of automated testing equipment. We intend to continue to research and develop new technologies and products, both internally and in conjunction with our alliance partners and other manufacturers as we deem beneficial to our global growth strategy.
Selling, General and Administrative Expenses. Selling, general and administrative expenses consist primarily of sales and marketing costs, including consulting fees and expenses for travel, promotional activities and personnel and related costs for the quality and field service functions and general corporate functions, including finance, strategic and business development, human resources, IT, accounting reserves and legal costs. Selling, general and administrative expenses decreased by $1,483,000, or 23%, during the year ended December 31, 2011 to $5,075,000 from $6,558,000 in the prior year, primarily due to decreases in headcount which in turn resulted in reduced personnel expenses, and decreases in incentive bonuses and share-based compensation charges.
Interest and Other Income (Expense). For the year ended December 31, 2011, interest and other expense was $128,000, a decrease of $309,000 or 71%, from an expense of $437,000 in 2010. The primary reason for the decrease is due to our recording a charge of approximately $328,000 in 2010 for partial settlement of litigation with Arens, as detailed in Item 3 – Legal Proceedings of this Form 10-K.
21
Table of Contents
Liquidity and Capital Resources
We have experienced losses primarily attributable to research, development, marketing and other costs associated with our strategic plan as an international developer and supplier of electric drive and power management systems and components. Historically cash flows from operations have not been sufficient to meet our obligations and we have had to raise funds through several financing transactions. At least until we reach breakeven volume in sales and develop and/or acquire the capability to manufacture and sell our products profitably, we will need to continue to rely on cash from external financing sources. Our operations during the year ended December 31, 2011 were financed by product sales, working capital reserves and an equity offering in December 2011 that resulted in net proceeds of $1,245,000. As of December 31, 2011, the Company had $3,096,000 of cash and cash equivalents and short term investments.
On June 30, 2010, the Company entered into a secured a revolving credit facility with a financial institution for $200,000 which was secured by a $200,000 certificate of deposit. The facility is for a period of 3 years and 6 months from July 1, 2010 to December 31, 2013. The interest rate on a drawdown from the facility is the certificate of deposit rate plus 1.25% with interest payable monthly and the principal due at maturity. The financial institution also renewed the $200,000 irrevocable letter of credit for the full amount of the credit facility in favor of Sunshine Distribution LP, with respect to the lease of the Company’s corporate headquarters at 1560 West 190th Street, Torrance, California.
Net cash used in operating activities was $6,302,000 for the year ended December 31, 2011, compared to $4,319,000 for the year ended December 31, 2010. Cash used in operating activities was primarily affected by the cost of revenue, R&D, personnel and general operating costs, which were partially mitigated by our utilization of existing inventory balances to fulfill customer orders in 2011. Non-cash items included expenses for stock-based compensation, depreciation and amortization, inventory reserve, impairment loss, loss on litigation settlement, reserve for doubtful accounts and issuance of common stock for services.
Net cash used in investing activities was $275,000 for the year ended December 31, 2011, compared to net cash used of $317,000 for the year ended December 31, 2010. In 2011 and 2010, investing activities consisted of capital expenditures expended mainly for the acquisition and integration of test vehicles and for test equipment utilized in R&D and production.
Net cash provided from financing activities totaled $1,242,000 for the year ended December 31, 2011, compared to net cash used in financing activities of $11,000 for the year ended December 31, 2010. Financing activities in 2011 were primarily attributable to a private offering of common stock. We sold 11,250,000 shares of common stock at $0.15 per share to certain accredited investors, resulting in gross proceeds of $1,687,500 and net proceeds of $1,245,000 after costs related to the equity raise. In 2010, net cash used in financing activities was attributable to proceeds from stock options and payments made on notes payable agreements.
The Company maintained the same certificate of deposit with Union Bank with a balance of $200,000 in 2011 and 2010, which is used to secure a credit facility.
Accounts receivable decreased by $2,091,000, or 73%, to $759,000 as of December 31, 2011 from $2,850,000 as of December 31, 2010. The decrease in receivables as of December 31, 2011 as compared to the prior year end is attributable to normal collections of receivables and the reduction in sales volume. In addition, receivables increased as of December 31, 2010 due to the fulfillment of several large shipments to Smith Electric Vehicles, Navistar and FAW in the fourth quarter of 2010, which were collected during 2011.
Inventory decreased by $419,000, or 9%, from $4,455,000 as of December 31, 2010 to $4,036,000 as of December 31, 2011. The decrease resulted from net inventory activity made up of receipts of $4,476,000, which included approximately $1,200,000 received in the first quarter in connection with the Arens litigation settlement, consumption of $4,050,000 from sales, research and development, and warranty utilization, and an inventory reserve charge of $845,000 primarily attributable to increases in the reserve on obsolete inventory.
Prepaid expenses and other current assets decreased by $240,000, or approximately 50%, to $242,000 as of December 31, 2011 from a balance of $482,000 as of December 31, 2010. The decrease was primarily attributable to decreases in the deposits made to vendors for certain purchase orders as purchased inventory was received in the first half of 2011.
Long term accounts receivable decreased by $21,000, or 21%, to $79,000 as of December 31, 2011 compared to $100,000 at December 31, 2010. The Company agreed to defer collection of accounts receivable as requested by a customer for the term of the Company’s warranty period. The Company has remedied all past and current warranty claims and anticipates full collection of the receivable.
22
Table of Contents
Property and equipment decreased by $244,000 or approximately 21%, net of accumulated depreciation, to $928,000 as of December 31, 2011 from a balance of $1,172,000 as of December 31, 2010. The decrease was primarily due to recording of depreciation expense during 2011 and due to fewer additions to fixed assets in 2011 compared to 2010. For the year ended December 31, 2011, the Company recognized depreciation expense of $495,000 and recorded additions to fixed assets totaling $300,000.
Accounts payable decreased by $1,493,000, or approximately 81%, to $354,000 at December 31, 2011 from $1,847,000 at December 31, 2010. The decrease was primarily due to payments in 2011 for inventory purchases made in 2010 in support of customer sales in the fourth quarter of 2010 and first quarter of 2011.
Deferred revenue increased by $289,000, or approximately 932%, to $320,000 as of December 31, 2011 from $31,000 as of December 31, 2010. The balance at December 31, 2011 is anticipated to be realized into revenue in the first half of 2012, and is associated with prepayments on purchases orders from certain customers.
Accrued payroll and related expenses decreased by $656,000, or 71%, to $266,000 as of December 31, 2011 from $922,000 at December 31, 2010. The change is primarily due to the accrual in 2010 of executive incentive and employee bonuses which were paid in 2011 and decreases in accrued payroll and accrued vacation balances as of December 31, 2011 compared to the same period in 2010 due to a decrease in employee headcount in the second half of 2011.
Other accrued liabilities decreased by $1,222,000, or 70%, to $517,000 at December 31, 2011 from $1,739,000 at December 31, 2010. The decrease was primarily due to payments made in January 2011 for losses accrued in 2010 on the partial litigation settlement with Arens Controls Company L.L.C. in January 2011 and other payments made during 2011 for professional services accrued in 2010. In addition, the accrued warranty balance at December 31, 2011 compared to December 31, 2010 decreased as costs for warranty repairs were greater than warranty accruals for sales during 2011.
Accrued interest increased by $81,000, or 7%, to $1,237,000 at December 31, 2011 from $1,156,000 at December 31, 2010. The majority of the increase is associated with the interest accrued on the $1.2 million note due the Credit Managers Association of California.
Going concern
Our ongoing operations and anticipated growth will require us to make necessary investments in human and production resources, regulatory compliance, as well as sales and marketing efforts. We do not currently have adequate internal liquidity to meet these objectives in the long term. To do so, we will need to continue to look for partnering opportunities and other external sources of liquidity, including the public and private financial markets and strategic partners. We may not be able to obtain financing arrangements in amounts or on terms acceptable to us in the future. In the event we are unable to obtain additional financing when needed, and without substantial reductions in development programs and strategic initiatives, we do not expect that our cash and cash equivalents and short-term investments will be sufficient to fund our operating and capital needs for the twelve months following December 31, 2011. As of December 31, 2011, we had an accumulated deficit of approximately $151.1 million, working capital of approximately $6.8 million and total shareholders’ equity of approximately $5.3 million.
In October 2011, we launched an expense reduction program designed to improve our cost structure and to deliver improved operational growth, which included reductions in our employee headcount. We did not incur any significant restructuring charges as a result of this cost reduction program, which was completed by the end of 2011.
In December 2011, we successfully raised approximately $1,245,000, net of financing costs of $442,500 through an equity issuance to certain accredited investors. See Note 11 – Stockholders’ Equity for further analysis of the equity issuance. The Company continues to pursue other options to raise additional capital fund continuing operations; however, there can be no assurance that we can successfully raise additional funds through the capital markets.
Off-Balance Sheet Arrangements
Other than contractual obligations incurred in the normal course of business, we do not have any off-balance sheet financing arrangements or liabilities.
23
Table of Contents
| ITEM 7A. | QUANTITATIVE AND QUALITATIVE DISCLOSURES ABOUT MARKET RISK |
Not applicable.
24
Table of Contents
| ITEM 8. | FINANCIAL STATEMENTS AND SUPPLEMENTARY DATA |
ENOVA SYSTEMS, INC.
CONTENTS
December 31, 2011 and 2010
| Page | ||
| 26 | ||
| 27 | ||
| 27 | ||
| 28 | ||
| 29 | ||
| 30 | ||
| 31 |
25
Table of Contents
REPORT OF INDEPENDENT REGISTERED PUBLIC ACCOUNTING FIRM
To the Board of Directors and Stockholders
of Enova Systems, Inc.:
We have audited the accompanying balance sheets of Enova Systems, Inc. (the Company) as of December 31, 2011 and 2010, and the related statements of operations, stockholders’ equity and cash flows for each of the years in the two-year period ended December 31, 2011. Enova Systems, Inc.’s management is responsible for these financial statements. Our responsibility is to express an opinion on these financial statements based on our audits.
We conducted our audits in accordance with the standards of the Public Company Accounting Oversight Board (United States). Those standards require that we plan and perform the audits to obtain reasonable assurance about whether the financial statements are free of material misstatement. The company is not required to have, nor were we engaged to perform, an audit of its internal control over financial reporting. Our audits included consideration of internal control over financial reporting as a basis for designing audit procedures that are appropriate in the circumstances, but not for the purpose of expressing an opinion on the effectiveness of the company’s internal control over financial reporting. Accordingly, we express no such opinion. An audit also includes examining, on a test basis, evidence supporting the amounts and disclosures in the financial statements, assessing the accounting principles used and significant estimates made by management, as well as evaluating the overall financial statement presentation. We believe that our audits provide a reasonable basis for our opinion
In our opinion, the financial statements referred to above present fairly, in all material respects, the financial position of Enova Systems, Inc. as of December 31, 2011 and 2010, and the results of its operations and its cash flows for each of the years in the two-year period ended December 31, 2011 in conformity with accounting principles generally accepted in the United States of America.
The accompanying financial statements have been prepared assuming that the Company will continue as a going concern. As discussed in Note 1 to the financial statements, the Company has suffered recurring losses from operations, decline in sales, and has a need for a substantial additional capital investment, all of which raise substantial doubt about its ability to continue as a going concern. Management’s plans in regard to these matters are also described in Note 1. The financial statements do not include any adjustments that might result from the outcome of this uncertainty.
/s/ PMB Helin Donovan, LLP
PMB Helin Donovan, LLP
San Francisco, California
March 29, 2012
26
Table of Contents
BALANCE SHEETS
| December 31, | ||||||||
| 2011 | 2010 | |||||||
| ASSETS |
||||||||
| Current assets: |
||||||||
| Cash and cash equivalents |
$ | 3,096,000 | $ | 8,431,000 | ||||
| Certificate of deposit, restricted |
200,000 | 200,000 | ||||||
| Accounts receivable, net |
759,000 | 2,850,000 | ||||||
| Inventories and supplies, net |
4,036,000 | 4,455,000 | ||||||
| Prepaid expenses and other current assets |
242,000 | 482,000 | ||||||
|
|
|
|
|
|||||
| Total current assets |
8,333,000 | 16,418,000 | ||||||
| Long term accounts receivable |
79,000 | 100,000 | ||||||
| Property and equipment, net |
928,000 | 1,172,000 | ||||||
|
|
|
|
|
|||||
| Total assets |
$ | 9,340,000 | $ | 17,690,000 | ||||
|
|
|
|
|
|||||
| LIABILITIES AND STOCKHOLDERS’ EQUITY |
||||||||
| Current liabilities: |
||||||||
| Accounts payable |
$ | 354,000 | $ | 1,847,000 | ||||
| Deferred revenues |
320,000 | 31,000 | ||||||
| Accrued payroll and related expenses |
266,000 | 922,000 | ||||||
| Other accrued liabilities |
517,000 | 1,739,000 | ||||||
| Current portion of notes payable |
62,000 | 63,000 | ||||||
|
|
|
|
|
|||||
| Total current liabilities |
1,519,000 | 4,602,000 | ||||||
| Accrued interest payable |
1,237,000 | 1,156,000 | ||||||
| Notes payable, net of current portion |
1,286,000 | 1,286,000 | ||||||
|
|
|
|
|
|||||
| Total liabilities |
4,042,000 | 7,044,000 | ||||||
|
|
|
|
|
|||||
| Stockholders’ equity: |
||||||||
| Series A convertible preferred stock — no par value, 30,000,000 shares authorized; 2,642,000 and 2,652,000 shares issued and outstanding; liquidating preference at $0.60 per share as of December 31, 2011 and December 31, 2010, respectively |
528,000 | 530,000 | ||||||
| Series B convertible preferred stock — no par value, 5,000,000 shares authorized; 546,000 shares issued and outstanding; liquidating preference at $2 per share as of December 30, 2011 and December 31, 2010 |
1,094,000 | 1,094,000 | ||||||
| Common Stock — no par value, 750,000,000 shares authorized; 42,765,000 and 31,479,000 shares issued and outstanding as of December 31, 2011 and December 31, 2010, respectively |
145,380,000 | 144,110,000 | ||||||
| Additional paid-in capital |
9,408,000 | 9,040,000 | ||||||
| Accumulated deficit |
(151,112,000) | (144,128,000) | ||||||
|
|
|
|
|
|||||
| Total stockholders’ equity |
5,298,000 | 10,646,000 | ||||||
|
|
|
|
|
|||||
| Total liabilities and stockholders’ equity |
$ | 9,340,000 | $ | 17,690,000 | ||||
|
|
|
|
|
|||||
The accompanying notes are an integral part of these financial statements.
27
Table of Contents
STATEMENTS OF OPERATIONS
| For the Years
Ended December 31, |
||||||||
| 2011 | 2010 | |||||||
| Revenues |
$ | 6,622,000 | $ | 8,572,000 | ||||
| Cost of revenues |
6,364,000 | 7,159,000 | ||||||
|
|
|
|
|
|||||
| Gross income |
258,000 | 1,413,000 | ||||||
|
|
|
|
|
|||||
| Operating expenses |
||||||||
| Research and development |
2,039,000 | 1,838,000 | ||||||
| Selling, general & administrative |
5,075,000 | 6,558,000 | ||||||
|
|
|
|
|
|||||
| Total operating expenses |
7,114,000 | 8,396,000 | ||||||
|
|
|
|
|
|||||
| Operating loss |
(6,856,000 | ) | (6,983,000 | ) | ||||
|
|
|
|
|
|||||
| Other income and (expense) |
||||||||
| Interest and other income (expense) |
(128,000 | ) | (437,000 | ) | ||||
|
|
|
|
|
|||||
| Total other income and (expense) |
(128,000 | ) | (437,000 | ) | ||||
|
|
|
|
|
|||||
| Net loss |
$ | (6,984,000 | ) | $ | (7,420,000 | ) | ||
|
|
|
|
|
|||||
| Basic and diluted loss per share |
$ | (0.22 | ) | $ | (0.24 | ) | ||
|
|
|
|
|
|||||
| Weighted average number of common shares outstanding |
31,537,000 | 31,422,000 | ||||||
|
|
|
|
|
|||||
The accompanying notes are an integral part of these financial statements.
28
Table of Contents
STATEMENTS OF STOCKHOLDERS’ EQUITY
| Convertible Preferred Stock | Common Stock | Additional Paid-in Capital |
Accumulated Deficit |
Total Stockholders’ Equity |
||||||||||||||||||||||||||||||||
| Series A | Series B | |||||||||||||||||||||||||||||||||||
| Shares | Amount | Shares | Amount | Shares | Amount | |||||||||||||||||||||||||||||||
| Balance, December 31, 2009 |
2,652,000 | $ | 530,000 | 546,000 | $ | 1,094,000 | 31,404,000 | $ | 143,995,000 | $ | 8,336,000 | $ | (136,708,000 | ) | $ | 17,247,000 | ||||||||||||||||||||
|
|
|
|
|
|
|
|
|
|
|
|
|
|
|
|
|
|
|
|||||||||||||||||||
| Issuance of common stock upon exercise of stock options |
50,000 | 20,000 | 20,000 | |||||||||||||||||||||||||||||||||
| Issuance of common stock for employee services |
25,000 | 95,000 | 95,000 | |||||||||||||||||||||||||||||||||
| Stock option expense |
704,000 | 704,000 | ||||||||||||||||||||||||||||||||||
| Net loss |
(7,420,000 | ) | (7,420,000 | ) | ||||||||||||||||||||||||||||||||
|
|
|
|
|
|
|
|
|
|
|
|
|
|
|
|
|
|
|
|||||||||||||||||||
| Balance, December 31, 2010 |
2,652,000 | $ | 530,000 | 546,000 | $ | 1,094,000 | 31,479,000 | $ | 144,110,000 | $ | 9,040,000 | $ | (144,128,000 | ) | $ | 10,646,000 | ||||||||||||||||||||
|
|
|
|
|
|
|
|
|
|
|
|
|
|
|
|
|
|
|
|||||||||||||||||||
| Issuance of common stock for cash |
11,250,000 | $ | 1,245,000 | $ | 1,245,000 | |||||||||||||||||||||||||||||||
| Issuance of common stock upon exercise of stock options |
36,000 | 23,000 | 23,000 | |||||||||||||||||||||||||||||||||
| Issuance of common stock upon conversion of preferred stock | (10,000) | (2,000) | - | 2,000 | - | |||||||||||||||||||||||||||||||
| Stock option expense |
368,000 | 368,000 | ||||||||||||||||||||||||||||||||||
| Net loss |
(6,984,000 | ) | (6,984,000 | ) | ||||||||||||||||||||||||||||||||
|
|
|
|
|
|
|
|
|
|
|
|
|
|
|
|
|
|
|
|||||||||||||||||||
| Balance, December 31, 2011 |
2,642,000 | $ | 528,000 | 546,000 | $ | 1,094,000 | 42,765,000 | $ | 145,380,000 | $ | 9,408,000 | $ | (151,112,000 | ) | $ | 5,298,000 | ||||||||||||||||||||
|
|
|
|
|
|
|
|
|
|
|
|
|
|
|
|
|
|
|
|||||||||||||||||||
The accompanying notes are an integral part of these financial statements.
29
Table of Contents
STATEMENTS OF CASH FLOWS
| For the Years
Ended December 31 |
||||||||
| Cash flows from operating activities: |
2011 | 2010 | ||||||
| Net loss |
$ | (6,984,000) | $ | (7,420,000) | ||||
| Adjustments to reconcile net loss to net cash used in operating activities: |
||||||||
| Reserve for doubtful accounts |
71,000 | - | ||||||
| Inventory reserve |
845,000 | 232,000 | ||||||
| Depreciation and amortization |
495,000 | 539,000 | ||||||
| Loss on asset disposal |
49,000 | - | ||||||
| Loss on asset impairment |
- | 55,000 | ||||||
| Loss on litigation settlement |
41,000 | 328,000 | ||||||
| Issuance of common stock for employee services |
- | 95,000 | ||||||
| Stock option expense |
368,000 | 704,000 | ||||||
| (Increase) decrease in: |
||||||||
| Accounts receivable |
2,020,000 | (1,408,000) | ||||||
| Inventory and supplies |
(426,000) | 918,000 | ||||||
| Prepaid expenses and other current assets |
240,000 | (219,000) | ||||||
| Long term accounts receivable |
21,000 | (100,000) | ||||||
| Increase (decrease) in: |
||||||||
| Accounts payable |
(1,493,000) | 1,432,000 | ||||||
| Deferred revenues |
289,000 | (326,000) | ||||||
| Accrued payroll and related expense |
(656,000) | 645,000 | ||||||
| Other accrued liabilities |
(1,263,000) | 124,000 | ||||||
| Accrued interest payable |
81,000 | 82,000 | ||||||
|
|
|
|
|
|||||
| Net cash used in operating activities |
(6,302,000) | (4,319,000) | ||||||
|
|
|
|
|
|||||
| Cash flows from investing activities: |
||||||||
| Purchases of property and equipment |
(275,000) | (317,000) | ||||||
|
|
|
|
|
|||||
| Net cash used in investing activities |
(275,000) | (317,000) | ||||||
|
|
|
|
|
|||||
| Cash flows from financing activities: |
||||||||
| Payment on notes payable |
(26,000) | (31,000) | ||||||
| Net proceeds from the exercise of stock options |
23,000 | 20,000 | ||||||
| Net proceeds from the issuance of common stock |
1,245,000 | - | ||||||
|
|
|
|
|
|||||
| Net cash provided by (used in) financing activities |
1,242,000 | (11,000) | ||||||
|
|
|
|
|
|||||
| Net decrease in cash and cash equivalents |
(5,335,000) | (4,647,000) | ||||||
| Cash and cash equivalents, beginning of period |
8,431,000 | 13,078,000 | ||||||
|
|
|
|
|
|||||
| Cash and cash equivalents, end of period |
$ | 3,096,000 | $ | 8,431,000 | ||||
|
|
|
|
|
|||||
| Supplemental disclosure of cash flow information: |
||||||||
|
|
|
|
|
|||||
| Interest paid |
$ | 6,000 | $ | 5,000 | ||||
|
|
|
|
|
|||||
| Assets acquired through financing arrangements |
$ | 25,000 | $ | 26,000 | ||||
|
|
|
|
|
|||||
The accompanying notes are an integral part of these financial statements.
30
Table of Contents
NOTES TO FINANCIAL STATEMENTS
1. Description of Business
General
Enova Systems, Inc., (the “Company”), is a California corporation that develops, designs and produces drive systems and related components for electric, hybrid electric, and fuel cell systems for mobile applications. The Company retains development and manufacturing rights to many of the technologies created, whether such research and development is internally or externally funded. The Company sells drive systems and related components in the United States, Asia and Europe.
Liquidity
The accompanying consolidated financial statements have been prepared assuming that the Company will continue as a going concern. The Company has sustained recurring losses and negative cash flows from operations. Management believes that the Company’s losses in recent years have primarily resulted from a combination of insufficient product and service revenue to support the Company’s skilled and diverse technical staff believed to be necessary to support exploitation of the Company’s technologies. Historically, the Company’s growth and working capital needs have been funded through a combination of private and public equity offerings, debt and lease financing. During 2011, the Company’s growth and working capital needs have been funded primarily through a combination of product sales, existing cash reserves and equity financing. As of December 31, 2011, the Company had approximately $3.1 million of cash and cash equivalents. At December 31, 2011, the Company had net working capital of approximately $6.8 million as compared to $11.8 million at December 31, 2010, representing a decrease of $5.0 million.
Management is focused on managing costs in line with estimated total revenue, including contingencies for cost reductions if projected revenue is not fully realized. However, there can be no assurance that anticipated revenue will be realized or that the Company will successfully implement its plans. Management implemented measures to conserve cash, including a reduced employee headcount in the fourth quarter of 2011, and stringent controls over inventory purchases and administrative expenses. The Company will continue to conserve available cash by closely scrutinizing expenditures and extensively utilizing current inventory for sales during 2012. The Company may need to raise additional capital to accomplish all of its business objectives over the next year. In addition, the Company may in the future selectively pursue possible acquisitions of businesses, technologies, content, or products complementary to those of the Company in order to expand its presence in the marketplace and achieve operating efficiencies. The Company can make no assurance with respect to either the availability or terms of such financing and capital when it may be required.
Going Concern
The Company has experienced and continues to experience operating losses and negative cash flows from operations, as well as an ongoing requirement for substantial additional capital investment. At December 31, 2011, the Company had an accumulated deficit of approximately $151.1 million, working capital of approximately $6.8 million and shareholders’ equity of approximately $5.3 million. Over the past years, the Company has been funded through a combination of debt, lease financing and public equity offerings. As of December 31, 2011, the Company had approximately $3.1 million in cash and cash equivalents.
The Company expects that it will need to raise additional capital to fully pursue its business plan over the long term and is currently pursuing a variety of funding options. There can be no assurance as to the availability or terms upon which such financing and capital might be available. If the Company is not successful in its efforts to raise additional funds, the Company may be required to delay, reduce the scope of, or eliminate one or more of its development programs. Without substantial reductions or eliminations of its development programs, the Company does not expect that its cash and cash equivalents will be sufficient to fund its operating and capital needs for the twelve months following December 31, 2011. In October 2011, we launched an expense reduction program designed to improve our cost structure and to deliver improved operational growth, which included reductions in our employee headcount. We did not incur any significant restructuring charges as a result of this cost reduction program, most of which was completed by the end of 2011.
In December 2011, we successfully raised approximately $1,245,000, net of financing costs of $442,500, through an equity issuance to certain accredited investors. See Note 11 – Stockholders’ Equity for further analysis of the equity issuance. The Company continues to pursue other options to raise additional capital fund continuing operations; however, there can be no assurance that we can successfully raise additional funds through the capital markets.
The accompanying financial statements have been prepared on a going concern basis, which contemplates the realization of assets and the satisfaction of liabilities in the normal course of business. The accompanying financial statements do not include any adjustments relating to the recoverability of assets and classification of liabilities that might be necessary should the Company be unable to continue as a going concern.
31
Table of Contents
2. Summary of Significant Accounting Policies
Basis of Presentation
These financial statements have been prepared in accordance with accounting principles generally accepted in the United States.
Reclassifications
Certain amounts in the prior year have been reclassified to conform to the current year presentation. This change in classification does not affect previously reported cash flows from operating or financing activities in the Company’s previously reported Statements of Cash Flows, or the Company’s previously reported Statements of Operations for any period.
Revenue Recognition
The Company manufactures proprietary products and other products based on design specifications provided by its customers.
The Company recognizes revenue only when all of the following criteria have been met:
| • | Persuasive evidence of an arrangement exists; |
| • | Delivery has occurred or services have been rendered; |
| • | The fee for the arrangement is fixed or determinable; and |
| • | Collectibility is reasonably assured. |
Persuasive Evidence of an Arrangement — The Company documents all terms of an arrangement in a written contract signed by the customer prior to recognizing revenue. Receipt of a customer purchase order is the primary method of determining that persuasive evidence of an arrangement exists.
Delivery Has Occurred or Services Have Been Rendered — The Company performs all services or delivers all products prior to recognizing revenue. Professional consulting and engineering services are considered to be performed when the services are complete. Equipment is considered delivered upon delivery to a customer’s designated location. In certain instances, the customer elects to take title upon shipment.
The Fee for the Arrangement is Fixed or Determinable — Prior to recognizing revenue, a customer’s fee is either fixed or determinable under the terms of the written contract. Fees professional consulting services, engineering services and equipment sales are fixed under the terms of the written contract. The customer’s fee is negotiated at the outset of the arrangement and is not subject to refund or adjustment during the initial term of the arrangement.
Collectibility is Reasonably Assured — The Company determines that collectibility is reasonably assured prior to recognizing revenue. Collectibility is assessed on a customer-by-customer basis based on criteria outlined by management. New customers are subject to a credit review process, which evaluates the customer’s financial position and ultimately its ability to pay. The Company does not enter into arrangements unless collectibility is reasonably assured at the outset. Existing customers are subject to ongoing credit evaluations based on payment history and other factors. If it is determined during the arrangement that collectibility is not reasonably assured, revenue is recognized on a cash basis. Amounts received upfront for engineering or development fees under multiple-element arrangements are deferred and recognized over the period of committed services or performance, if such arrangements require the Company to provide on-going services or performance. All amounts received under collaborative research agreements or research and development contracts are nonrefundable, regardless of the success of the underlying research.
Since some customer orders contain multiple items such as equipment and services which are delivered at varying times, the Company determines whether the delivered items can be considered separate units of accounting. Delivered items are considered separate units of accounting if delivered items have value to the customer on a standalone basis, there is objective and reliable evidence of the fair value of undelivered items, and if delivery of undelivered items is probable and substantially in the Company’s control. The recognition of revenue from milestone payments is over the remaining minimum period of performance obligation. As required, the Company evaluates its sales contract to ascertain whether multiple element agreements are present.
32
Table of Contents
The Company recognizes engineering and construction contract revenues using the percentage-of-completion method, based primarily on contract costs incurred to date compared with total estimated contract costs. Customer-furnished materials, labor, and equipment, and in certain cases subcontractor materials, labor, and equipment, are included in revenues and cost of revenues when management believes that the company is responsible for the ultimate acceptability of the project. Contracts are segmented between types of services, such as engineering and construction, and accordingly, gross margin related to each activity is recognized as those separate services are rendered. Changes to total estimated contract costs or losses, if any, are recognized in the period in which they are determined. Claims against customers are recognized as revenue upon settlement. Revenues recognized in excess of amounts billed are classified as current assets under contract work-in-progress. Amounts billed to clients in excess of revenues recognized to date are classified as current liabilities under advance billings on contracts. Changes in project performance and conditions, estimated profitability, and final contract settlements may result in future revisions to engineering and development contract costs and revenue.
Deferred Revenues
The Company recognizes revenues as earned. Amounts billed in advance of the period in which service is rendered are recorded as a liability under deferred revenues. The Company has entered into several production and development contracts with customers. The Company has evaluated these contracts, ascertained the specific revenue generating activities of each contract, and established the units of accounting for each activity. Revenue on these units of accounting is not recognized until a) there is persuasive evidence of the existence of a contract, b) the service has been rendered and delivery has occurred, c) there is a fixed and determinable price, and d) collectability is reasonable assured.
Warranty Costs
The Company provides product warranties for specific product lines and accrues for estimated future warranty costs in the period in which revenue is recognized. Our products are generally warranted to be free of defects in materials and workmanship for a period of 12 to 24 months from the date of installation, subject to standard limitations for equipment that has been altered by other than Enova Systems personnel and equipment which has been subject to negligent use. Warranty provisions are based on past experience of product returns, number of units repaired and our historical warranty incidence over the past twenty-four month period. The warranty liability is evaluated on an ongoing basis for adequacy and may be adjusted as additional information regarding expected warranty costs becomes known.
Shipping and Handling Costs
The Company includes shipping and handling costs associated with inbound and outbound freight in costs of goods sold.
Cash and Cash Equivalents
Short-term, highly liquid investments with an original maturity of three months or less are considered cash equivalents. Certificates of deposits that have a penalty for early withdrawal are excluded from cash and cash equivalents.
Certificate of deposit, restricted
The certificate of deposit, used to secure a revolving credit facility, matured on January 13, 2012 and is being renewed monthly.
Accounts Receivable and Allowance for Doubtful Accounts
Trade accounts receivable are recorded at the invoiced amount and do not bear interest. The allowance for doubtful accounts is the Company’s best estimate of the amount of probable credit losses in the Company’s existing accounts receivable; however, changes in circumstances relating to accounts receivable may result in a requirement for additional allowances in the future. Past due balances over 90 days and other higher risk amounts are reviewed individually for collectability. If the financial condition of the Company’s customers were to deteriorate resulting in an impairment of their ability to make payment, additional allowances may be required. In addition, the Company maintains a general reserve for all invoices by applying a percentage based on the age category. Account balances are charged against the allowance after all collection efforts have been exhausted and the potential for recovery is considered remote. As of December 31, 2011 and 2010, the Company maintained a reserve of $18,000 and $29,000 for doubtful accounts receivable. There was bad debt expense recorded of $71,000 in 2011 and $0 in 2010, respectively.
Inventory
Inventories and supplies are comprised of materials used in the design and development of electric, hybrid electric, and fuel cell drive systems, and other power and ongoing management and control components for production and ongoing development contracts, finished goods and work-in-progress, and is stated at the lower of cost or market utilizing the first-in, first-out (FIFO) cost flow
33
Table of Contents
assumption. The Company maintains a perpetual inventory system and continuously record the quantity on-hand and standard cost for each product, including purchased components, subassemblies and finished goods. The Company maintains the integrity of perpetual inventory records through periodic physical counts of quantities on hand. Finished goods are reported as inventories until the point of transfer to the customer. Generally, title transfer is documented in the terms of sale.
Inventory reserve
The Company maintains an allowance against inventory for the potential future obsolescence or excess inventory. A substantial decrease in expected demand for our products, or decreases in our selling prices could lead to excess or overvalued inventories and could require us to substantially increase our allowance for excess inventory. If future customer demand or market conditions are less favorable than our projections, additional inventory write-downs may be required and would be reflected in cost of revenues in the period the revision is made.
Property and Equipment
Property and equipment are stated at cost and depreciated over the estimated useful lives of the related assets, which range from three to seven years using the straight-line method for financial statement purposes. The Company uses other depreciation methods (generally, accelerated depreciation methods) for tax purposes where appropriate. Amortization of leasehold improvements is computed using the straight-line method over the shorter of the remaining lease term or the estimated useful lives of the improvements.
Repairs and maintenance are expensed as incurred. Expenditures that increase the value or productive capacity of assets are capitalized. When property and equipment are retired, sold, or otherwise disposed of, the asset’s cost and related accumulated depreciation are removed from the accounts and any gain or loss is included in operations.
Impairment of Long-Lived Assets
The Company reviews the carrying value of property and equipment for impairment whenever events and circumstances indicate that the carrying value of an asset may not be recoverable from the estimated future cash flows expected to result from its use and eventual disposition. In cases where undiscounted expected future cash flows are less than the carrying value, an impairment loss is recognized equal to an amount by which the carrying value exceeds the fair value of assets. The factors considered by management in performing this assessment include current operating results, trends, and prospects, as well as the effects of obsolescence, demand, competition, and other economic factors. Long-lived assets that management commits to sell or abandon are reported at the lower of carrying amount or fair value less cost to sell.
Impairment of Intangible Assets
The Company evaluates the recoverability of identifiable intangible assets whenever events or changes in circumstances indicate that an intangible asset’s carrying amount may not be recoverable. Such circumstances could include, but are not limited to: (1) a significant decrease in the market value of an asset, (2) a significant adverse change in the extent or manner in which an asset is used, or (3) an accumulation of costs significantly in excess of the amount originally expected for the asset. The Company measures the carrying amount of the asset against the estimated undiscounted future cash flows associated with it. Should the sum of the expected future net cash flows be less than the carrying value of the asset being evaluated, an impairment loss would be recognized. The impairment loss would be calculated as the amount by which the carrying value of the asset exceeds its fair value. The fair value is measured based on quoted market prices, if available. If quoted market prices are not available, the estimate of fair value is based on various valuation techniques, including the discounted value of estimated future cash flows. The evaluation of asset impairment requires the Company to make assumptions about future cash flows over the life of the asset being evaluated. These assumptions require significant judgment and actual results may differ from assumed and estimated amounts. For the year ended December 31, 2010, the Company recognized an impairment loss $55,000 on the book value of intangible assets with no similar expense in 2011(see Note 6).
Fair Value of Financial Instruments
The carrying amount of financial instruments, including cash and cash equivalents, certificates of deposit, accounts receivable, accounts payable and other accrued liabilities, approximate fair value due to the short maturity of these instruments. The recorded values of notes payable and long-term debt approximate their fair values, as interest approximates market rates.
34
Table of Contents
The Company defines fair value as the exchange price that would be received for an asset or paid to transfer a liability (an exit price) in the principal or most advantageous market for the asset or liability in an orderly transaction between market participants on the measurement date. At December 31, 2011 and 2010, the Company had no financial assets or liabilities periodically re-measured at fair value.
Stock-Based Compensation
The Company measures and recognizes compensation expense for all share-based payment awards made to employees and directors, including employee stock options based on the estimated fair values at the date of grant. The compensation expense is recognized over the requisite service period.
The Company’s determination of estimated fair value of share-based awards utilizes the Black-Scholes option-pricing model. The Black-Scholes model is affected by the Company’s stock price as well as assumptions regarding certain highly complex and subjective variables. These variables include, but are not limited to the Company’s expected stock price volatility over the term of the awards as well as actual and projected employee stock options exercise behaviors.
The cash flows from the tax benefits resulting from tax deductions in excess of the compensation cost recognized for those options are to be classified as financing cash flows. Due to the Company’s loss position, there were no such tax benefits for the years ended December 31, 2011 and 2010.
The Company determines the fair value of the restricted stock awards utilizing the quoted market prices of the Company’s shares on the date they were granted.
Research and Development
Research development, and engineering costs are expensed in the period incurred. Costs of significantly altering existing technology are expensed as incurred.
Income Taxes
The Company accounts for income taxes under an asset and liability approach. This process involves calculating the temporary and permanent differences between the carrying amounts of the assets and liabilities for financial reporting purposes and the amounts used for income tax purposes. The temporary differences can result in deferred tax assets and liabilities, which would be recorded on the Company’s consolidated balance sheets. The Company must assess the likelihood that its deferred tax assets will be recovered from future taxable income and, to the extent the Company believes that recovery is not likely, the Company must establish a valuation allowance. Changes in the Company’s valuation allowance in a period are recorded through the income tax provision on the consolidated statements of operations.
Uncertainty in income taxes are recognized in the Company’s financial statements based on the recognition threshold and measurement attributes for financial statement disclosure of tax positions taken or expected to be taken on a tax return. The impact of an uncertain income tax position on the income tax return must be recognized at the largest amount that is more-likely-than-not to be sustained upon audit by the relevant taxing authority. An uncertain income tax position will not be recognized if it has less than a 50% likelihood of being sustained. During 2011 and 2010, the Company did not recognize any liability for unrecognized income tax benefits.
Loss Per Share
Basic loss per share is computed by dividing loss available to common stockholders by the weighted-average number of common shares outstanding. Diluted loss per share is computed similar to basic loss per share except that the denominator is increased to include the number of additional common shares that would have been outstanding if the potential common shares had been issued and if the additional common shares were dilutive. Common equivalent shares are excluded from the computation if their effect is anti-dilutive. The Company’s common share equivalents consist of stock options and preferred stock.
35
Table of Contents
The potential shares, which are excluded from the determination of basic and diluted net loss per share as their effect is anti-dilutive, are as follows:
| Fiscal Years
Ended December 31, |
||||||||
| 2011 | 2010 | |||||||
| Options to purchase common stock |
2,529,000 | 1,393,000 | ||||||
| Series A and B preferred stock conversion |
83,000 | 84,000 | ||||||
|
|
|
|
|
|||||
| Potential equivalent shares excluded |
2,612,000 | 1,477,000 | ||||||
|
|
|
|
|
|||||
Commitments and Contingencies
Certain conditions may exist as of the date the financial statements are issued, which may result in a loss to the Company but which will only be resolved when one or more future events occur or fail to occur. The Company’s management and its legal counsel assess such contingent liabilities, and such assessment inherently involves an exercise of judgment. In assessing loss contingencies related to legal proceedings that are pending against the Company or unasserted claims that may result in such proceedings, the Company’s legal counsel evaluates the perceived merits of any legal proceedings or unasserted claims as well as the perceived merits of the amount of relief sought or expected to be sought therein. If the assessment of a contingency indicates that it is probable that a material loss has been incurred and the amount of the liability can be estimated, then the estimated liability would be accrued in the Company’s financial statements. If the assessment indicates that a potentially material loss contingency is not probable, but is reasonably possible, or is probable but cannot be estimated, then the nature of the contingent liability, together with an estimate of the range of possible loss if determinable and material, would be disclosed.
Loss contingencies considered remote are generally not disclosed unless they involve guarantees, in which case the nature of the guarantee would be disclosed.
Estimates
The preparation of financial statements in accordance with U.S. generally accepted accounting principles requires management to make estimates and assumptions that affect the reported amounts of assets and liabilities and disclosure of contingent assets and liabilities at the date of the financial statements and the reported amounts of revenue and expenses during the reporting period. Actual results could differ from those estimates.
Concentration of Credit Risk
Financial instruments which potentially subject the Company to concentrations of credit risk consist of cash and cash equivalents and accounts receivable. The Company places its cash and cash equivalents with high credit, quality financial institutions. The Company has not experienced any losses in such accounts and believes it is not exposed to any significant credit risk on cash and cash equivalents. With respect to accounts receivable, the Company routinely assesses the financial strength of its customers and, as a consequence, believes that the receivable credit risk exposure is limited.
Recent Accounting Pronouncements
In May of 2011, the FASB issued ASU 2011-04, “Amendments to Achieve Common Fair Value Measurement and Disclosure Requirements in U. S. GAAP & IFRS,” which results in common fair value measurement and disclosure requirements in U.S. GAAP and IFRS. Consequently, the amendments change the wording used to describe many of the requirements in U.S. GAAP for measuring fair value and for disclosing information about fair value measurements. ASU 2011-04 is effective for interim and annual periods beginning after December 15, 2011. The future adoption of ASU 2011-04 is not expected to have a material impact on the Company’s consolidated financial statements.
In June 2011, the FASB issued ASU No. 2011-05, Presentation of Comprehensive Income. This standard eliminates the current option to report other comprehensive income and its components in the statement of changes in equity. The standard is intended to enhance comparability between entities that report under US GAAP and those that report under IFRS, and to provide a more consistent method of presenting non-owner transactions that affect an entity’s equity. Under the ASU, an entity can elect to present items of net income and other comprehensive income in one continuous statement, referred to as the statement of comprehensive income, or in two separate, but consecutive, statements. Each component of net income and each component of other comprehensive income, together with totals for comprehensive income and its two parts, net income and other comprehensive income, would need to be displayed under either alternative. The statement(s) would need to be presented with equal prominence as the other primary financial statements. The ASU does not change items that constitute net income and other comprehensive income, when an item of
36
Table of Contents
other comprehensive income must be reclassified to net income or the earnings-per-share computation (which will continue to be based on net income). The new US GAAP requirements are effective for public entities as of the beginning of a fiscal year that begins after December 15, 2011 and interim and annual periods thereafter. Early adoption is permitted, but full retrospective application is required under the accounting standard. The Company does not expect that the adoption of this standard will have a material impact on our results of operations, cash flows, and financial position.
In December 2011, the FASB issued ASU No. 2011-12, Deferral of Effective Date for Amendments to the Presentation of Reclassifications of Items Out of Accumulated Other Comprehensive Income in ASU 2011-05, which defers the requirement in ASU No. 2011-05 that companies present reclassification adjustments for each component of accumulated other comprehensive income. All other requirements of ASU No. 2011-05 remain unchanged.
Other recent accounting pronouncements issued by the FASB, the American Institute of Certified Public Accountants (“AICPA”) and the SEC did not or are not believed by management to have a material impact on the Company’s present condensed consolidated financial statements.
3. Inventory
Inventories, consisting of materials, labor, and manufacturing overhead, are stated at the lower of cost (first-in, first-out) or market and consist of the following at December 31:
| 2011 | 2010 | |||||||
| Raw materials |
$ | 4,431,000 | $ | 3,898,000 | ||||
| Work-in-process |
144,000 | 872,000 | ||||||
| Finished goods |
644,000 | 314,000 | ||||||
| Reserve for obsolescence |
(1,183,000 | ) | (629,000 | ) | ||||
|
|
|
|
|
|||||
| $ | 4,036,000 | $ | 4,455,000 | |||||
|
|
|
|
|
|||||
Inventory reserve charged to operations amounted to $845,000 and $232,000 during 2011 and 2010, respectively. Inventory valuation adjustments and other inventory write-offs in 2011 and 2010 amounted to $291,000 and $582,000, respectively.
4. Property and Equipment
Property and equipment consisted of the following at December 31:
| 2011 | 2010 | |||||||
| Computers and software |
$ | 618,000 | $ | 601,000 | ||||
| Machinery and equipment |
892,000 | 958,000 | ||||||
| Furniture and office equipment |
98,000 | 98,000 | ||||||
| Demonstration vehicles and buses |
774,000 | 650,000 | ||||||
| Leasehold improvements |
1,348,000 | 1,348,000 | ||||||
| Construction in progress |
39,000 | — | ||||||
|
|
|
|
|
|||||
| 3,769,000 | 3,655,000 | |||||||
| Less accumulated depreciation and amortization |
(2,841,000 | ) | (2,483,000 | ) | ||||
|
|
|
|
|
|||||
| Total |
$ | 928,000 | $ | 1,172,000 | ||||
|
|
|
|
|
|||||
Fixed assets totaling $187,000 and $0 were retired or disposed of in the years ended December 31, 2011 and 2010, respectively. Depreciation and amortization expense was $495,000 and $534,000 for the years ended December 31, 2011 and 2010, respectively, which included amortization expense of leasehold improvements of $262,000 and $268,000 for the years ended December 31, 2011 and 2010, respectively.
5. Other Accrued Liabilities
Other accrued liabilities consisted of the following at December 31:
| 2011 | 2010 | |||||||
| Accrued inventory received |
$ | 2,000 | $ | 54,000 | ||||
| Accrued professional services |
150,000 | 525,000 | ||||||
| Accrued warranty |
227,000 | 510,000 | ||||||
| Accrued litigation settlement |
— | 525,000 | ||||||
| Other |
138,000 | 125,000 | ||||||
|
|
|
|
|
|||||
| Total |
$ | 517,000 | $ | 1,739,000 | ||||
|
|
|
|
|
|||||
37
Table of Contents
Accrued warranty consisted of the following activities for the years ended December 31:
| 2011 | 2010 | |||||||
| Balance at beginning of year |
$ | 510,000 | $ | 558,000 | ||||
| Accruals for warranties issued during the period |
470,000 | 427,000 | ||||||
| Warranty claims |
(753,000 | ) | (475,000 | ) | ||||
|
|
|
|
|
|||||
| Balance at end of year |
$ | 227,000 | $ | 510,000 | ||||
|
|
|
|
|
|||||
6. Intangible Assets
Intangible assets consisted of legal fees directly associated with patent licensing. The Company has been granted three patents which were capitalized and being amortized on a straight-line basis over a period of 20 years.
Amortization expense charged to operations was $0 and $5,000 for the years ended December 31, 2011 and 2010, respectively. As of December 31, 2010, the Company performed an impairment analysis to its intangible assets and determined that the technologies covered by the Company’s patents did not have any future economic value. The Company recorded an impairment loss of $55,000 during 2010 which resulted in a zero book value as of December 31, 2010.
38
Table of Contents
7. Notes Payable
Notes payable at December 31, consisted of the following:
| 2011 | 2010 | |||||||
| Secured note payable to Credit Managers Association of California, bearing interest at prime plus 3% (6.25% as of December 31, 2011), and is adjusted annually in April through maturity. Principal and unpaid interest due in April 2016. A sinking fund escrow may be funded with 10% of future equity financing, as defined in the Agreement |
$ | 1,238,000 | $ | 1,238,000 | ||||
| Secured note payable to a Coca Cola Enterprises in the original amount of $40,000, bearing interest at 10% per annum. Principal and unpaid interest due on demand |
40,000 | 40,000 | ||||||
| Secured note payable to a financial institution in the original amount of $39,000, bearing interest at 4.99% per annum, payable in 48 equal monthly installments of principal and interest through September 1, 2011 |
— | 8,000 | ||||||
| Secured note payable to a financial institution in the original amount of $38,000, bearing interest at 8.25% per annum, payable in 60 equal monthly installments of principal and interest through February 19, 2014 |
18,000 | 25,000 | ||||||
| Secured note payable to a financial institution in the original amount of $19,000, bearing interest at 10.50% per annum, payable in 60 equal monthly installments of principal and interest through August 25, 2014 |
12,000 | 15,000 | ||||||
| Secured note payable to a financial institution in the original amount of $26,000, bearing interest at 7.91% per annum, payable in 60 equal monthly installments of principal and interest through April 9, 2015 |
18,000 | 23,000 | ||||||
| Secured note payable to a financial institution in the original amount of $25,000, bearing interest at 7.24% per annum, payable in 60 equal monthly installments of principal and interest through March 10, 2016 |
22,000 | — | ||||||
|
|
|
|
|
|||||
| 1,348,000 | 1,349,000 | |||||||
| Less current portion of notes payable |
(62,000 | ) | (63,000 | ) | ||||
|
|
|
|
|
|||||
| Notes payable, net of current portion |
$ | 1,286,000 | $ | 1,286,000 | ||||
|
|
|
|
|
|||||
As of December 31, 2011 and 2010, the balance of long term interest payable with respect to the Credit Managers Association of California note amounted to $1,209,000 and $1,132,000, respectively. Interest expense on notes payable amounted to approximately $88,000 during each of the years ended December 31, 2011 and 2010, respectively.
Future minimum principal payments of notes payable at December 31, 2011 consisted of the following:
| Year Ending December 31 |
Principal Amounts |
|||
| 2012 |
62,000 | |||
| 2013 |
24,000 | |||
| 2014 |
16,000 | |||
| 2015 |
8,000 | |||
| 2016 |
1,238,000 | |||
| Thereafter |
— | |||
|
|
|
|||
| Total |
$ | 1,348,000 | ||
|
|
|
|||
8. Revolving Credit Agreement
On June 30, 2010, the Company entered into a secured a revolving credit facility with a financial institution for $200,000 which was secured by a $200,000 certificate of deposit. The facility is for a period of 3 years and 6 months from July 1, 2010 to December 31, 2013.
The interest rate on a drawdown from the facility is the certificate of deposit rate plus 1.25% with interest payable monthly and the principal due at maturity. The financial institution also renewed the $200,000 irrevocable letter of credit for the full amount of the credit facility in favor of Sunshine Distribution LP, with respect to the lease of the Company’s corporate headquarters at 1560 West 190th Street, Torrance, California.
39
Table of Contents
9. Deferred Revenues
The Company had deferred $320,000 and $31,000 in revenue related to production and development contracts at December 31, 2011 and 2010, respectively. The Company anticipates that the December 31, 2011 deferred revenue balance will be recognized in the first half of 2012.
10. Commitments and Contingencies
Leases
In October 2007, the Company entered into a lease agreement with Sunshine Distribution LP (“Landlord”), with respect to the lease of an approximately 43,000 square foot facility located at 1560 West 190th Street, Torrance, California (the “Lease”). The lease term commenced on November 1, 2007, and expires January 1, 2013. The total base monthly rent is approximately $39,000. Under the Lease, Enova pays the Landlord certain commercially reasonable and customary common area maintenance costs of approximately $5,000 per month, increasing ratably as these costs are increased to the Landlord. The Lease is secured by an irrevocable standby letter of credit in the amount of $200,000 and naming the Landlord as the beneficiary. Enova also had an office in Hawaii rented on a month-to-month basis at $3,400 per month, which was closed in November 2011. Rent expense was approximately $611,000 and $556,000 for the years ended December 31, 2011, and 2010, respectively.
Future minimum lease payments under non-cancelable operating lease obligations at December 31, 2011 were as follows:
| Year Ending December 31 |
Operating Leases |
|||
| 2012 |
$ | 472,000 | ||
|
|
|
|||
| Total |
$ | 472,000 | ||
|
|
|
|||
11. Stockholders’ Equity
Common Stock
On December 30, 2011, the Company sold 11,250,000 shares of common stock (“Investor Shares”) at $0.15 per share for an aggregate purchase price of $1,687,500, together with warrants (the “Warrants”) to purchase up to 11,250,000 shares of common stock (“Warrant Shares”), to a total of seventeen investors. As required by the Purchase Agreement, in connection with the closing of the offering, the Company and the Investors entered into a Registration Rights Agreement, dated December 30, 2011. The Registration Rights Agreement required the Company to file with the SEC a registration statement to cover the resale of the Investor Shares and Warrant Shares, which registration statement was filed in February 2012. The Company has certain customary obligations with respect to the required registration statement. The Investors are required to provide the Company with certain information to assist in the registration of the Investor Shares and Warrant Shares. The Registration Rights Agreement contains customary indemnification and contribution provisions.
As further required by the Purchase Agreement, in connection with the closing of the offering, the Company issued to the Investors Warrants, dated December 30, 2011. The Warrants cover an aggregate of 11,250,000 shares of Enova’s Common Stock. The Warrants are subject to appropriate adjustment for stock splits, combinations, reclassifications and the like. The Warrants are exercisable for a period of five years, with earlier termination in the case of certain extraordinary transactions and earlier call by Enova as set forth below. The Warrants are exercisable at the option of the holder at an exercise price of $0.22 per share, which amount equals the volume weighted average price of the Company’s Common Stock for the twenty trading days immediately prior to December 30, 2011, the date of the closing of the sale of the Investor Shares (the “Exercise Price”). The Warrants further provide that if, for a twenty (20) consecutive trading day period, the average of the closing bid and asked prices of the Common Stock quoted in the Over-The-Counter market or the last reported sale price of the Common Stock or the closing price quoted on the NYSE Amex or any other U.S. exchange on which the Common Stock is listed, whichever is applicable (or such other reference reasonably relied upon by the Company if not so published), is greater than or equal to two times the Exercise Price with at least an average of ten thousand (10,000) shares traded per day (appropriately adjusted for stock splits, combinations, reclassifications and the like) during such period (the “Early Termination Event”), then, on the 10th calendar day following written notice from the Company notifying the Warrant holders of the Early Termination Event, any holder who has not, by such date, elected to exercise its Warrants for cash, such Warrants will be deemed automatically exercised on such 10th calendar day pursuant to the cashless/net exercise provisions under the Warrants.
40
Table of Contents
Costs related to the December 2011 equity raise were approximately $442,500. Merriman Capital, Inc. acted as the sole placement agent for the offering pursuant to the Purchase Agreement.
Series A Preferred Stock
Series A preferred stock is currently unregistered. Each share is convertible into 1/45 of a share of common stock at the election of the holder or automatically upon the occurrence of certain events including: sale of stock in an underwritten public offering; registration of the underlying conversion stock; or the merger, consolidation, or sale of more than 50% of the Company. Holders of Series A preferred stock have the same voting rights as common stockholders. The stock has a liquidation preference of $0.60 per share plus any accrued and unpaid dividends in the event of voluntary or involuntary liquidation of the Company. Dividends are non-cumulative and payable at the annual rate of $0.036 per share if, when, and as declared by, the Board of Directors. No dividends have been declared on the Series A preferred stock.
Series B Preferred Stock
Series B preferred stock is currently unregistered. Each share is convertible into 2/45 of a share of common stock at the election of the holder or automatically upon the occurrence of certain events including: sale of stock in an underwritten public offering, if the offering results in net proceeds of $10,000,000, and the per share price of common stock is at least $2.00; and the merger, consolidation, or sale of common stock or sale of substantially all of the Company’s assets in which gross proceeds received are at least $10,000,000. The Series B preferred stock has certain liquidation and dividend rights prior and in preference to the rights of the common stock and Series A preferred stock. The stock has a liquidation preference of $2.00 per share together with an amount equal to, generally, $0.14 per share compounded annually at 7% per year from the filing date, less any dividends paid. Dividends on the Series B preferred stock are non-cumulative and payable at the annual rate of $0.14 per share if, when, and as declared by, the Board of Directors. No dividends have been declared on the Series B preferred stock.
12. Stock Options
Stock Option Program Description
For the year ended December 31, 2011 the Company had two equity compensation plans, the 1996 Stock Option Plan (the “1996 Plan”) and the 2006 equity compensation plan (the “2006 Plan”). The 1996 Plan has expired for the purposes of issuing new grants. However, the 1996 Plan will continue to govern awards previously granted under that plan. The 2006 Plan has been approved by the Company’s Shareholders. Equity compensation grants are designed to reward employees and executives for their long term contributions to the Company and to provide incentives for them to remain with the Company. The number and frequency of equity compensation grants are based on competitive practices, operating results of the Company, and government regulations.
The maximum number of shares issuable over the term of the 1996 Plan was limited to 65 million shares (without giving effect to subsequent stock splits). Options granted under the 1996 Plan typically have an exercise price of 100% of the fair market value of the underlying stock on the grant date and expire no later than ten years from the grant date. The 2006 Plan has a total of 3,000,000 shares reserved for issuance, of which 1,405,000 and 104,000 were granted in 2011 and 2010, respectively.
Stock-based compensation expense related to stock options was $368,000 and $704,000 for the years ended December 31, 2011 and 2010, respectively. As of December 31, 2011, the total compensation cost related to non-vested awards not yet recognized is $336,000. The remaining period over which the future compensation cost is expected to be recognized is 25 months.
Stock-based compensation expense recognized in the Statement of Operations for the years ended December 31, 2011 and 2010 has been based on awards ultimately expected to vest. Forfeitures are estimated at the time of grant and revised, if necessary, in subsequent periods if actual forfeitures differ from those estimates. If the actual number of forfeitures differs from that estimated by management, additional adjustments to compensation expense may be required in future periods.
41
Table of Contents
The following is a summary of changes to outstanding stock options during the fiscal year ended December 31, 2011 and 2010:
| Number of Share Options |
Weighted Average Exercise Price |
Weighted Average Remaining Contractual Life |
Aggregate Intrinsic Value(1) | |||||||||||||||||
| Outstanding at December 31, 2009 |
1,410,000 | $ | 2.10 | 7.65 | $ | — | ||||||||||||||
| Granted |
104,000 | $ | 1.34 | 9.94 | $ | — | ||||||||||||||
| Exercised |
(50,000 | ) | $ | 0.41 | — | $ | 42,000 | |||||||||||||
| Forfeited or Cancelled |
(71,000 | ) | $ | 2.93 | — | $ | — | |||||||||||||
|
|
|
|
|
|
|
|
|
|||||||||||||
| Outstanding at December 31, 2010 |
1,393,000 | $ | 2.06 | 6.92 | $ | 267,000 | ||||||||||||||
| Granted |
1,405,000 | $ | 0.30 | 6.13 | $ | — | ||||||||||||||
| Exercised |
(36,000 | ) | $ | 0.63 | — | $ | — | |||||||||||||
| Forfeited or Cancelled |
(233,000 | ) | $ | 2.36 | — | $ | — | |||||||||||||
|
|
|
|
|
|
|
|
|
|||||||||||||
| Outstanding at December 31, 2011 |
2,529,000 | $ | 1.07 | 6.09 | $ | — | ||||||||||||||
|
|
|
|
|
|
|
|
|
|||||||||||||
| Exercisable at December 31, 2011 |
1,126,000 | $ | 2.01 | 6.33 | $ | — | ||||||||||||||
|
|
|
|
|
|
|
|
|
|||||||||||||
| Vested and expected to vest(2) |
2,402,000 | $ | 1.07 | 6.12 | $ | — | ||||||||||||||
|
|
|
|
|
|
|
|
|
|||||||||||||
| (1) | Aggregate intrinsic value represents the value of the closing price per share of our common stock on the last trading day of the fiscal period in excess of the exercise price multiplied by the number of options outstanding or exercisable, except for the “Exercised” line, which uses the closing price on the date exercised. |
| (2) | Number of shares includes options vested and those expected to vest net of estimated forfeitures. |
At December 31, 2011, there were 436,000 shares available for grant under the 2006 plan. The exercise prices of the options outstanding at December 31, 2011 ranged from $0.19 to $4.35. The weighted-average grant date fair value of the options granted during the years ended December 31, 2011 and 2010 was $0.23 and $1.22, respectively.
Unvested share activity for the year ended December 31, 2011 is summarized below:
| Unvested Number of Options |
Weighted-Average Grant Date Fair Value | |||||||||
| Unvested balance at December 31, 2010 |
435,000 | $ | 0.93 | |||||||
| Granted |
1,405,000 | $ | 0.23 | |||||||
| Vested |
(344,000 | ) | $ | 0.91 | ||||||
| Forfeited |
(93,000 | ) | $ | 0.91 | ||||||
|
|
|
|
|
|||||||
| Unvested balance at December 31, 2011 |
1,403,000 | $ | 0.26 | |||||||
|
|
|
|
|
|||||||
The Company settles employee stock option exercises with newly issued common shares. The table below presents information related to stock option activity for the fiscal years ended December 31, 2011 and 2010:
| Years
Ended December 31, |
||||||||
| 2011 | 2010 | |||||||
| Total intrinsic value of stock options exercised |
$ | 25,000 | $ | 42,000 | ||||
| Cash received from stock option exercises |
$ | 23,000 | $ | 20,000 | ||||
| Gross income tax benefit from the exercise of stock options |
$ | — | $ | — | ||||
Valuation and Expense Information
The fair value of stock-based awards to officers and employees is calculated using the Black-Scholes option pricing model. The Black-Scholes model requires subjective assumptions, including future stock price volatility and expected time to exercise, which greatly affect the calculated values. The expected term of options granted is calculated by using the SAB 107 “simplified method” of estimating the expected term which is derived by taking the average of the time to vesting and the full term of the option. The risk-free rate selected to value any particular grant is based on the bond equivalent yields that corresponds to the pricing term of the grant effective as of the date of the grant. The expected volatility is based on the historical volatility of the Company’s stock price. These factors could change in the future, affecting the determination of stock-based compensation expense in future periods.
42
Table of Contents
The fair values of all stock options granted during the fiscal years ended December 31, 2011 and 2010 were estimated on the date of grant using the following range of assumptions:
| Years Ended December 31, | ||||||
| 2011 | 2010 | |||||
| Expected life (in years) |
2.5- 6.5 | 5.5 | ||||
| Average risk-free interest rate |
1.63% | 2% | ||||
| Expected volatility |
|
107% - 132% |
|
143% | ||
| Expected dividend yield |
0% | 0% | ||||
| Forfeiture rate |
3% | 3% | ||||
The estimated fair value of grants of stock options to nonemployees of the Company is charged to expense, if applicable, in the financial statements. These options vest in the same manner as the employee options granted under each of the option plans as described above.
Restricted Stock
During the year ended December 31, 2010, the Company issued 25,000 restricted shares of the Company’s common stock to its employees and directors. The Company recorded compensation expense of $95,000 in 2010. There were no restricted shares issued in 2011. There are no unvested restricted stock awards granted to employees or directors as of December 31, 2011.
13. Income Taxes
Significant components of the Company’s deferred tax assets and liabilities for federal and state income taxes as of December 31, consisted of the following:
| 2011 | 2010 | |||||||
| Deferred tax assets |
||||||||
| Net operating loss carry-forwards |
$ | 25,701,000 | $ | 28,186,000 | ||||
| Stock based compensation |
772,000 | 488,000 | ||||||
| Other, net |
(743,000 | ) | (598,000 | ) | ||||
|
|
|
|
|
|||||
| 25,730,000 | 28,076,000 | |||||||
| Less valuation allowance |
(25,730,000 | ) | (28,076,000 | ) | ||||
|
|
|
|
|
|||||
| Net deferred tax assets |
$ | — | $ | — | ||||
|
|
|
|
|
|||||
The Tax Reform Act of 1986 limits the use of net operating loss carryforwards in certain situations where changed occur in the stock ownership of a company. In the event the Company has had a change in ownership, utilization of the carryforwards could be restricted.
Deferred taxes arise from temporary differences in the recognition of certain expenses for tax and financial reporting purposes. The deferred tax assets have been offset by a valuation allowance since management does not believe the recoverability of these in future years is more likely than not to occur. The valuation allowance decreased by $2,346,000 in 2011 compared to an increase of $2,809,000 in 2010. As of December 31, 2011, the Company had net operating loss carry forwards for federal and state income tax purposes of approximately $63,094,000 and $48,060,000, respectively. These operating loss carry forwards will expire in 2012 through 2031.
The provision for income taxes differs from the amount computed by applying the U.S. federal statutory tax rate (34% in 2011 and 2010) to income taxes as follows:
| December 31, 2011 |
December
31, 2010 | |||||||||
| Tax benefit computed at 34% |
$ | (2,376,000 | ) | $ | (2,523,000 | ) | ||||
| Change in valuation allowance |
(2,346,000 | ) | 2,809,000 | |||||||
| State tax (net of Federal benefit) |
(406,000 | ) | (431,000 | ) | ||||||
| Change in carryovers and tax attributes |
5,127,000 | 145,000 | ||||||||
|
|
|
|
|
|||||||
| Net tax benefit |
$ | — | $ | — | ||||||
|
|
|
|
|
|||||||
43
Table of Contents
The Company files federal income tax returns in the U.S. and in various state jurisdictions. The Company has not been audited by the Internal Revenue Service or any state for income taxes. The Company reviews its recognition threshold and measurement process for recording in the financial statements uncertain tax positions taken or expected to be taken in a tax return. The Company reviews all material tax positions for all years open to statute to determine whether it is more likely than not that the positions taken would be sustained based on the technical merits of those positions. The Company did not recognize any adjustments for uncertain tax positions as of and during the years ended December 31, 2011 and 2010.
14. Employee Benefit Plan
The Company has a 401(k) profit sharing plan covering substantially all employees. Eligible employees may elect to contribute a percentage of their annual compensation, as defined, to the plan. The Company may also elect to make discretionary contributions. For the years ended December 31, 2011 and 2010, the Company did not make any contributions to the plan.
15. Geographic Area Data
The Company operates as a single reportable segment and attributes revenues to countries based upon the location of the entity originating the sale. Revenues by geographic area are as follows:
| 2011 | 2010 | |||||||
| United States |
$ | 4,474,000 | $ | 6,752,000 | ||||
| China |
1,075,000 | 1,187,000 | ||||||
| United Kingdom |
1,070,000 | 427,000 | ||||||
| Italy |
— | 206,000 | ||||||
| Japan |
3,000 | — | ||||||
|
|
|
|
|
|||||
| Total |
$ | 6,622,000 | $ | 8,572,000 | ||||
|
|
|
|
|
|||||
16. Concentration
During the year ended December 31, 2011, the Company’s sales were concentrated with a few large customers. Sales to four customers comprised 52%, 16%, 16% and 10% of total revenues and two customers accounted for 62% and 37% of gross accounts receivable, respectively. During the year ended December 31, 2010, the Company had sales to three customers that comprised 45%, 26% and 14% of total revenues and accounted for 42%, 20% and 21% of gross accounts receivable, respectively. The Company performs ongoing credit evaluations of certain customers’ financial condition and generally requires no collateral from its customers. The Company’s inventory purchases are concentrated with certain key vendors that produce components according to our engineering specifications. During the year ended December 31, 2011, 16% of purchases were concentrated with one vendor and during the year ended December 31, 2010, 25% and 13% of purchases were concentrated with two vendors.
17. Subsequent Events
The Company has evaluated subsequent events and has determined that there were no subsequent events to recognize or disclose in these financial statements.
| ITEM 9. | CHANGES IN AND DISAGREEMENTS WITH ACCOUNTANTS ON ACCOUNTING AND FINANCIAL DISCLOSURES |
None.
ITEM 9A. CONTROLS AND PROCEDURES
Evaluation of Disclosure Controls and Procedures
As required by SEC Rule 13a-15(b) under the Securities Exchange Act of 1934, as amended (the “Exchange Act”), the Company carried out an evaluation, under the supervision and with the participation of the Company’s management, including the Company’s Chief Executive Officer and Chief Financial Officer, of the effectiveness of the design and operation of the Company’s disclosure controls and procedures (as defined in Rule 13a-15(e) under the Exchange Act) as of December 31, 2011. Based on this evaluation, the Company’s Chief Executive Officer and Chief Financial Officer concluded that the Company’s disclosure controls and procedures were effective as of December 31, 2011.
44
Table of Contents
Management’s Report on Internal Control Over Financial Reporting
Management is responsible for establishing and maintaining adequate internal control over financial reporting, as defined in Rule 13a-15(f) promulgated under the Exchange Act. We maintain internal control over financial reporting designed to provide reasonable assurance regarding the reliability of financial reporting and the preparation of financial statements for external purposes in accordance with generally accepted accounting principles.
Because of its inherent limitations, internal control over financial reporting may not prevent or detect misstatements. Also, projections of any evaluation of effectiveness to future periods are subject to the risk that controls may become inadequate because of changes in conditions, or that the degree of compliance with the policies or procedures may deteriorate.
Under the supervision and with the participation of management, including the Company’s Chief Executive Officer and Chief Financial Officer, the Company conducted an evaluation of the effectiveness of its internal control over financial reporting based on the framework in Internal Control — Integrated Framework issued by the Committee of Sponsoring Organizations of the Treadway Commission. This evaluation included an assessment of the design of the Company’s internal control over financial reporting and testing of the operational effectiveness of its internal control over financial reporting. Based on this evaluation, management has concluded that the Company’s internal control over financial reporting was effective as of December 31, 2011.
This annual report does not include an attestation report of our registered public accounting firm regarding internal control over financial reporting.
Changes in Internal Control over Financial Reporting
There have been no changes in our internal control over financial reporting during the quarter ended December 31, 2011 that have materially affected, or are reasonably likely to materially affect, our internal control over financial reporting.
None.
ITEM 10. DIRECTORS, EXECUTIVE OFFICERS AND CORPORATE GOVERNANCE
The following table sets forth certain information with respect to the current Directors and executive officers of Enova Systems Inc.:
| Name |
Age | Position | ||||
| Richard Davies (2)(3)(5) |
43 | Director | ||||
| John Micek |
59 | Chief Financial Officer, Treasurer, Secretary and Director | ||||
| John Mullins |
47 | Chief Operating Officer | ||||
| Edwin O. Riddell(1)(4)(5) |
70 | Director | ||||
| Michael Staran |
51 | Chief Executive Officer, President and Director | ||||
| John Wallace(4)(6) |
63 | Director | ||||
45
Table of Contents
| (1) | Audit Committee Chairman |
| (2) | Audit Committee Member |
| (3) | Compensation Committee Chairman |
| (4) | Compensation Committee Member |
| (5) | Nominating and Governance Committee Member |
| (6) | Nominating and Governance Committee Chairman |
Richard Davies. Mr. Davies, age 43, has served on the Board of Directors since 2008. Since 2007, he has served as Managing Director of investments for Jagen Pty Ltd. Prior to that appointment, he managed the listed equity investments of Jagen Ptd Ltd. since 2003. Between 2001 and 2003, Mr. Davies co-founded Kicap Management, a global long short equity hedge fund. Between 1998 and 2001, Mr. Davies worked for Tiger Management as an analyst of telecom and media industries. In addition to his experience as a portfolio manager and analyst, Mr. Davies between 1992 and 1996 practiced an attorney with Baker & McKenzie in Hong Kong and Melbourne, Australia and then Freehill, Hollingdale & Page in Melbourne and Sydney, Australia. Mr. Davies graduated in 1992 from Monash University in 1992 with a Bachelor of Law (Honors) and Bachelor of Economics. He also earned an MBA (Honors) from Columbia Business School.
Mr. Davies’ finance background, relationship with a key long-term significant shareholder, and his performance as a board member of our Company led the Board of Directors to conclude that he should serve as a director of the Company.
John J. Micek. Mr. Micek, age 59, was re-appointed to the Board of Directors in 2007 and was appointed as Chief Financial Officer, Treasurer and Secretary of the Company effective January 1, 2011. He previously served on the Board between April 1999 and July 2005. From 2000 to 2010, Mr. Micek was Managing Director of Silicon Prairie Partners, LP, a Palo Alto, California based family-owned venture fund. Since April 2010, Mr. Micek has been Managing Partner of Verdant Ventures, a merchant bank dedicated to sourcing and funding University and corporate lab spinouts in areas including cleantech and pharma. He also is admitted to practice law in California and his prior practice focused on financial services. Currently, Mr. Micek actively serves on the Board of Directors of Armanino Foods of Distinction, Innovaro Corporation and JAL/Universal Assurors. During the past five years, he previously served on the Board of Directors of Benda Pharmaceutical, Wherify Wireless, and ExchangeBlvd.com. Mr. Micek is a cum laude graduate of Santa Clara University, and the University of San Francisco School of Law, where he was Senior Articles Editor of the Law Review. Mr. Micek was also on the Board of Directors of Universal Warranty Corporation, a wholly owned subsidiary of GMACI, from 2000-2003.
Mr. Micek’s finance and business background, longstanding relationship with our Company, and his performance as a board member of our Company led the Board of Directors to conclude that he should serve as a director of the Company.
Edwin O. Riddell. Mr. Riddell, age 70, has served on the Board of Directors since 1995. He also served as our President and Chief Executive Officer from August 20, 2004 until his retirement effective August 28, 2007. Between 1999 and 2004, Mr. Riddell was President of CR Transportation Services, a consultant to the electric and hybrid vehicle industry. From 1992 to 1999, Mr. Riddell was Product Line Manager of the Transportation Business Unit at the Electric Power Research Institute, and from 1985 until 1992, he served with the Transportation Group, Inc. as Vice President of Engineering, working on electrically driven public transportation systems. From 1979 to 1985, Mr. Riddell was Vice President, General Manager and COO of Lift-U, Inc., a manufacturer of handicapped wheelchair lifts for the transit industry. He has also worked with Ford, Chrysler, and General Motors in the area of auto design, and as a member of senior management for a number of public transit vehicle manufacturers. Mr. Riddell served as a member of the American Public Transportation Association’s (APTA) Member Board of Governors for over 15 years, and served on APTA’s Board of Directors. Mr. Riddell was also Managing Partner of the U.S. Advanced Battery Consortium. He also serves on the Electric Drive Association Board of Directors.
Mr. Riddell’s prior service as chief executive officer of our Company, historical perspective on our Company’s business, relationships and strategy and his performance as a board member of our Company led the Board of Directors to conclude that he should serve as a director of the Company.
46
Table of Contents
Michael Staran. Mr. Staran, age 51, was appointed to the Board of Directors in 2007. He currently serves as our President and Chief Executive Officer. Mr. Staran became our Chief Executive Officer effective August 28, 2007. He previously had served as President and Chief Operating Officer since June 26, 2007 and Executive Vice President since November 17, 2006. He also acted as a consultant for Enova Systems from November 2004 through February 2005 when he was hired by us as Director of Sales and Marketing. Mr. Staran has over 25 years of experience in business development, product management, sales and marketing, and engineering. Prior to joining us in 2006, he had served since 1998 as President of Effective Solutions People LLC providing specialized consulting to the OEM supplier segment. His affiliations and work history range from companies such as Ford, General Motors and DaimlerChrysler to suppliers such as Johnson Controls Inc. and Decoma International (a division of Magna International) where he was vice president of sales and marketing for 13 years. Mr. Staran holds a Bachelor of Science degree in Mechanical Engineering with a minor in Mathematics from Lawrence Institute of Technology in Southfield Michigan. Mr. Staran has developed three patented mechanical designs within the automotive components sector.
Mr. Staran’s role as our Chief Executive Officer, his knowledge our operations, and his performance as a board member of our Company led the Board of Directors to conclude that he should serve as a director of the Company.
John R. Wallace. Mr. Wallace, age 63, was elected to the Board of Directors in 2002 and was elected Chairman of the Board of Directors on August 22, 2008. Mr. Wallace is currently a Board member for REV, Vancouver, B. C., and for ICRTec. Mr. Wallace has been a member of the Board of Directors for Xantrex Technology, Inc. based in Burnaby, B.C., Canada since 2003 and also held the position of CEO at Xantrex from November 2005 until September 2008. From 2002 to 2005, Mr. Wallace worked independently as a consultant in the alternative energy sector. Prior to working as a consultant, Mr. Wallace served in various capacities at Ford Motor Company from 1988 until his retirement in 2002. He served as Director of Ford’s Electronic Systems Research Laboratory, Research Staff, from 1988 through 1990. He then worked in Ford’s alternative fuel vehicle programs, serving first as Director of Technology Development Programs then as Director of Electric Vehicle Programs, Director of Alternative Fuel Vehicles, and finally Director of Environmental Vehicles. Prior to joining Ford Research Staff, he was president of Ford Microelectronics, Inc., in Colorado Springs. Mr. Wallace has been past Chairman of the Electric Vehicle Association of the Americas, past Executive Director and Chairman of the Board of Directors of TH!NK Nordic, past chairman of the United States Advanced Battery Consortium, and past Chairman of the California Fuel Cell Partnership. His other experience includes work as program manager with Intel Corporation. He also served as Director, Western Development Center, for Perkin-Elmer Corporation and as President of Precision Microdesign, Inc.
Mr. Wallace’s automotive and commercial vehicle industry experience, relationships in the electric and hybrid automotive industry, and his performance as a board member of our Company led the Board of Directors to conclude that he should serve as a director of the Company.
John Mullins. Mr. Mullins, age 47, joined Enova Systems on December 12, 2007 as Director of Supply Chain Management and was appointed Chief Operating Officer on October 22, 2009. He has 20 years operations related management experience, 11 based outside the United States. From September 2006 to October 2007, Mr. Mullins served as COO/VP Operations for American Racing, an automotive supply company. From September 2004 to July 2006, Mr. Mullins served as SBU global General Manager of Ingersoll-Rand’s industrial tool and pump business based in Shanghai, China. His past roles also include General Manager of TRW Automotive’s North American aftermarket business; Operations general manager-Europe for Lucas Aftermarket, based in Solihull England, and a variety of positions with Kelsey-Hayes company in engineering and program management, based in Tokyo, Japan and Detroit, Michigan.
There is no family relationship between any director, nominee, or executive officer of Enova Systems.
Board of Directors and its Committee
Audit Committee. The Board of Directors has established an Audit Committee in accordance with Section 3(a)(58)(A) of the Securities Exchange Act of 1934, as amended. The current members of this committee are Messrs. Riddell (Chair) and Davies. NYSE Amex rules permit us, as a smaller reporting company, to have only two members of the audit committee. The Board has determined that the members of the Audit Committee are “independent” under the rules of the SEC and the NYSE Amex. In addition to being independent, Mr. Davies has been determined by the Board to be an “audit committee financial expert” as defined by the SEC and the NYSE Amex. Mr. Davies’ designation by the Board as an “audit committee financial expert” is not intended to be a representation that he is an expert for any purpose as a result of such designation, nor is it intended to impose on him any duties, obligations or liability that are greater than the duties, obligations or liability imposed on him as a member of the Audit Committee and the Board in the absence of such designation.
47
Table of Contents
Compensation Committee. The Board of Directors has established a Compensation Committee. The current members of this committee are Messrs. Davies (Chair), Riddell and Wallace. The Board has determined that Messrs. Davies, Riddell and Wallace are “independent” members of the Compensation Committee under the rules of the NYSE Amex.
Nominating and Governance Committee. The Board of Directors has established a Nominating and Governance Committee. The current members of this committee are Messrs. Davies, Riddell and Wallace. There have been no material changes during the last fiscal year to the procedures by which security holders may recommend nominees to Enova’s board of directors.
Code of Ethics
Enova Systems has adopted a “Code of Ethics For Officers, Directors, and Employees” consistent with SEC’s rules requiring a Code of Ethics and the NYSE Amex rules requiring a Code of Conduct and Ethics. It applies to our Board of Directors, Chief Executive Officer, Chief Financial Officer and principal accounting officer, and employees. A copy of the Code of Ethics for Officers, Directors, and Employees may be obtained free of charge by writing to Enova Systems, Inc., 1560 West 190th Street, Torrance, California 90501, Attention: Chief Financial Officer or by accessing the “Investor Relations” section of our website (www.enovasystems.com). To the extent required by the rules of the SEC and the NYSE Amex, we will post on our website any amendments and waivers relating to our code of ethics.
Section 16(a) Beneficial Ownership Reporting Compliance
Section 16(a) of the Securities Exchange Act of 1934 requires our officers and directors and beneficial owners of greater than 10% owners of our common stock to file reports of ownership and changes in ownership with the SEC and provide copies to us. Based solely on a review of Section 16 reports and written representations from officers and directors, we believe that during the fiscal year ended December 31, 2011, our officers, directors, and greater than 10% owners timely filed all reports they were required to file under Section 16(a), except as follows: Anthony Low-Beer failed to file on a timely basis a Form 3 in connection with his acquisition of shares of Common Stock representing more than 10% of our outstanding Common Stock.
| ITEM 11. EXECUTIVE | COMPENSATION |
The table below summarizes the total compensation paid to or earned by each of the named executive officers for the fiscal years ended December 31, 2011 and 2010:
SUMMARY COMPENSATION TABLE
| Name and Principal Position |
Fiscal Year |
Salary ($) |
Bonus ($)(A) |
Options Awards ($)(B) |
Non-Equity Incentive Plan Compensation ($)(C) |
All other Compensation ($)(D) |
Total ($) |
|||||||||||||||||||||
| Michael Staran |
2011 | $ | 280,288 | $ | — | $ | 76,000 | $ | — | $ | 60,688 | $ | 416,976 | |||||||||||||||
| Chief Executive Officer |
2010 | $ | 265,000 | $ | 60,000 | $ | — | $ | 96,200 | $ | 66,931 | $ | 488,131 | |||||||||||||||
| John Micek (E) |
2011 | $ | 125,038 | $ | — | $ | 51,000 | $ | — | $ | 16,625 | $ | 192,663 | |||||||||||||||
| Chief Financial Officer |
2010 | $ | — | $ | — | $ | — | $ | — | $ | — | $ | — | |||||||||||||||
| John Mullins |
2011 | $ | 200,000 | $ | — | $ | 55,000 | $ | — | $ | 12,746 | $ | 267,746 | |||||||||||||||
| Chief Operating Officer |
2010 | $ | 200,000 | $ | 50,000 | $ | — | $ | 61,444 | $ | 8,817 | $ | 320,061 | |||||||||||||||
| (A) | For the 2010 year, Messrs. Staran and Mullins earned bonus compensation based on the Board of Directors March 22, 2010 establishment of executive compensation where the amount of discretionary bonus paid was influenced on several discretionary factors, including, but not limited to gross margin and cash flow targets, amongst other discretionary factors as of December 31, 2010. |
| (B) | The valuation of option awards issued to employees are calculated in accordance with SEC rules as the grant date fair value in accordance with FASB ASC 718 consistent with the assumptions set forth in Note 12 to the financial statements in this Annual Report on Form 10-K. |
| (C) | For the 2010 year, Messrs. Staran and Mullins earned compensation based on the Board of Directors March 22, 2010 establishment of executive compensation where the amount of compensation paid was dependent on achieving a gross margin and cash balance target for the year ended December 31, 2010. Mr. Staran earned $80,000 and $16,000 and Mr. Mullins earned $50,000 and $11,000 for achieving certain cash and gross margin targets, respectively. |
48
Table of Contents
| (D) | For Mr. Staran, the amount shown attributable to 2011 includes (i) $37,036 for lease of apartment and related insurance; (ii) $8,201 for auto allowance; (iii) $216 value of life insurance premiums paid; and (iv) $11,610 in medical insurance premiums. In 2010, the amount shown attributable for Mr. Staran includes (i) $36,406 for lease of apartment and related insurance; (ii) $10,147 for auto allowance and insurance; (iii) $216 value of life insurance premiums paid; and (iv) $16,183 in medical insurance premiums. For Mr. Micek, the amount shown attributable to 2011 includes (i) $216 value of life insurance premiums paid; (ii) $4,408 in medical insurance premiums paid; and (iii) $12,000 in office rent. For Mr. Mullins, the amount shown attributable to 2011 includes (i) $7,504 in medical insurance premiums; (ii) $216 value of life insurance premiums; and iii) $2,968 for auto allowance. In 2010, the amount shown attributable for Mr. Mullins includes (i) $7,504 in medical insurance premiums and (ii) $216 value of life insurance premiums. |
| (E) | Effective January 1, 2011, Mr. Micek became the Chief Financial Officer and Corporate Secretary of Enova. As he was not employed by Enova in 2010, no compensation is reflected in the Summary Compensation table above. |
Employment Arrangements
Effective February 11, 2008, we entered into an employment agreement with Michael Staran, the President and Chief Executive Officer of Enova, to provide him an annual salary of $250,000 beginning as of January 1, 2008 and 12 months severance pay. On October 29, 2008, Mr. Staran was granted 12,000 shares of Enova’s common stock. Pursuant to the February 11, 2008 employment agreement, we leased a car for Mr. Staran’s use and pay for related expenses. Mr. Staran also is entitled to reimbursement for an apartment at the rate of $3,057 per month. The employment agreement further provides for life, medical and disability benefits and 15 days of annual accrued vacation. The Board of Directors approved a subsequent increase to Mr. Staran’s annual salary to $265,000 effective from January 1, 2010. In addition, Mr. Staran elected to cash out a portion of his accrued vacation pay in 2011 resulting in total salary of approximately $280,000 in fiscal year 2011.
On February 17, 2009, the Board of Directors of Enova amended the employment agreement of Mr. Staran to increase the severance payment period under his agreement from 12 months to 18 months. In addition, if severance payments are triggered, Enova will reimburse Mr. Staran up to $20,000 for relocation expenses. Except for the foregoing amendments, all terms and conditions of the employment agreement between Enova and Mr. Staran dated February 11, 2008 remain unchanged and in full force and effect.
As previously disclosed on a Form 8-K, effective December 7, 2010 and for the fiscal year ending December 31, 2011, the Board of Directors approved a cash bonus arrangement for Messrs. Staran, Mullins and Micek comprised of three separate components which are performance-based, and a bonus arrangement providing for certain payments to Messrs. Staran, Mullins and Micek in the event of an extraordinary transaction the result of which is a change in control of registrant.
The performance based components required the achievement of gross margin percentage, gross margin dollar amount and operating cash flow targets. As the performance based goals for the fiscal year ending December 31, 2011 were not achieved, the bonuses were not paid. A discretionary bonus may also be determined by the Compensation Committee in its sole discretion. There were no discretionary bonuses paid for the fiscal year ending December 31, 2011. In addition, as there was no extraordinary transaction changing control of the Company during the year, the bonuses were not paid.
Equity Awards
The following table presents information regarding outstanding equity awards held by the executive officers named in the Summary Compensation Table at December 31, 2011.
49
Table of Contents
Outstanding Equity Awards at Fiscal Year-Ended December 31, 2011
| Option Awards | ||||||||||||||||
| Name |
Number of Securities Underlying Unexercised Options (#) Exercisable |
Number of Securities Underlying Unexercised Options (#) Unexercisable |
Option Exercise Price |
Option Expiration Date |
||||||||||||
| Michael Staran |
— | 300,000(A) | $ | 0.19 | 12/18/2014 | |||||||||||
| 12,500 | 37,500(B) | $ | 0.86 | 5/12/2021 | ||||||||||||
| 75,000 | 25,000(C) | $ | 1.26 | 12/18/2019 | ||||||||||||
| 66,667 | 33,333(D) | $ | 0.80 | 4/13/2014 | ||||||||||||
| 100,000 | —(E) | $ | 3.81 | 3/23/2018 | ||||||||||||
| 23,000 | — | $ | 4.35 | 9/21/2015 | ||||||||||||
| John Micek |
— | 250,000(A) | $ | 0.19 | 12/18/2014 | |||||||||||
| 6,250 | 18,750(B) | $ | 0.86 | 5/12/2021 | ||||||||||||
| 34,500 | — (H) | $ | 1.17 | 12/8/2019 | ||||||||||||
| John Mullins |
— | 200,000(A) | $ | 0.19 | 12/18/2014 | |||||||||||
| 10,000 | 30,000(B) | $ | 0.86 | 5/12/2021 | ||||||||||||
| 37,500 | 12,500(C) | $ | 1.26 | 12/18/2019 | ||||||||||||
| 30,000 | —(E) | $ | 3.81 | 3/23/2018 | ||||||||||||
| 27,500 | 2,500(F) | $ | 0.80 | 4/13/2019 | ||||||||||||
| 30,000 | —(G) | $ | 0.21 | 3/11/2019 | ||||||||||||
| (A) | The options were granted on December 19, 2011 and will vest only in the event that: (a) the Company is sold during the term of the option (the “Term”) for a price that results in proceeds to the Company’s shareholders for each outstanding share of common stock equal to or greater in value than at least twice the exercise price; or (b) during any ten day trading period during the Term when the Company’s common stock have a Volume Weighted Average Price for such ten day trading period equal to or greater than twice the exercise price based on the average of the closing bid and asked prices of the Company’s common stock on the NYSE Amex Exchange or any other U.S. exchange on which our common stock is then listed. |
| (B) | The options were granted on May 13, 2011 and vest over three years on a quarterly basis on the last day of each calendar quarter provided the option holder is then an officer of Enova as of such date. The first 1/12 or 8.33% of the shares under each option vested on June 30, 2011. In the event there is a change of control of Enova, the options will become fully vested. |
| (C) | The options were granted on December 18, 2009 and vest over three years on a quarterly basis on the last day of each calendar quarter provided the option holder is then an officer of Enova as of such date. The first 1/12 or 8.33% of the shares under each option vested on January 1, 2010. In the event there is a change of control of Enova, the options will become fully vested. |
| (D) | The options were granted on April 14, 2009 and vest over three years on an annual basis on the anniversary of the grant date provided the option holder is then an officer of Enova as of such date. The first 1/3 or 33.33% of the shares under each option vested on April 14, 2010. In the event there is a change of control of Enova, the options will become fully vested. |
| (E) | The options were granted on March 24, 2008 and vested over three years on an annual basis on December 31st of each year, provided the option holder is then an officer of Enova as of such date. |
| (F) | The options were granted on April 14, 2009 and vest over three years on a quarterly basis on the last day of each calendar quarter provided the option holder is then an officer of Enova as of such date. The first 1/12 or 8.33% of the shares under each option vested on June 30, 2009. In the event there is a change of control of Enova, the options will become fully vested. |
| (G) | The options were granted on March 12, 2009 and vest over two years on a quarterly basis on the last day of each calendar quarter provided the option holder is then an officer of Enova as of such date. |
| (H) | The options were granted on December 8, 2009 and vested over one year on a quarterly basis on the last day of each calendar quarter provided the option holder is then an officer of Enova as of such date. |
50
Table of Contents
Current Equity Incentive Plans
We presently have only one active stock-based compensation plan. The 2006 Equity Compensation Plan authorizes the Compensation Committee to grant stock options and other stock awards to employees and consultants, including executives and directors, and such grants are currently approved by the whole board of directors. The determination of whether option grants are appropriate each year is based upon individual measures established for each individual within the subjective determination of the board of directors. Options are not necessarily granted to each executive during each year. Options granted to executive officers generally vest in conjunction with the attainment of the performance goals of the Company. In 2011, Messrs. Staran, Micek and Mullins were granted stock options from the plan covering an aggregate of 865,000 shares of our common stock.
Change of Control and Retirement Arrangements
The terms of the February 11, 2008 employment agreement, as modified on February 17, 2009, with Michael Staran, our Chief Executive Officer, provides that in the event Mr. Staran’s employment is terminated by us without cause, he is entitled to receive as severance (i) three months of health benefits, (ii) his contingent bonus, (iii) 18 months payment of his current base salary on a monthly basis and (iv) a relocation allowance of $20,000. If his duties or responsibilities are materially diminished or if he is assigned duties that are demeaning or otherwise materially inconsistent with the duties then currently performed by him, Mr. Staran will have the right to receive the same severance payment as if his employment had been terminated without cause.
On August 31, 2009, we entered into a severance agreement with John Mullins, the Chief Operating Officer of Enova. Mr. Mullins agreement provides a 12 month severance provision. In the event that Mr. Mullins’ employment is terminated by Enova without cause, he is entitled to receive as severance three months of health benefits and 12 months payment of his current base salary, to be paid on a monthly basis. If Mr. Mullins’ duties or responsibilities are materially diminished or he is assigned duties that are demeaning or otherwise materially inconsistent with the duties then currently performed, he will have the right to terminate his agreement and receive the same severance payment as if his employment had been terminated without cause.
Director Compensation
The table below summarizes the total compensation we paid to our Directors (other than Mr. Staran) for the fiscal year ended December 31, 2011:
| Non-Executive Director Name |
Fees Earned or Paid in Cash ($) |
Option Awards ($) |
Total ($) |
|||||||||
| Richard Davies(A) |
— | — | — | |||||||||
| John Micek(D) |
$ | 25,000 | — | $ | 25,000 | |||||||
| Edwin Riddell(C)(D) |
$ | 35,000 | $ | 37,000 | $ | 62,000 | ||||||
| Roy Roberts(B)(C)(D) |
$ | 37,500 | $ | 37,000 | $ | 74,500 | ||||||
| John Wallace(C)(D) |
$ | 33,750 | $ | 37,000 | $ | 70,750 | ||||||
| (A) | Mr. Davies elected not to receive compensation for his services in the year ended December 31, 2011. Mr. Davies did not receive anything in return for not receiving compensation in the year ended December 31, 2011. |
| (B) | Mr. Roberts resigned as a director effective January 20, 2012. |
| (C) | In 2011, Messrs. Riddell, Roberts and Wallace received equity options with a grant date fair value of $37,000 for each director that vested over one year on a quarterly basis on the last date of each calendar quarter. The options became fully vested on December 31, 2011. |
| (D) | For 2008, 2009 and 2010, Mr. Micek was entitled to cash compensation in an aggregate amount of $25,000 for his services as chairman of the audit committee and Mr. Roberts was entitled to cash compensation in an aggregate amount of $12,500 for his services on the audit committee. All such compensation was paid to such directors in 2011. In 2009 and 2010, Mr. Wallace was entitled to cash compensation in an aggregate amount of $8,750 for his services on the audit committee, which compensation was paid in 2011. In 2010, Mr. Riddell was entitled to cash compensation of $5,000 for services as chairman of the audit committee, which compensation was paid in 2011. |
51
Table of Contents
The provisions of the Board compensation, effective as of July 1, 2008, provides that each Director receive quarterly compensation at a flat rate of $5,000 in cash and $7,500 in stock valued at the closing prices of our common stock on the last day of the quarter in which the meeting was held. Starting in 2009, in lieu of stock for compensation, the Directors received equity options in the Company. In 2011, Messrs. Riddell, Roberts and Wallace each were granted options to purchase 34,500 shares of our common stock pursuant to the 2006 Equity Compensation Plan, which options had a grant date fair value of $37,000. The options vested over one year on a quarterly basis on the last date of each calendar quarter. The Company measures and recognizes compensation expense for all share-based payment awards made to employees and directors, including employee stock options based on the estimated fair values at the date of grant. The compensation expense is recognized over the requisite service period. The Company’s determination of estimated fair value of share-based awards utilizes the Black-Scholes option-pricing model.
In addition, members of the Board who serve on our audit committee are provided additional compensation of $2,500 per quarter for the chairman of the audit committee and $1,250 per quarter for other members of the audit committee. All Directors are also reimbursed for out-of-pocket expenses incurred in connection with attending Board and committee meetings.
| ITEM 12. | SECURITY OWNERSHIP OF CERTAIN BENEFICIAL OWNERS AND MANAGEMENT AND RELATED STOCKHOLDER MATTERS |
The table below sets forth information as to (a) any person, including their address, known to us to own beneficially more than 5% of our voting securities, (b) equity securities beneficially owned by each of our named executive officers and directors; and (c) equity securities beneficially owned by the current executive officers and directors as a group. Beneficial ownership is determined in accordance with the SEC’s Regulation 13D-G. Accordingly, the information below reflects stock options, warrants, and other securities beneficially held by the specified person that may be exercised or converted into common stock within 60 days of March 1, 2012. Except as indicated in the footnotes to this table and subject to applicable community property laws, the persons named in the table to our knowledge have sole voting and investment power with respect to all shares of securities shown as beneficially owned by them. The information in this table is as of March 1, 2012 based upon an aggregate of 42,848,211 voting shares from (i) 42,765,223 shares of common stock outstanding and (ii) potential conversion of Series A Preferred Stock and Series B Preferred Stock into 82,988 shares of common stock.
52
Table of Contents
| Owner |
Number of Shares of Common Stock |
Percent of
Common Stock |
Percent of Common Stock, Series A and Series B Preferred Stock, and Common Stock Voting Together | |||||||
| Jagen, Pty., Ltd.(1) |
3,222,222 | 7.5% | 7.5% | |||||||
| 9 Oxford Street, South Ybarra 3141 Melbourne, Victoria Australia |
||||||||||
| Shell Asset Management BV(2) |
6,054,960 | 14.2% | 14.1% | |||||||
| Sir Winston Churchillaan 366H, 2285 SJ Rijswijk ZH, The Netherlands |
||||||||||
| GAM Holdings AG(3) |
2,121,115 | 5.0% | 5.0% | |||||||
| Klaustrasse 10, 8008 Zurich, Switzerland |
||||||||||
| Special Situation Fund, L.P.(4) |
4,068,594 | 9.5% | 9.5% | |||||||
| 527 Madison Avenue, Suite 2600, New York, NY 10022 |
||||||||||
| Low Beer Managed Accounts(5) |
11,324,644 | 26.5% | 26.4% | |||||||
| Scarsdale Securities LLC, 10 Rockefeller Center, New York, NY 10020 |
||||||||||
| Michael Staran(6) |
718,500 | 1.7% | 1.7% | |||||||
| John Mullins(7) |
345,000 | * | * | |||||||
| Richard Davies(1) |
3,222,222 | 7.5% | 7.5% | |||||||
| John J. Micek(8) |
476,741 | 1.1% | 1.1% | |||||||
| Roy S. Roberts(9) |
120,245 | * | * | |||||||
| John R. Wallace(9) |
140,938 | * | * | |||||||
| Edwin O. Riddell(10) |
178,667 | * | * | |||||||
| All Executive Officers and Directors as a group (11) |
5,202,313 | 12.2% | 12.1% | |||||||
| (1) | Jagen Pty. Ltd. (Jagen) shares beneficial ownership with Jagen’s controlling shareholder, the B. Liberman Family Trust and its trustee, Jagen Nominees, Pty. Ltd. Mr. Davies is Managing Director for Jagen. Boris and Helen Liberman possess ultimate voting and discretionary authority over the shares. |
| (2) | Based on a Form 3 filed December 15, 2009. Shell Asset Management Company BV manages assets of The Shell Group and its subsidiaries and affiliates, including certain pension plans organized for the benefit of employees of The Shell Group. As such, The Shell Group and such subsidiaries and affiliates, including such pension plans, have the right to the receipt of dividends from, and the proceeds from the sale of, the shares of common stock. |
| (3) | Based upon a Holding(s) in Company on Schedule 13G filed on February 10, 2011 and Investec Bank (UK) Limited. |
| (4) | Based on a Form 4 filed January 27, 2012. MGP Advisors Limited (“MGP”) is the general partner of the Special Situations Fund III, QP, L.P. AWM Investment Company, Inc. (“AWM”) is the general partner of MGP and the general partner of and investment adviser to the Special Situations Cayman Fund, L.P. Austin W. Marxe and David M. Greenhouse are the principal owners of MGP and AWM. Through their control of MGP and AWM, Messrs. Marxe and Greenhouse share voting and investment power over the portfolio securities of each of the funds listed above. |
| (5) | Based on a Holding(s) in Company as filed in Form 4 on March 23, 2012. |
| (6) | Includes 623,000 shares of common stock underlying stock options that are exercisable within 60 days. |
| (7) | Includes 345,000 shares of common stock underlying stock options that are exercisable within 60 days. |
| (8) | Includes 292,833 shares of common stock underlying stock options that are exercisable within 60 days. |
| (9) | Includes 69,000 shares of common stock underlying stock options that are exercisable within 60 days. |
| (10) | Includes 99,000 shares of common stock underlying stock options that are exercisable within 60 days. |
| (11) | Includes 1,497,833 shares of common stock underlying stock options that are exercisable within 60 days. |
53
Table of Contents
Equity Compensation Plan Information
For the fiscal year ended December 31, 2011, we had two equity compensation plans: the 1996 Option Plan and the 2006 Equity Compensation Plan. Each plan was adopted with the approval of our shareholders. The 1996 Stock Option Plan has expired for purposes of issuing new grants. The 1996 Stock Option Plan, however, will continue to govern awards previously granted under that plan. The 2006 plan, adopted at our annual meeting in November 2006, has a total of 3,000,000 shares reserved for issuance. The following table provides information regarding our equity compensation plans as of December 31, 2011:
| Plan Category |
Number of Securities
to be Issued upon Exercise of Outstanding Options, Warrants and Rights (a) |
Weighted-Average Exercise Price of Outstanding Options, Warrants and Rights (b) |
Number of
Securities Remaining Available for Future Issuance Under Equity Compensation Plans (Excluding Securities Reflected in Column (a)) (c) | ||||||||||||
| Equity compensation plans approved by security holders |
2,529,000 | $ | 1.07 | 436,000 | |||||||||||
| Equity compensation plans not approved by security holders |
— | — | — | ||||||||||||
|
|
|
|
|
|
|
||||||||||
| Total |
2,529,000 | $ | 1.07 | 436,000 | |||||||||||
|
|
|
|
|
|
|
||||||||||
| ITEM 13. CERTAIN | RELATIONSHIPS AND RELATED TRANSACTIONS, AND DIRECTOR INDEPENDENCE |
Currently the Company does not have written policies and procedures for the review, approval or ratification of related person transactions. However, given the Company’s small size, senior management and the audit committee or the board of directors is able to review all transactions consistent with applicable securities rules governing Company transactions and proposed transactions exceeding $120,000 in which a related person has a direct or indirect material interest. Currently the Board of Directors reviews related person transactions and has approval authority with respect to whether a related person transaction is within the Company’s best interest.
Each of Messrs. Davies, Riddell and Wallace, who represent more than 50% of our directors, are “independent” within the meaning of the NYSE Amex rules as applicable to smaller reporting companies.
| ITEM 14. PRINCIPAL | ACCOUNTANT FEES AND SERVICES |
PMB Helin Donovan LLP served as our registered independent auditor for the most recently completed fiscal year, and has served in that role since its appointment by the Audit Committee on January 31, 2007.
Pre-Approval of Audit and Permissible Non-Audit Services
The Audit Committee pre-approves all audit and permissible non-audit services provided by the independent auditors. These services may include audit services, audit-related services, tax services and other services. The independent auditors and management are required to periodically report to the Audit Committee regarding the extent of services provided by the independent auditors in accordance with this pre-approval, and the fees for the services performed to date. The Audit Committee may also pre-approve particular services on a case-by-case basis.
Audit Fees
The following table sets forth the aggregate fees billed or to be billed by our principal accountant for the following services for the years ended December 31, 2011 and 2010:
| 2011 | 2010 | |||||||
| Audit Fees |
$ | 180,000 | $ | 200,000 | ||||
| Audit-Related Fees |
$ | — | $ | — | ||||
| Tax Fees |
$ | 14,000 | $ | 14,000 | ||||
| All Other Fees |
$ | 30,000 | $ | 14,000 | ||||
|
|
|
|
|
|||||
| Total |
$ | 224,000 | $ | 228,000 | ||||
|
|
|
|
|
|||||
The tax fees above were pre-approved by our Audit Committee as appropriate, which concluded that the provision of such services by PMB Helin Donovan was compatible with the maintenance of that firm’s independence in the conduct of its auditing functions.
54
Table of Contents
ITEM 15. EXHIBITS AND FINANCIAL STATEMENT SCHEDULES
(a) 1. Financial Statements
The financial statements filed as a part of this report are included in Item 8 of this report.
(a) 2. Financial Statement Schedule
No financial statement schedules are filed as a part of this report.
(a) 3. Exhibits
| Exhibit # |
Description | |
| 3.1 |
Our Amended and Restated Articles of Incorporation (incorporated by reference to Exhibit 3.1 of our Annual Report on Form 10-K for the fiscal year ending December 31, 2006, as filed on April 2, 2007) | |
| 3.2 |
Our Amended and Restated bylaws (incorporated by reference to Exhibit 3.2 of our Quarterly Report on Form 10-Q for the period ended September 30, 2009, as filed on November 12, 2009) | |
| 10.1 |
Form of Indemnification Agreement (incorporated by reference to Exhibit 10.26 of our Quarterly Report on Form 10-Q for the period ended June 30, 2005, as filed on August 15, 2005) | |
| 10.2 |
Form of Security Agreement entered into May 31, 1995 between us and Credit Managers Association of California, Trustee (incorporated by reference to Exhibit 10.65 of our Quarterly Report on Form 10-Q for the period ended April 30, 1996, as filed on June 14, 1996) | |
| 10.3 |
Commercial Promissory Note dated October 10, 2007 between us and Union Bank of California (incorporated by reference to Exhibit 10.3 of our Annual Report Form 10-K for the period ended December 31 2007, as filed on March 26, 2008) | |
| 10.4 |
Placing Agreement in connection with an application to join AIM dated July 19, 2005 between us and Investec Bank (UK) Limited (incorporated by reference to Exhibit 10.28 of our amended Quarterly Report on Form 10-Q for the period ended September 30, 2005, as filed November 21, 2005) | |
| 10.5 |
Placing Agreement dated July 25, 2007 between us and Investec Bank (UK) Limited (incorporated by reference to Exhibit 10 of our Current Report on Form 8-K as amended filed August 7, 2007) | |
| 10.6 |
Facility Lease Agreement entered into October 17, 2007 between us and Sunshine Distribution L.P., (incorporated by reference to Exhibit 10.1 of our Current Report on Form 8-K filed October 23, 2007) | |
| 10.7 |
Retirement Agreement and Limited Release entered into July 12, 2007 between us and Edwin Riddell, formerly our Chief Executive Officer and President (incorporated by reference to Exhibit 10 of our Current Report on Form 8-K as amended filed July 16, 2007)+ | |
| 10.8 |
Employment Agreement entered into February 11, 2008 between us and Michael Staran, our President and Chief Executive Officer (incorporated by reference to Exhibit 10.1 of our Current Report on Form 8-K filed February 15, 2008)+ | |
| 10.9 |
Placing Agreement entered into March 26, 2008 (incorporated by reference to Exhibit 10 of our Current Report on Form 8-K/A filed April 4, 2008) | |
| 10.10 |
Securities Purchase Agreement entered into April 23, 2008 (incorporated by reference to Exhibit 10.1 of our Current Report on Form 8-K filed April 24, 2008) | |
| 10.11 |
Registration Rights Agreement entered into April 23, 2008 (incorporated by reference to Exhibit 10.2 of our Current Report on Form 8-K filed April 24, 2008) | |
| 10.12 |
Supply Agreement with Navistar, Inc. entered into May 16, 2008 (incorporated by reference to Exhibit 10.4 of our Quarterly Report on Form 10-Q for the three month period ending July 30, 2008, as filed on August 14, 2008) # | |
| 10.13 |
Stock Purchase Agreement entered into April 6, 2009 (incorporated by reference to Exhibit 99.1 of our Current Report on Form 8-K filed April 6, 2009) | |
| 10.14 |
Joint Venture Dissolution and Termination Agreement entered into April 6, 2009 (incorporated by reference to Exhibit 99.2 of our Current Report on Form 8-K filed April 6, 2009) | |
55
Table of Contents
| 10.15 |
Securities Purchase Agreement entered into October 29, 2009 (incorporated by reference to Exhibit 99.1 of our Current Report on Form 8-K filed October 30, 2009) | |
| 10.16 |
Placing Agreement entered into October 29, 2009 (incorporated by reference to Exhibit 99.3 of our Current Report on Form 8-K filed October 30, 2009) | |
| 10.17 |
Registration Rights Agreement entered into December 15, 2009 (incorporated by reference to Exhibit 99.1 of our Current Report on Form 8-K filed December 15, 2009) | |
| 10.18 |
Amendment to Employment Agreement between us and Michael Staran entered into on February 17, 2009 (incorporated by reference to Item 5.02 of our Current Report on Form 8-K filed February 23, 2009)+ | |
| 10.19 |
Bonus Arrangement between us and Mike Staran, John Mullins, and John Micek (incorporated by referenced to item 5.02 on Form 8-K filed December 13, 2010)+ | |
| 10.20 |
Separation Agreement and General Release between us and Jarett Fenton effective as of December 10, 2010 (incorporated by reference on our annual report on Form 10-K for the year ended December 31, 2010 filed on March 30, 2011)+ | |
| 10.21 |
Severance Agreement between us and John Mullins effective as of August 31, 2009 (incorporated by reference on our annual report on Form 10-K for the year ended December 31, 2010 filed on March 30, 2011)+ | |
| 10.22 |
Bonus Arrangement between us and Mike Staran, John Mullins and John Micek (incorporated by reference to item 5.02 on Form 8-K filed December 10, 2010) | |
| 10.23 |
Agreement relating to the appointment of a Nominated Adviser and Broker dated June 20, 2011 between us and Daniel Stewart (UK) Plc, filed with this Form 10-K on March 29, 2012* | |
| 10.24 |
Warrant and Common Stock Purchase Agreement dated December 15, 2011 (incorporated by reference to Exhibit 99.1 of our Current Report on Form 8-K filed December 19, 2011). | |
| 10.25 |
Form of Warrant (incorporated by reference to Exhibit 99.2 of our Current Report on Form 8-K filed December 19, 2011) | |
| 10.26 |
Form of Registration Rights Agreement dated December 2011 (incorporated by reference to Exhibit 99.3 of our Current Report on Form 8-K filed December 19, 2011) | |
| 23.1 |
Consent of PMB Helin Donovan* | |
| 31.1 |
Certification of Chief Executive Officer Pursuant to Section 302 of the Sarbanes-Oxley Act of 2002* | |
| 31.2 |
Certification of Chief Financial Officer Pursuant to Section 302 of the Sarbanes-Oxley Act of 2002* | |
| 32 |
Certification Pursuant to 18 U.S.C. Section 1350* | |
| 101.XML |
XBRL Instance Document** | |
| 101.XSD |
XBRL Taxonomy Extension Schema Document** | |
| 101.CAL |
XBRL Taxonomy Extension Calculation Linkbase Document** | |
| 101.DEF |
XBRL Taxonomy Extension Definition Linkbase Document** | |
| 101.LAB |
XBRL Taxonomy Extension Label Linkbase Document** | |
| 101.PRE |
XBRL Taxonomy Extension Presentation Linkbase Document** | |
| * | Filed herewith. |
| ** | In accordance with Regulation S-T, the XBRL-related information in Exhibit 101 to this Annual Report on Form 10-K shall be deemed to be “furnished” and not “filed”. |
| + | Management contract or compensatory plan or arrangement. |
| # | Portions of the exhibit have been omitted pursuant to a request for confidential treatment submitted to the Securities and Exchange Commission. |
56
Table of Contents
SIGNATURES
Pursuant to the requirements of Section 13 or 15(d) of the Securities Exchange Act of 1934, the registrant has duly caused this report to be signed on its behalf by the undersigned, thereunto duly authorized.
| ENOVA SYSTEMS, INC. | ||||||
| By: |
/s/ Michael Staran |
|||||
| Michael Staran, |
||||||
| Chief Executive Officer & President |
||||||
Dated: March 29, 2012
POWER OF ATTORNEY
KNOW ALL MEN BY THESE PRESENTS, that each person whose signature appears below constitutes and appoints Michael Staran, with full power to act alone, his true and lawful attorney-in-fact and agent, with full power of substitution for him and in his name, place and stead, in any and all capacities, to sign any and all amendments to the annual report on Form 10-K, and to file the same, with all exhibits thereto, and other documents in connection therewith, with the Securities and Exchange Commission, granting unto said attorney-in-fact full power and authority to do and perform each and every act and thing requisite and necessary to be done in connection as fully to all intents and purposes as he might or could do in person, hereby ratifying and confirming all that said attorney-in-fact and agent may lawfully do or cause to be done by virtue hereof.
IN WITNESS WHEREOF, each of the undersigned has executed this Power of Attorney as of the date indicated. Pursuant to the requirements of the Securities Exchange Act of 1934, this report has been signed by the following persons on behalf of the registrant and in the capacities and on the date indicated.
| Signature |
Title |
Date | ||
| /s/ Michael Staran Michael Staran |
Chief Executive Officer, President, and Director (Principal Executive Officer) |
March 29, 2012 | ||
| /s/ John Micek John Micek |
Chief Financial Officer and Director (Principal Financial Officer and Principal Accounting Officer) |
March 29, 2012 | ||
| /s/ John R. Wallace John R. Wallace |
Director, Chairman of the Board | March 29, 2012 | ||
| /s/ Richard Davies Richard Davies |
Director | March 29, 2012 | ||
| /s/ Edwin Riddell Edwin Riddell |
Director | March 29, 2012 | ||
57